 |
| |
| |
| |
| |
| |
| |
|

| TissGeneSummary for NRIP3 |
 Gene summary Gene summary |
| Basic gene information | Gene symbol | NRIP3 |
| Gene name | nuclear receptor interacting protein 3 | |
| Synonyms | C11orf14|NY-SAR-105 | |
| Cytomap | UCSC genome browser: 11p15.3 | |
| Type of gene | protein-coding | |
| RefGenes | NM_020645.2, | |
| Description | nuclear receptor-interacting protein 3sarcoma antigen NY-SAR-105 | |
| Modification date | 20141207 | |
| dbXrefs | MIM : 613125 | |
| HGNC : HGNC | ||
| Ensembl : ENSG00000175352 | ||
| HPRD : 14840 | ||
| Vega : OTTHUMG00000165680 | ||
| Protein | UniProt: go to UniProt's Cross Reference DB Table | |
| Expression | CleanEX: HS_NRIP3 | |
| BioGPS: 56675 | ||
| Pathway | NCI Pathway Interaction Database: NRIP3 | |
| KEGG: NRIP3 | ||
| REACTOME: NRIP3 | ||
| Pathway Commons: NRIP3 | ||
| Context | iHOP: NRIP3 | |
| ligand binding site mutation search in PubMed: NRIP3 | ||
| UCL Cancer Institute: NRIP3 | ||
| Assigned class in TissGDB* | C | |
| Included tissue-specific gene expression resources | TiGER,GTEx | |
| Specific-tissues in normal samples (assigned by TissGDB using HPA, TiGER, and GTEx) | Testis | |
| Cancer types related to the specific-tissues in cancer samples (assigned by TissGDB using TCGA) | TGCT | |
| Reference showing the relevant tissue of NRIP3 | ||
| Description by TissGene annotations | ||
| * Class A consists of genes with literature evidence and is part of the cTissGenes. Class B consists of only cTissGenes without additional evidence. The remaining genes belong to Class C. |
| Gene ontology having evidence of Inferred from Direct Assay (IDA) from Entrez |
| GO ID | GO term | PubMed ID |
| Top |
| TissGeneExp for NRIP3 |
| Gene expressions across 28 cancer types (X-axis: cancer type and Y-axis: log2(norm_counts+1)) (TCGA IlluminaHiSeq_RNASeqV2, pan-cancer normalized log2(norm_counts+1) data, version 2016-08-16) |
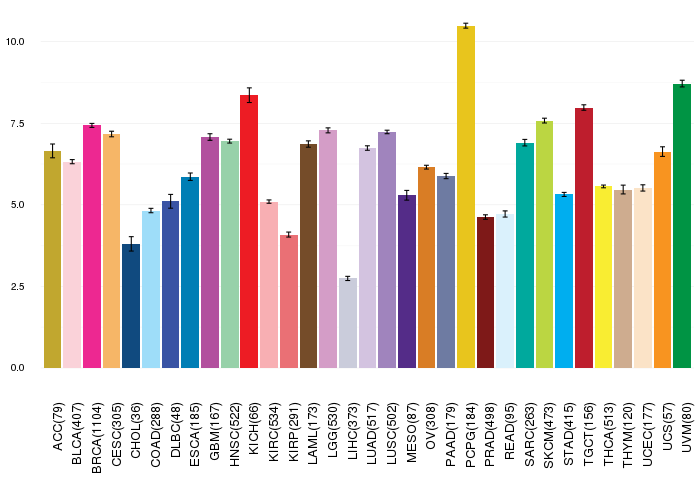 |
| Gene isoform expressions across 28 cancer types (X-axis: cancer type and Y-axis: log2(norm_counts+1)) (TCGA pan-cancer tcga_rsem_isoform_tpm, version 2016-09-01) |
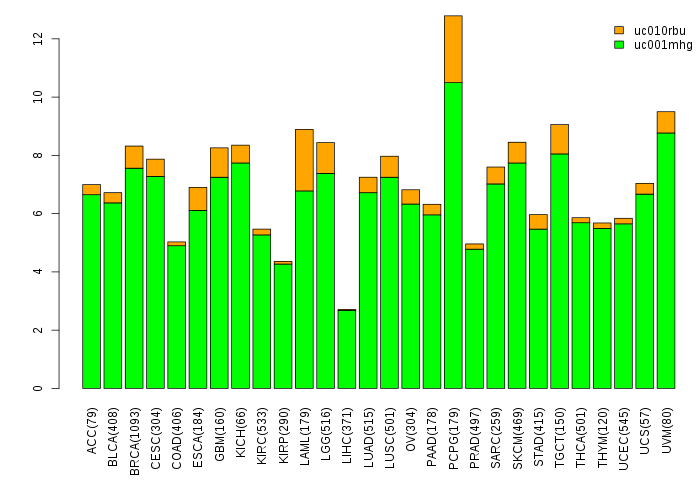 |
| Gene expressions across normal tissues of GTEx data (GTEx GTEx_Analysis_v6_RNA-seq_RNA-SeQCv1.1.8_gene_rpkm.gct) - Here, we shows the matched tissue types only among our 28 cancer types. |
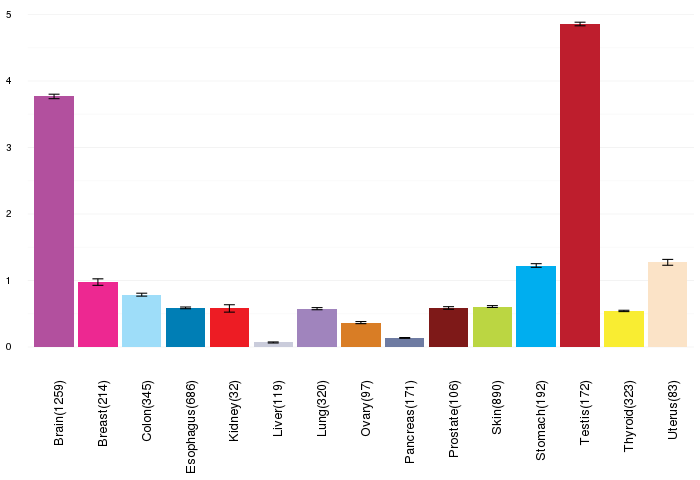 |
| Different expressions across 14 cancer types with more than 10 samples between matched tumors and normals (X-axis: cancer type and Y-axis: log2(norm_counts+1)) (TCGA IlluminaHiSeq_RNASeqV2, pan-cancer normalized log2(norm_counts+1) data, version 2016-08-16) |
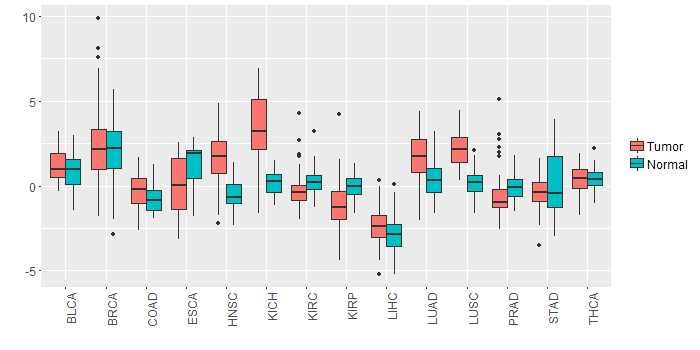 |
| - Significantly differentially expressed cancer types and information. (|Fold change|>1 and FDR<0.05) |
| Cancer type | Mean(exp) in tumor | Mean(exp) in matched normal | Log2FC | P-val. | FDR |
| LUSC | 2.135026194 | 0.239355606 | 1.895670588 | 1.01E-17 | 8.88E-17 |
| KICH | 3.429042586 | 0.229506586 | 3.199536 | 6.68E-08 | 3.16E-07 |
| HNSC | 1.539236819 | -0.501607367 | 2.040844186 | 9.67E-12 | 2.53E-10 |
| LUAD | 1.645851414 | 0.361160034 | 1.284691379 | 4.52E-07 | 1.57E-06 |
| KIRP | -1.128768414 | -0.038559039 | -1.090209375 | 0.00178 | 0.004581814 |
| Top |
| TissGene-miRNA for NRIP3 |
| Significantly anti-correlated miRNAs of TissGene across 28 cancer types (Gene-miRNA relations from TargetScanHuman Relsease 7.1, Conserved_Site_Context_Scores.txt.zip, 06.01.2016) (TCGA IlluminaHiSeq_miRNASeq, log2(RPM+1) data, version 2016-11-21) (TCGA IlluminaHiSeq_RNASeqV2, log2(normalized_count+1) data, version 2016-08-16) (Spearman’s Rank Correlation (p-value<0.05 and coefficient<-0.25)) |
| Cancer type | miRNA id | miRNA accession | P-val. | Coeff. | # samples |
| Top |
| TissGeneMut for NRIP3 |
| TissGeneSNV for NRIP3 |
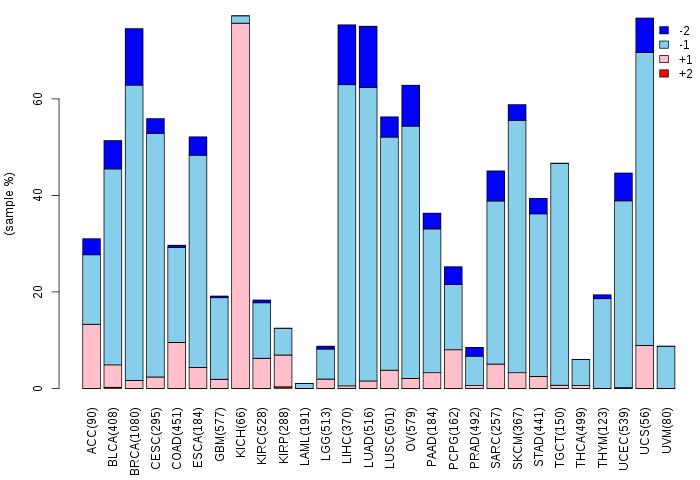
| nsSNV counts per each loci. Different colors of circles represent different cancer types. Circle size denotes number of samples. (TCGA somatic mutation (SNPs and small INDELs) data, version 2016-04-25) * Click on the image to enlarge it in a new window. |
 |
 |
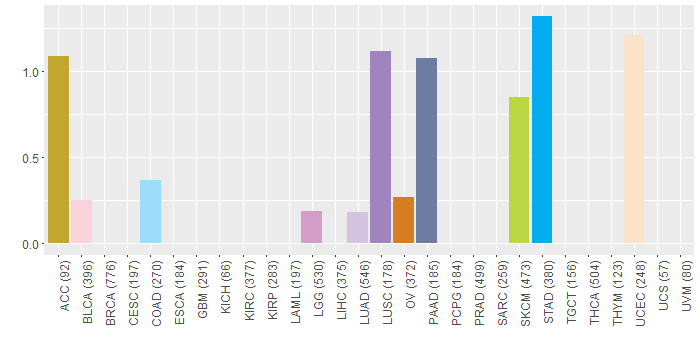
| Somatic nucleotide variants of TissGene across 28 cancer types (X-axis: cancer type and Y-axis: % of mutated samples) The numbers in parentheses are numbers of samples with mutation (nsSNVs). (TCGA somatic mutation (SNPs and small INDELs) data, version 2016-04-25) |
 |
| - nsSNVs sorted by frequency. |
| AAchange | Cancer type | # samples |
| p.R202Q | UCEC | 2 |
| p.R77Q | COAD | 1 |
| p.R66S | BLCA | 1 |
| p.K205R | STAD | 1 |
| p.P60L | SKCM | 1 |
| p.E223D | UCEC | 1 |
| p.L196V | LUSC | 1 |
| p.Q26H | CHOL | 1 |
| p.G79R | LUAD | 1 |
| p.R81C | PAAD | 1 |
| p.R66M | BLCA | 1 |
| p.R160W | STAD | 1 |
| p.L131F | LGG | 1 |
| p.M107L | SKCM | 1 |
| p.P83L | SKCM | 1 |
| p.S157Y | STAD | 1 |
| p.L198I | LUSC | 1 |
| p.D106G | STAD | 1 |
| p.V231L | OV | 1 |
| p.R66I | BLCA | 1 |
| p.S203Y | UCEC | 1 |
| p.G98E | SKCM | 1 |
| p.S78I | HNSC | 1 |
| p.R160Q | STAD | 1 |
| p.R67C | READ | 1 |
| p.R160W | PAAD | 1 |
| p.P83S | SKCM | 1 |
| p.S232Y | UCEC | 1 |
| p.R66K | ACC | 1 |
| Top |
| TissGeneCNV for NRIP3 |
| Copy number variations of TissGene across 28 cancer types (X-axis: cancer type and Y-axis: % of CNV samples) (TCGA Gistic2_CopyNumber_Gistic2_all_data_by_genes, Gistic2 copy number data, version 2016-08-16) |
 |
| Top |
| TissGeneFusions for NRIP3 |
| Fusion genes including TissGene (ChimerDB 3.0, 2016-12-01 and TCGA fusion Portal 2015-12-01) |
| Database | Src | Cancer type | Sample | Fusion gene | ORF | 5'-gene BP | 3'-gene BP |
| Chimerdb3.0 | ChiTaRs | NA | BI603836 | DPYD-NRIP3 | chr1:98049359 | chr11:9002563 |
| Top |
| TissGeneNet for NRIP3 |
| Co-expressed gene networks based on protein-protein interaction data (CePIN) (TCGA IlluminaHiSeq_RNASeqV2, pan-cancer normalized log2(norm_counts+1) data, version 2016-08-16) (PINA2 ppi data) |
| Top |
| TissGeneProg for NRIP3 |
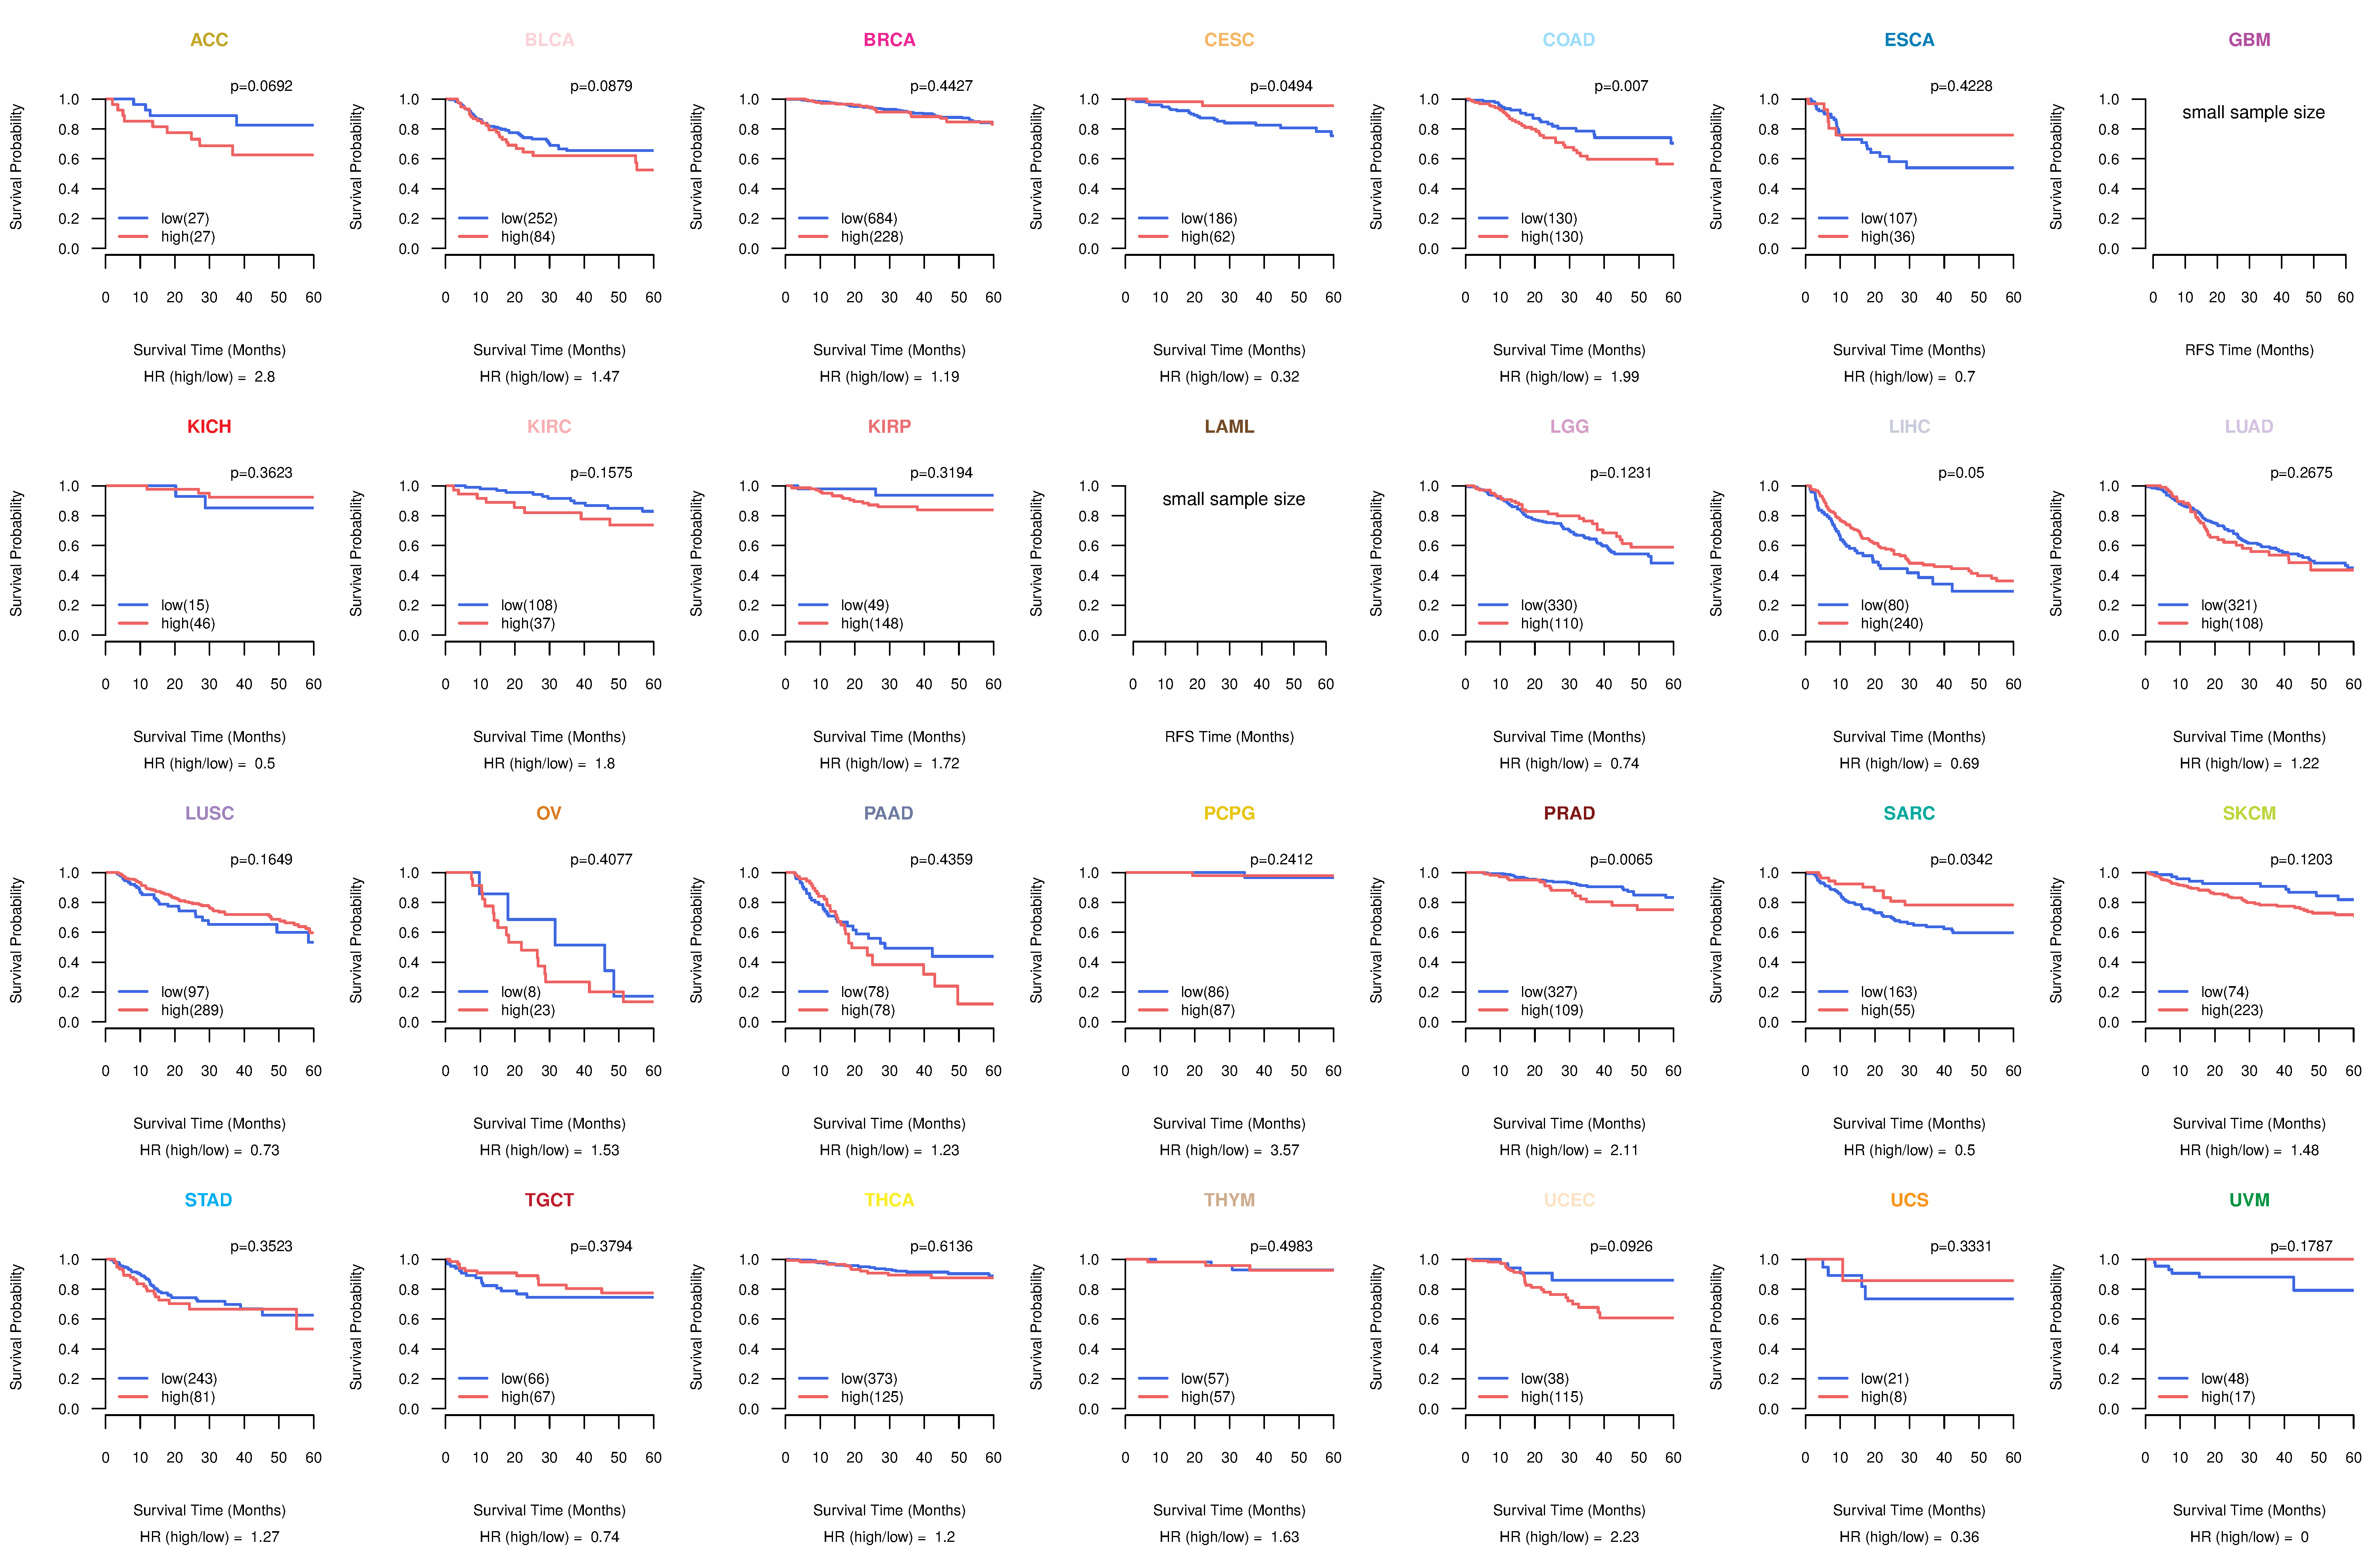
| Kaplan-Meier plots with logrank tests of overall survival (OS) using 28 cancer types (TCGA IlluminaHiSeq_RNASeqV2, pan-cancer normalized log2(norm_counts+1) data, version 2016-08-16) (TCGA clinicalMatrix, phenotype data, version 2016-04-27) * Click on the image to enlarge it in a new window. |
 |
| Kaplan-Meier plots with logrank test of relapse free survival (RFS) using 28 cancer types (TCGA IlluminaHiSeq_RNASeqV2, pan-cancer normalized log2(norm_counts+1) data, version 2016-08-16) (TCGA clinicalMatrix, phenotype data, version 2016-04-27) * Click on the image enlarge it in a new window. |
 |
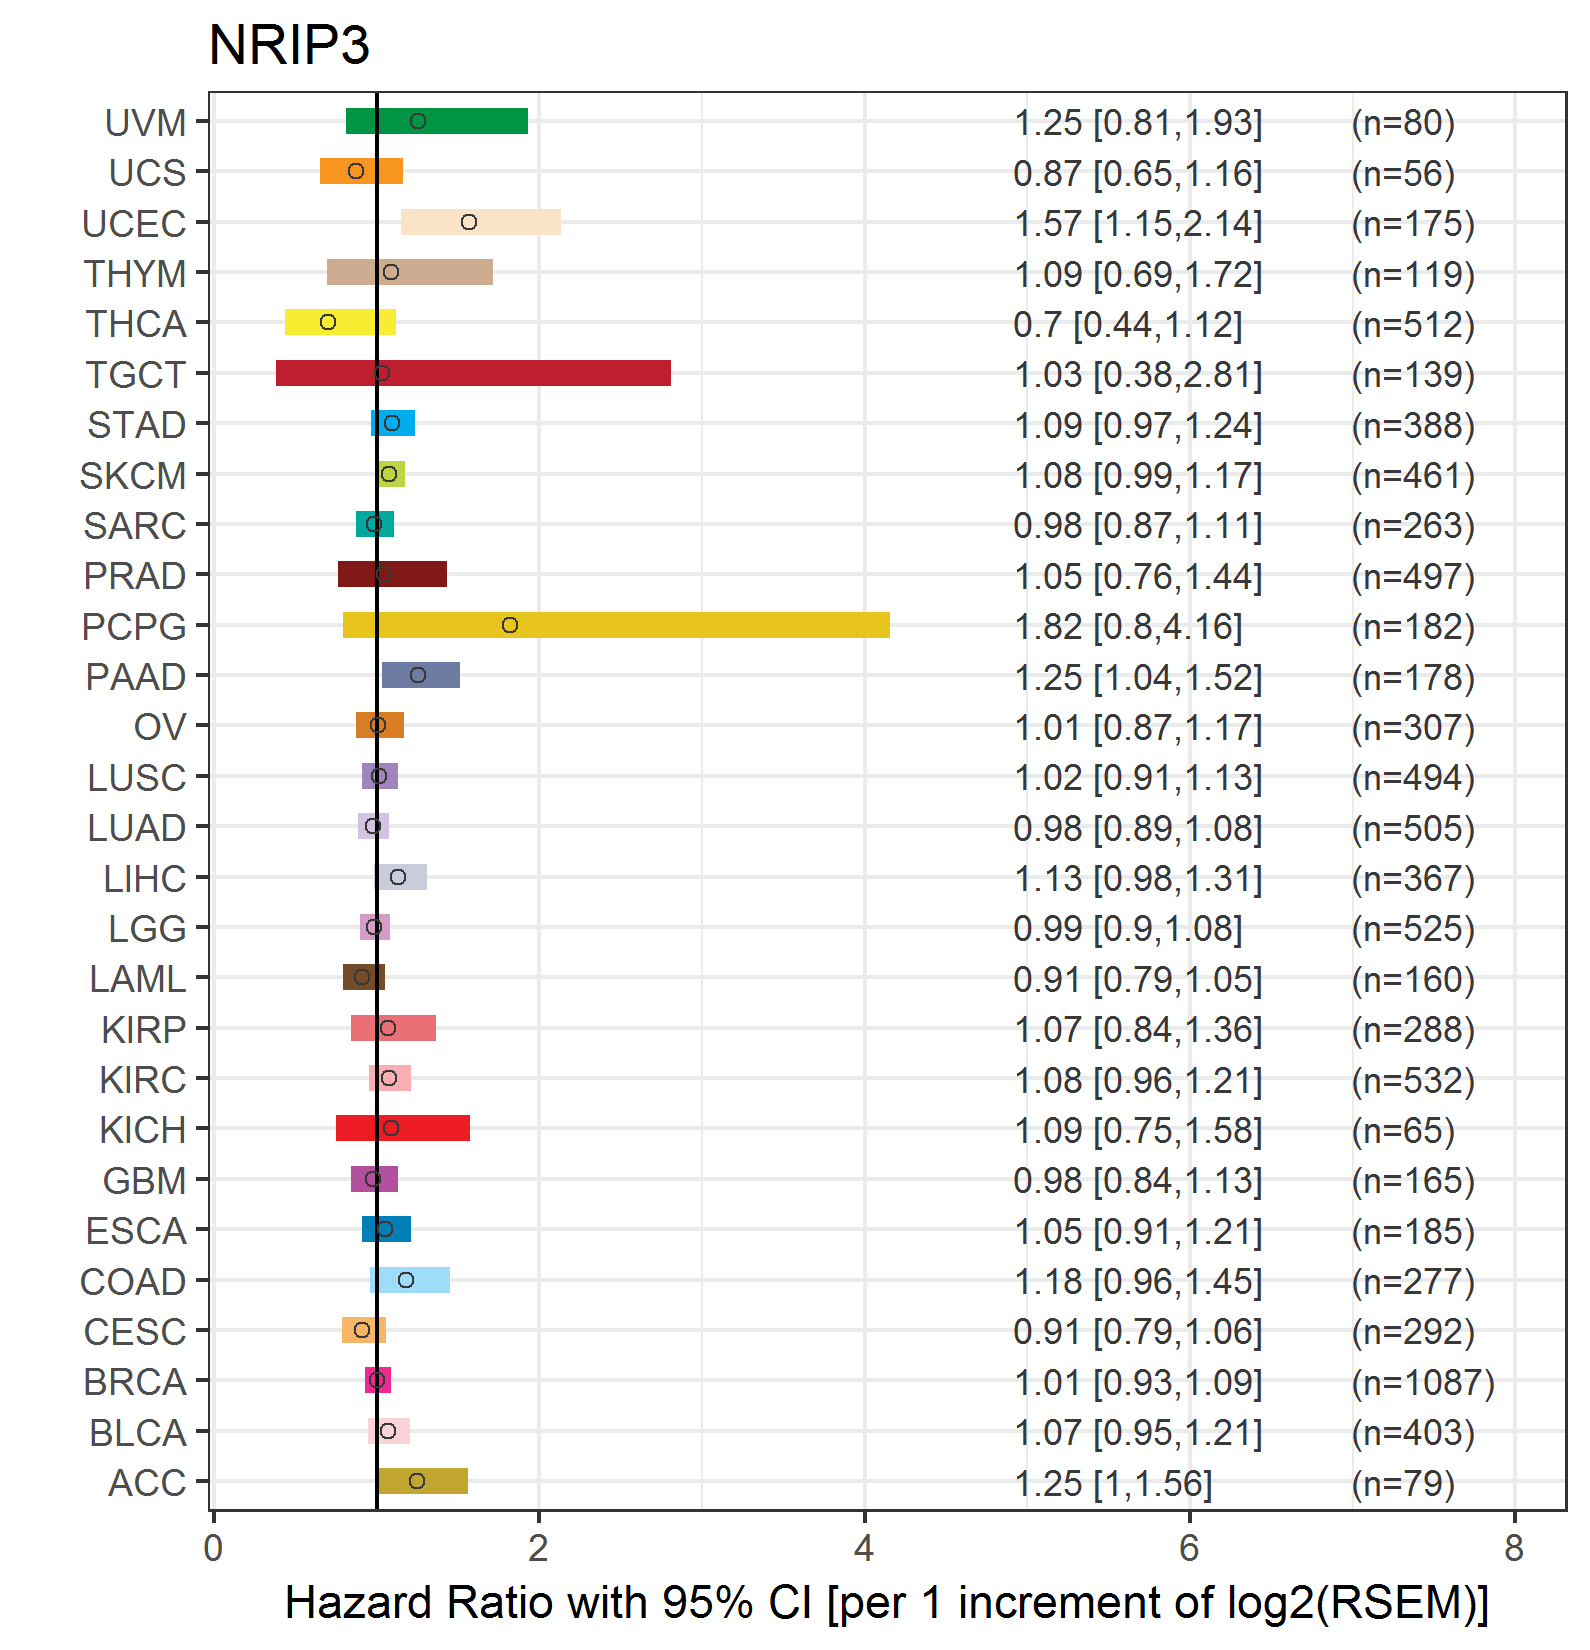
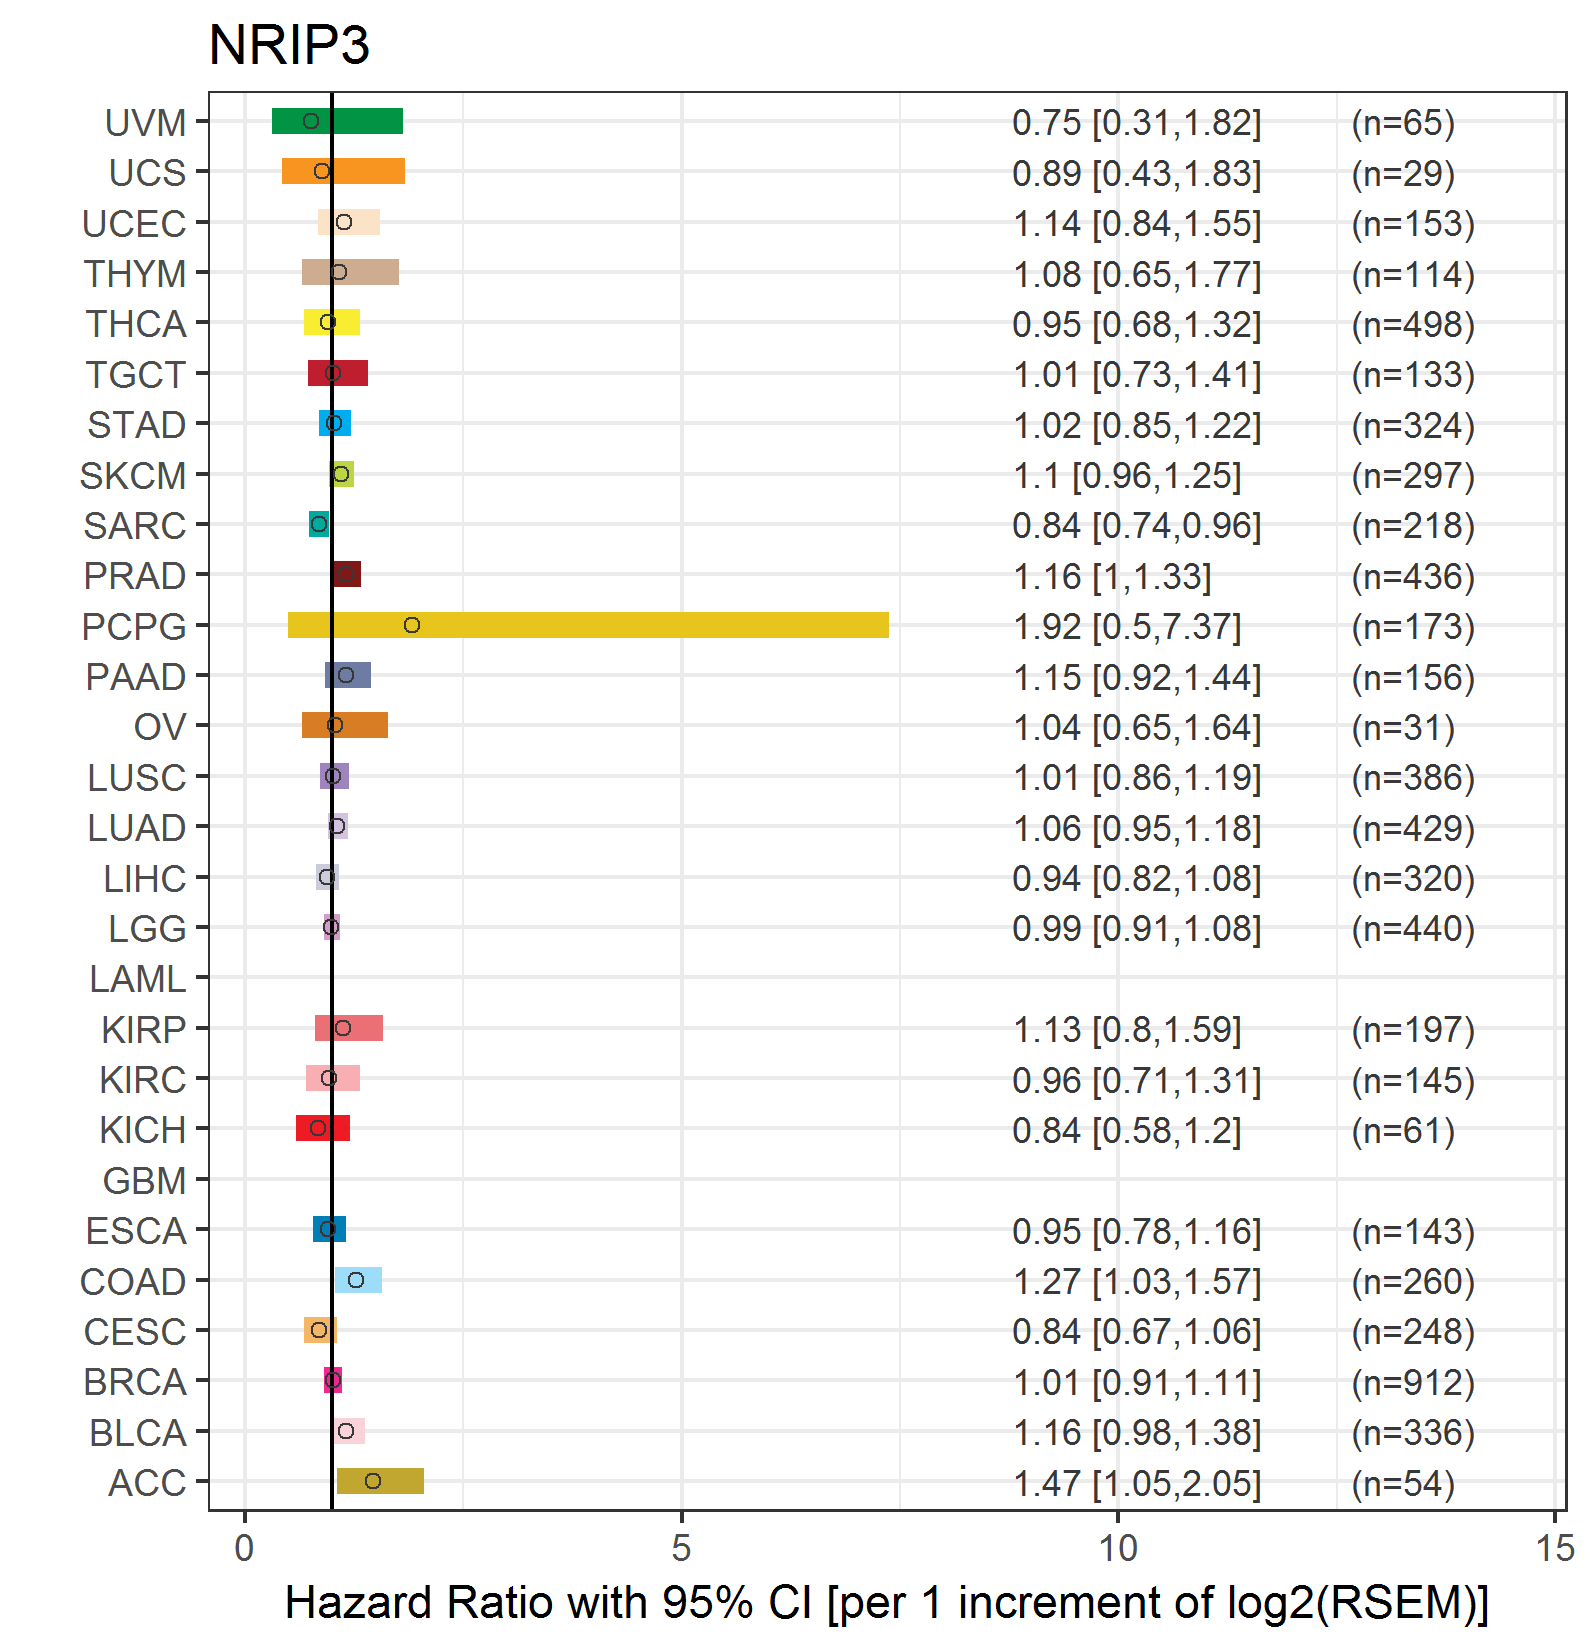
| Forest plot of Cox proportional hazard ratio (HR) and 95% CI of overall survival (OS) using 28 cancer types (TCGA IlluminaHiSeq_RNASeqV2, pan-cancer normalized log2(norm_counts+1) data, version 2016-08-16) (TCGA clinicalMatrix, phenotype data, version 2016-04-27) * Click on the image enlarge it in a new window. |
 |
| Forest plot of Cox proportional hazard ratio (HR) and 95% CI of relapse free survival (RFS) using 28 cancer types (TCGA IlluminaHiSeq_RNASeqV2, pan-cancer normalized log2(norm_counts+1) data, version 2016-08-16) (TCGA clinicalMatrix, phenotype data, version 2016-04-27) * Click on the image enlarge it in a new window. |
 |
| Top |
| TissGeneClin for NRIP3 |
| TissGeneDrug for NRIP3 |
| Drug information targeting TissGene (DrugBank Version 5.0.6, 2017-04-01) |
| DrugBank ID | Drug name | Drug activity | Drug type | Drug status |
| Top |
| TissGeneDisease for NRIP3 |
| Disease information associated with TissGene (DisGeNet, 2016-06-01) |
| Disease ID | Disease name | # pubmeds | Source |
|
Copyright 2016-Present - The University of Texas Health Science Center at Houston (UTHealth) Web File Viewing | How to Report, Fraud, Waste and Abuse | State of Texas | Statewide Search | Texas Homeland Security | Site Policies |