 |
| |
| |
| |
| |
| |
| |
|

| TissGeneSummary for PRDM8 |
 Gene summary Gene summary |
| Basic gene information | Gene symbol | PRDM8 |
| Gene name | PR domain containing 8 | |
| Synonyms | PFM5 | |
| Cytomap | UCSC genome browser: 4q21 | |
| Type of gene | protein-coding | |
| RefGenes | NM_001099403.1, NM_020226.3, | |
| Description | PR domain zinc finger protein 8PR domain-containing protein 8PR-domain containing protein 8 | |
| Modification date | 20141207 | |
| dbXrefs | HGNC : HGNC | |
| Ensembl : ENSG00000152784 | ||
| HPRD : 17904 | ||
| Vega : OTTHUMG00000160885 | ||
| Protein | UniProt: go to UniProt's Cross Reference DB Table | |
| Expression | CleanEX: HS_PRDM8 | |
| BioGPS: 56978 | ||
| Pathway | NCI Pathway Interaction Database: PRDM8 | |
| KEGG: PRDM8 | ||
| REACTOME: PRDM8 | ||
| Pathway Commons: PRDM8 | ||
| Context | iHOP: PRDM8 | |
| ligand binding site mutation search in PubMed: PRDM8 | ||
| UCL Cancer Institute: PRDM8 | ||
| Assigned class in TissGDB* | C | |
| Included tissue-specific gene expression resources | TiGER,GTEx | |
| Specific-tissues in normal samples (assigned by TissGDB using HPA, TiGER, and GTEx) | ProstateEye | |
| Cancer types related to the specific-tissues in cancer samples (assigned by TissGDB using TCGA) | PRADUVM | |
| Reference showing the relevant tissue of PRDM8 | ||
| Description by TissGene annotations | ||
| * Class A consists of genes with literature evidence and is part of the cTissGenes. Class B consists of only cTissGenes without additional evidence. The remaining genes belong to Class C. |
| Gene ontology having evidence of Inferred from Direct Assay (IDA) from Entrez |
| GO ID | GO term | PubMed ID |
| Top |
| TissGeneExp for PRDM8 |
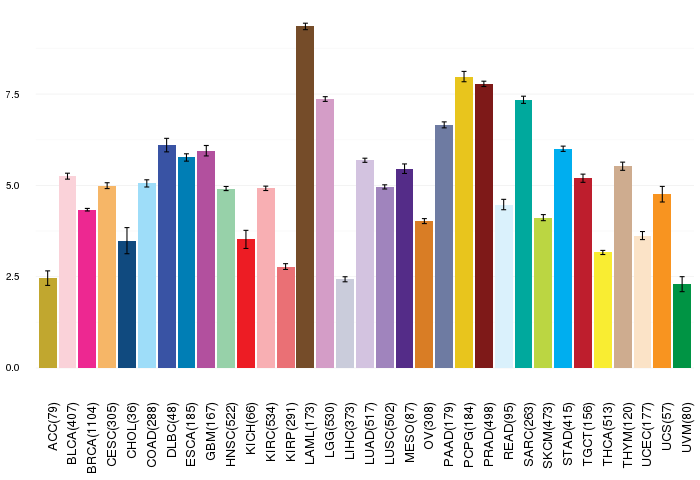
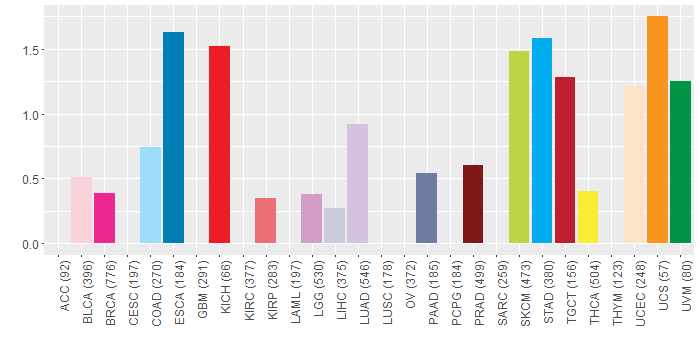
| Gene expressions across 28 cancer types (X-axis: cancer type and Y-axis: log2(norm_counts+1)) (TCGA IlluminaHiSeq_RNASeqV2, pan-cancer normalized log2(norm_counts+1) data, version 2016-08-16) |
 |
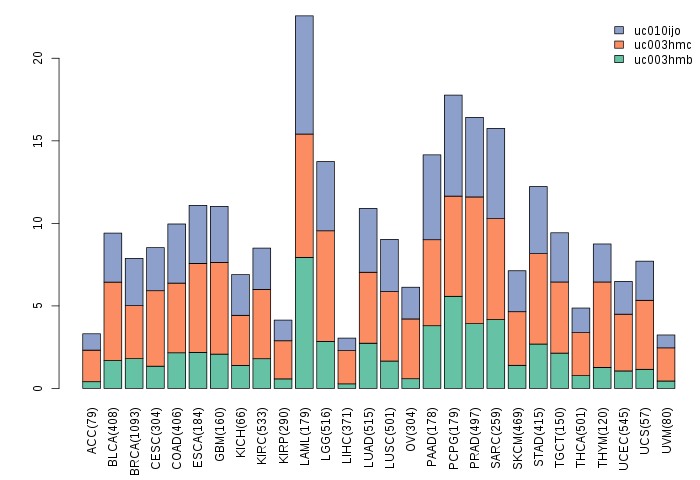
| Gene isoform expressions across 28 cancer types (X-axis: cancer type and Y-axis: log2(norm_counts+1)) (TCGA pan-cancer tcga_rsem_isoform_tpm, version 2016-09-01) |
 |
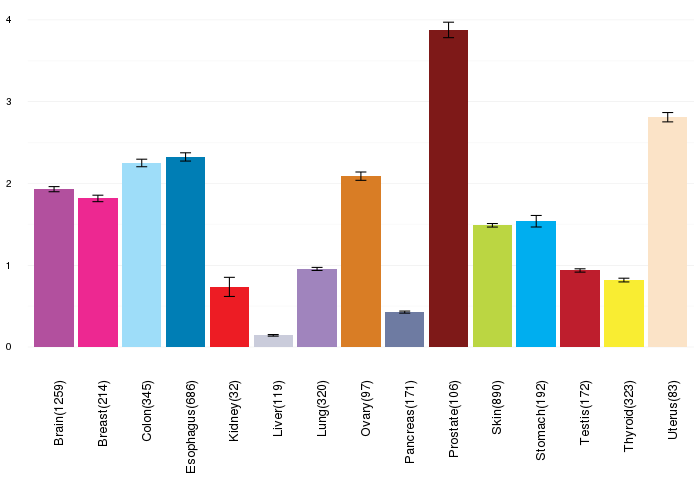
| Gene expressions across normal tissues of GTEx data (GTEx GTEx_Analysis_v6_RNA-seq_RNA-SeQCv1.1.8_gene_rpkm.gct) - Here, we shows the matched tissue types only among our 28 cancer types. |
 |
| Different expressions across 14 cancer types with more than 10 samples between matched tumors and normals (X-axis: cancer type and Y-axis: log2(norm_counts+1)) (TCGA IlluminaHiSeq_RNASeqV2, pan-cancer normalized log2(norm_counts+1) data, version 2016-08-16) |
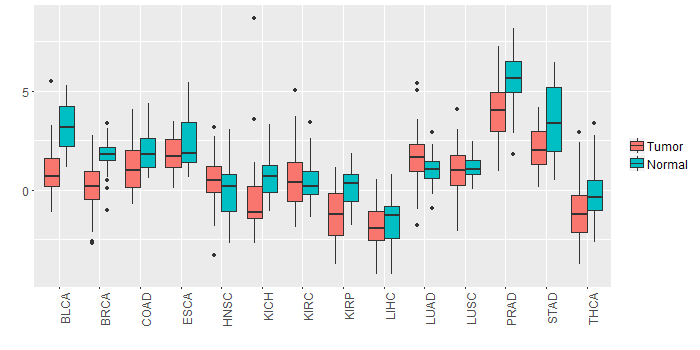 |
| - Significantly differentially expressed cancer types and information. (|Fold change|>1 and FDR<0.05) |
| Cancer type | Mean(exp) in tumor | Mean(exp) in matched normal | Log2FC | P-val. | FDR |
| BRCA | 0.154817679 | 1.767345749 | -1.61252807 | 2.79E-30 | 3.83E-29 |
| KIRP | -1.320105183 | 0.158029192 | -1.478134375 | 4.42E-06 | 1.97E-05 |
| PRAD | 4.080757557 | 5.606705634 | -1.525948077 | 1.87E-07 | 1.61E-06 |
| STAD | 2.111004192 | 3.379954192 | -1.26895 | 0.00129 | 0.006475915 |
| BLCA | 1.132754521 | 3.289938731 | -2.157184211 | 4.10E-05 | 0.000549301 |
| Top |
| TissGene-miRNA for PRDM8 |
| Significantly anti-correlated miRNAs of TissGene across 28 cancer types (Gene-miRNA relations from TargetScanHuman Relsease 7.1, Conserved_Site_Context_Scores.txt.zip, 06.01.2016) (TCGA IlluminaHiSeq_miRNASeq, log2(RPM+1) data, version 2016-11-21) (TCGA IlluminaHiSeq_RNASeqV2, log2(normalized_count+1) data, version 2016-08-16) (Spearman’s Rank Correlation (p-value<0.05 and coefficient<-0.25)) |
| Cancer type | miRNA id | miRNA accession | P-val. | Coeff. | # samples |
| Top |
| TissGeneMut for PRDM8 |
| TissGeneSNV for PRDM8 |
| nsSNV counts per each loci. Different colors of circles represent different cancer types. Circle size denotes number of samples. (TCGA somatic mutation (SNPs and small INDELs) data, version 2016-04-25) * Click on the image to enlarge it in a new window. |
 |
| Somatic nucleotide variants of TissGene across 28 cancer types (X-axis: cancer type and Y-axis: % of mutated samples) The numbers in parentheses are numbers of samples with mutation (nsSNVs). (TCGA somatic mutation (SNPs and small INDELs) data, version 2016-04-25) |
 |
| - nsSNVs sorted by frequency. |
| AAchange | Cancer type | # samples |
| p.Q212H | TGCT | 2 |
| p.Q212H | PRAD | 2 |
| p.R678G | BRCA | 1 |
| p.P669T | STAD | 1 |
| p.R645K | SKCM | 1 |
| p.K132N | LGG | 1 |
| p.L283H | UVM | 1 |
| p.P142L | SKCM | 1 |
| p.E673X | COAD | 1 |
| p.G207S | SKCM | 1 |
| p.G204D | HNSC | 1 |
| p.N625S | STAD | 1 |
| p.K61R | SKCM | 1 |
| p.A321V | LIHC | 1 |
| p.V197M | BRCA | 1 |
| p.H183Y | LUAD | 1 |
| p.D53G | LGG | 1 |
| p.A172V | PRAD | 1 |
| p.S253I | PAAD | 1 |
| p.S94L | THCA | 1 |
| p.Q212H | MESO | 1 |
| p.N270T | LUAD | 1 |
| p.P239S | SKCM | 1 |
| p.G207S | ESCA | 1 |
| p.Q93K | SKCM | 1 |
| p.P534S | THCA | 1 |
| p.R333Q | DLBC | 1 |
| p.Q217E | UCS | 1 |
| p.R635H | STAD | 1 |
| p.Q212H | BLCA | 1 |
| p.C44R | UCEC | 1 |
| p.V45A | UCEC | 1 |
| p.K650Q | STAD | 1 |
| p.Q212H | STAD | 1 |
| p.R115C | STAD | 1 |
| p.Q281L | ESCA | 1 |
| p.R635C | BRCA | 1 |
| p.D186H | BLCA | 1 |
| p.P169S | LUAD | 1 |
| p.P142S | SKCM | 1 |
| p.Q212H | COAD | 1 |
| p.D24Y | UCEC | 1 |
| p.L86P | LUAD | 1 |
| p.L657F | KICH | 1 |
| p.Q217E | LUAD | 1 |
| p.G110E | SKCM | 1 |
| p.Q212H | HNSC | 1 |
| p.Q217E | KIRP | 1 |
| p.Q212H | ESCA | 1 |
| p.P223S | STAD | 1 |
| Top |
| TissGeneCNV for PRDM8 |
| Copy number variations of TissGene across 28 cancer types (X-axis: cancer type and Y-axis: % of CNV samples) (TCGA Gistic2_CopyNumber_Gistic2_all_data_by_genes, Gistic2 copy number data, version 2016-08-16) |
 |
| Top |
| TissGeneFusions for PRDM8 |
| Fusion genes including TissGene (ChimerDB 3.0, 2016-12-01 and TCGA fusion Portal 2015-12-01) |
| Database | Src | Cancer type | Sample | Fusion gene | ORF | 5'-gene BP | 3'-gene BP |
| Top |
| TissGeneNet for PRDM8 |
| Co-expressed gene networks based on protein-protein interaction data (CePIN) (TCGA IlluminaHiSeq_RNASeqV2, pan-cancer normalized log2(norm_counts+1) data, version 2016-08-16) (PINA2 ppi data) |
| Top |
| TissGeneProg for PRDM8 |
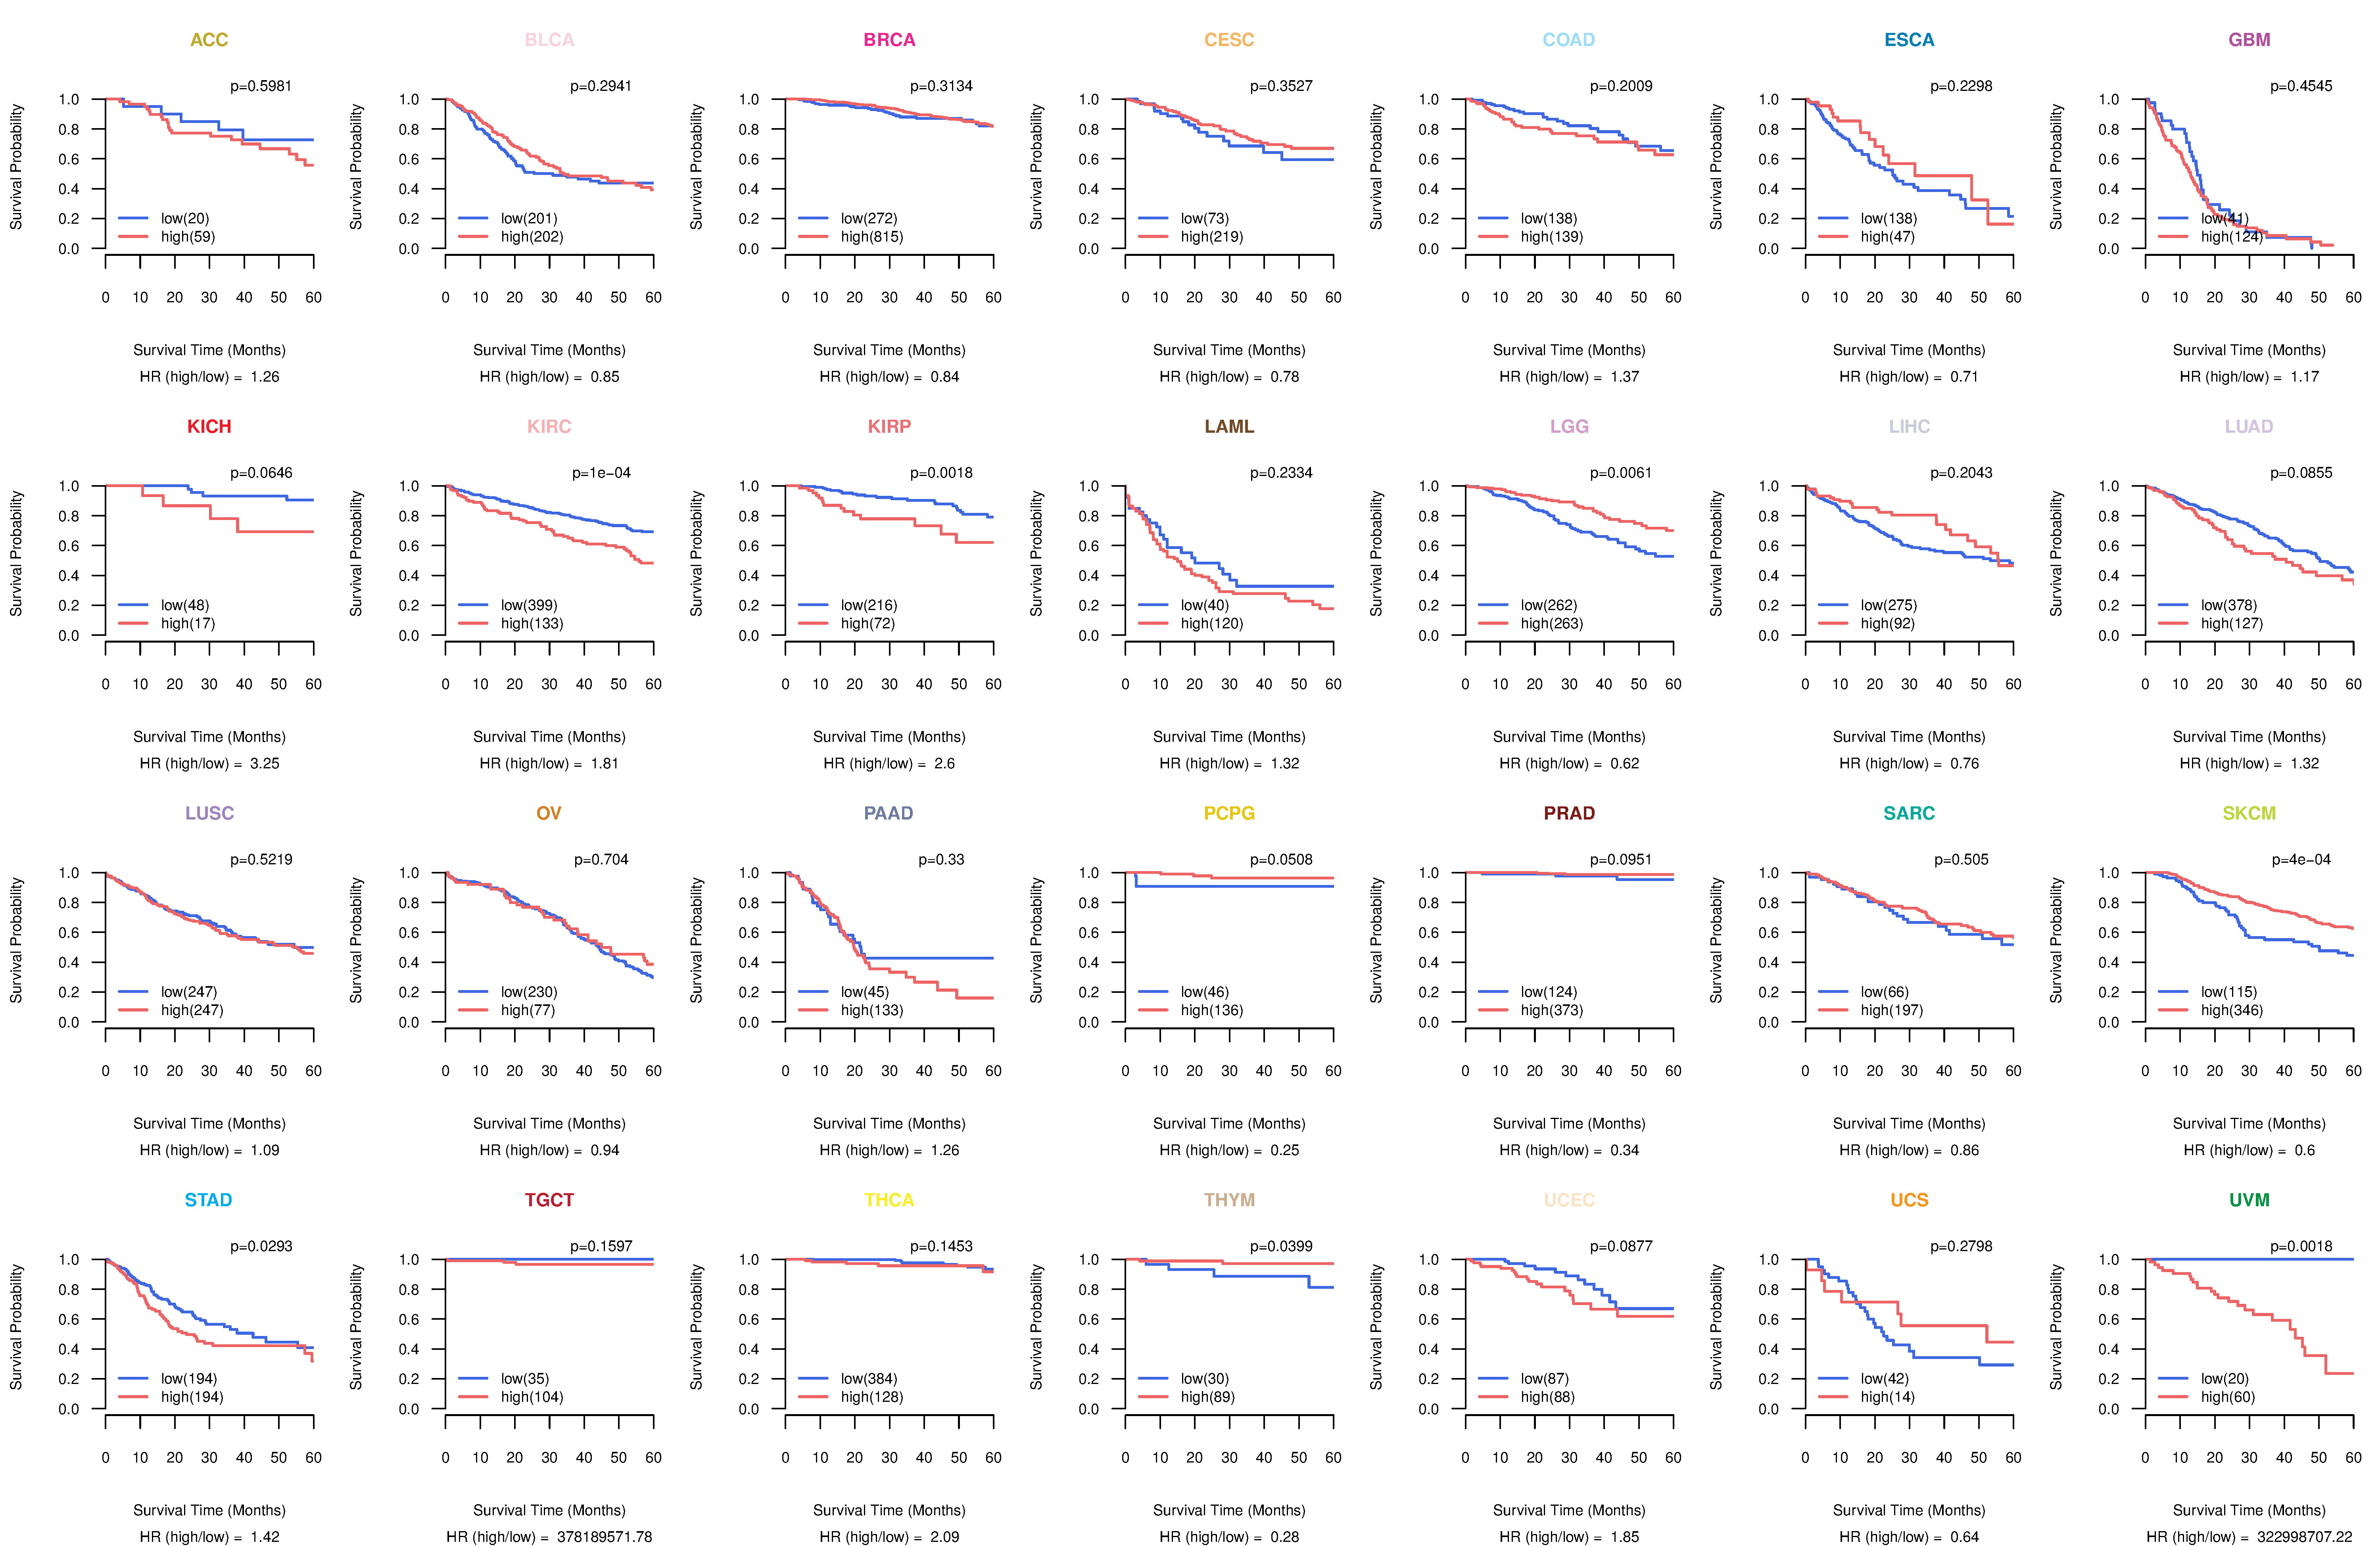
| Kaplan-Meier plots with logrank tests of overall survival (OS) using 28 cancer types (TCGA IlluminaHiSeq_RNASeqV2, pan-cancer normalized log2(norm_counts+1) data, version 2016-08-16) (TCGA clinicalMatrix, phenotype data, version 2016-04-27) * Click on the image to enlarge it in a new window. |
 |
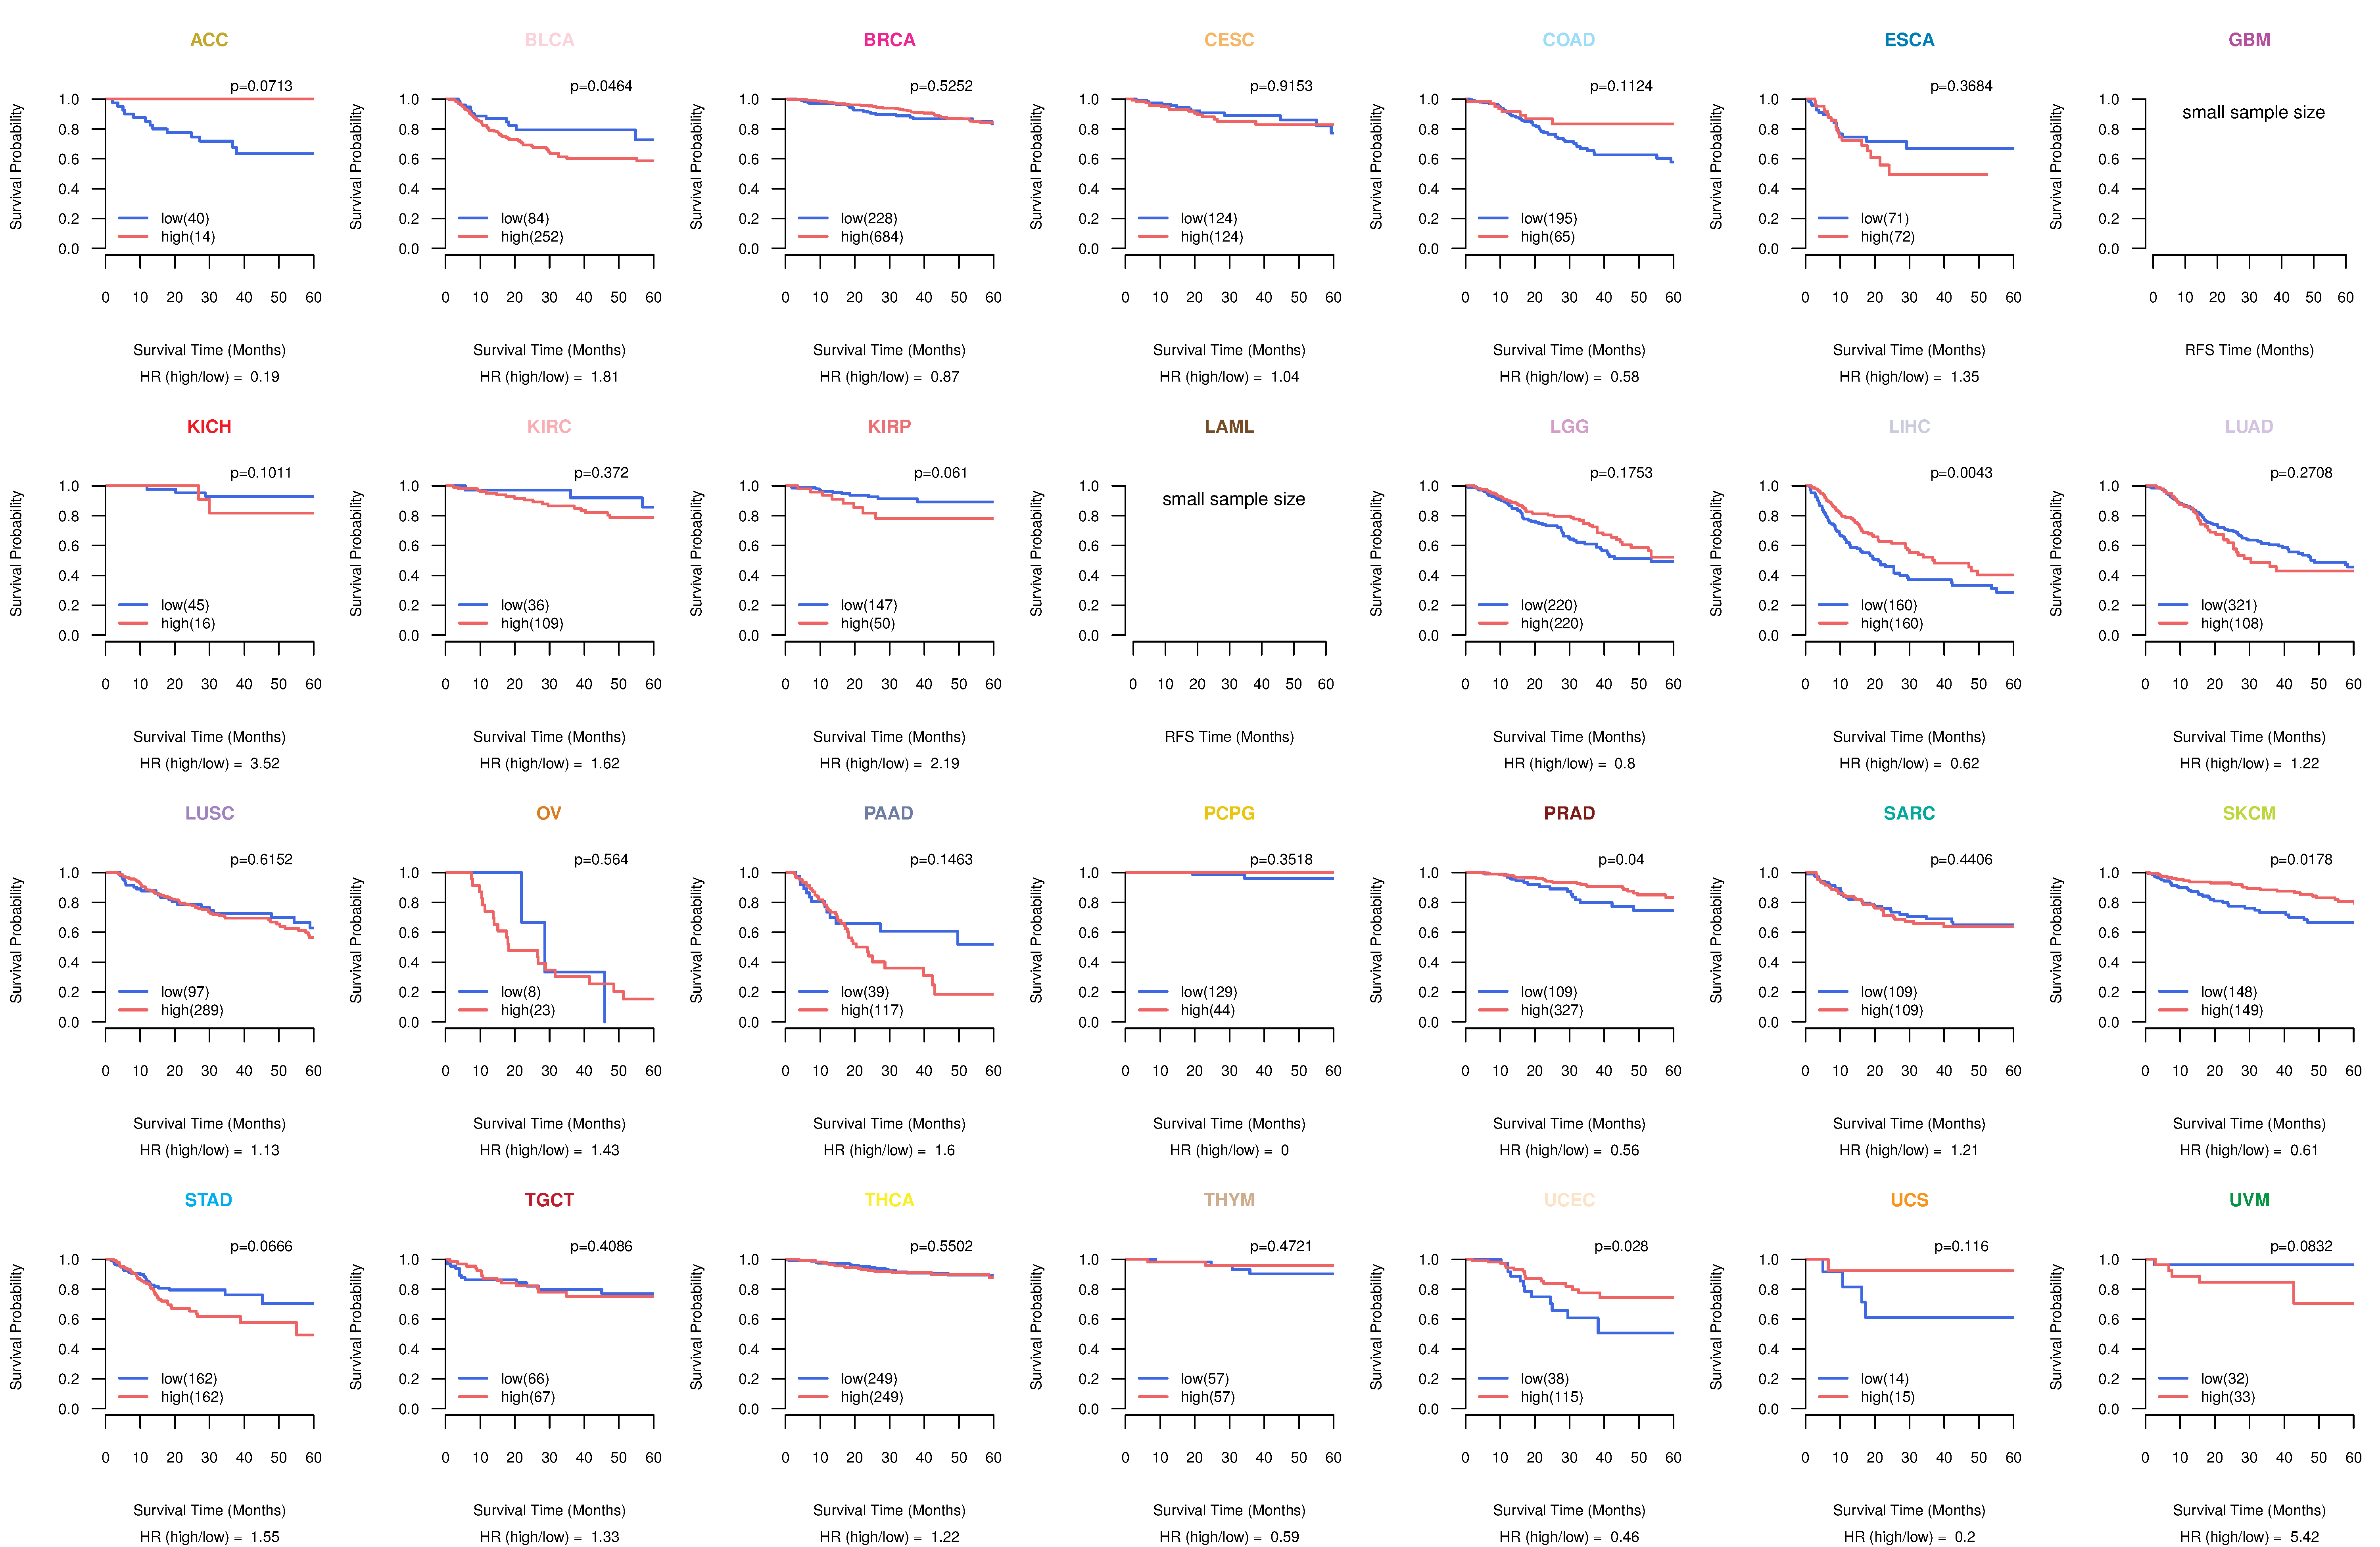
| Kaplan-Meier plots with logrank test of relapse free survival (RFS) using 28 cancer types (TCGA IlluminaHiSeq_RNASeqV2, pan-cancer normalized log2(norm_counts+1) data, version 2016-08-16) (TCGA clinicalMatrix, phenotype data, version 2016-04-27) * Click on the image enlarge it in a new window. |
 |
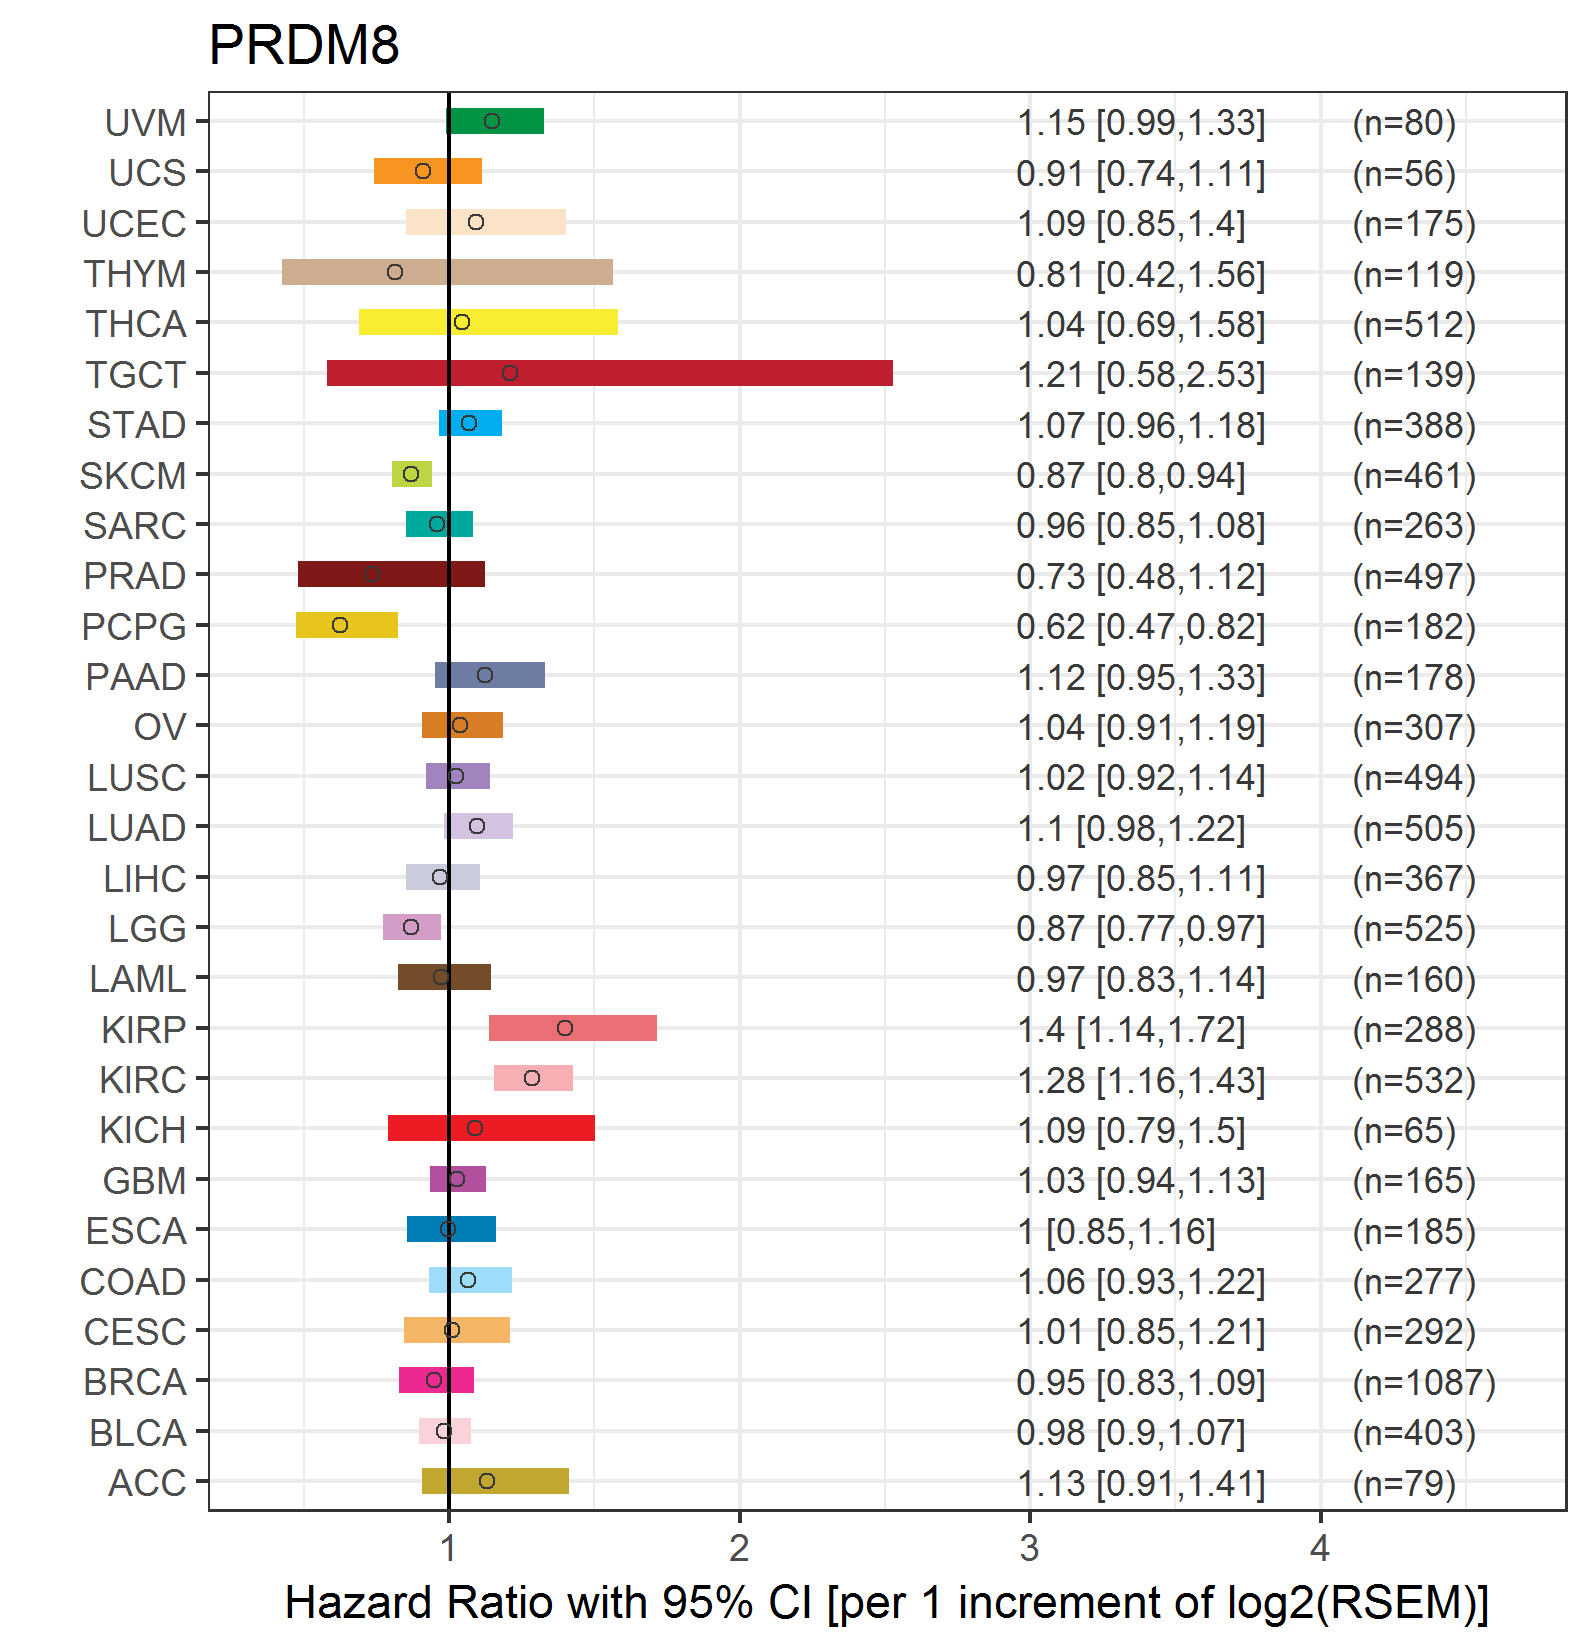
| Forest plot of Cox proportional hazard ratio (HR) and 95% CI of overall survival (OS) using 28 cancer types (TCGA IlluminaHiSeq_RNASeqV2, pan-cancer normalized log2(norm_counts+1) data, version 2016-08-16) (TCGA clinicalMatrix, phenotype data, version 2016-04-27) * Click on the image enlarge it in a new window. |
 |
| Forest plot of Cox proportional hazard ratio (HR) and 95% CI of relapse free survival (RFS) using 28 cancer types (TCGA IlluminaHiSeq_RNASeqV2, pan-cancer normalized log2(norm_counts+1) data, version 2016-08-16) (TCGA clinicalMatrix, phenotype data, version 2016-04-27) * Click on the image enlarge it in a new window. |
 |
| Top |
| TissGeneClin for PRDM8 |
| TissGeneDrug for PRDM8 |
| Drug information targeting TissGene (DrugBank Version 5.0.6, 2017-04-01) |
| DrugBank ID | Drug name | Drug activity | Drug type | Drug status |
| Top |
| TissGeneDisease for PRDM8 |
| Disease information associated with TissGene (DisGeNet, 2016-06-01) |
| Disease ID | Disease name | # pubmeds | Source |
| umls:C1271104 | Blood pressure finding | 3 | GAD |
| umls:C1272641 | Systemic arterial pressure | 3 | GAD |
| umls:C0751783 | Lafora Disease | 1 | BeFree |
|
Copyright 2016-Present - The University of Texas Health Science Center at Houston (UTHealth) Web File Viewing | How to Report, Fraud, Waste and Abuse | State of Texas | Statewide Search | Texas Homeland Security | Site Policies |