 |
| |
| |
| |
| |
| |
| |
|

| TissGeneSummary for PSMG2 |
 Gene summary Gene summary |
| Basic gene information | Gene symbol | PSMG2 |
| Gene name | proteasome (prosome, macropain) assembly chaperone 2 | |
| Synonyms | CLAST3|HCCA3|HsT1707|MDS003|PAC2|TNFSF5IP1 | |
| Cytomap | UCSC genome browser: 18p11.21 | |
| Type of gene | protein-coding | |
| RefGenes | NM_020232.4, NM_147163.1, | |
| Description | CD40 ligand-activated specific transcript 3HDCMC29PHSPC260PAC-2hepatocellular carcinoma susceptibility proteinhepatocellular carcinoma-susceptibility protein 3likely ortholog of mouse CD40 ligand-activated specific transcript 3 (Clast3)proteasome a | |
| Modification date | 20141207 | |
| dbXrefs | MIM : 609702 | |
| HGNC : HGNC | ||
| Ensembl : ENSG00000128789 | ||
| HPRD : 11638 | ||
| Vega : OTTHUMG00000131703 | ||
| Protein | UniProt: go to UniProt's Cross Reference DB Table | |
| Expression | CleanEX: HS_PSMG2 | |
| BioGPS: 56984 | ||
| Pathway | NCI Pathway Interaction Database: PSMG2 | |
| KEGG: PSMG2 | ||
| REACTOME: PSMG2 | ||
| Pathway Commons: PSMG2 | ||
| Context | iHOP: PSMG2 | |
| ligand binding site mutation search in PubMed: PSMG2 | ||
| UCL Cancer Institute: PSMG2 | ||
| Assigned class in TissGDB* | C | |
| Included tissue-specific gene expression resources | TiGER,GTEx | |
| Specific-tissues in normal samples (assigned by TissGDB using HPA, TiGER, and GTEx) | BladderTestis | |
| Cancer types related to the specific-tissues in cancer samples (assigned by TissGDB using TCGA) | BLCATGCT | |
| Reference showing the relevant tissue of PSMG2 | ||
| Description by TissGene annotations | TissgsLTS | |
| * Class A consists of genes with literature evidence and is part of the cTissGenes. Class B consists of only cTissGenes without additional evidence. The remaining genes belong to Class C. |
| Gene ontology having evidence of Inferred from Direct Assay (IDA) from Entrez |
| GO ID | GO term | PubMed ID | GO:0043248 | proteasome assembly | 16251969 | GO:0043248 | proteasome assembly | 16251969 |
| Top |
| TissGeneExp for PSMG2 |
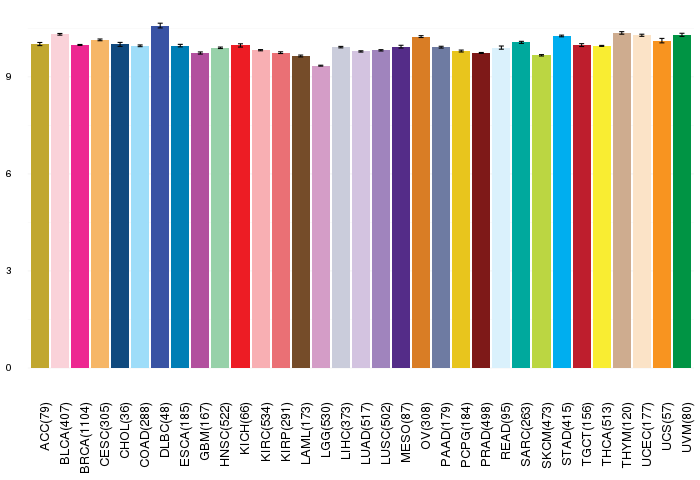
| Gene expressions across 28 cancer types (X-axis: cancer type and Y-axis: log2(norm_counts+1)) (TCGA IlluminaHiSeq_RNASeqV2, pan-cancer normalized log2(norm_counts+1) data, version 2016-08-16) |
 |
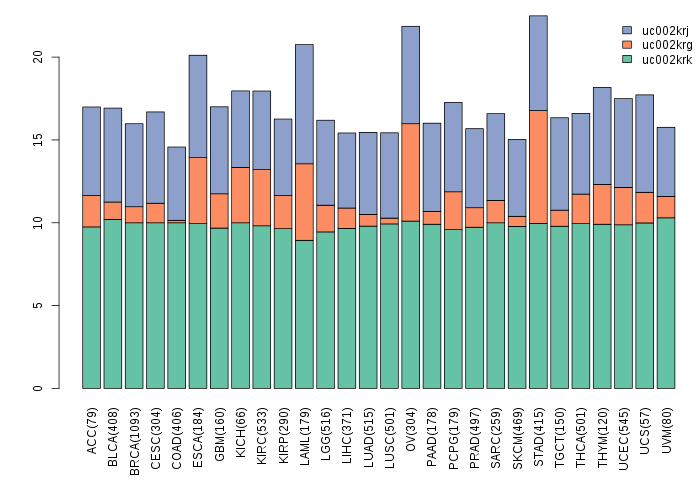
| Gene isoform expressions across 28 cancer types (X-axis: cancer type and Y-axis: log2(norm_counts+1)) (TCGA pan-cancer tcga_rsem_isoform_tpm, version 2016-09-01) |
 |
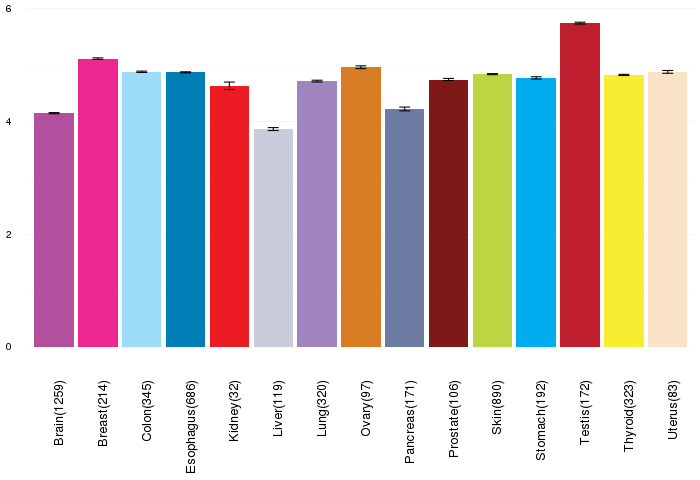
| Gene expressions across normal tissues of GTEx data (GTEx GTEx_Analysis_v6_RNA-seq_RNA-SeQCv1.1.8_gene_rpkm.gct) - Here, we shows the matched tissue types only among our 28 cancer types. |
 |
| Different expressions across 14 cancer types with more than 10 samples between matched tumors and normals (X-axis: cancer type and Y-axis: log2(norm_counts+1)) (TCGA IlluminaHiSeq_RNASeqV2, pan-cancer normalized log2(norm_counts+1) data, version 2016-08-16) |
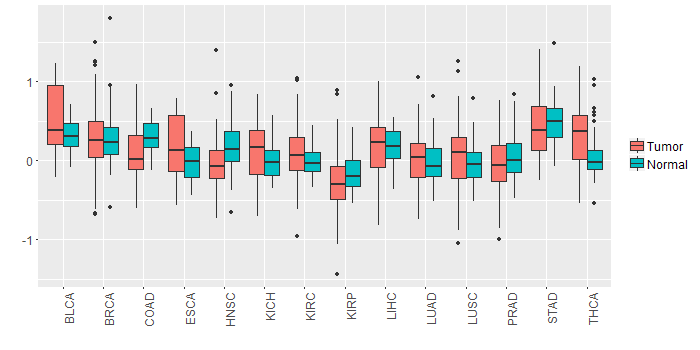 |
| - Significantly differentially expressed cancer types and information. (|Fold change|>1 and FDR<0.05) |
| Cancer type | Mean(exp) in tumor | Mean(exp) in matched normal | Log2FC | P-val. | FDR |
| Top |
| TissGene-miRNA for PSMG2 |
| Significantly anti-correlated miRNAs of TissGene across 28 cancer types (Gene-miRNA relations from TargetScanHuman Relsease 7.1, Conserved_Site_Context_Scores.txt.zip, 06.01.2016) (TCGA IlluminaHiSeq_miRNASeq, log2(RPM+1) data, version 2016-11-21) (TCGA IlluminaHiSeq_RNASeqV2, log2(normalized_count+1) data, version 2016-08-16) (Spearman’s Rank Correlation (p-value<0.05 and coefficient<-0.25)) |
| Cancer type | miRNA id | miRNA accession | P-val. | Coeff. | # samples |
| Top |
| TissGeneMut for PSMG2 |
| TissGeneSNV for PSMG2 |
| nsSNV counts per each loci. Different colors of circles represent different cancer types. Circle size denotes number of samples. (TCGA somatic mutation (SNPs and small INDELs) data, version 2016-04-25) * Click on the image to enlarge it in a new window. |
 |
 |
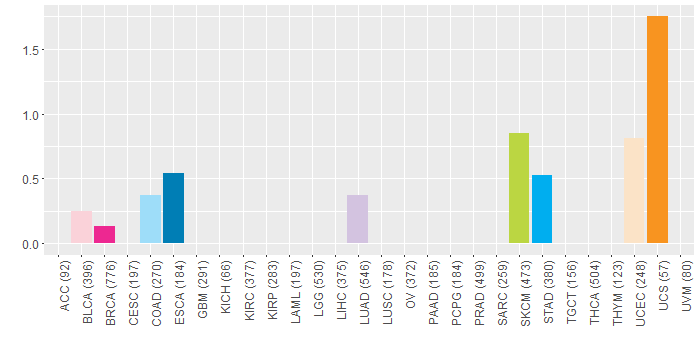
| Somatic nucleotide variants of TissGene across 28 cancer types (X-axis: cancer type and Y-axis: % of mutated samples) The numbers in parentheses are numbers of samples with mutation (nsSNVs). (TCGA somatic mutation (SNPs and small INDELs) data, version 2016-04-25) |
 |
| - nsSNVs sorted by frequency. |
| AAchange | Cancer type | # samples |
| p.R135C | SKCM | 1 |
| p.I172T | STAD | 1 |
| p.N59K | SKCM | 1 |
| p.E70K | BRCA | 1 |
| p.P54S | SKCM | 1 |
| p.W251* | UCS | 1 |
| p.S68* | BLCA | 1 |
| p.W251X | UCS | 1 |
| p.S108F | SKCM | 1 |
| p.R244W | LUAD | 1 |
| p.W245S | ESCA | 1 |
| p.E164D | COAD | 1 |
| p.F207C | STAD | 1 |
| p.S99L | LUAD | 1 |
| p.L231I | UCEC | 1 |
| p.P54L | UCEC | 1 |
| Top |
| TissGeneCNV for PSMG2 |
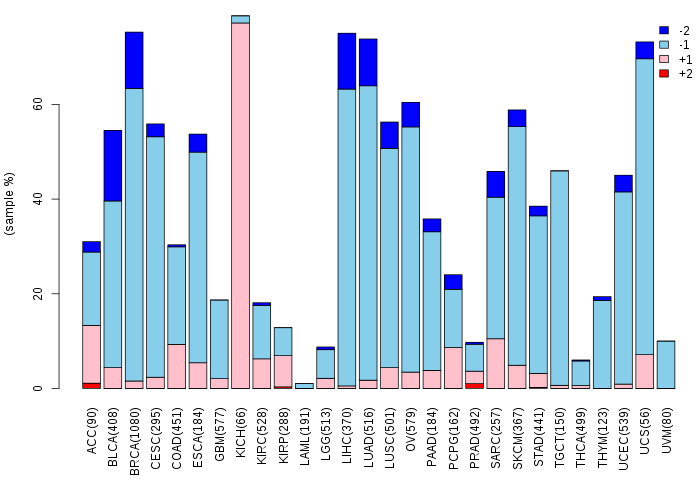
| Copy number variations of TissGene across 28 cancer types (X-axis: cancer type and Y-axis: % of CNV samples) (TCGA Gistic2_CopyNumber_Gistic2_all_data_by_genes, Gistic2 copy number data, version 2016-08-16) |
 |
| Top |
| TissGeneFusions for PSMG2 |
| Fusion genes including TissGene (ChimerDB 3.0, 2016-12-01 and TCGA fusion Portal 2015-12-01) |
| Database | Src | Cancer type | Sample | Fusion gene | ORF | 5'-gene BP | 3'-gene BP |
| Chimerdb3.0 | ChiTaRs | NA | BU941755 | NCL-PSMG2 | chr2:232329189 | chr18:12724568 | |
| Chimerdb3.0 | ChiTaRs | NA | DW416891 | PSMG2-PI4KAP2 | chr18:12696700 | chr22:21831621 | |
| Chimerdb3.0 | ChiTaRs | NA | BG007476 | PSMG2-PIP4K2A | chr18:12725566 | chr10:22834917 | |
| Chimerdb3.0 | FusionScan | ESCA | TCGA-L5-A8NE-01A | PSMG2-OSBPL1A | Out-of-Frame | chr18:12703163 | chr18:21914294 |
| Top |
| TissGeneNet for PSMG2 |
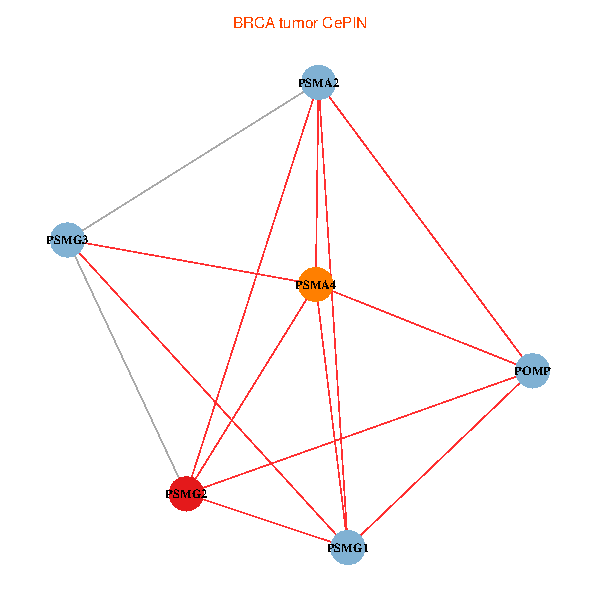
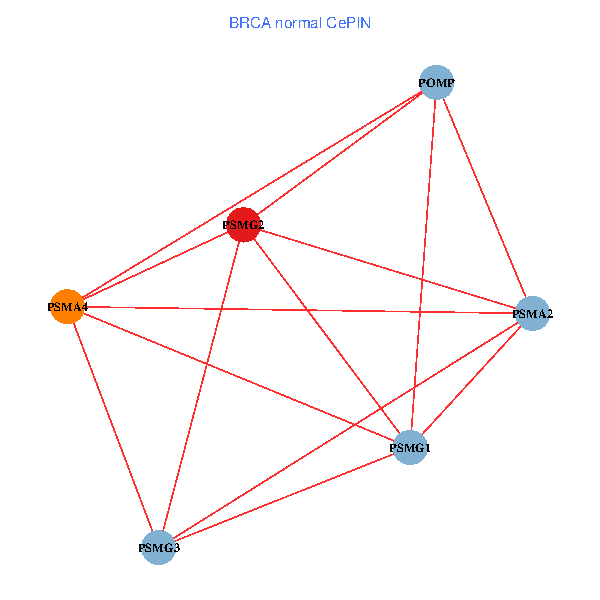
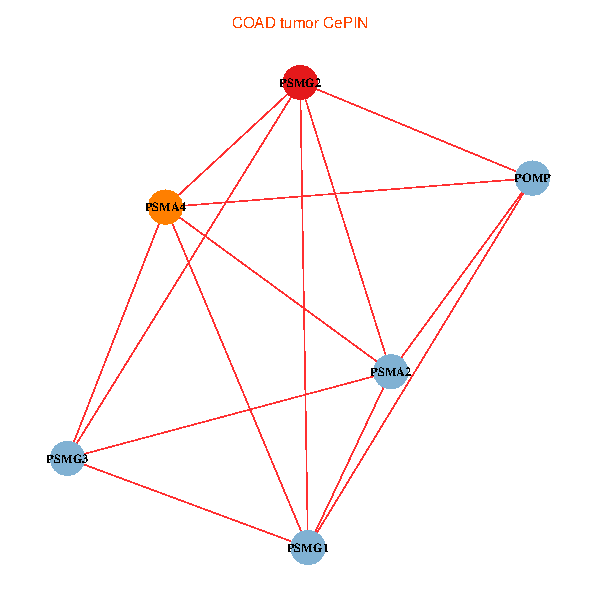
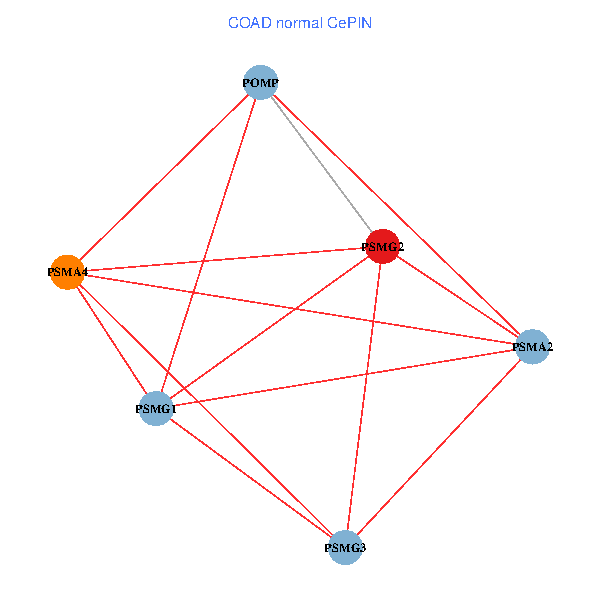
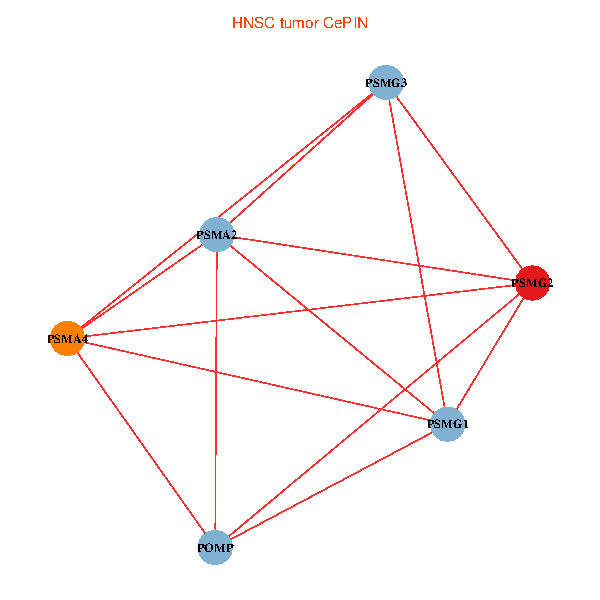
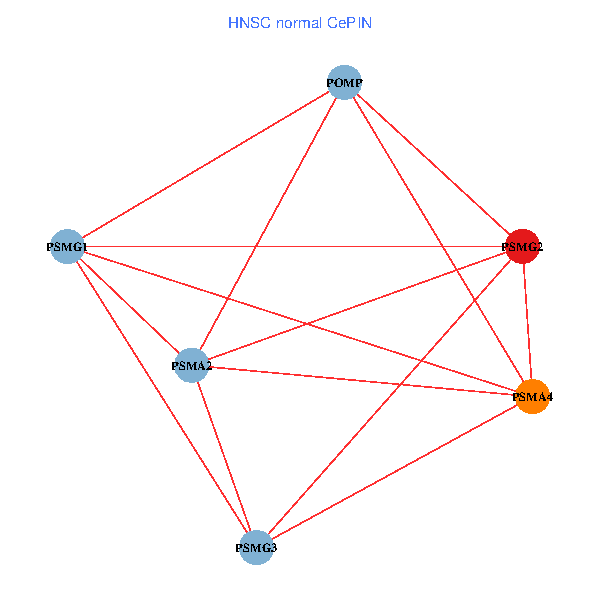
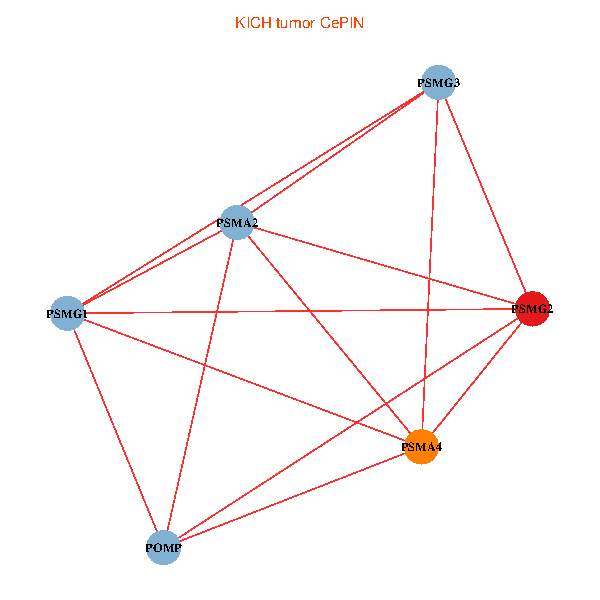
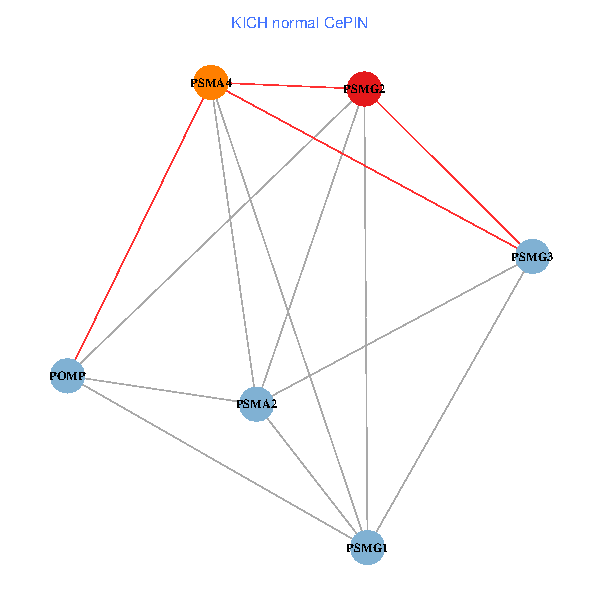
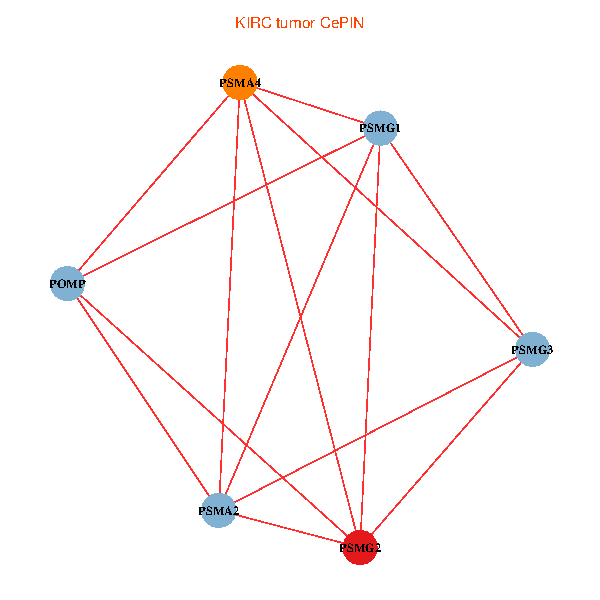
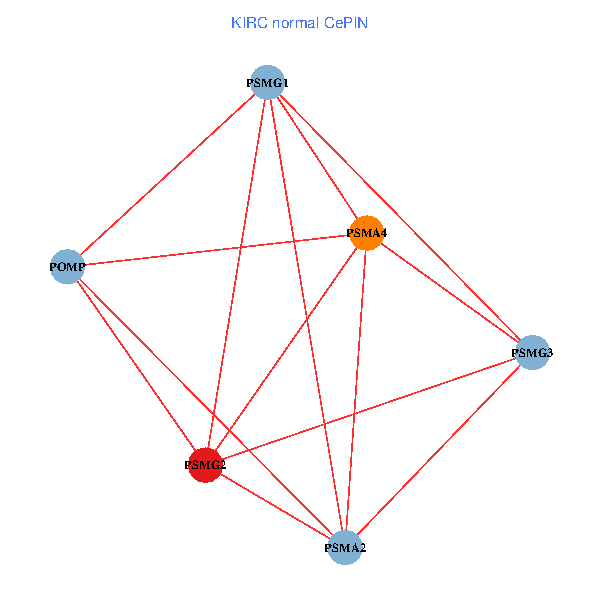
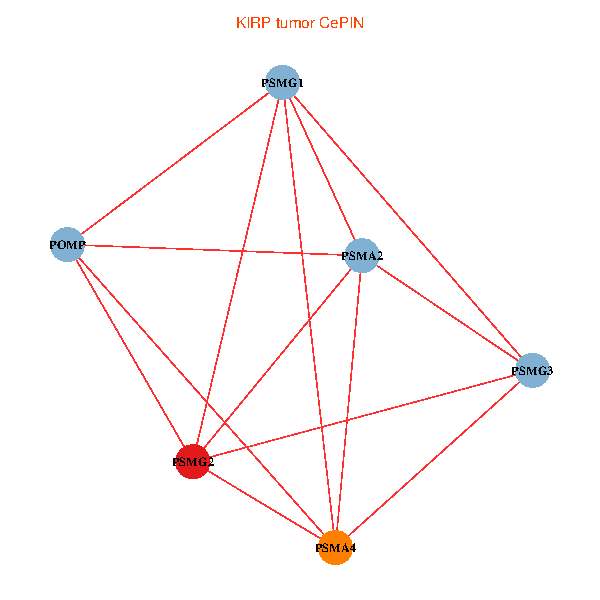
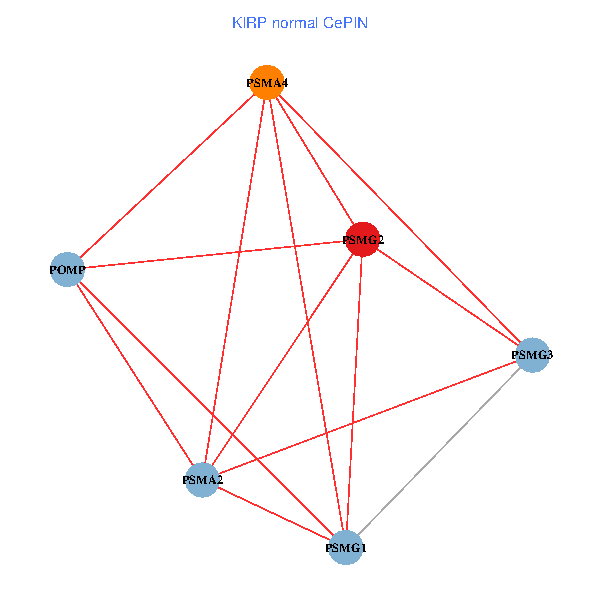
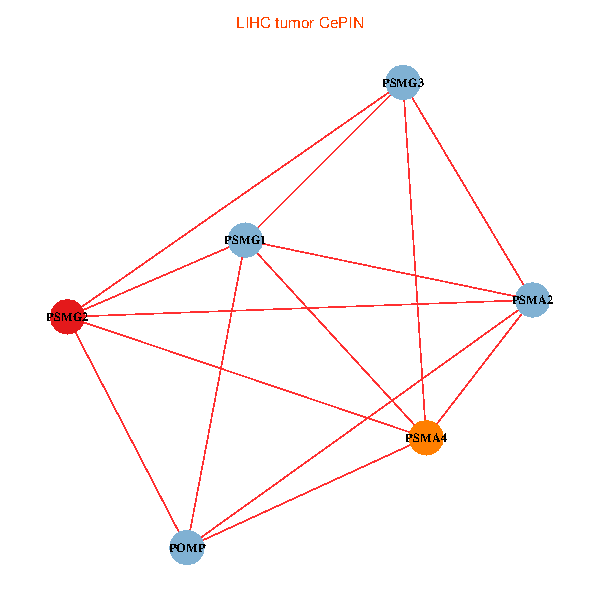
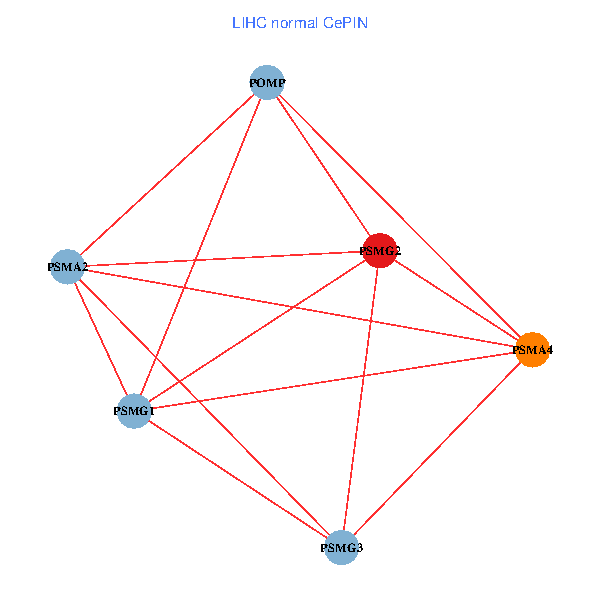
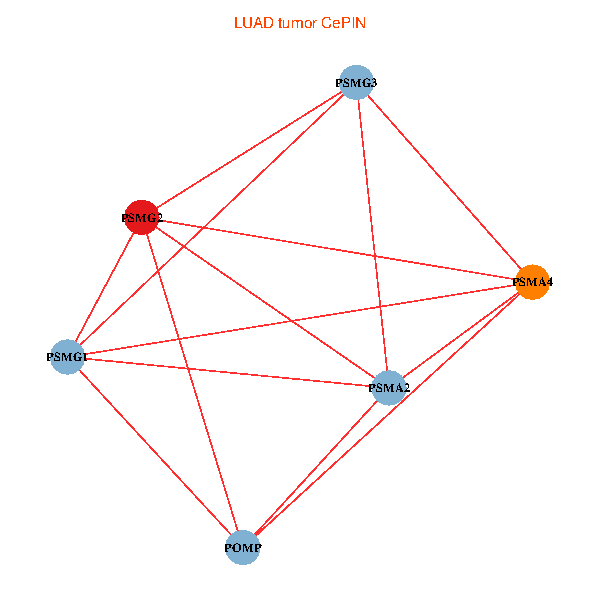
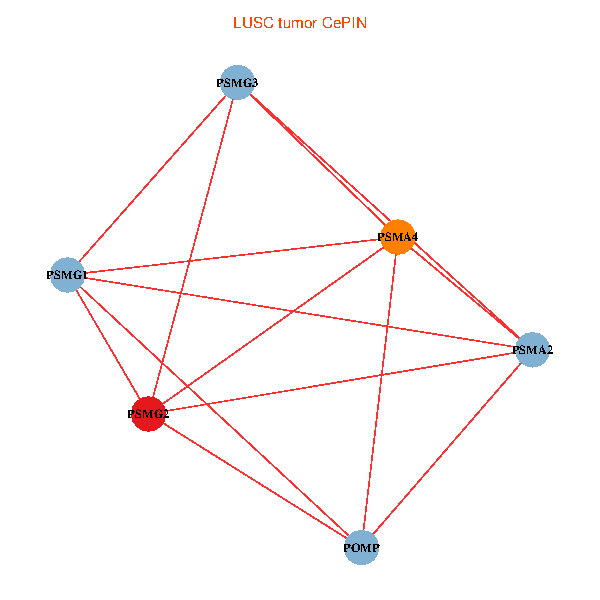
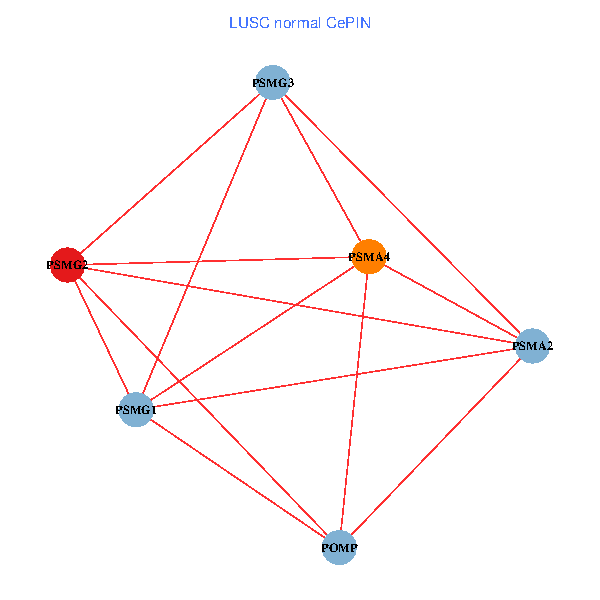
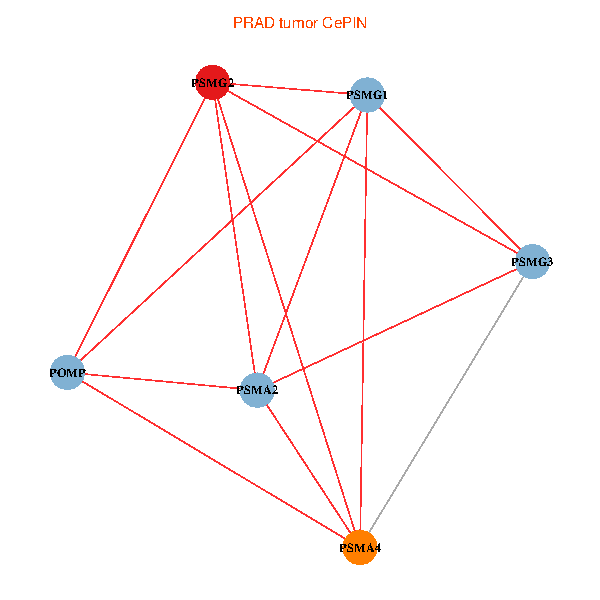
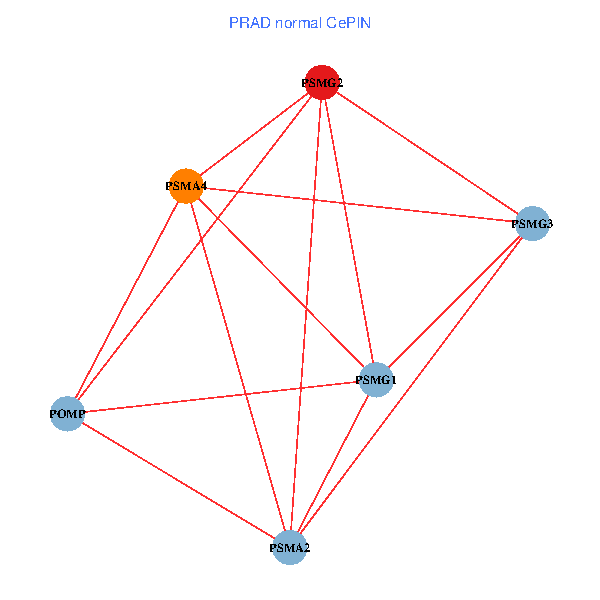
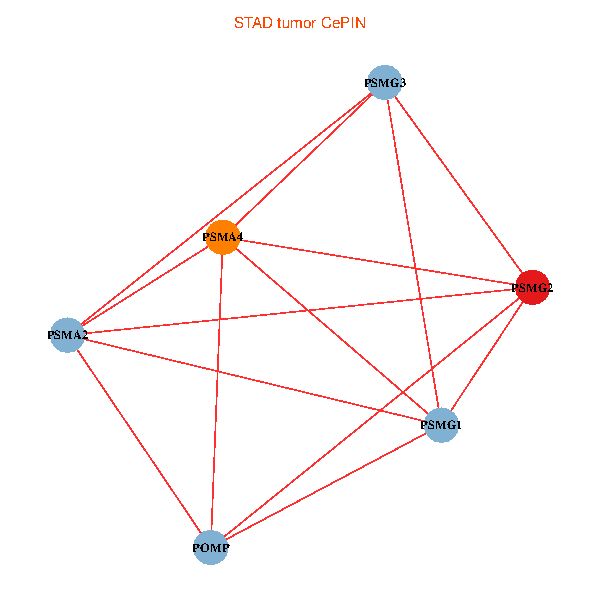
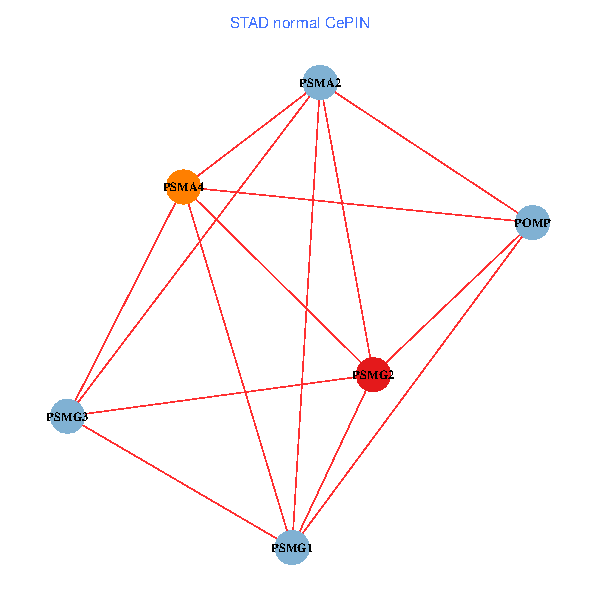
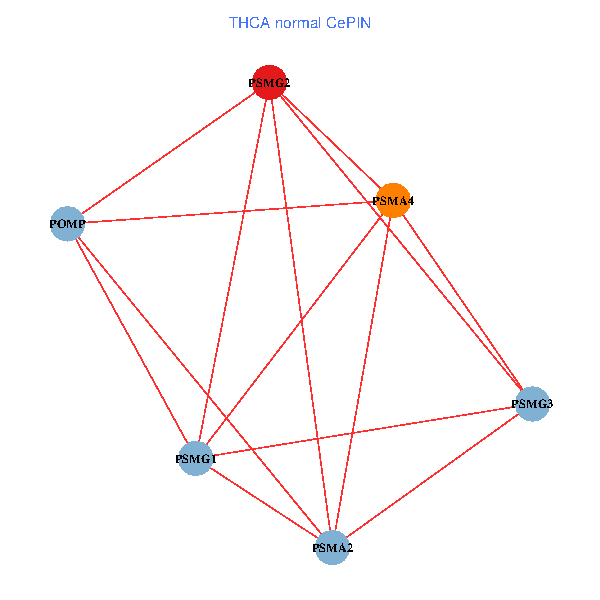
| Co-expressed gene networks based on protein-protein interaction data (CePIN) (TCGA IlluminaHiSeq_RNASeqV2, pan-cancer normalized log2(norm_counts+1) data, version 2016-08-16) (PINA2 ppi data) |
| BRCA (tumor) | BRCA (normal) |
| PSMG2, POMP, PSMA2, PSMG1, PSMA4, PSMG3 (tumor) | PSMG2, POMP, PSMA2, PSMG1, PSMA4, PSMG3 (normal) |
 |  |
| COAD (tumor) | COAD (normal) |
| PSMG2, POMP, PSMA2, PSMG1, PSMA4, PSMG3 (tumor) | PSMG2, POMP, PSMA2, PSMG1, PSMA4, PSMG3 (normal) |
 |  |
| HNSC (tumor) | HNSC (normal) |
| PSMG2, POMP, PSMA2, PSMG1, PSMA4, PSMG3 (tumor) | PSMG2, POMP, PSMA2, PSMG1, PSMA4, PSMG3 (normal) |
 |  |
| KICH (tumor) | KICH (normal) |
| PSMG2, POMP, PSMA2, PSMG1, PSMA4, PSMG3 (tumor) | PSMG2, POMP, PSMA2, PSMG1, PSMA4, PSMG3 (normal) |
 |  |
| KIRC (tumor) | KIRC (normal) |
| PSMG2, POMP, PSMA2, PSMG1, PSMA4, PSMG3 (tumor) | PSMG2, POMP, PSMA2, PSMG1, PSMA4, PSMG3 (normal) |
 |  |
| KIRP (tumor) | KIRP (normal) |
| PSMG2, POMP, PSMA2, PSMG1, PSMA4, PSMG3 (tumor) | PSMG2, POMP, PSMA2, PSMG1, PSMA4, PSMG3 (normal) |
 |  |
| LIHC (tumor) | LIHC (normal) |
| PSMG2, POMP, PSMA2, PSMG1, PSMA4, PSMG3 (tumor) | PSMG2, POMP, PSMA2, PSMG1, PSMA4, PSMG3 (normal) |
 |  |
| LUAD (tumor) | LUAD (normal) |
| PSMG2, POMP, PSMA2, PSMG1, PSMA4, PSMG3 (tumor) | PSMG2, POMP, PSMA2, PSMG1, PSMA4, PSMG3 (normal) |
 |  |
| LUSC (tumor) | LUSC (normal) |
| PSMG2, POMP, PSMA2, PSMG1, PSMA4, PSMG3 (tumor) | PSMG2, POMP, PSMA2, PSMG1, PSMA4, PSMG3 (normal) |
 |  |
| PRAD (tumor) | PRAD (normal) |
| PSMG2, POMP, PSMA2, PSMG1, PSMA4, PSMG3 (tumor) | PSMG2, POMP, PSMA2, PSMG1, PSMA4, PSMG3 (normal) |
 |  |
| STAD (tumor) | STAD (normal) |
| PSMG2, POMP, PSMA2, PSMG1, PSMA4, PSMG3 (tumor) | PSMG2, POMP, PSMA2, PSMG1, PSMA4, PSMG3 (normal) |
 |  |
| THCA (tumor) | THCA (normal) |
| PSMG2, POMP, PSMA2, PSMG1, PSMA4, PSMG3 (tumor) | PSMG2, POMP, PSMA2, PSMG1, PSMA4, PSMG3 (normal) |
 |  |
| Top |
| TissGeneProg for PSMG2 |
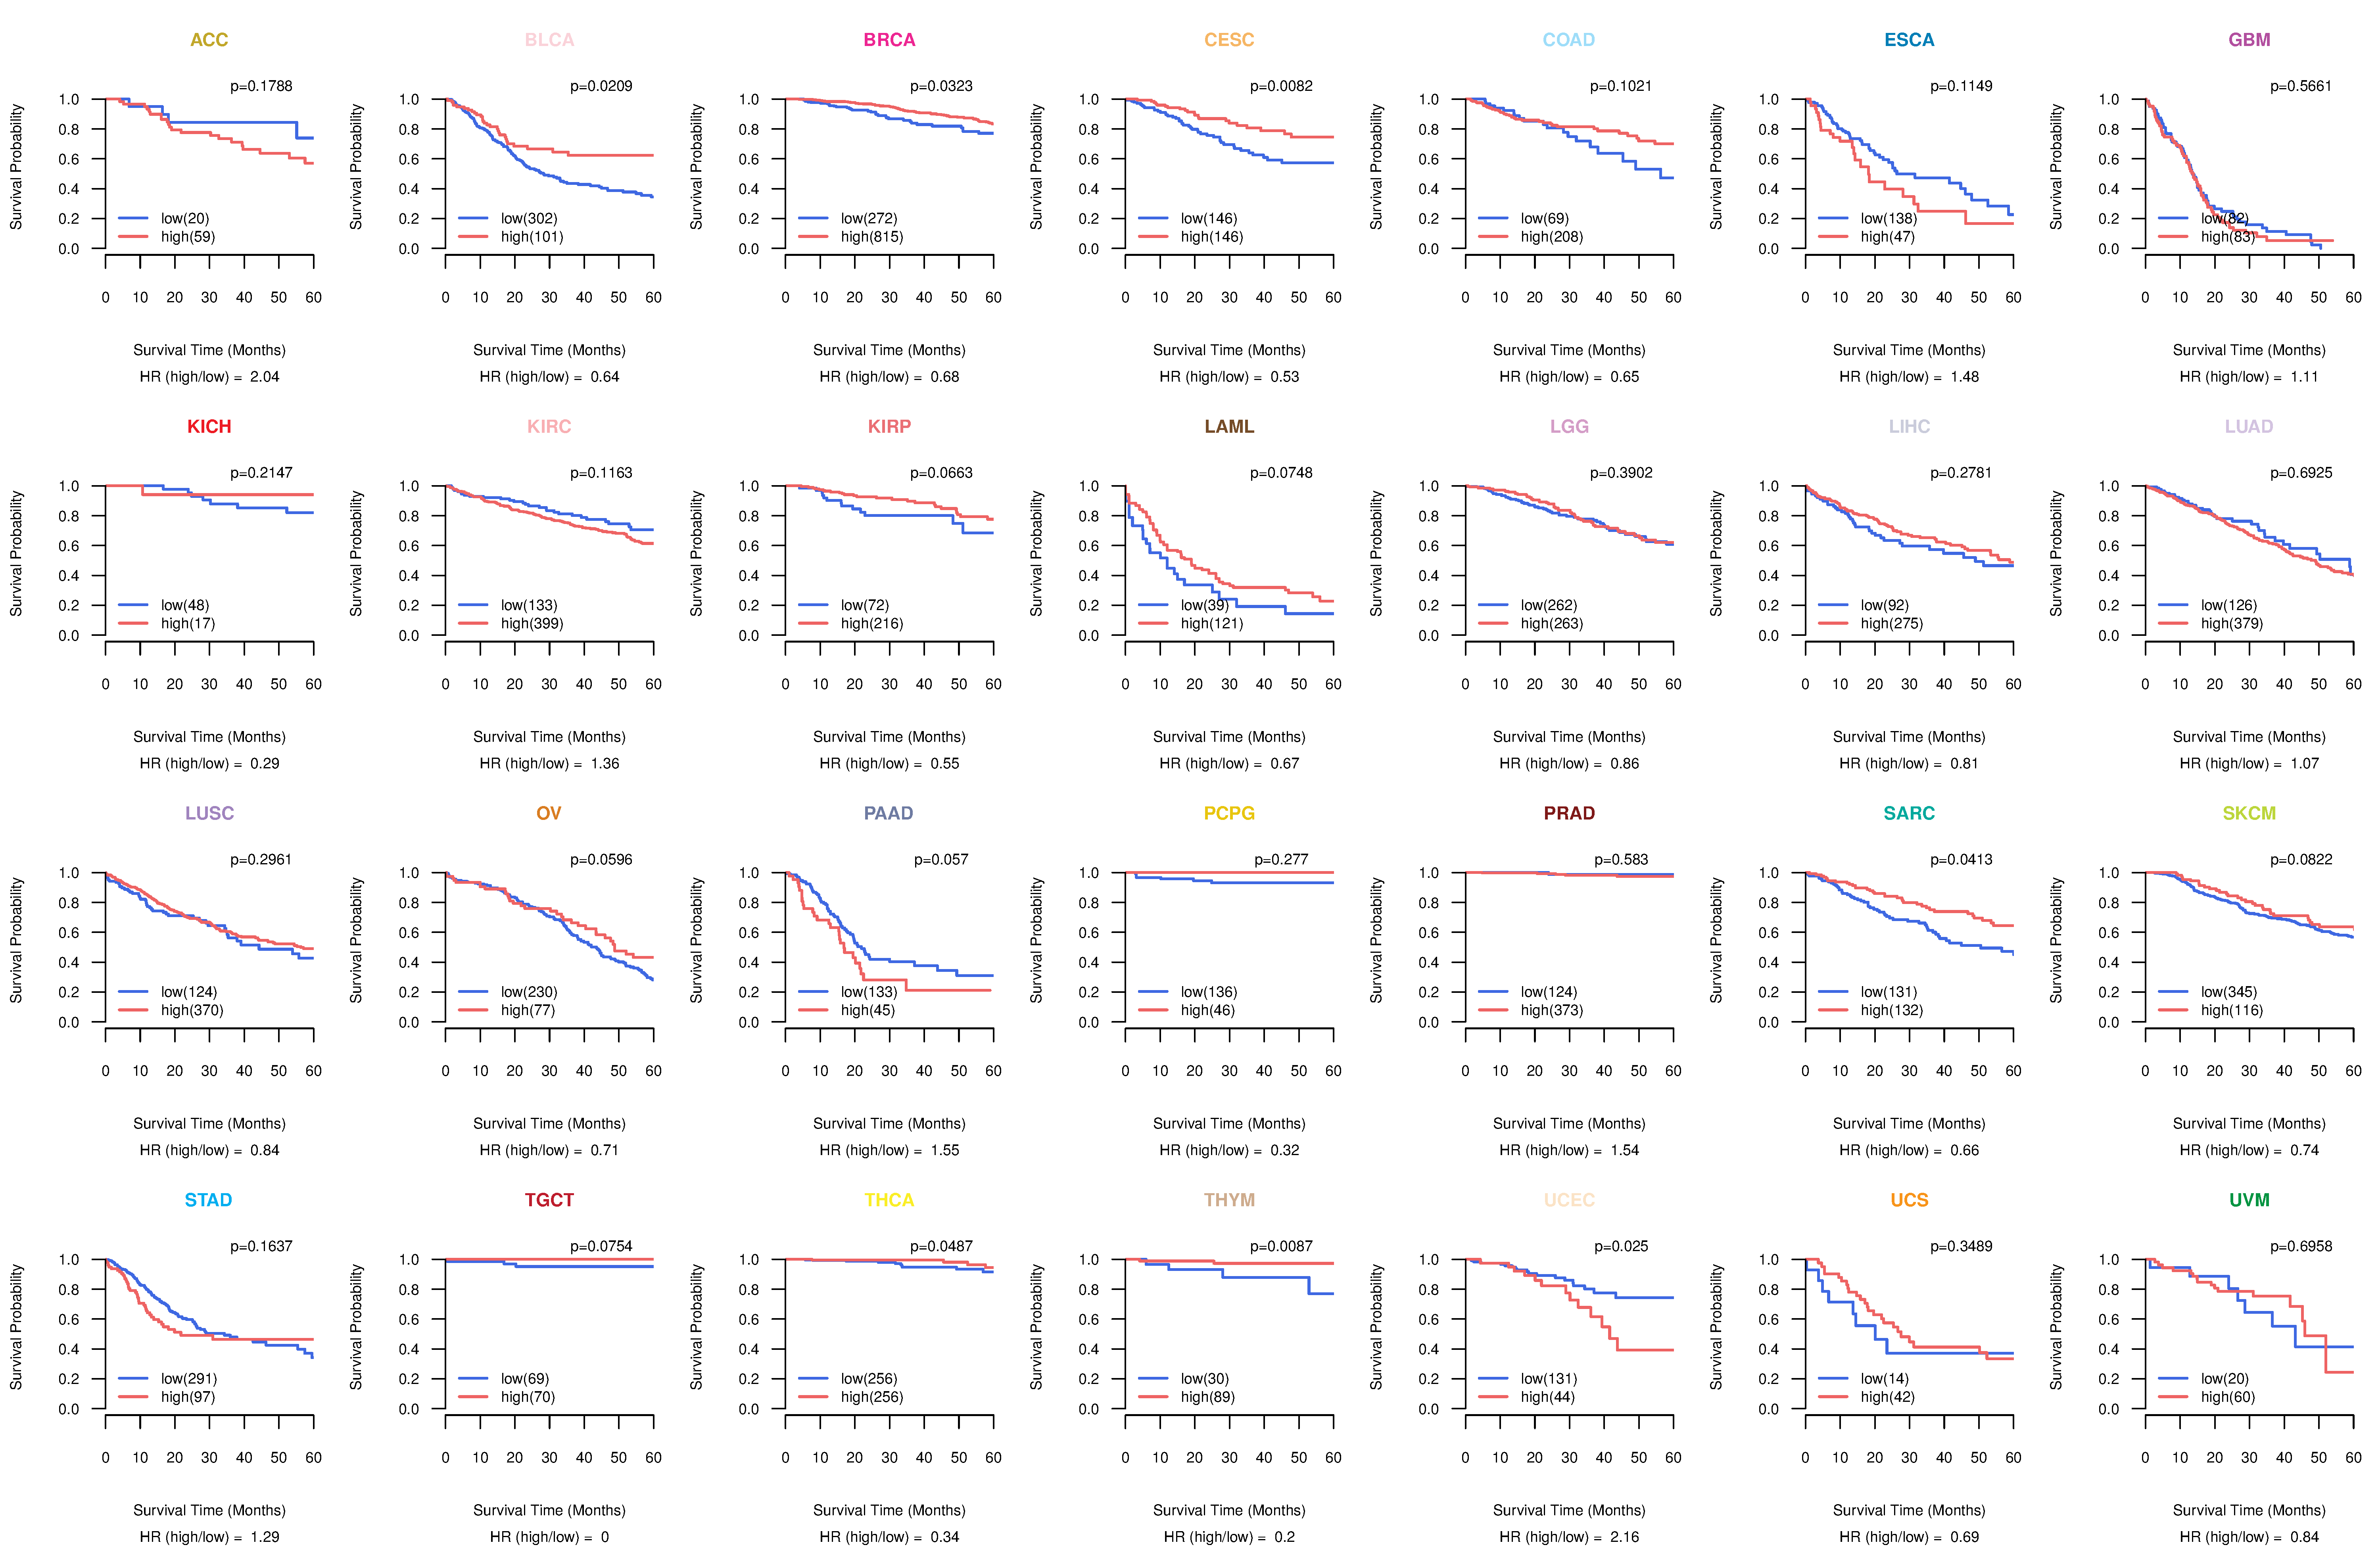
| Kaplan-Meier plots with logrank tests of overall survival (OS) using 28 cancer types (TCGA IlluminaHiSeq_RNASeqV2, pan-cancer normalized log2(norm_counts+1) data, version 2016-08-16) (TCGA clinicalMatrix, phenotype data, version 2016-04-27) * Click on the image to enlarge it in a new window. |
 |
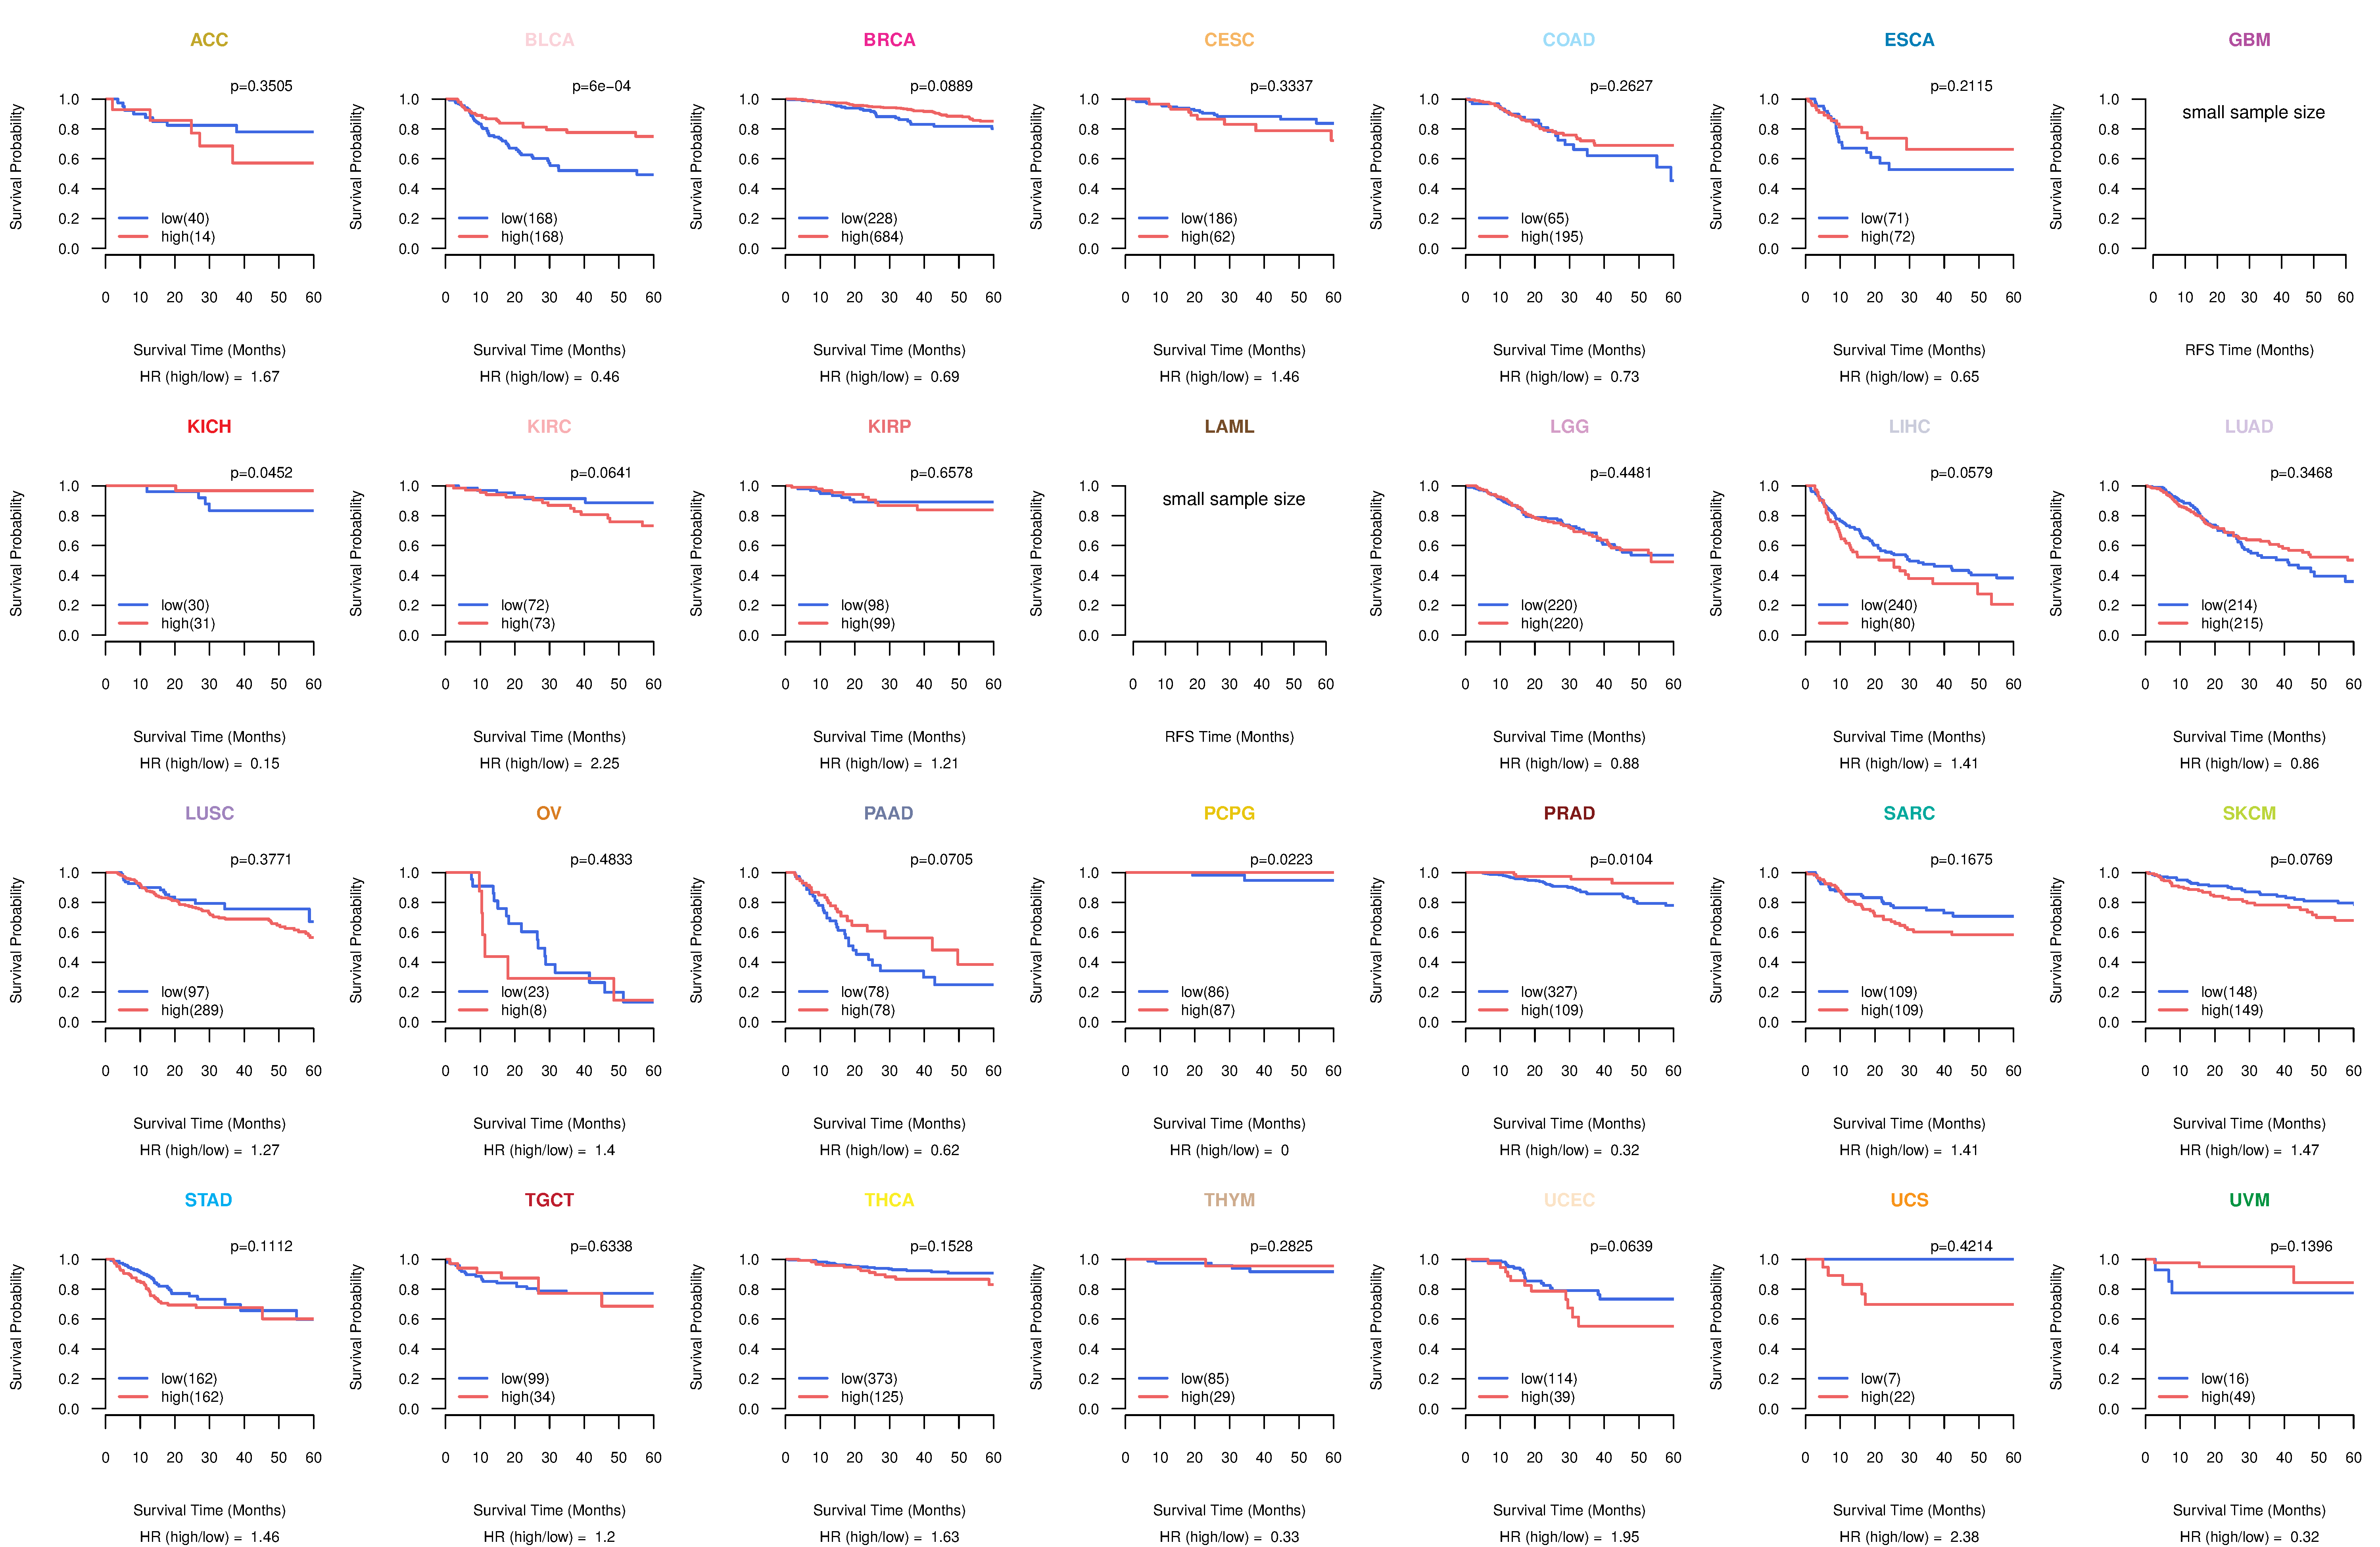
| Kaplan-Meier plots with logrank test of relapse free survival (RFS) using 28 cancer types (TCGA IlluminaHiSeq_RNASeqV2, pan-cancer normalized log2(norm_counts+1) data, version 2016-08-16) (TCGA clinicalMatrix, phenotype data, version 2016-04-27) * Click on the image enlarge it in a new window. |
 |
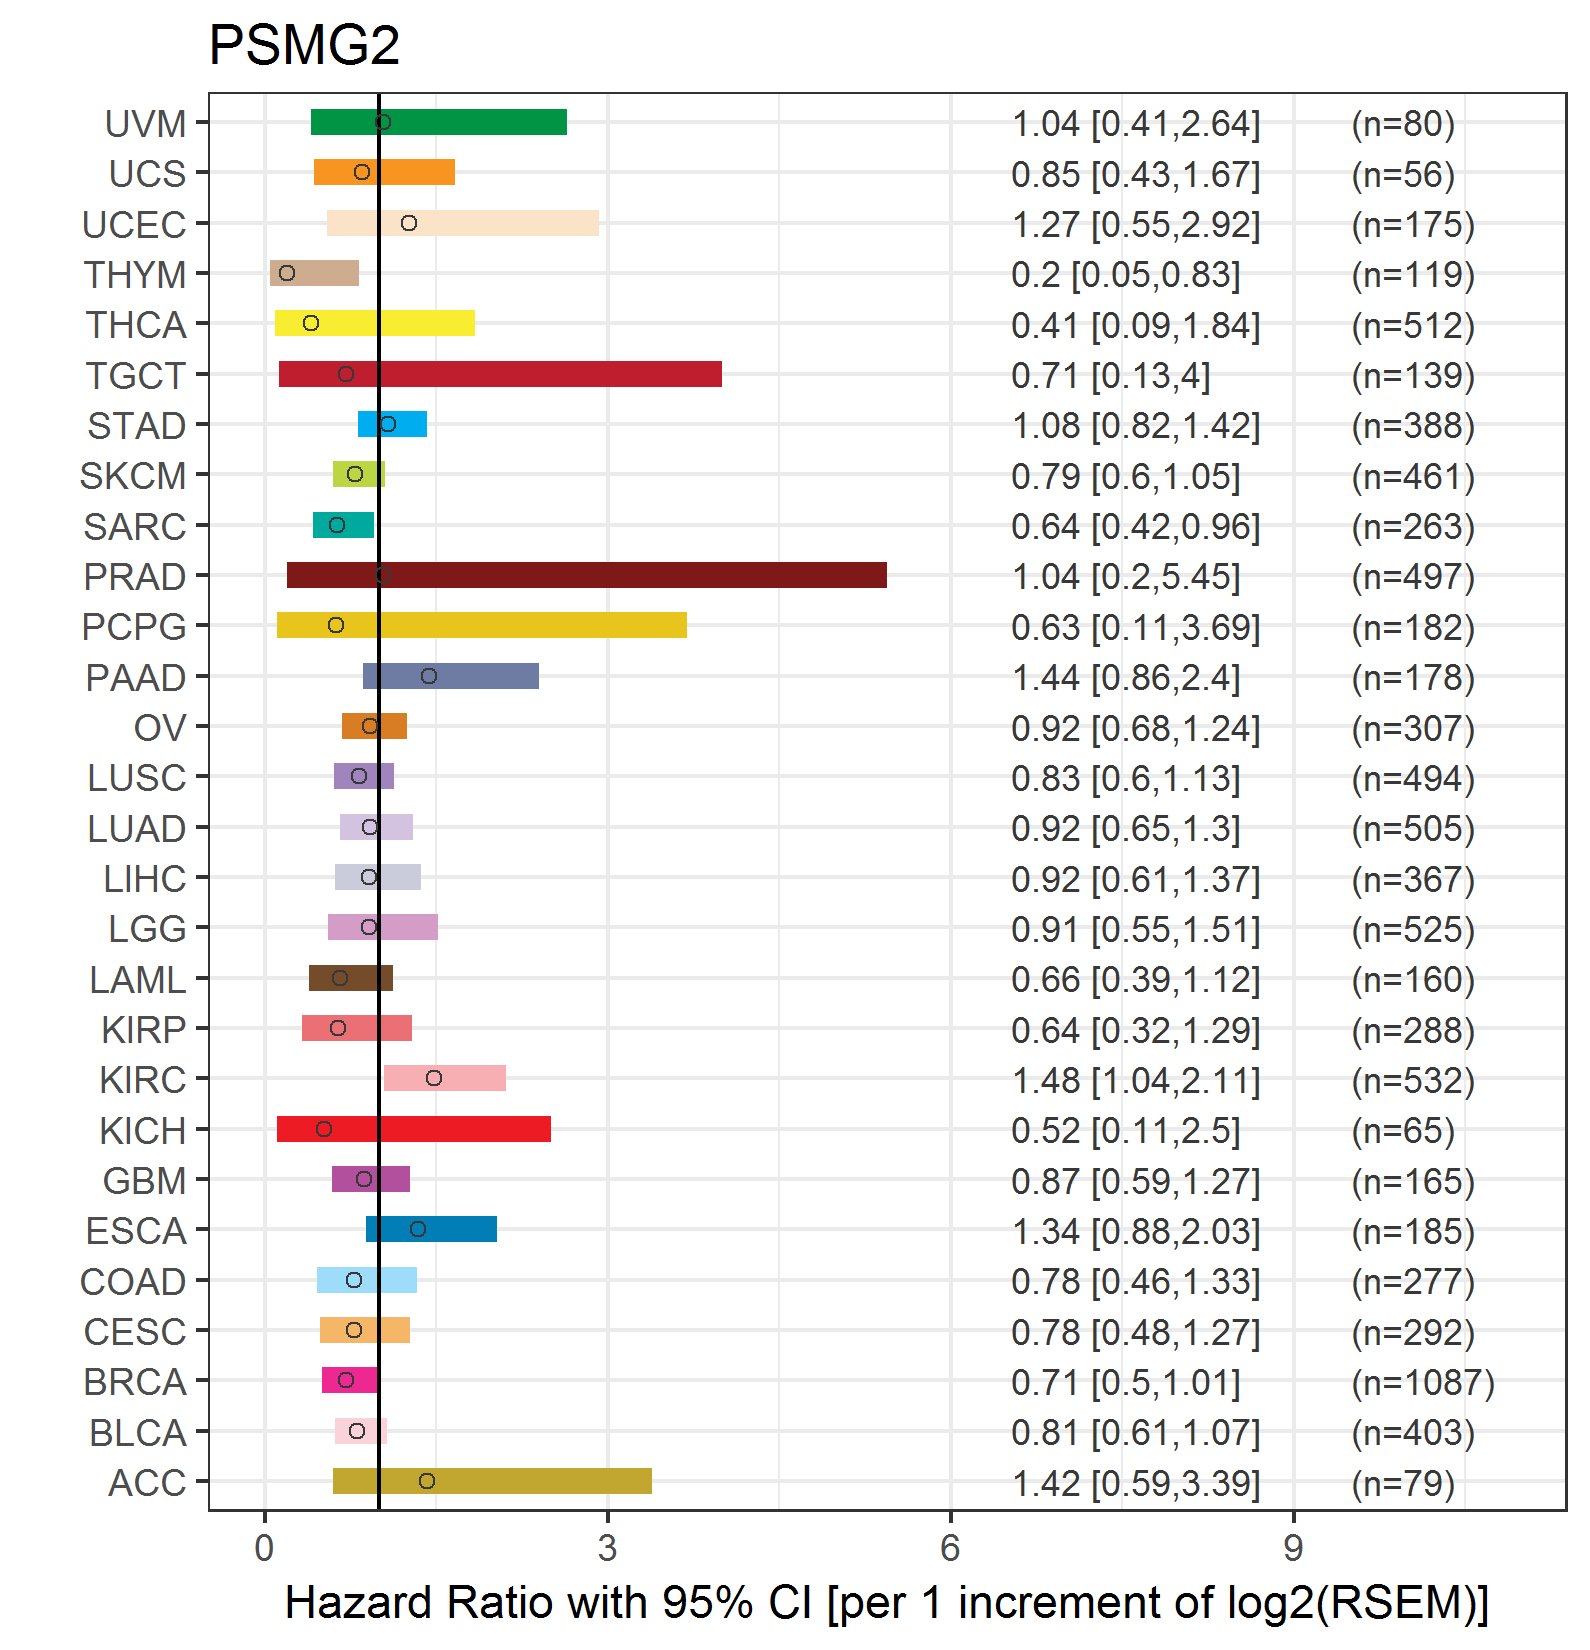
| Forest plot of Cox proportional hazard ratio (HR) and 95% CI of overall survival (OS) using 28 cancer types (TCGA IlluminaHiSeq_RNASeqV2, pan-cancer normalized log2(norm_counts+1) data, version 2016-08-16) (TCGA clinicalMatrix, phenotype data, version 2016-04-27) * Click on the image enlarge it in a new window. |
 |
| Forest plot of Cox proportional hazard ratio (HR) and 95% CI of relapse free survival (RFS) using 28 cancer types (TCGA IlluminaHiSeq_RNASeqV2, pan-cancer normalized log2(norm_counts+1) data, version 2016-08-16) (TCGA clinicalMatrix, phenotype data, version 2016-04-27) * Click on the image enlarge it in a new window. |
 |
| Top |
| TissGeneClin for PSMG2 |
| TissGeneDrug for PSMG2 |
| Drug information targeting TissGene (DrugBank Version 5.0.6, 2017-04-01) |
| DrugBank ID | Drug name | Drug activity | Drug type | Drug status |
| Top |
| TissGeneDisease for PSMG2 |
| Disease information associated with TissGene (DisGeNet, 2016-06-01) |
| Disease ID | Disease name | # pubmeds | Source |
| umls:C0010346 | Crohn Disease | 3 | GAD |
| umls:C0011854 | Diabetes Mellitus, Insulin-Dependent | 3 | GAD |
| umls:C0019348 | Herpes Simplex Infections | 1 | BeFree |
| umls:C0023903 | Liver neoplasms | 1 | LHGDN |
| umls:C0024141 | Lupus Erythematosus, Systemic | 1 | GAD |
|
Copyright 2016-Present - The University of Texas Health Science Center at Houston (UTHealth) Web File Viewing | How to Report, Fraud, Waste and Abuse | State of Texas | Statewide Search | Texas Homeland Security | Site Policies |