 |
| |
| |
| |
| |
| |
| |
|

| TissGeneSummary for PTGER1 |
 Gene summary Gene summary |
| Basic gene information | Gene symbol | PTGER1 |
| Gene name | prostaglandin E receptor 1 (subtype EP1), 42kDa | |
| Synonyms | EP1 | |
| Cytomap | UCSC genome browser: 19p13.1 | |
| Type of gene | protein-coding | |
| RefGenes | NM_000955.2, | |
| Description | PGE receptor EP1 subtypePGE receptor, EP1 subtypePGE2 receptor EP1 subtypeprostaglandin E receptor 1 (subtype EP1), 42kDprostaglandin E receptor 1, subtype EP1prostaglandin E2 receptor EP1 subtypeprostanoid EP1 receptor | |
| Modification date | 20141207 | |
| dbXrefs | MIM : 176802 | |
| HGNC : HGNC | ||
| Ensembl : ENSG00000160951 | ||
| HPRD : 08903 | ||
| Vega : OTTHUMG00000039610 | ||
| Protein | UniProt: go to UniProt's Cross Reference DB Table | |
| Expression | CleanEX: HS_PTGER1 | |
| BioGPS: 5731 | ||
| Pathway | NCI Pathway Interaction Database: PTGER1 | |
| KEGG: PTGER1 | ||
| REACTOME: PTGER1 | ||
| Pathway Commons: PTGER1 | ||
| Context | iHOP: PTGER1 | |
| ligand binding site mutation search in PubMed: PTGER1 | ||
| UCL Cancer Institute: PTGER1 | ||
| Assigned class in TissGDB* | C | |
| Included tissue-specific gene expression resources | TiGER,GTEx | |
| Specific-tissues in normal samples (assigned by TissGDB using HPA, TiGER, and GTEx) | Kidney | |
| Cancer types related to the specific-tissues in cancer samples (assigned by TissGDB using TCGA) | KIRC,KIRP,KICH | |
| Reference showing the relevant tissue of PTGER1 | ||
| Description by TissGene annotations | ||
| * Class A consists of genes with literature evidence and is part of the cTissGenes. Class B consists of only cTissGenes without additional evidence. The remaining genes belong to Class C. |
| Gene ontology having evidence of Inferred from Direct Assay (IDA) from Entrez |
| GO ID | GO term | PubMed ID |
| Top |
| TissGeneExp for PTGER1 |
| Gene expressions across 28 cancer types (X-axis: cancer type and Y-axis: log2(norm_counts+1)) (TCGA IlluminaHiSeq_RNASeqV2, pan-cancer normalized log2(norm_counts+1) data, version 2016-08-16) |
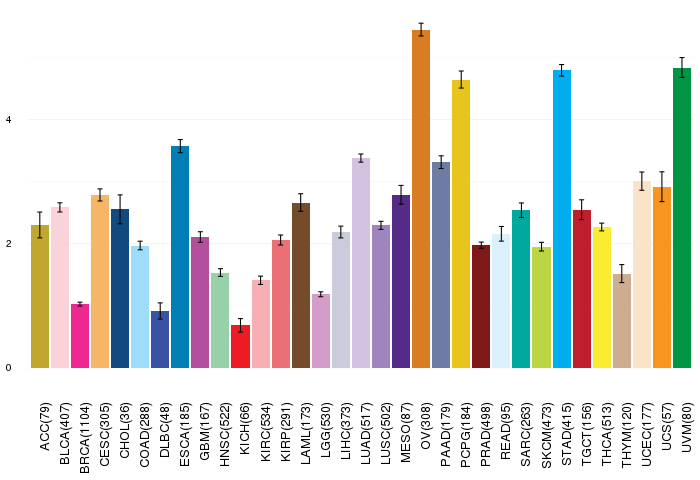 |
| Gene isoform expressions across 28 cancer types (X-axis: cancer type and Y-axis: log2(norm_counts+1)) (TCGA pan-cancer tcga_rsem_isoform_tpm, version 2016-09-01) |
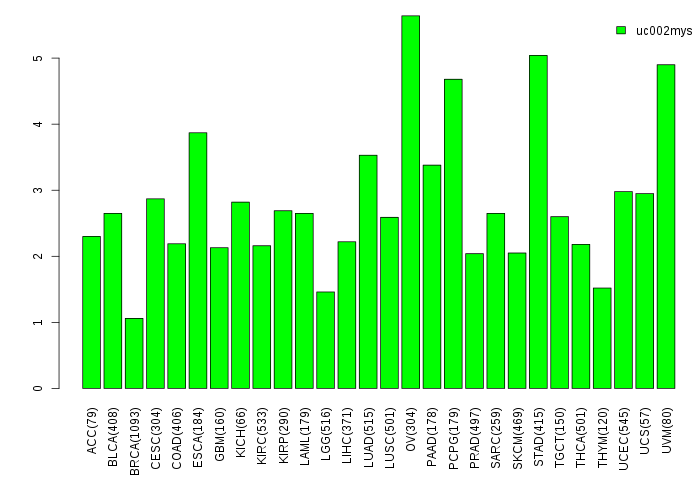 |
| Gene expressions across normal tissues of GTEx data (GTEx GTEx_Analysis_v6_RNA-seq_RNA-SeQCv1.1.8_gene_rpkm.gct) - Here, we shows the matched tissue types only among our 28 cancer types. |
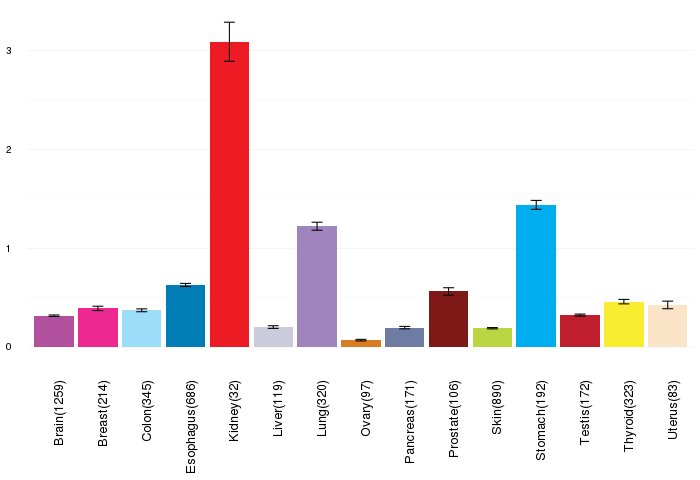 |
| Different expressions across 14 cancer types with more than 10 samples between matched tumors and normals (X-axis: cancer type and Y-axis: log2(norm_counts+1)) (TCGA IlluminaHiSeq_RNASeqV2, pan-cancer normalized log2(norm_counts+1) data, version 2016-08-16) |
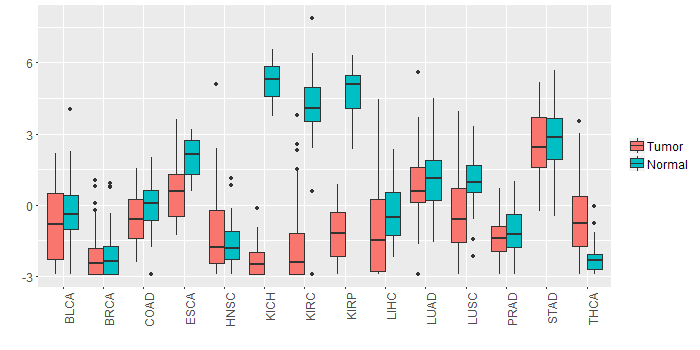 |
| - Significantly differentially expressed cancer types and information. (|Fold change|>1 and FDR<0.05) |
| Cancer type | Mean(exp) in tumor | Mean(exp) in matched normal | Log2FC | P-val. | FDR |
| KIRP | -1.194125344 | 4.835571531 | -6.029696875 | 3.12E-31 | 9.99E-29 |
| KICH | -2.295181469 | 5.170310531 | -7.465492 | 4.36E-35 | 9.61E-32 |
| THCA | -0.620902621 | -2.289773808 | 1.668871186 | 6.64E-12 | 5.19E-11 |
| LUSC | -0.430463273 | 1.039036727 | -1.4695 | 1.54E-07 | 4.25E-07 |
| KIRC | -1.787620135 | 4.143632643 | -5.931252778 | 3.30E-51 | 3.28E-49 |
| Top |
| TissGene-miRNA for PTGER1 |
| Significantly anti-correlated miRNAs of TissGene across 28 cancer types (Gene-miRNA relations from TargetScanHuman Relsease 7.1, Conserved_Site_Context_Scores.txt.zip, 06.01.2016) (TCGA IlluminaHiSeq_miRNASeq, log2(RPM+1) data, version 2016-11-21) (TCGA IlluminaHiSeq_RNASeqV2, log2(normalized_count+1) data, version 2016-08-16) (Spearman’s Rank Correlation (p-value<0.05 and coefficient<-0.25)) |
| Cancer type | miRNA id | miRNA accession | P-val. | Coeff. | # samples |
| Top |
| TissGeneMut for PTGER1 |
| TissGeneSNV for PTGER1 |
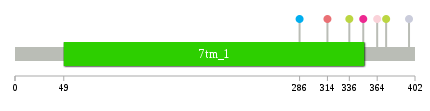
| nsSNV counts per each loci. Different colors of circles represent different cancer types. Circle size denotes number of samples. (TCGA somatic mutation (SNPs and small INDELs) data, version 2016-04-25) * Click on the image to enlarge it in a new window. |
 |
 |
| Somatic nucleotide variants of TissGene across 28 cancer types (X-axis: cancer type and Y-axis: % of mutated samples) The numbers in parentheses are numbers of samples with mutation (nsSNVs). (TCGA somatic mutation (SNPs and small INDELs) data, version 2016-04-25) |
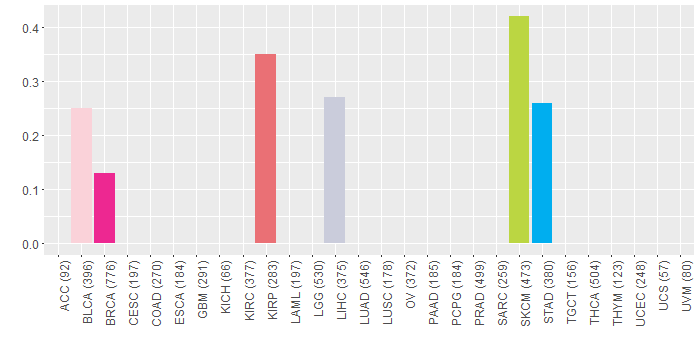 |
| - nsSNVs sorted by frequency. |
| AAchange | Cancer type | # samples |
| p.K373Q | SKCM | 1 |
| p.H396Q | LIHC | 1 |
| p.A336V | SKCM | 1 |
| p.R286C | STAD | 1 |
| p.R364C | BLCA | 1 |
| p.L314M | KIRP | 1 |
| p.V350M | BRCA | 1 |
| Top |
| TissGeneCNV for PTGER1 |
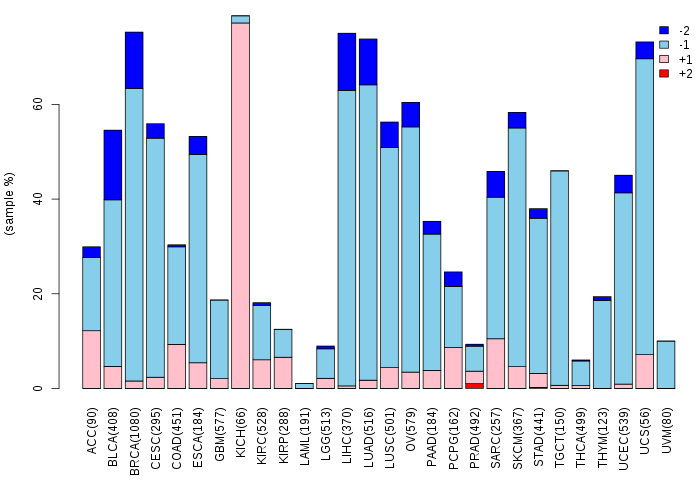
| Copy number variations of TissGene across 28 cancer types (X-axis: cancer type and Y-axis: % of CNV samples) (TCGA Gistic2_CopyNumber_Gistic2_all_data_by_genes, Gistic2 copy number data, version 2016-08-16) |
 |
| Top |
| TissGeneFusions for PTGER1 |
| Fusion genes including TissGene (ChimerDB 3.0, 2016-12-01 and TCGA fusion Portal 2015-12-01) |
| Database | Src | Cancer type | Sample | Fusion gene | ORF | 5'-gene BP | 3'-gene BP |
| Top |
| TissGeneNet for PTGER1 |
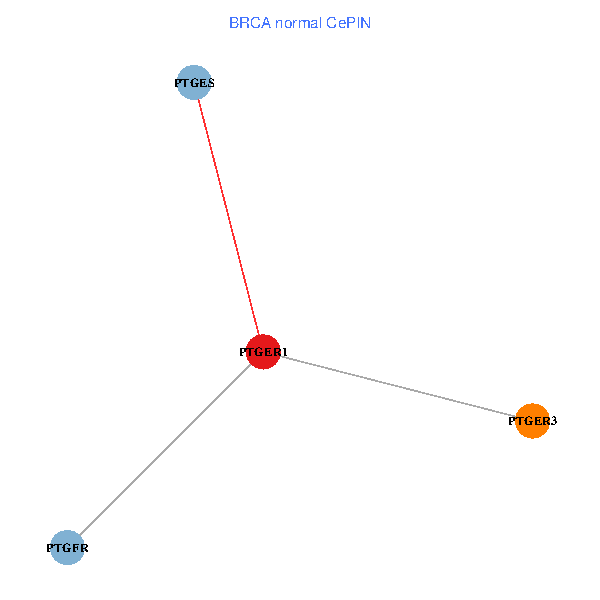
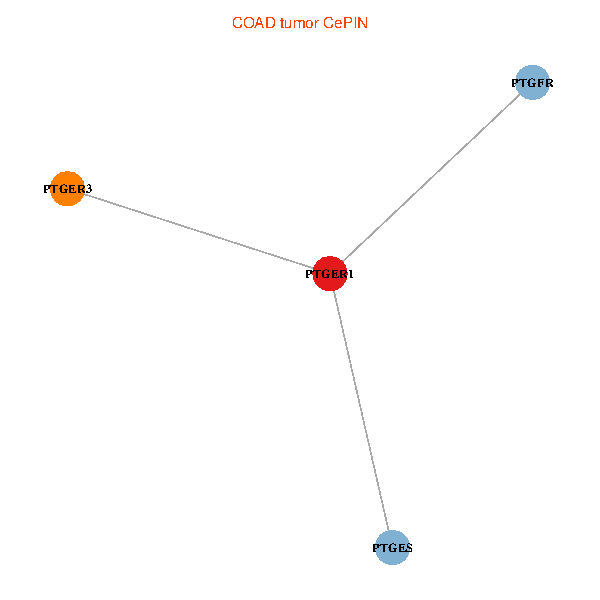
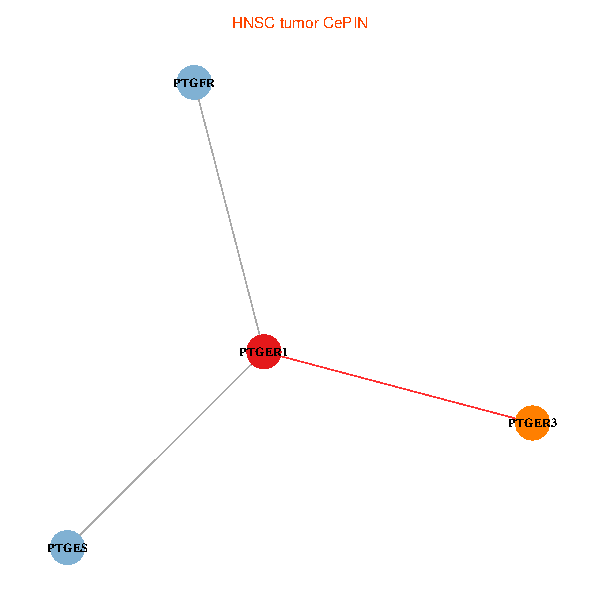
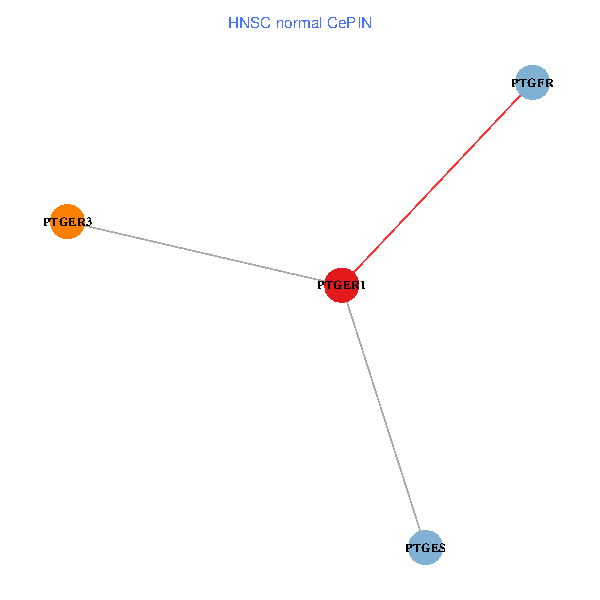
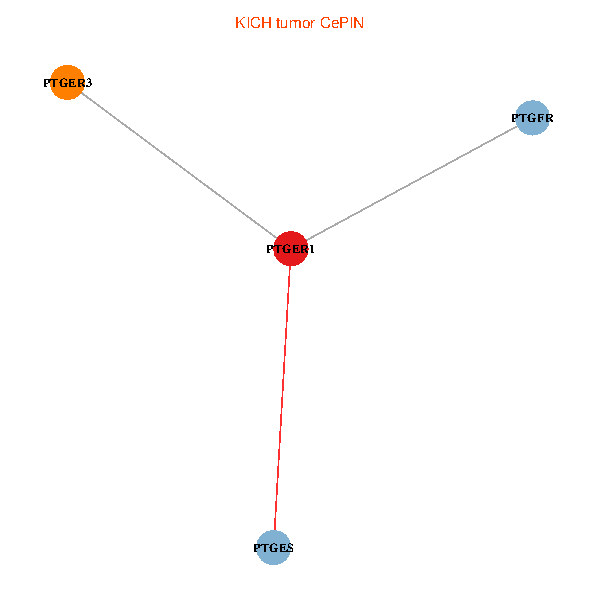
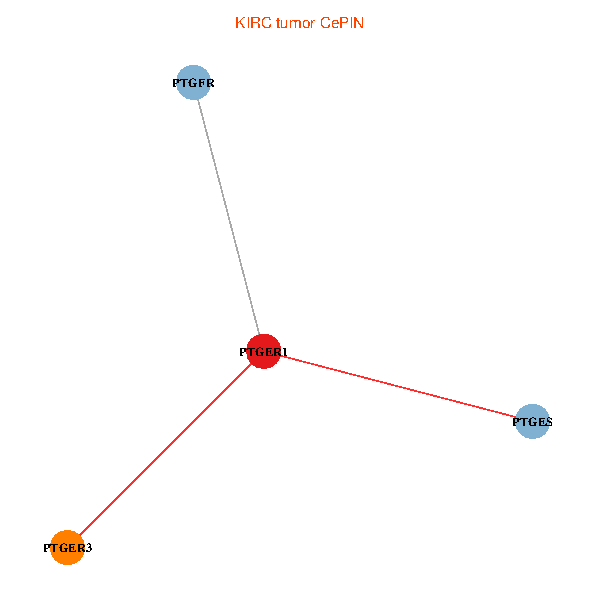
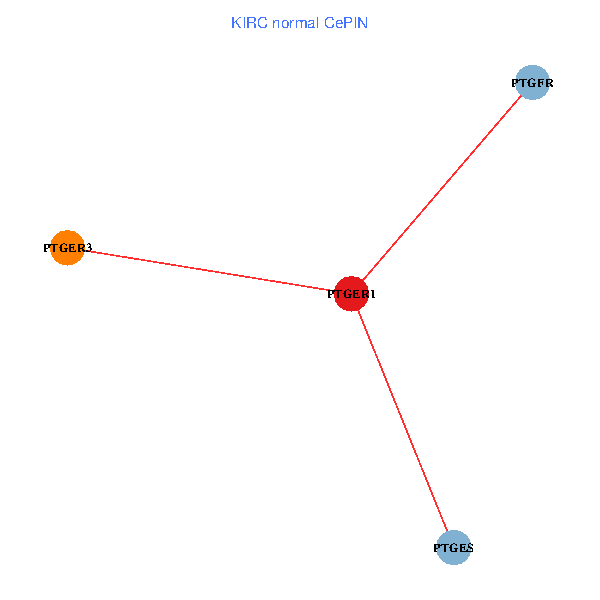
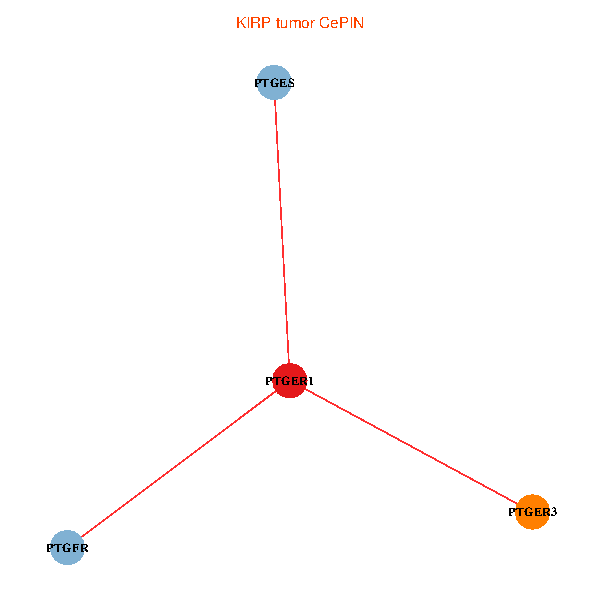
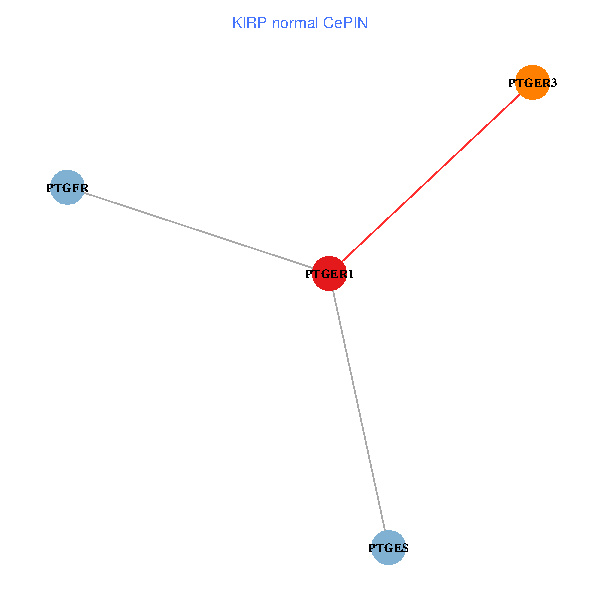
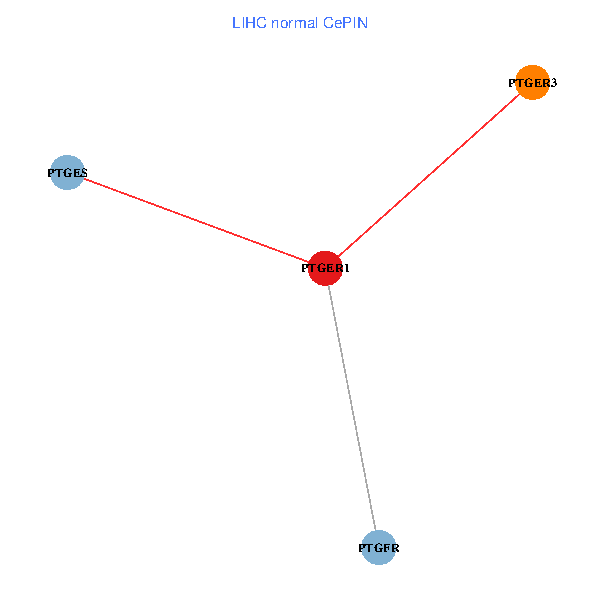
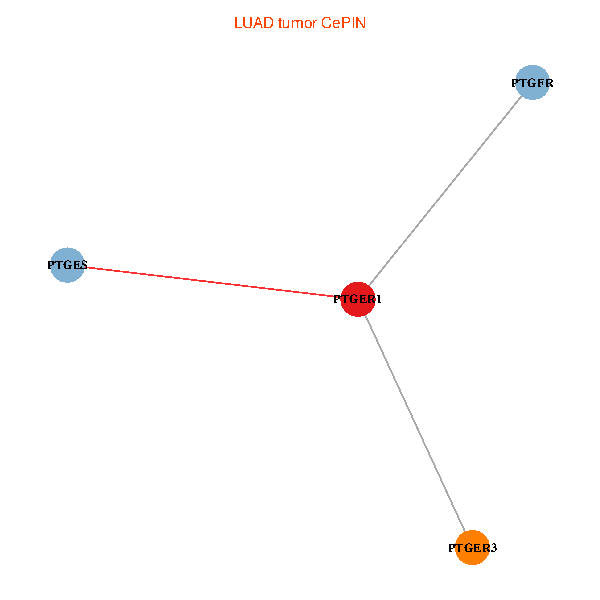
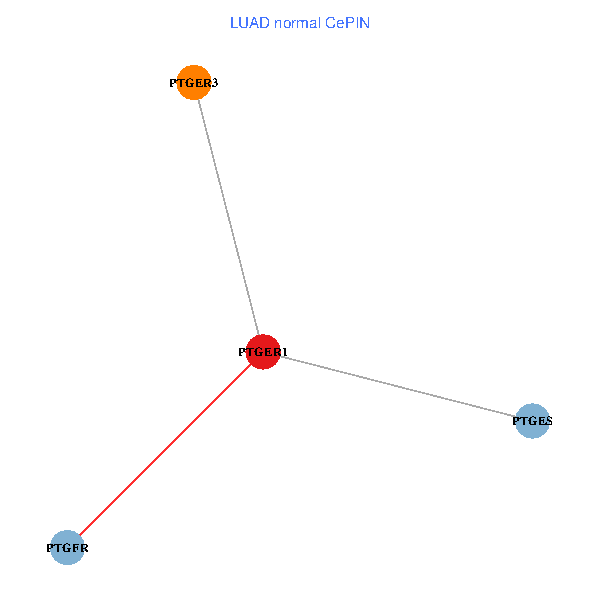
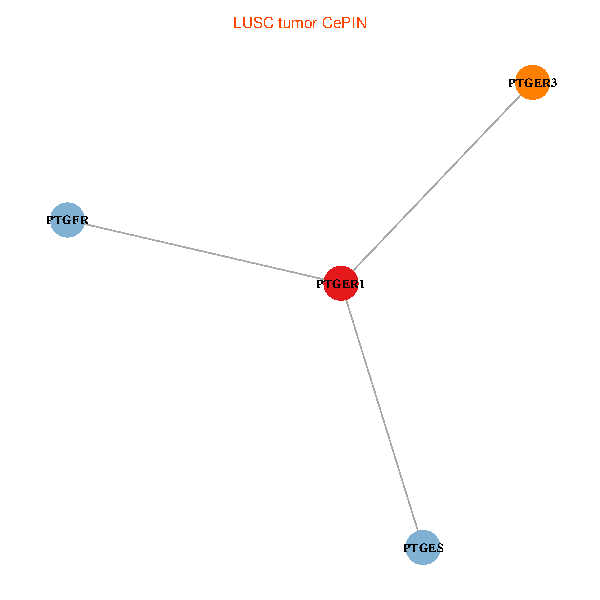
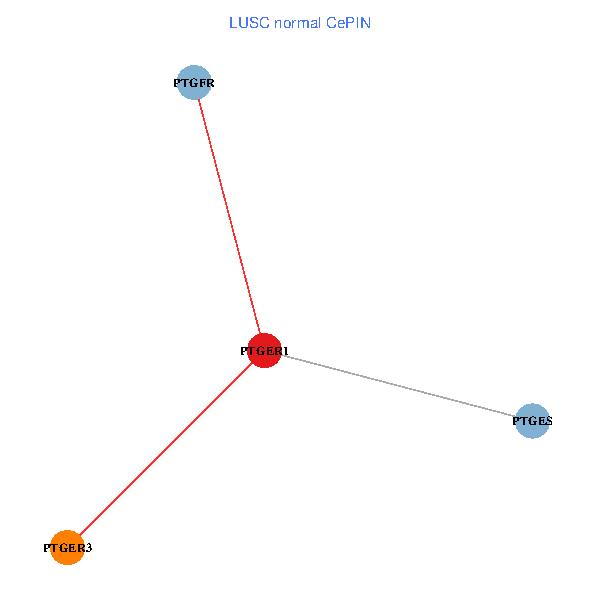
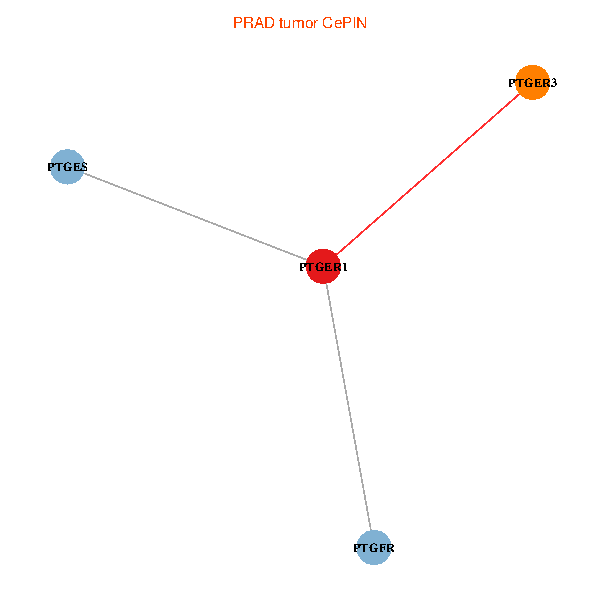
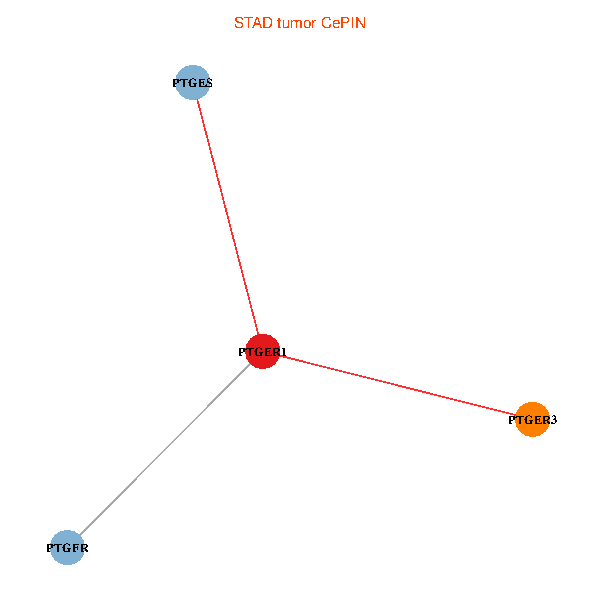
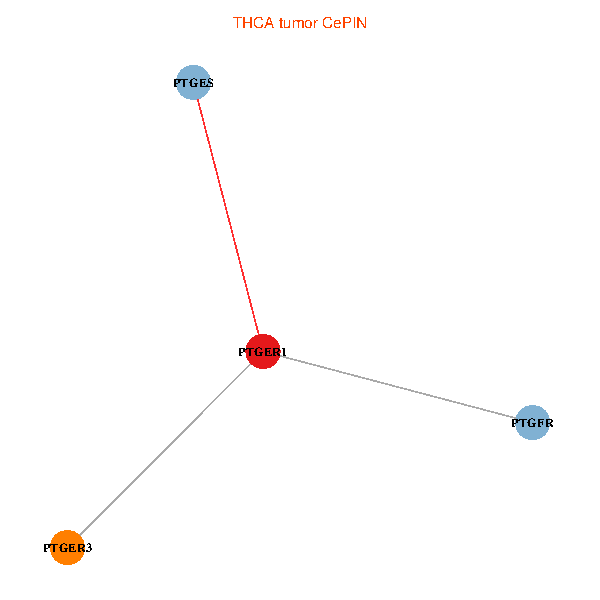
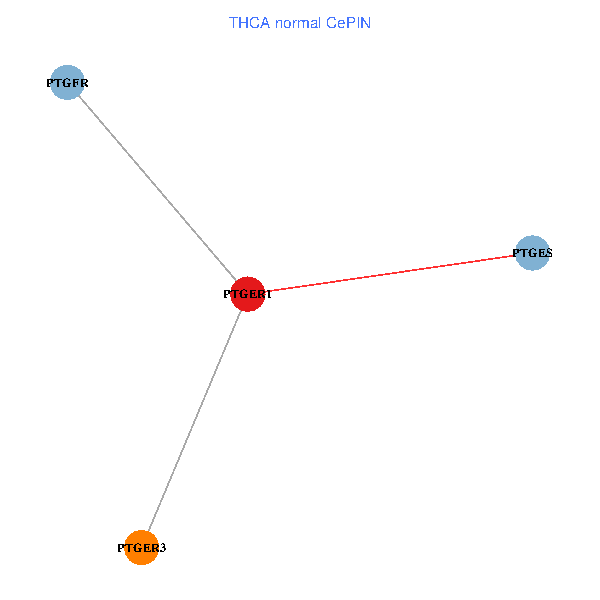
| Co-expressed gene networks based on protein-protein interaction data (CePIN) (TCGA IlluminaHiSeq_RNASeqV2, pan-cancer normalized log2(norm_counts+1) data, version 2016-08-16) (PINA2 ppi data) |
| BRCA (tumor) | BRCA (normal) |
| PTGER1, PTGFR, PTGES, PTGER3 (tumor) | PTGER1, PTGFR, PTGES, PTGER3 (normal) |
 |  |
| COAD (tumor) | COAD (normal) |
| PTGER1, PTGFR, PTGES, PTGER3 (tumor) | PTGER1, PTGFR, PTGES, PTGER3 (normal) |
 |  |
| HNSC (tumor) | HNSC (normal) |
| PTGER1, PTGFR, PTGES, PTGER3 (tumor) | PTGER1, PTGFR, PTGES, PTGER3 (normal) |
 |  |
| KICH (tumor) | KICH (normal) |
| PTGER1, PTGFR, PTGES, PTGER3 (tumor) | PTGER1, PTGFR, PTGES, PTGER3 (normal) |
 |  |
| KIRC (tumor) | KIRC (normal) |
| PTGER1, PTGFR, PTGES, PTGER3 (tumor) | PTGER1, PTGFR, PTGES, PTGER3 (normal) |
 |  |
| KIRP (tumor) | KIRP (normal) |
| PTGER1, PTGFR, PTGES, PTGER3 (tumor) | PTGER1, PTGFR, PTGES, PTGER3 (normal) |
 |  |
| LIHC (tumor) | LIHC (normal) |
| PTGER1, PTGFR, PTGES, PTGER3 (tumor) | PTGER1, PTGFR, PTGES, PTGER3 (normal) |
 |  |
| LUAD (tumor) | LUAD (normal) |
| PTGER1, PTGFR, PTGES, PTGER3 (tumor) | PTGER1, PTGFR, PTGES, PTGER3 (normal) |
 |  |
| LUSC (tumor) | LUSC (normal) |
| PTGER1, PTGFR, PTGES, PTGER3 (tumor) | PTGER1, PTGFR, PTGES, PTGER3 (normal) |
 |  |
| PRAD (tumor) | PRAD (normal) |
| PTGER1, PTGFR, PTGES, PTGER3 (tumor) | PTGER1, PTGFR, PTGES, PTGER3 (normal) |
 |  |
| STAD (tumor) | STAD (normal) |
| PTGER1, PTGFR, PTGES, PTGER3 (tumor) | PTGER1, PTGFR, PTGES, PTGER3 (normal) |
 |  |
| THCA (tumor) | THCA (normal) |
| PTGER1, PTGFR, PTGES, PTGER3 (tumor) | PTGER1, PTGFR, PTGES, PTGER3 (normal) |
 |  |
| Top |
| TissGeneProg for PTGER1 |
| Kaplan-Meier plots with logrank tests of overall survival (OS) using 28 cancer types (TCGA IlluminaHiSeq_RNASeqV2, pan-cancer normalized log2(norm_counts+1) data, version 2016-08-16) (TCGA clinicalMatrix, phenotype data, version 2016-04-27) * Click on the image to enlarge it in a new window. |
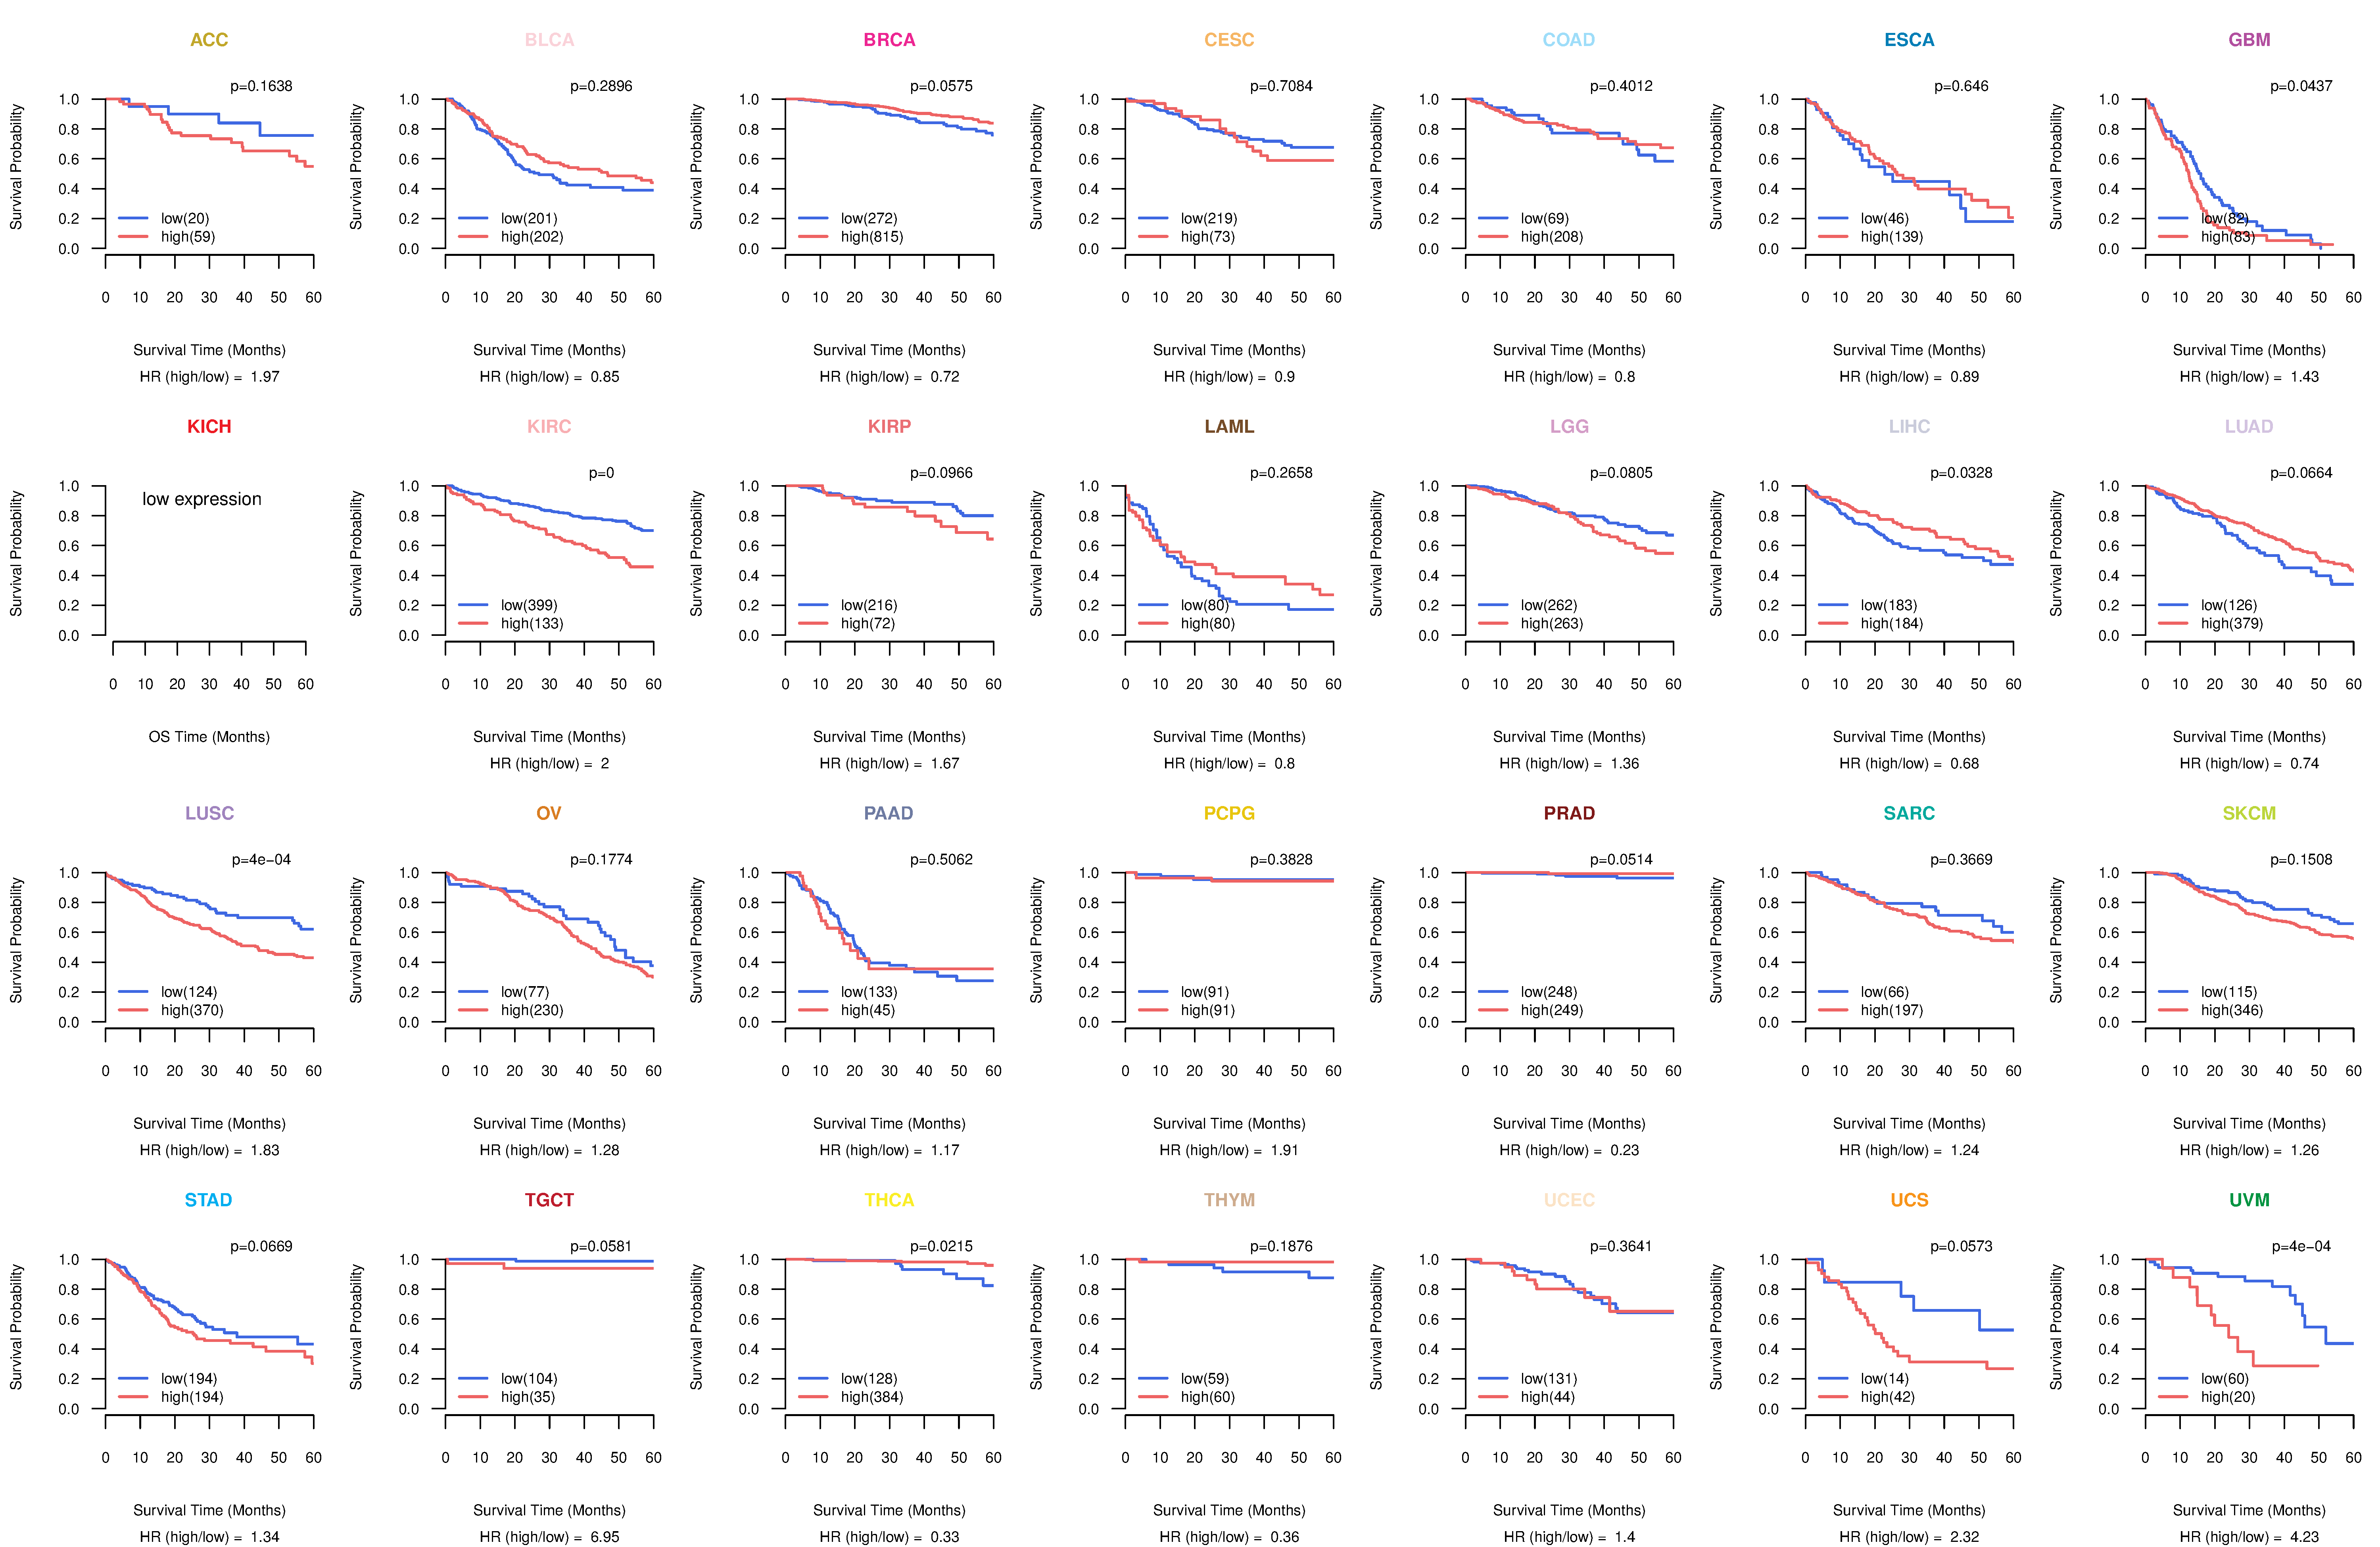 |
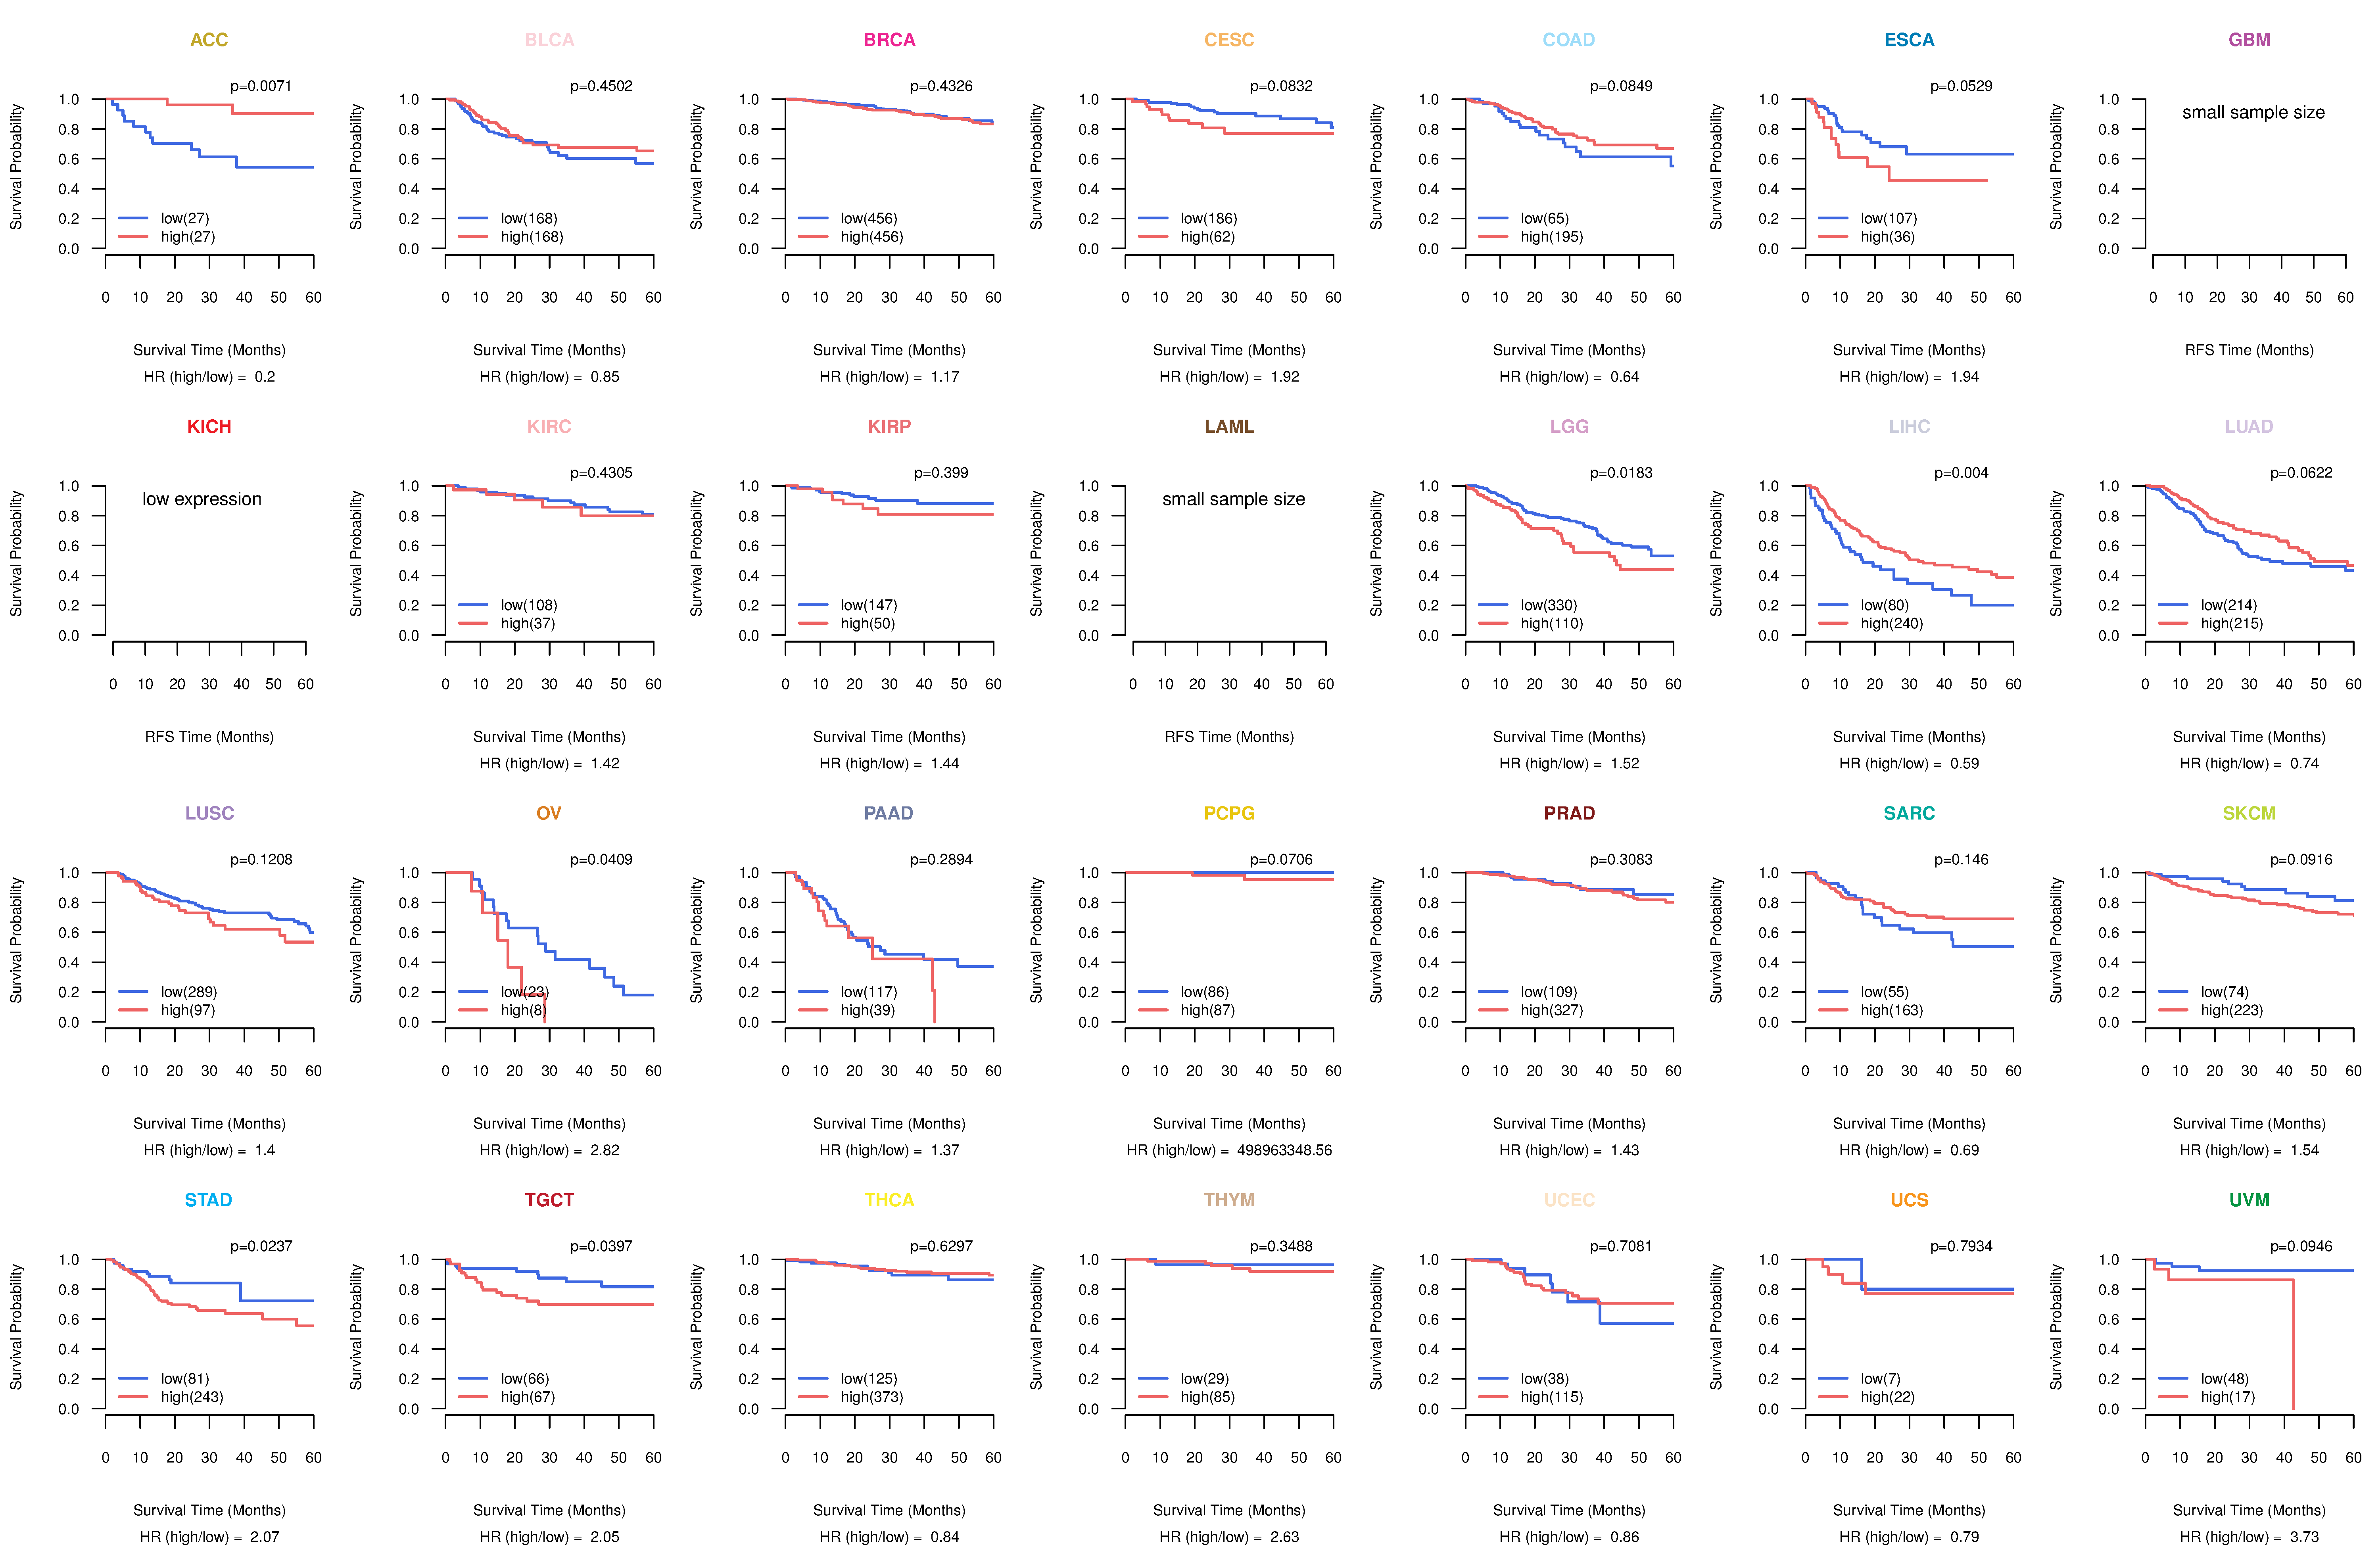
| Kaplan-Meier plots with logrank test of relapse free survival (RFS) using 28 cancer types (TCGA IlluminaHiSeq_RNASeqV2, pan-cancer normalized log2(norm_counts+1) data, version 2016-08-16) (TCGA clinicalMatrix, phenotype data, version 2016-04-27) * Click on the image enlarge it in a new window. |
 |
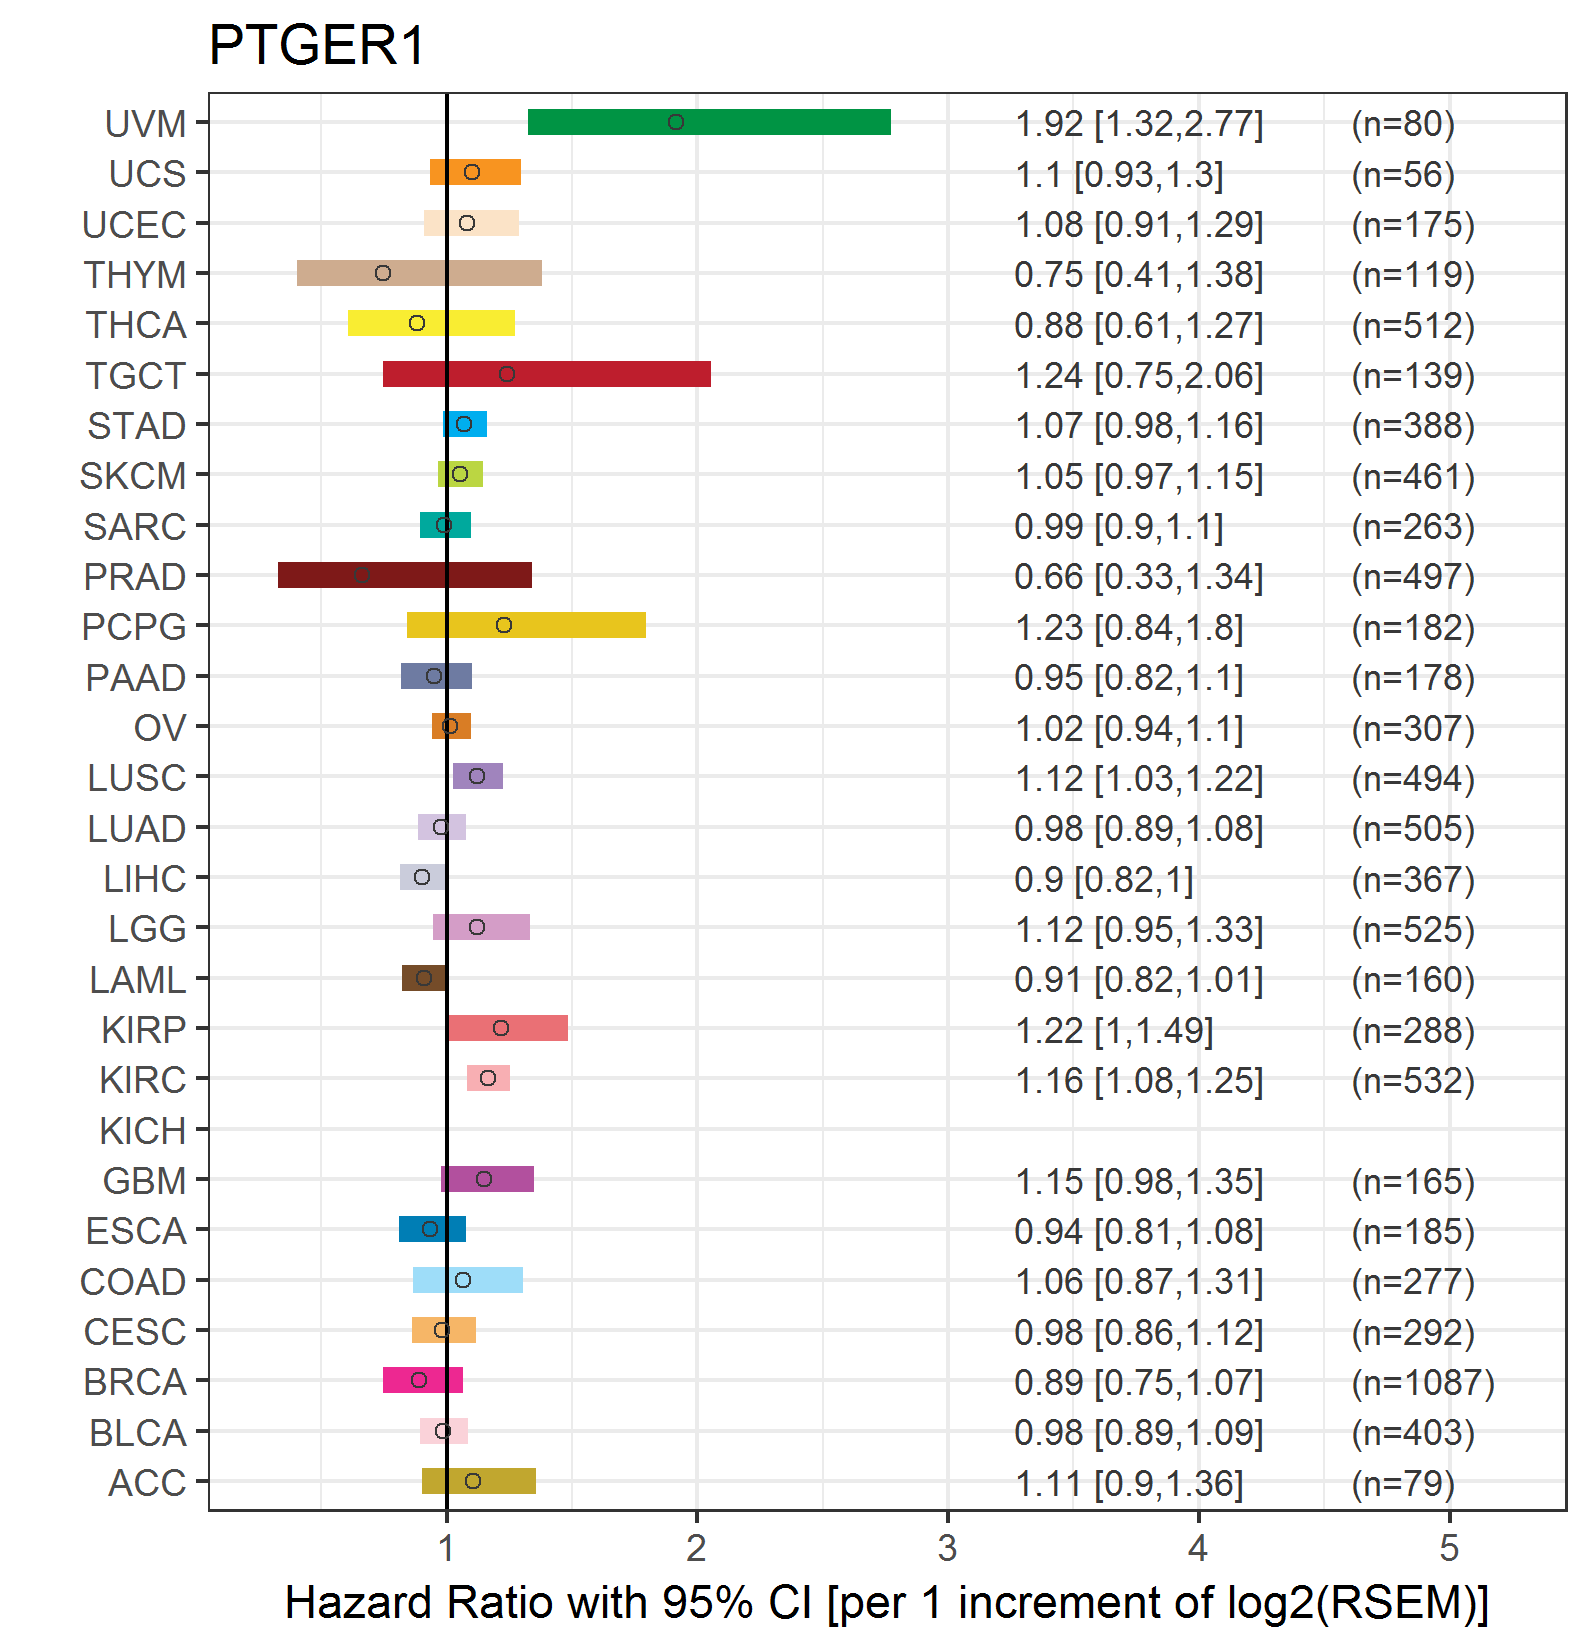
| Forest plot of Cox proportional hazard ratio (HR) and 95% CI of overall survival (OS) using 28 cancer types (TCGA IlluminaHiSeq_RNASeqV2, pan-cancer normalized log2(norm_counts+1) data, version 2016-08-16) (TCGA clinicalMatrix, phenotype data, version 2016-04-27) * Click on the image enlarge it in a new window. |
 |
| Forest plot of Cox proportional hazard ratio (HR) and 95% CI of relapse free survival (RFS) using 28 cancer types (TCGA IlluminaHiSeq_RNASeqV2, pan-cancer normalized log2(norm_counts+1) data, version 2016-08-16) (TCGA clinicalMatrix, phenotype data, version 2016-04-27) * Click on the image enlarge it in a new window. |
 |
| Top |
| TissGeneClin for PTGER1 |
| TissGeneDrug for PTGER1 |
| Drug information targeting TissGene (DrugBank Version 5.0.6, 2017-04-01) |
| DrugBank ID | Drug name | Drug activity | Drug type | Drug status |
| DB00429 | Carboprost Tromethamine | Agonist | Small molecule | Approved |
| DB00297 | Bupivacaine | Other/unknown | Small molecule | Approved|Investigational |
| DB00770 | Alprostadil | Agonist | Small molecule | Approved|Investigational |
| DB01088 | Iloprost | Agonist | Small molecule | Approved|Investigational |
| Top |
| TissGeneDisease for PTGER1 |
| Disease information associated with TissGene (DisGeNet, 2016-06-01) |
| Disease ID | Disease name | # pubmeds | Source |
| umls:C0001418 | Adenocarcinoma | 4 | BeFree,CTD_human,LHGDN |
| umls:C2239176 | Liver carcinoma | 4 | BeFree,LHGDN |
| umls:C0002395 | Alzheimer's Disease | 2 | BeFree,GAD |
| umls:C0002622 | Amnesia | 1 | BeFree |
| umls:C0004096 | Asthma | 1 | GAD |
| umls:C0007102 | Malignant tumor of colon | 1 | BeFree |
| umls:C0007137 | Squamous cell carcinoma | 1 | CTD_human |
| umls:C0007785 | Cerebral Infarction | 1 | BeFree |
| umls:C0008479 | Chondrosarcoma | 1 | BeFree |
| umls:C0008495 | Chorioamnionitis | 1 | GAD |
| umls:C0015944 | Fetal Membranes, Premature Rupture | 1 | GAD |
| umls:C0020429 | Hyperalgesia | 1 | CTD_human |
| umls:C0020538 | Hypertensive disease | 1 | BeFree |
| umls:C0022876 | Premature Obstetric Labor | 1 | GAD |
| umls:C0024121 | Lung Neoplasms | 1 | LHGDN |
| umls:C0024667 | Animal Mammary Neoplasms | 1 | CTD_human |
| umls:C0024668 | Mammary Neoplasms, Experimental | 1 | CTD_human |
| umls:C0030920 | Peptic Ulcer | 1 | RGD |
| umls:C0032914 | Pre-Eclampsia | 1 | GAD |
| umls:C0038454 | Cerebrovascular accident | 1 | BeFree |
| umls:C0151526 | Premature Birth | 1 | GAD |
| umls:C0237873 | Physiological Sexual Disorders | 1 | CTD_human |
| umls:C0596263 | Carcinogenesis | 1 | BeFree |
| umls:C0677886 | Epithelial ovarian cancer | 1 | GAD |
| umls:C0699790 | Colon Carcinoma | 1 | BeFree |
| umls:C0751295 | Memory Loss | 1 | BeFree |
| umls:C0858853 | Impulsive aggression | 1 | BeFree |
| umls:C0917798 | Cerebral Ischemia | 1 | BeFree |
| umls:C1134719 | Invasive Ductal Breast Carcinoma | 1 | CTD_human |
| umls:C2919032 | Infection of amniotic sac and membranes, unspecified, unspecified trimester, not applicable or unspecified | 1 | GAD |
|
Copyright 2016-Present - The University of Texas Health Science Center at Houston (UTHealth) Web File Viewing | How to Report, Fraud, Waste and Abuse | State of Texas | Statewide Search | Texas Homeland Security | Site Policies |