 |
| |
| |
| |
| |
| |
| |
|

| TissGeneSummary for ERMN |
 Gene summary Gene summary |
| Basic gene information | Gene symbol | ERMN |
| Gene name | ermin, ERM-like protein | |
| Synonyms | JN|KIAA1189|ermin | |
| Cytomap | UCSC genome browser: 2q24.1 | |
| Type of gene | protein-coding | |
| RefGenes | NM_001009959.1, NM_020711.1, | |
| Description | erminjuxtanodin | |
| Modification date | 20141207 | |
| dbXrefs | MIM : 610072 | |
| HGNC : HGNC | ||
| Ensembl : ENSG00000136541 | ||
| HPRD : 13838 | ||
| Vega : OTTHUMG00000153843 | ||
| Protein | UniProt: go to UniProt's Cross Reference DB Table | |
| Expression | CleanEX: HS_ERMN | |
| BioGPS: 57471 | ||
| Pathway | NCI Pathway Interaction Database: ERMN | |
| KEGG: ERMN | ||
| REACTOME: ERMN | ||
| Pathway Commons: ERMN | ||
| Context | iHOP: ERMN | |
| ligand binding site mutation search in PubMed: ERMN | ||
| UCL Cancer Institute: ERMN | ||
| Assigned class in TissGDB* | C | |
| Included tissue-specific gene expression resources | HPA,TiGER | |
| Specific-tissues in normal samples (assigned by TissGDB using HPA, TiGER, and GTEx) | Brain | |
| Cancer types related to the specific-tissues in cancer samples (assigned by TissGDB using TCGA) | GBM,LGG | |
| Reference showing the relevant tissue of ERMN | ||
| Description by TissGene annotations | Have significant anti-correlated miRNA | |
| * Class A consists of genes with literature evidence and is part of the cTissGenes. Class B consists of only cTissGenes without additional evidence. The remaining genes belong to Class C. |
| Gene ontology having evidence of Inferred from Direct Assay (IDA) from Entrez |
| GO ID | GO term | PubMed ID | GO:0007015 | actin filament organization | 20934411 | GO:0008360 | regulation of cell shape | 20934411 | GO:0031344 | regulation of cell projection organization | 20934411 | GO:0007015 | actin filament organization | 20934411 | GO:0008360 | regulation of cell shape | 20934411 | GO:0031344 | regulation of cell projection organization | 20934411 |
| Top |
| TissGeneExp for ERMN |
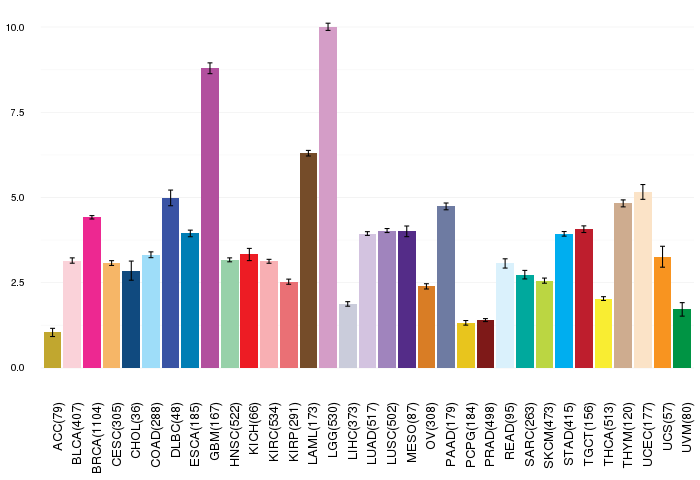
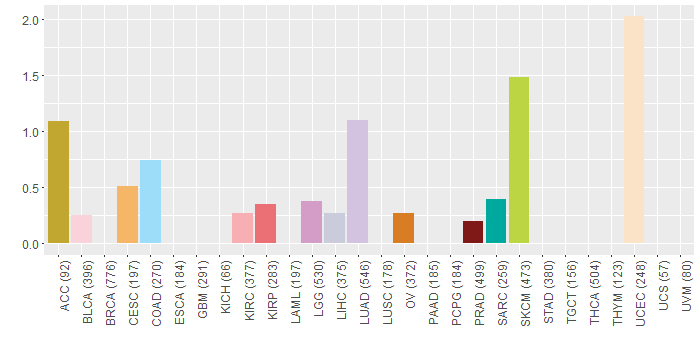
| Gene expressions across 28 cancer types (X-axis: cancer type and Y-axis: log2(norm_counts+1)) (TCGA IlluminaHiSeq_RNASeqV2, pan-cancer normalized log2(norm_counts+1) data, version 2016-08-16) |
 |
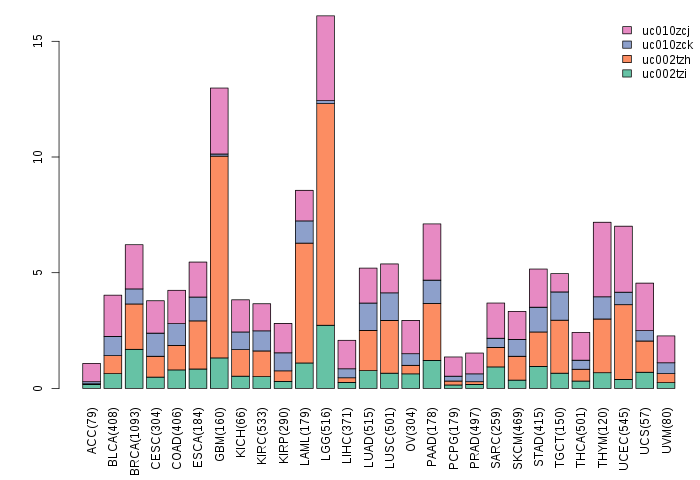
| Gene isoform expressions across 28 cancer types (X-axis: cancer type and Y-axis: log2(norm_counts+1)) (TCGA pan-cancer tcga_rsem_isoform_tpm, version 2016-09-01) |
 |
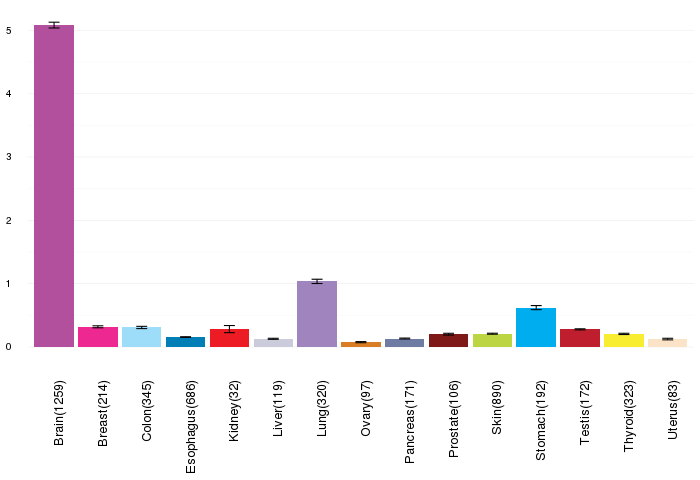
| Gene expressions across normal tissues of GTEx data (GTEx GTEx_Analysis_v6_RNA-seq_RNA-SeQCv1.1.8_gene_rpkm.gct) - Here, we shows the matched tissue types only among our 28 cancer types. |
 |
| Different expressions across 14 cancer types with more than 10 samples between matched tumors and normals (X-axis: cancer type and Y-axis: log2(norm_counts+1)) (TCGA IlluminaHiSeq_RNASeqV2, pan-cancer normalized log2(norm_counts+1) data, version 2016-08-16) |
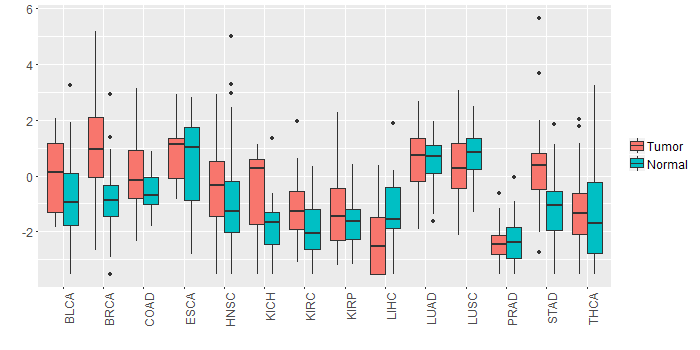 |
| - Significantly differentially expressed cancer types and information. (|Fold change|>1 and FDR<0.05) |
| Cancer type | Mean(exp) in tumor | Mean(exp) in matched normal | Log2FC | P-val. | FDR |
| BRCA | 0.969234214 | -0.899787715 | 1.86902193 | 2.16E-20 | 1.60E-19 |
| KICH | -0.474217996 | -1.765413996 | 1.291196 | 0.000686 | 0.001525675 |
| STAD | 0.360596879 | -1.135159371 | 1.49575625 | 4.15E-05 | 0.000370371 |
| Top |
| TissGene-miRNA for ERMN |
| Significantly anti-correlated miRNAs of TissGene across 28 cancer types (Gene-miRNA relations from TargetScanHuman Relsease 7.1, Conserved_Site_Context_Scores.txt.zip, 06.01.2016) (TCGA IlluminaHiSeq_miRNASeq, log2(RPM+1) data, version 2016-11-21) (TCGA IlluminaHiSeq_RNASeqV2, log2(normalized_count+1) data, version 2016-08-16) (Spearman’s Rank Correlation (p-value<0.05 and coefficient<-0.25)) |
| Cancer type | miRNA id | miRNA accession | P-val. | Coeff. | # samples |
| UCS | hsa-miR-181d-5p | MIMAT0002821 | 0.0092 | -0.35 | 56 |
| Top |
| TissGeneMut for ERMN |
| TissGeneSNV for ERMN |
| nsSNV counts per each loci. Different colors of circles represent different cancer types. Circle size denotes number of samples. (TCGA somatic mutation (SNPs and small INDELs) data, version 2016-04-25) * Click on the image to enlarge it in a new window. |
 |
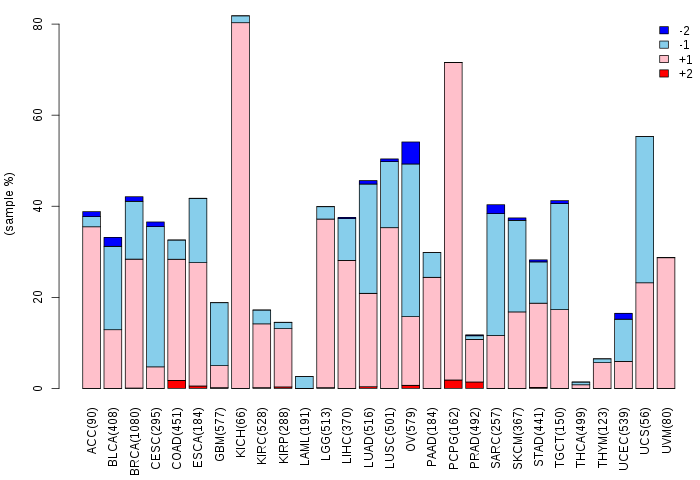
| Somatic nucleotide variants of TissGene across 28 cancer types (X-axis: cancer type and Y-axis: % of mutated samples) The numbers in parentheses are numbers of samples with mutation (nsSNVs). (TCGA somatic mutation (SNPs and small INDELs) data, version 2016-04-25) |
 |
| - nsSNVs sorted by frequency. |
| AAchange | Cancer type | # samples |
| p.R163Q | SKCM | 2 |
| p.D189N | KIRC | 1 |
| p.R8Q | SKCM | 1 |
| p.E84Q | LUAD | 1 |
| p.D199G | HNSC | 1 |
| p.R202* | SKCM | 1 |
| p.R274I | READ | 1 |
| p.M170T | BLCA | 1 |
| p.R163X | SKCM | 1 |
| p.R8Q | ACC | 1 |
| p.D169Y | SARC | 1 |
| p.P227T | HNSC | 1 |
| p.R202X | SKCM | 1 |
| p.Q143H | UCEC | 1 |
| p.E25Q | CESC | 1 |
| p.D192N | COAD | 1 |
| p.R44K | LUAD | 1 |
| p.S123G | HNSC | 1 |
| p.H172Y | LGG | 1 |
| p.T148I | OV | 1 |
| p.P227Q | LUAD | 1 |
| p.D96N | PRAD | 1 |
| p.R8W | SKCM | 1 |
| p.S269P | LIHC | 1 |
| p.H283Y | COAD | 1 |
| p.Q114H | LGG | 1 |
| p.S256P | LIHC | 1 |
| p.E213D | KIRP | 1 |
| p.E200D | KIRP | 1 |
| p.E198* | UCEC | 1 |
| p.E218* | UCEC | 1 |
| p.R287K | UCEC | 1 |
| p.Q167K | LUAD | 1 |
| p.R264W | LUAD | 1 |
| p.P5R | LUAD | 1 |
| p.R163* | SKCM | 1 |
| p.D109Y | UCEC | 1 |
| p.G161E | SKCM | 1 |
| Top |
| TissGeneCNV for ERMN |
| Copy number variations of TissGene across 28 cancer types (X-axis: cancer type and Y-axis: % of CNV samples) (TCGA Gistic2_CopyNumber_Gistic2_all_data_by_genes, Gistic2 copy number data, version 2016-08-16) |
 |
| Top |
| TissGeneFusions for ERMN |
| Fusion genes including TissGene (ChimerDB 3.0, 2016-12-01 and TCGA fusion Portal 2015-12-01) |
| Database | Src | Cancer type | Sample | Fusion gene | ORF | 5'-gene BP | 3'-gene BP |
| Chimerdb3.0 | ChiTaRs | NA | DA055190 | ERMN-SEPT8 | chr2:158176931 | chr5:132099485 | |
| Chimerdb3.0 | ChiTaRs | NA | DA340713 | TAF1D-ERMN | chr11:93464732 | chr2:158176802 |
| Top |
| TissGeneNet for ERMN |
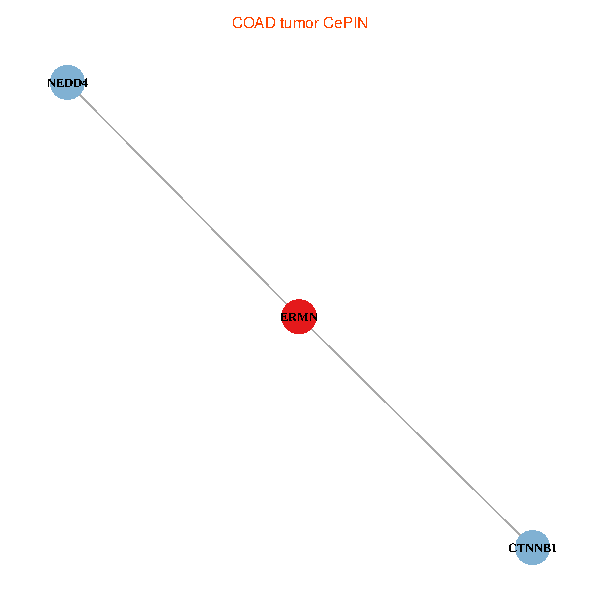
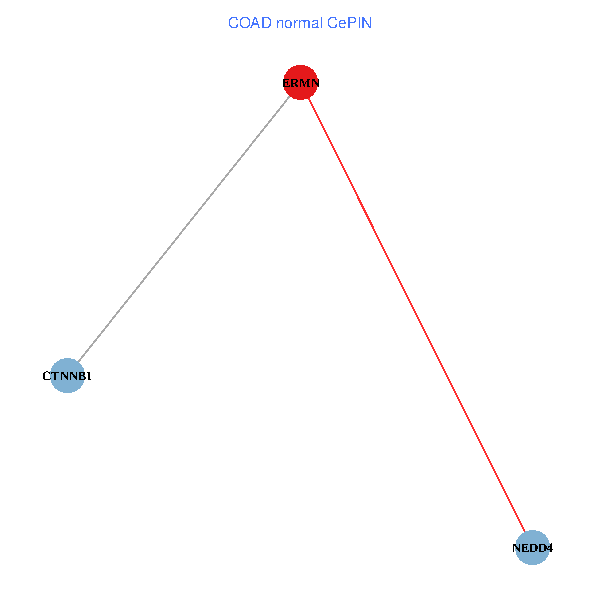
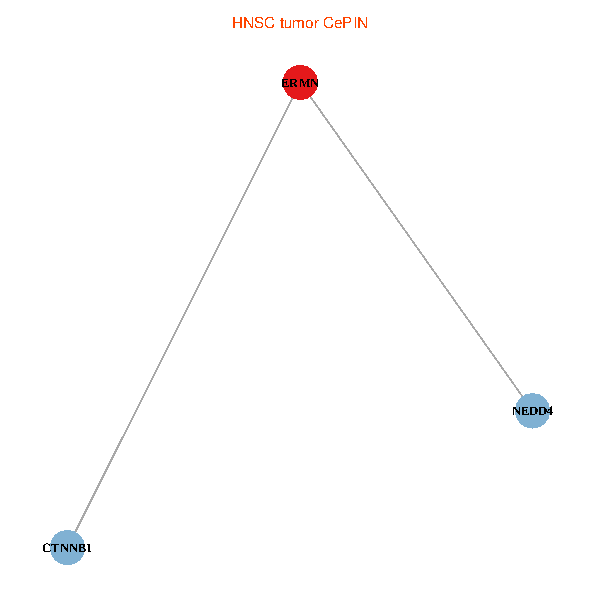
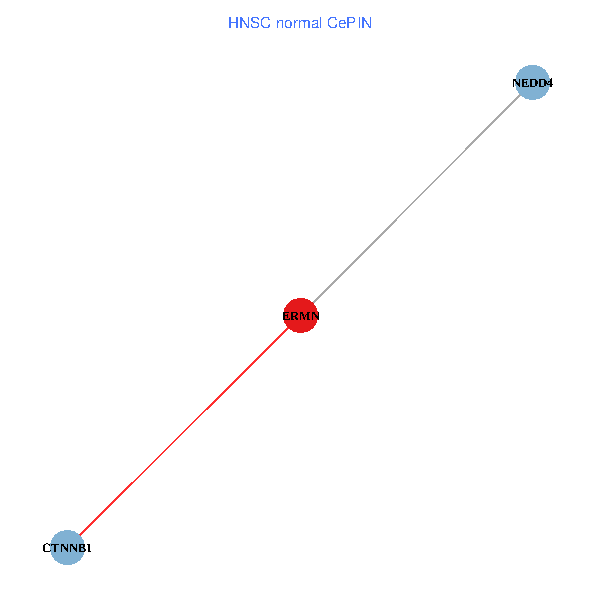
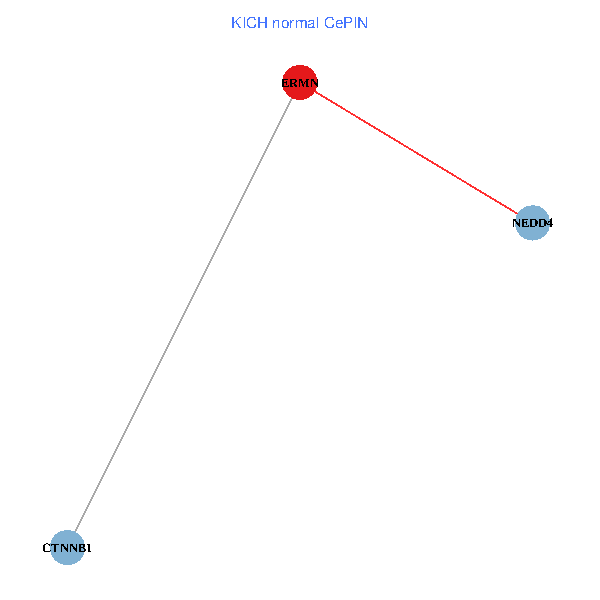
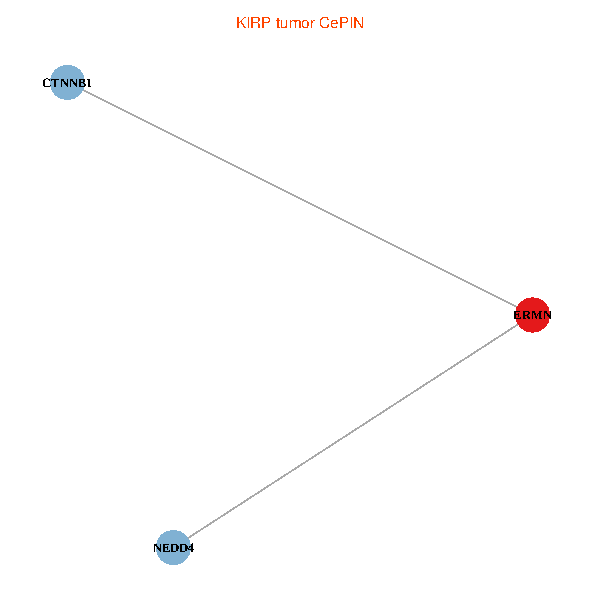
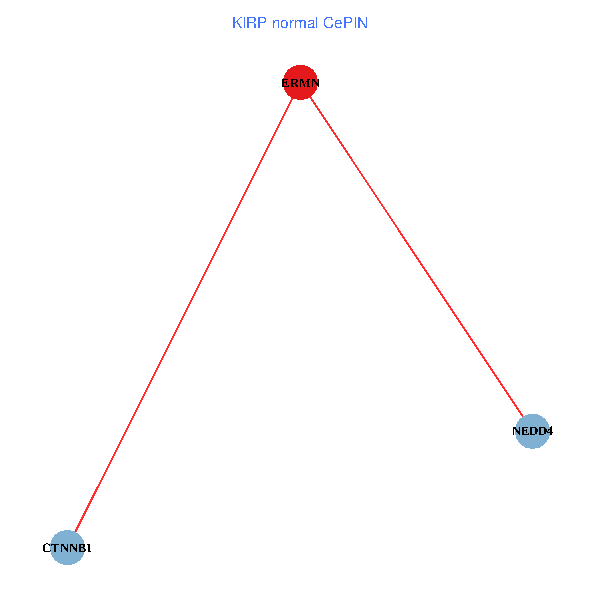
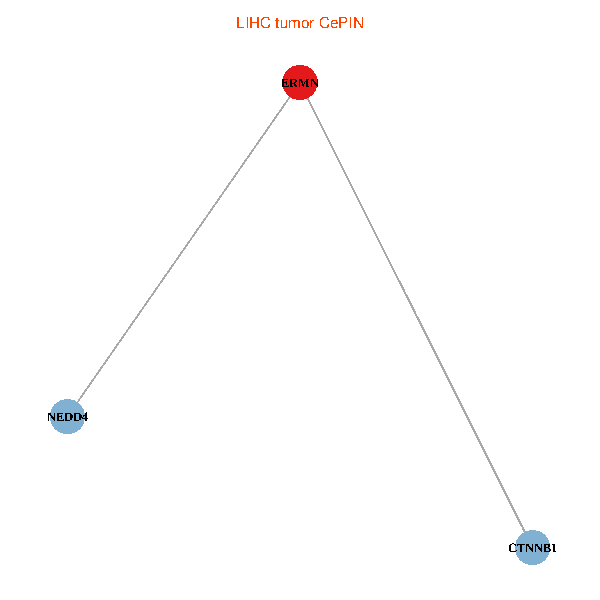
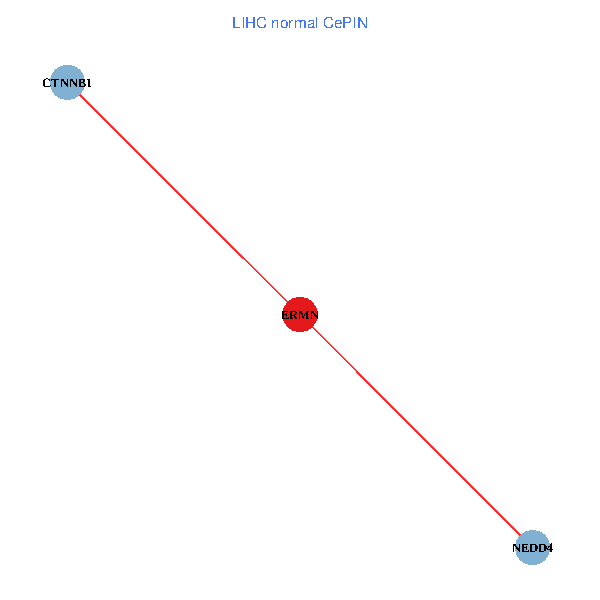
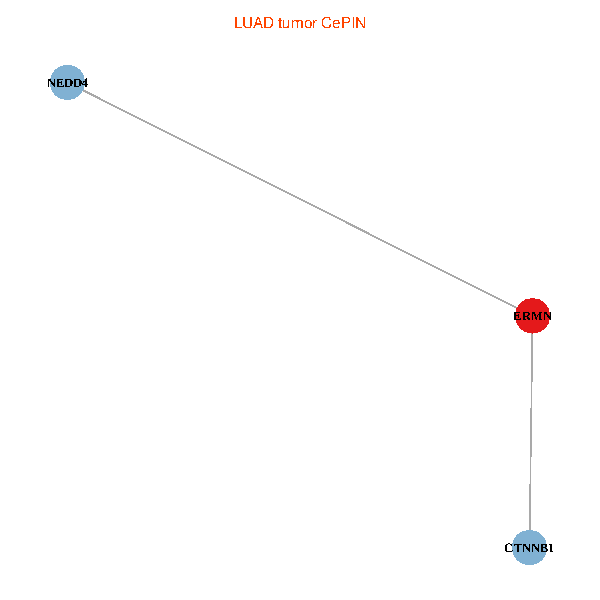
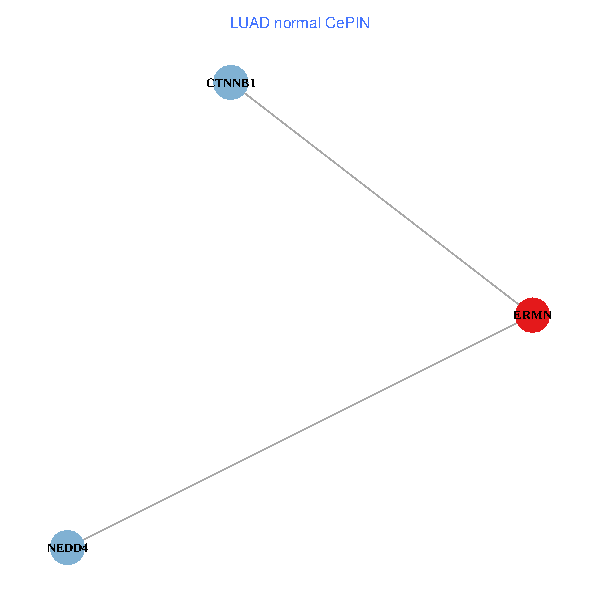
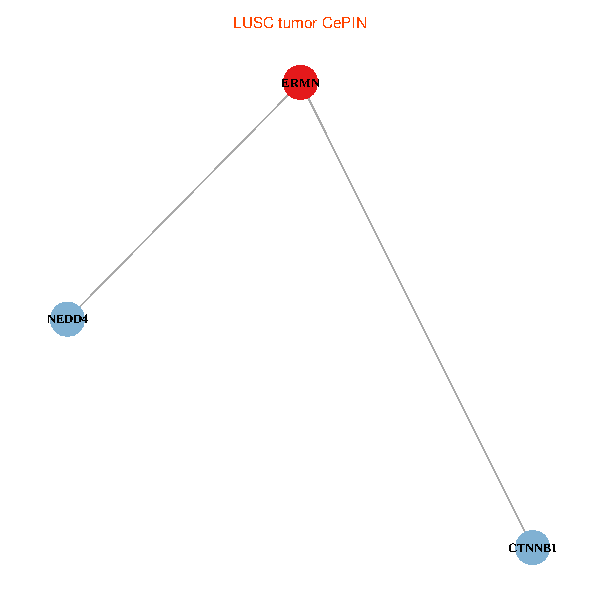
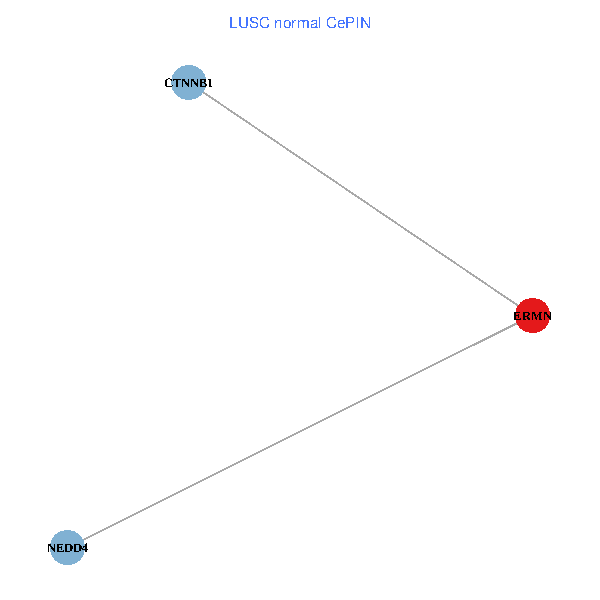
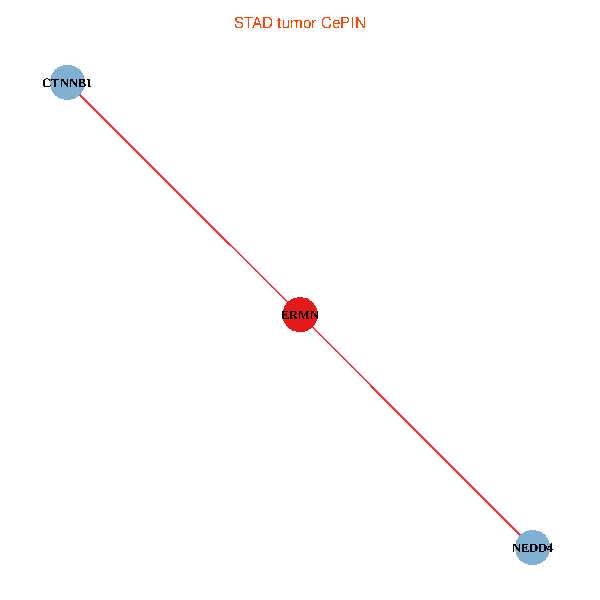
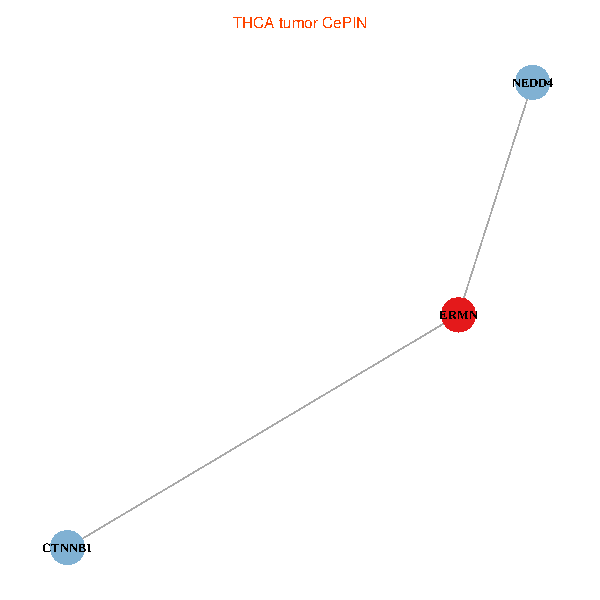
| Co-expressed gene networks based on protein-protein interaction data (CePIN) (TCGA IlluminaHiSeq_RNASeqV2, pan-cancer normalized log2(norm_counts+1) data, version 2016-08-16) (PINA2 ppi data) |
| BRCA (tumor) | BRCA (normal) |
| ERMN, NEDD4, CTNNB1 (tumor) | ERMN, NEDD4, CTNNB1 (normal) |
 |  |
| COAD (tumor) | COAD (normal) |
| ERMN, NEDD4, CTNNB1 (tumor) | ERMN, NEDD4, CTNNB1 (normal) |
 |  |
| HNSC (tumor) | HNSC (normal) |
| ERMN, NEDD4, CTNNB1 (tumor) | ERMN, NEDD4, CTNNB1 (normal) |
 |  |
| KICH (tumor) | KICH (normal) |
| ERMN, NEDD4, CTNNB1 (tumor) | ERMN, NEDD4, CTNNB1 (normal) |
 |  |
| KIRC (tumor) | KIRC (normal) |
| ERMN, NEDD4, CTNNB1 (tumor) | ERMN, NEDD4, CTNNB1 (normal) |
 |  |
| KIRP (tumor) | KIRP (normal) |
| ERMN, NEDD4, CTNNB1 (tumor) | ERMN, NEDD4, CTNNB1 (normal) |
 |  |
| LIHC (tumor) | LIHC (normal) |
| ERMN, NEDD4, CTNNB1 (tumor) | ERMN, NEDD4, CTNNB1 (normal) |
 |  |
| LUAD (tumor) | LUAD (normal) |
| ERMN, NEDD4, CTNNB1 (tumor) | ERMN, NEDD4, CTNNB1 (normal) |
 |  |
| LUSC (tumor) | LUSC (normal) |
| ERMN, NEDD4, CTNNB1 (tumor) | ERMN, NEDD4, CTNNB1 (normal) |
 |  |
| PRAD (tumor) | PRAD (normal) |
| ERMN, NEDD4, CTNNB1 (tumor) | ERMN, NEDD4, CTNNB1 (normal) |
 |  |
| STAD (tumor) | STAD (normal) |
| ERMN, NEDD4, CTNNB1 (tumor) | ERMN, NEDD4, CTNNB1 (normal) |
 |  |
| THCA (tumor) | THCA (normal) |
| ERMN, NEDD4, CTNNB1 (tumor) | ERMN, NEDD4, CTNNB1 (normal) |
 |  |
| Top |
| TissGeneProg for ERMN |
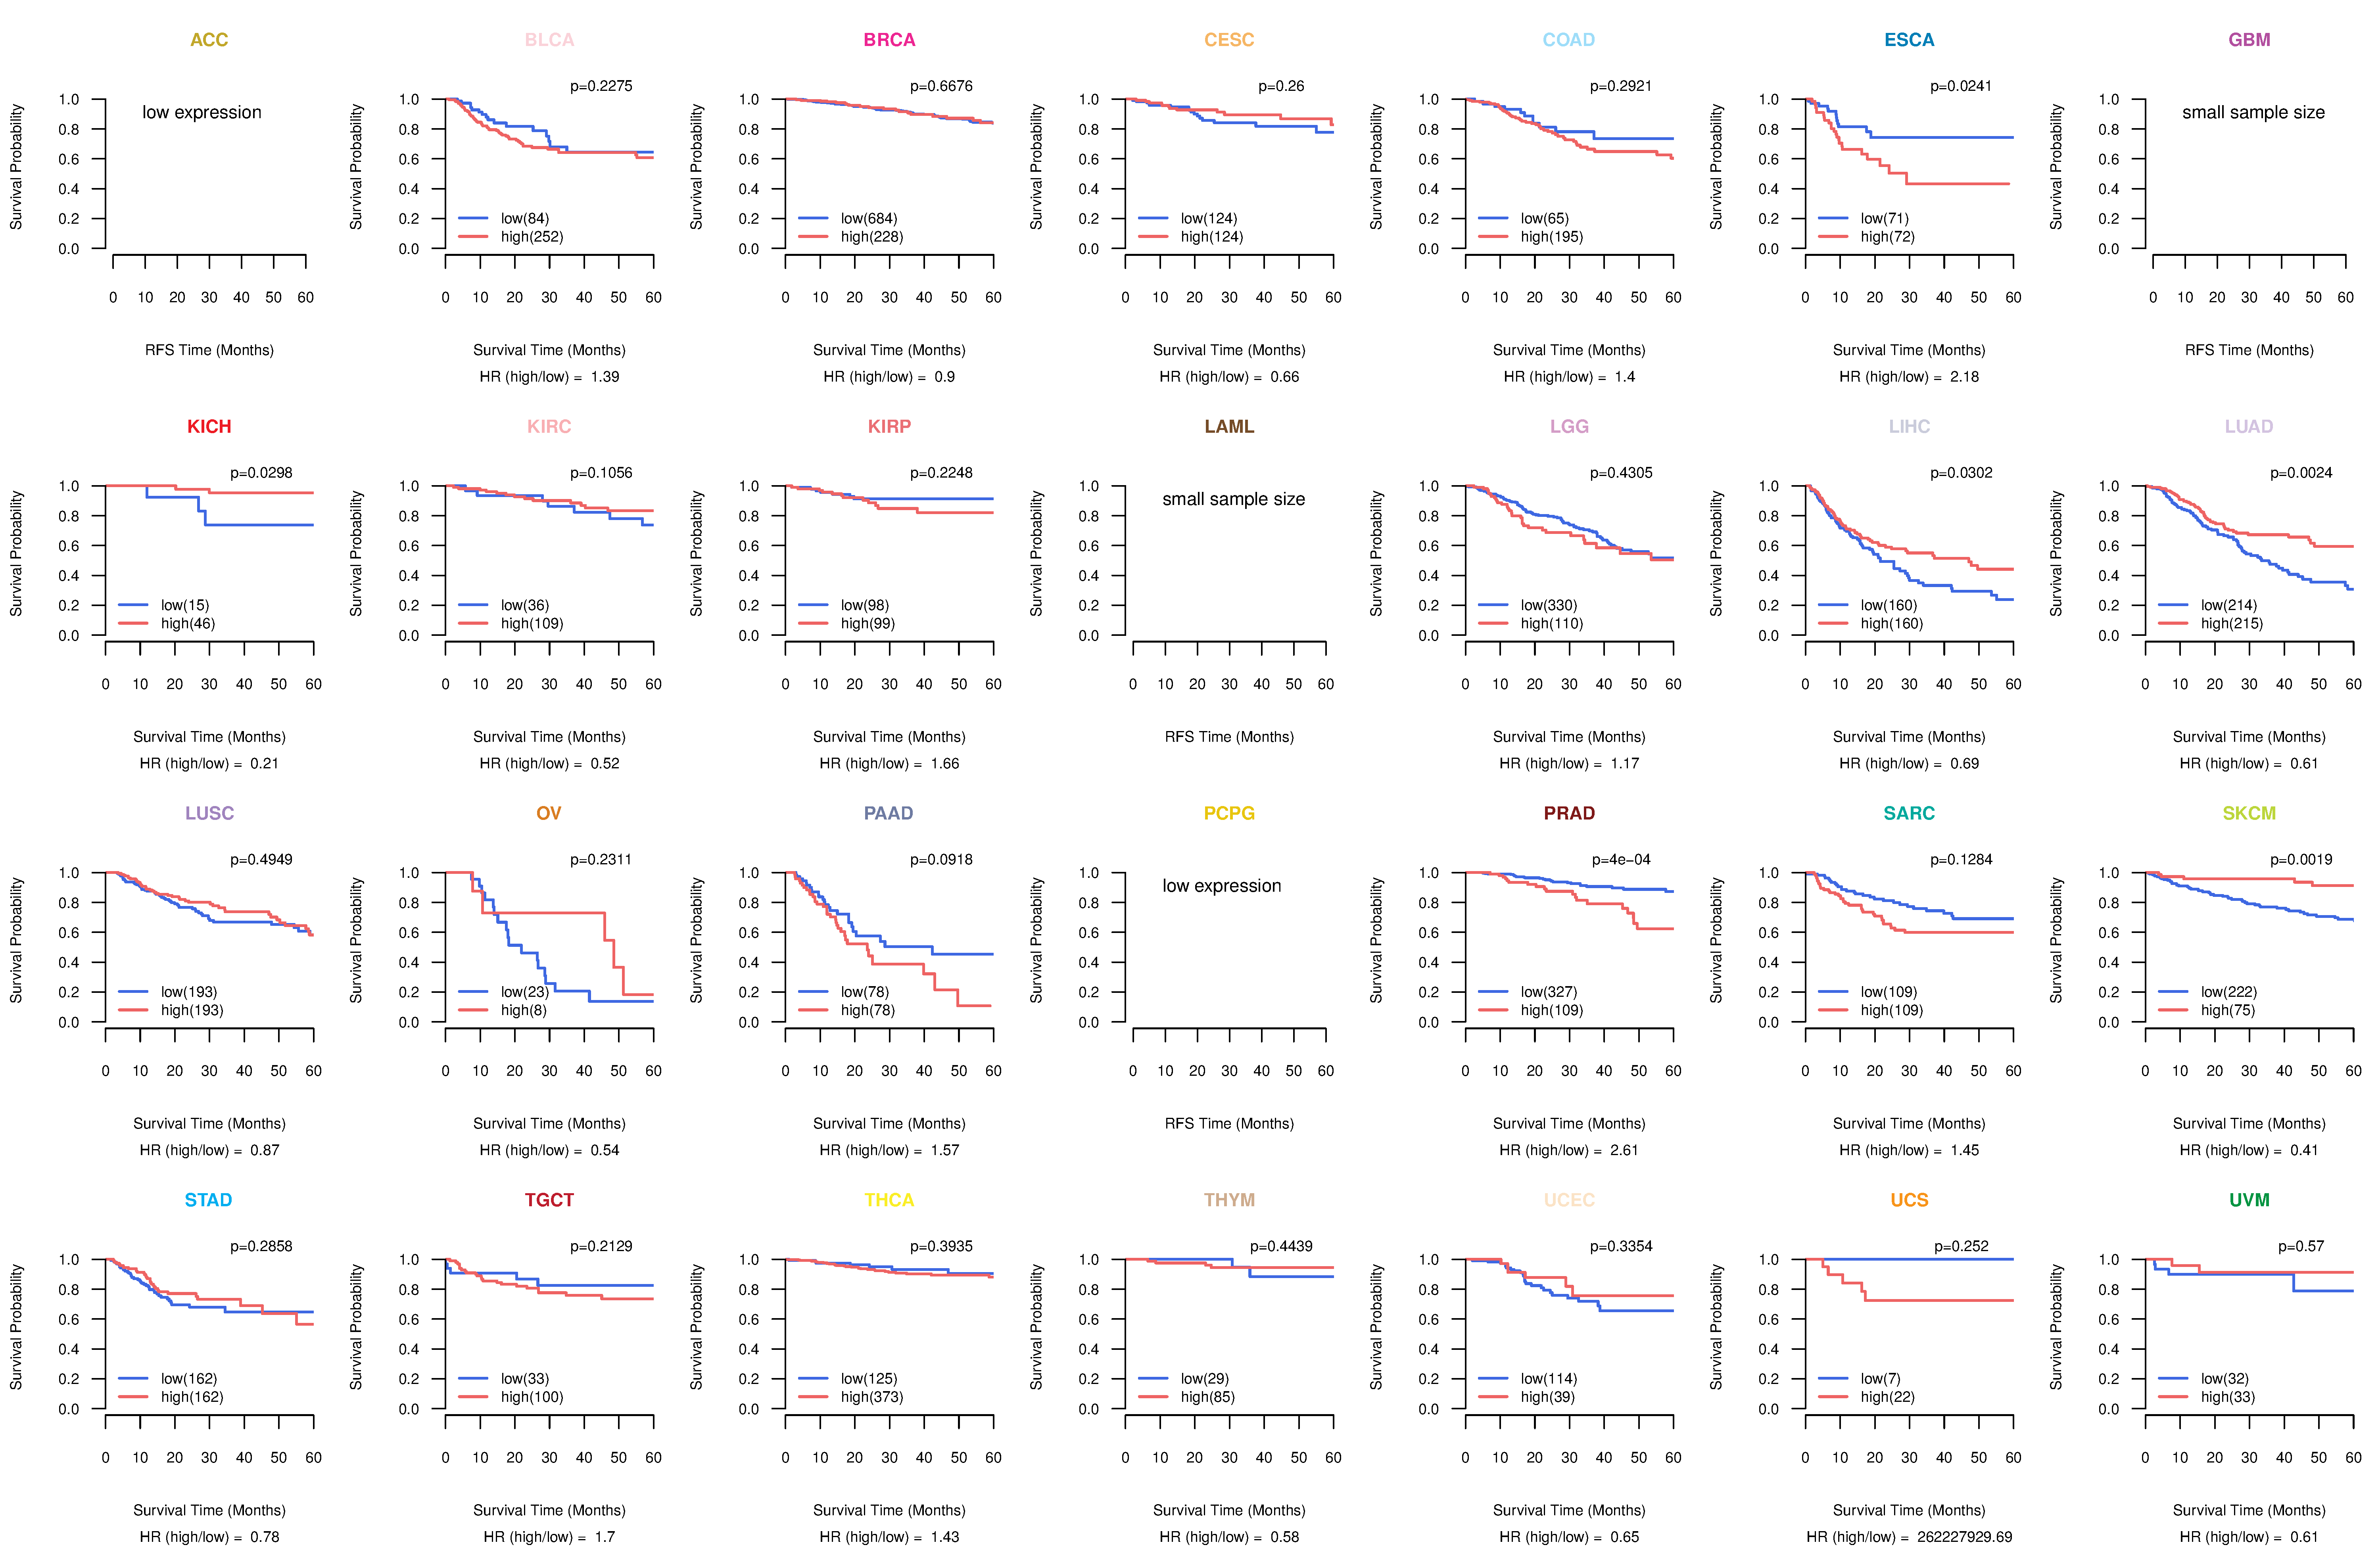
| Kaplan-Meier plots with logrank tests of overall survival (OS) using 28 cancer types (TCGA IlluminaHiSeq_RNASeqV2, pan-cancer normalized log2(norm_counts+1) data, version 2016-08-16) (TCGA clinicalMatrix, phenotype data, version 2016-04-27) * Click on the image to enlarge it in a new window. |
 |
| Kaplan-Meier plots with logrank test of relapse free survival (RFS) using 28 cancer types (TCGA IlluminaHiSeq_RNASeqV2, pan-cancer normalized log2(norm_counts+1) data, version 2016-08-16) (TCGA clinicalMatrix, phenotype data, version 2016-04-27) * Click on the image enlarge it in a new window. |
 |
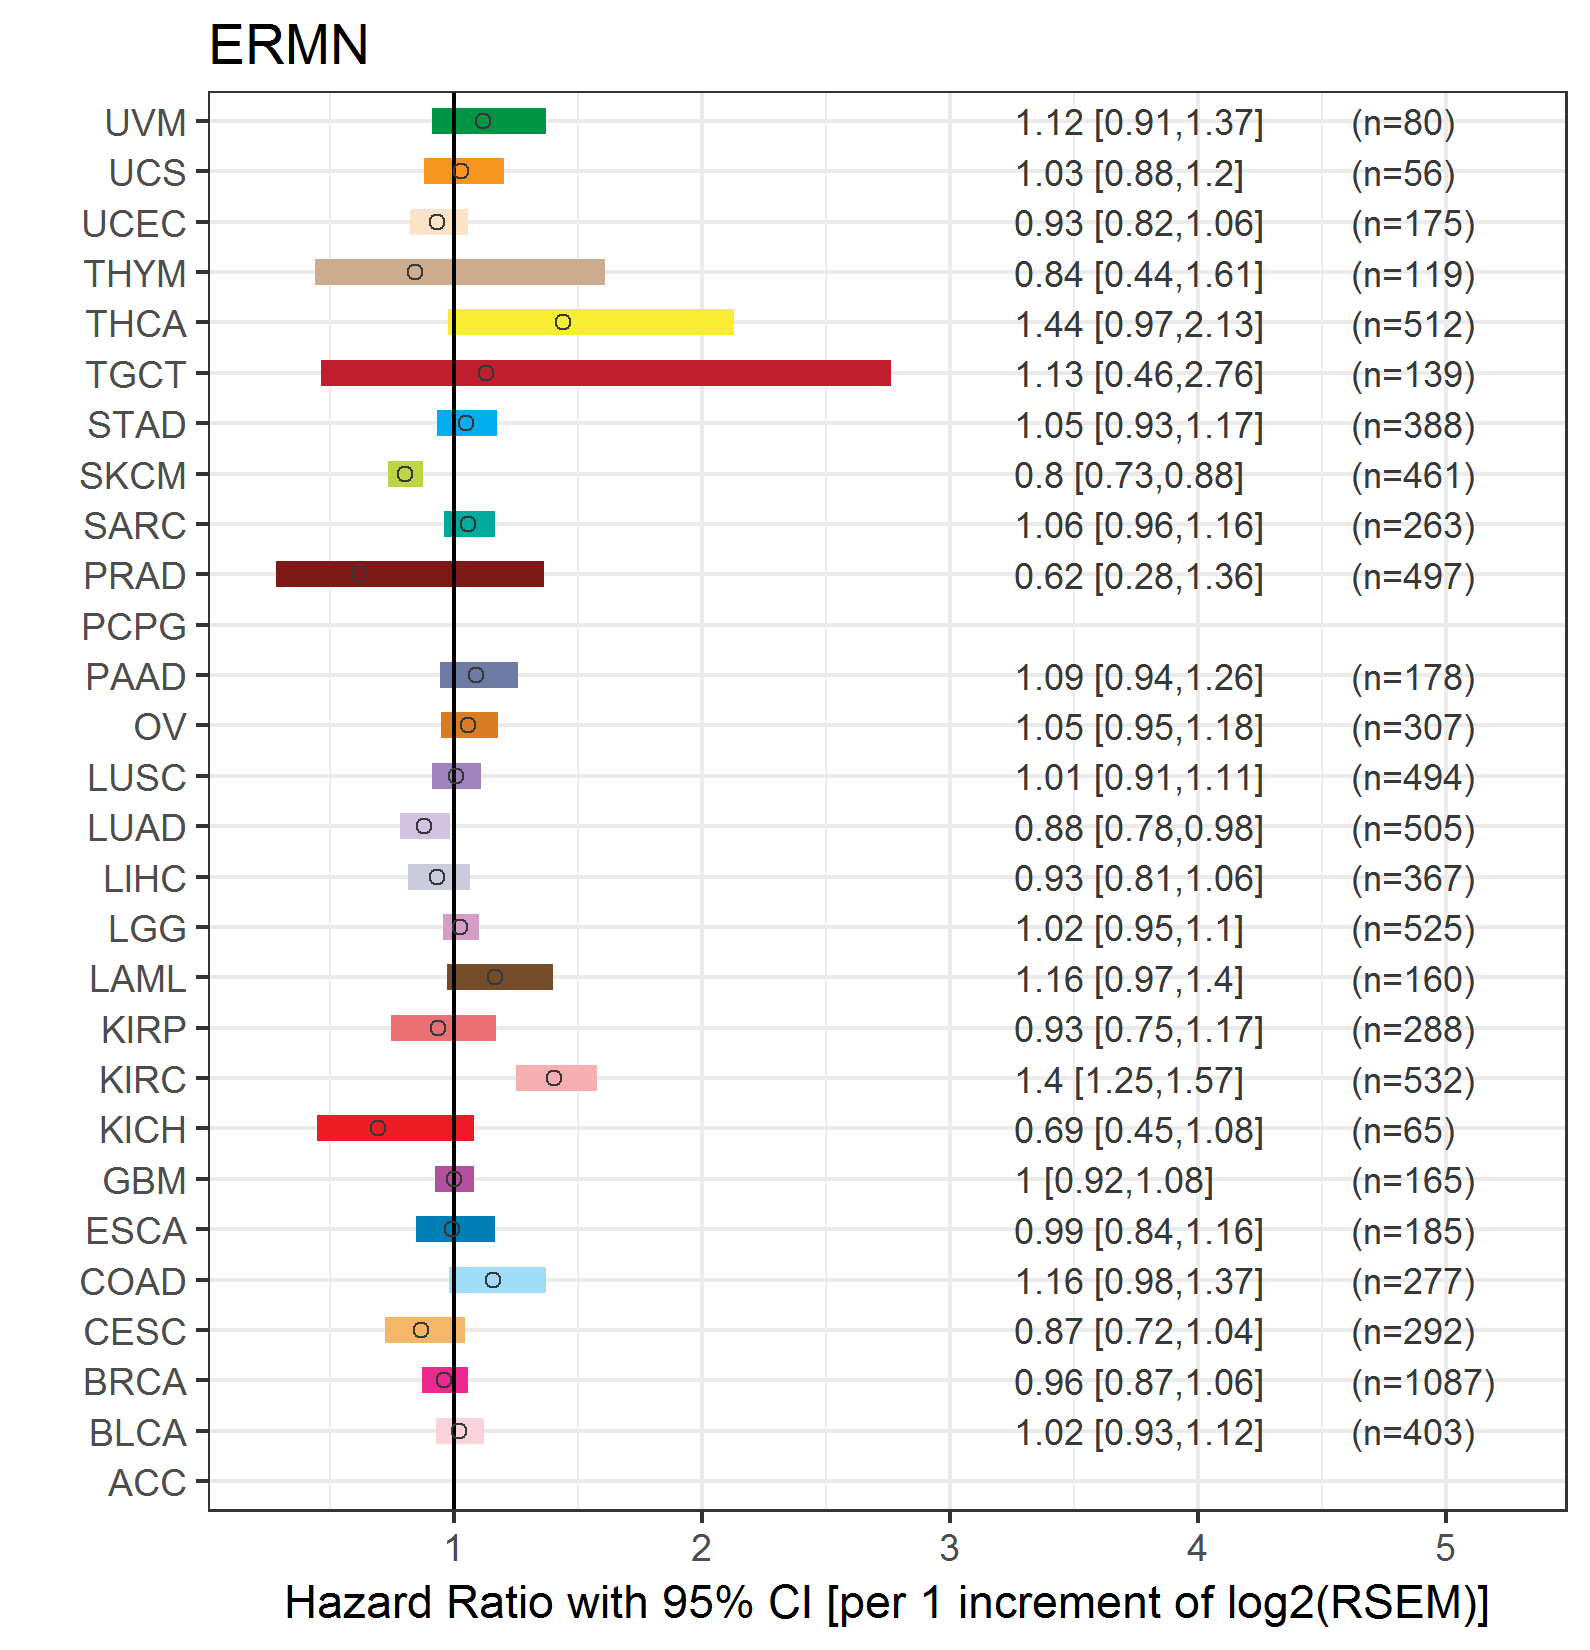
| Forest plot of Cox proportional hazard ratio (HR) and 95% CI of overall survival (OS) using 28 cancer types (TCGA IlluminaHiSeq_RNASeqV2, pan-cancer normalized log2(norm_counts+1) data, version 2016-08-16) (TCGA clinicalMatrix, phenotype data, version 2016-04-27) * Click on the image enlarge it in a new window. |
 |
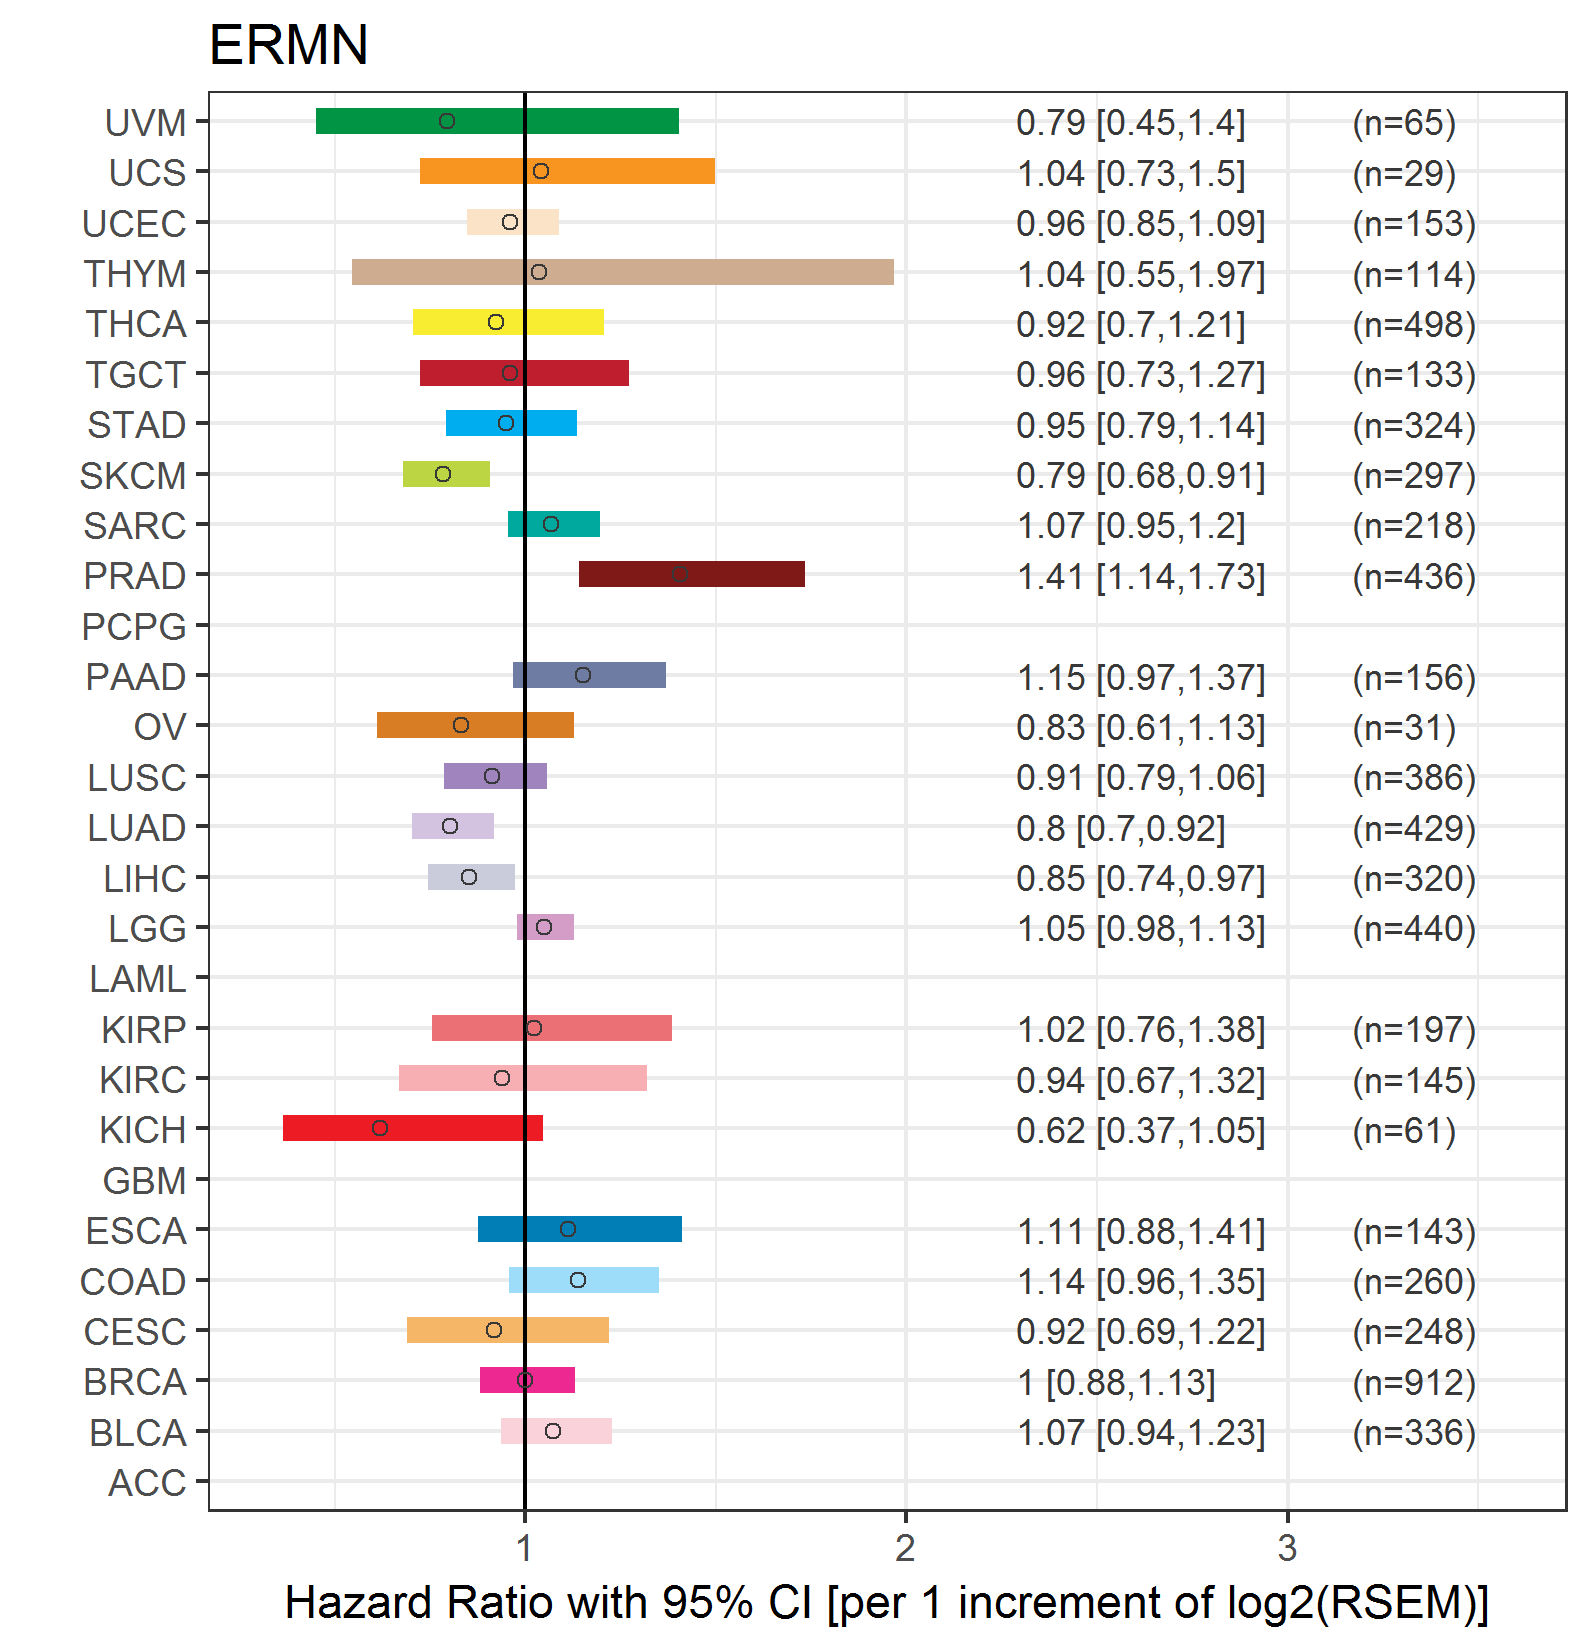
| Forest plot of Cox proportional hazard ratio (HR) and 95% CI of relapse free survival (RFS) using 28 cancer types (TCGA IlluminaHiSeq_RNASeqV2, pan-cancer normalized log2(norm_counts+1) data, version 2016-08-16) (TCGA clinicalMatrix, phenotype data, version 2016-04-27) * Click on the image enlarge it in a new window. |
 |
| Top |
| TissGeneClin for ERMN |
| TissGeneDrug for ERMN |
| Drug information targeting TissGene (DrugBank Version 5.0.6, 2017-04-01) |
| DrugBank ID | Drug name | Drug activity | Drug type | Drug status |
| Top |
| TissGeneDisease for ERMN |
| Disease information associated with TissGene (DisGeNet, 2016-06-01) |
| Disease ID | Disease name | # pubmeds | Source |
| umls:C0036341 | Schizophrenia | 2 | LHGDN |
| umls:C0001973 | Alcoholic Intoxication, Chronic | 1 | GAD |
|
Copyright 2016-Present - The University of Texas Health Science Center at Houston (UTHealth) Web File Viewing | How to Report, Fraud, Waste and Abuse | State of Texas | Statewide Search | Texas Homeland Security | Site Policies |