 |
| |
| |
| |
| |
| |
| |
|

| TissGeneSummary for PDZD4 |
 Gene summary Gene summary |
| Basic gene information | Gene symbol | PDZD4 |
| Gene name | PDZ domain containing 4 | |
| Synonyms | LU1|PDZK4|PDZRN4L | |
| Cytomap | UCSC genome browser: Xq28 | |
| Type of gene | protein-coding | |
| RefGenes | NM_032512.2, | |
| Description | PDZ domain-containing RING finger protein 4-like proteinPDZ domain-containing protein 4 | |
| Modification date | 20141207 | |
| dbXrefs | MIM : 300634 | |
| HGNC : HGNC | ||
| Ensembl : ENSG00000067840 | ||
| HPRD : 06601 | ||
| Vega : OTTHUMG00000024209 | ||
| Protein | UniProt: go to UniProt's Cross Reference DB Table | |
| Expression | CleanEX: HS_PDZD4 | |
| BioGPS: 57595 | ||
| Pathway | NCI Pathway Interaction Database: PDZD4 | |
| KEGG: PDZD4 | ||
| REACTOME: PDZD4 | ||
| Pathway Commons: PDZD4 | ||
| Context | iHOP: PDZD4 | |
| ligand binding site mutation search in PubMed: PDZD4 | ||
| UCL Cancer Institute: PDZD4 | ||
| Assigned class in TissGDB* | C | |
| Included tissue-specific gene expression resources | HPA,TiGER | |
| Specific-tissues in normal samples (assigned by TissGDB using HPA, TiGER, and GTEx) | Brain | |
| Cancer types related to the specific-tissues in cancer samples (assigned by TissGDB using TCGA) | GBM,LGG | |
| Reference showing the relevant tissue of PDZD4 | ||
| Description by TissGene annotations | Protective TissGene in OS Have significant anti-correlated miRNA | |
| * Class A consists of genes with literature evidence and is part of the cTissGenes. Class B consists of only cTissGenes without additional evidence. The remaining genes belong to Class C. |
| Gene ontology having evidence of Inferred from Direct Assay (IDA) from Entrez |
| GO ID | GO term | PubMed ID |
| Top |
| TissGeneExp for PDZD4 |
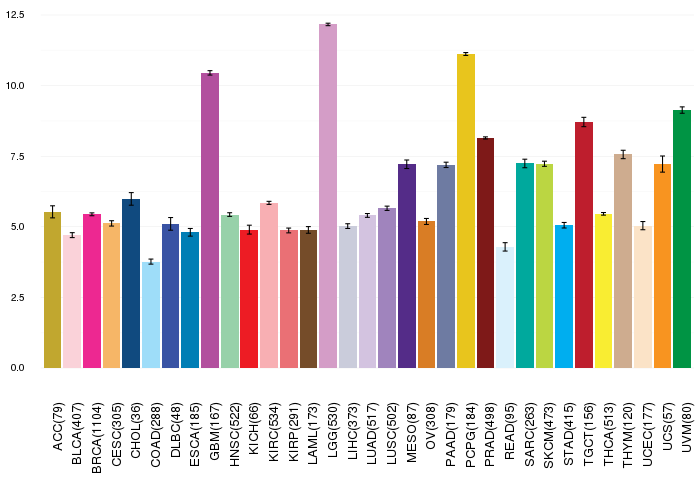
| Gene expressions across 28 cancer types (X-axis: cancer type and Y-axis: log2(norm_counts+1)) (TCGA IlluminaHiSeq_RNASeqV2, pan-cancer normalized log2(norm_counts+1) data, version 2016-08-16) |
 |
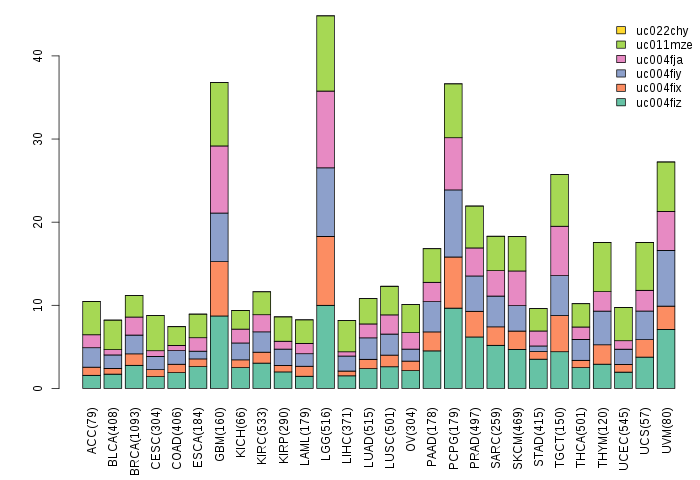
| Gene isoform expressions across 28 cancer types (X-axis: cancer type and Y-axis: log2(norm_counts+1)) (TCGA pan-cancer tcga_rsem_isoform_tpm, version 2016-09-01) |
 |
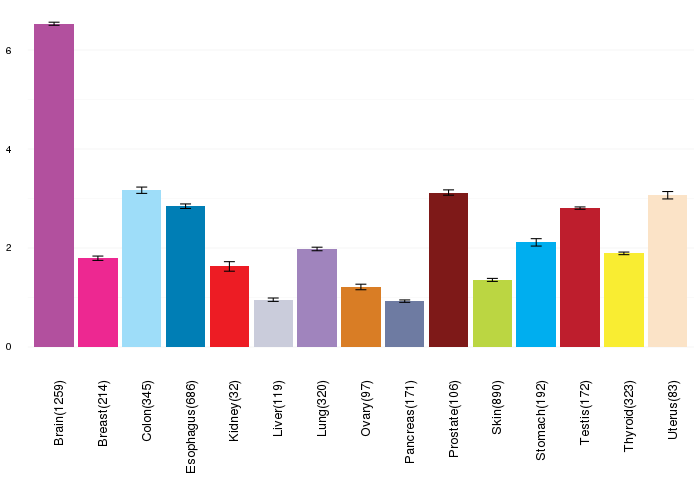
| Gene expressions across normal tissues of GTEx data (GTEx GTEx_Analysis_v6_RNA-seq_RNA-SeQCv1.1.8_gene_rpkm.gct) - Here, we shows the matched tissue types only among our 28 cancer types. |
 |
| Different expressions across 14 cancer types with more than 10 samples between matched tumors and normals (X-axis: cancer type and Y-axis: log2(norm_counts+1)) (TCGA IlluminaHiSeq_RNASeqV2, pan-cancer normalized log2(norm_counts+1) data, version 2016-08-16) |
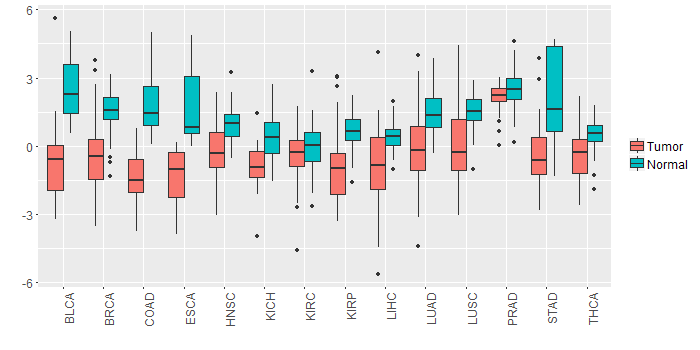 |
| - Significantly differentially expressed cancer types and information. (|Fold change|>1 and FDR<0.05) |
| Cancer type | Mean(exp) in tumor | Mean(exp) in matched normal | Log2FC | P-val. | FDR |
| BLCA | -0.55944838 | 2.526141094 | -3.085589474 | 4.08E-06 | 9.76E-05 |
| LIHC | -0.784582801 | 0.434991199 | -1.219574 | 1.02E-05 | 4.32E-05 |
| BRCA | -0.451001011 | 1.531120041 | -1.982121053 | 4.25E-25 | 4.28E-24 |
| STAD | -0.378138676 | 2.119448824 | -2.4975875 | 1.46E-07 | 3.65E-06 |
| LUSC | 0.148183199 | 1.496226337 | -1.348043137 | 6.46E-06 | 1.50E-05 |
| LUAD | -0.143904732 | 1.426976303 | -1.570881034 | 2.68E-09 | 1.32E-08 |
| HNSC | -0.178723777 | 0.958994827 | -1.137718605 | 1.73E-06 | 1.22E-05 |
| COAD | -1.44449757 | 1.824137046 | -3.268634615 | 3.70E-13 | 1.11E-11 |
| ESCA | -1.430062255 | 1.679028654 | -3.109090909 | 0.000122 | 0.003768444 |
| KIRP | -0.736473051 | 0.619242574 | -1.355715625 | 0.000373 | 0.001127043 |
| KICH | -0.925076801 | 0.314443199 | -1.23952 | 7.23E-05 | 0.000194803 |
| Top |
| TissGene-miRNA for PDZD4 |
| Significantly anti-correlated miRNAs of TissGene across 28 cancer types (Gene-miRNA relations from TargetScanHuman Relsease 7.1, Conserved_Site_Context_Scores.txt.zip, 06.01.2016) (TCGA IlluminaHiSeq_miRNASeq, log2(RPM+1) data, version 2016-11-21) (TCGA IlluminaHiSeq_RNASeqV2, log2(normalized_count+1) data, version 2016-08-16) (Spearman’s Rank Correlation (p-value<0.05 and coefficient<-0.25)) |
| Cancer type | miRNA id | miRNA accession | P-val. | Coeff. | # samples |
| UVM | hsa-miR-708-5p | MIMAT0004926 | 0.0073 | -0.31 | 80 |
| Top |
| TissGeneMut for PDZD4 |
| TissGeneSNV for PDZD4 |
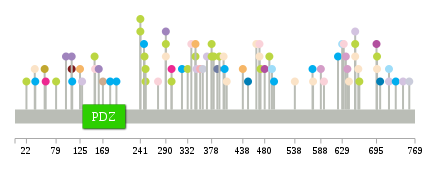
| nsSNV counts per each loci. Different colors of circles represent different cancer types. Circle size denotes number of samples. (TCGA somatic mutation (SNPs and small INDELs) data, version 2016-04-25) * Click on the image to enlarge it in a new window. |
 |
 |
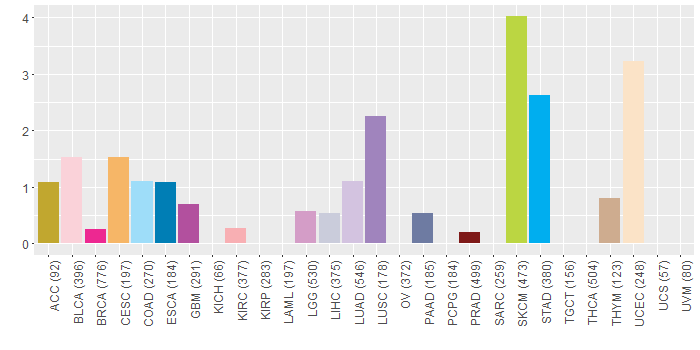
| Somatic nucleotide variants of TissGene across 28 cancer types (X-axis: cancer type and Y-axis: % of mutated samples) The numbers in parentheses are numbers of samples with mutation (nsSNVs). (TCGA somatic mutation (SNPs and small INDELs) data, version 2016-04-25) |
 |
| - nsSNVs sorted by frequency. |
| AAchange | Cancer type | # samples |
| p.T662I | SKCM | 1 |
| p.R654W | SKCM | 1 |
| p.E489K | SKCM | 1 |
| p.S249L | SKCM | 1 |
| p.E594Q | BLCA | 1 |
| p.G632V | BLCA | 1 |
| p.V636M | LGG | 1 |
| p.E153K | SKCM | 1 |
| p.R39H | STAD | 1 |
| p.P109L | PRAD | 1 |
| p.E438D | CESC | 1 |
| p.A470V | BLCA | 1 |
| p.N369K | LUAD | 1 |
| p.E696K | UCEC | 1 |
| p.E290K | SKCM | 1 |
| p.P347S | SKCM | 1 |
| p.R654W | UCEC | 1 |
| p.R538W | UCEC | 1 |
| p.R356H | KIRC | 1 |
| p.D464H | UCEC | 1 |
| p.D161Y | LUSC | 1 |
| p.E696K | SKCM | 1 |
| p.D59E | BRCA | 1 |
| p.A110V | STAD | 1 |
| p.E79K | SKCM | 1 |
| p.E301K | BRCA | 1 |
| p.R621H | STAD | 1 |
| p.E275* | BLCA | 1 |
| p.R494Q | COAD | 1 |
| p.D290E | LUSC | 1 |
| p.S109I | LUSC | 1 |
| p.R695H | GBM | 1 |
| p.M746I | LUAD | 1 |
| p.L38P | UCEC | 1 |
| p.R639W | LGG | 1 |
| p.A339V | BLCA | 1 |
| p.N719T | COAD | 1 |
| p.P251S | SKCM | 1 |
| p.R702W | ESCA | 1 |
| p.D265N | HNSC | 1 |
| p.P448S | ESCA | 1 |
| p.P378L | SKCM | 1 |
| p.E98D | LUSC | 1 |
| p.E241* | SKCM | 1 |
| p.P251L | SKCM | 1 |
| p.N472K | SKCM | 1 |
| p.A195V | STAD | 1 |
| p.R654L | LUAD | 1 |
| p.S22F | SKCM | 1 |
| p.V389I | PAAD | 1 |
| p.E154Q | BLCA | 1 |
| p.R629C | COAD | 1 |
| p.P378S | SKCM | 1 |
| p.G573D | UCEC | 1 |
| p.R732Q | STAD | 1 |
| p.R642Q | UCEC | 1 |
| p.G498D | STAD | 1 |
| p.E241X | SKCM | 1 |
| p.R660W | UCEC | 1 |
| p.E125K | CESC | 1 |
| p.G382R | SKCM | 1 |
| p.D332N | SKCM | 1 |
| p.R758Q | LIHC | 1 |
| p.L349I | LUAD | 1 |
| p.K248N | STAD | 1 |
| p.M407I | UCEC | 1 |
| p.P347L | CESC | 1 |
| p.A588T | LGG | 1 |
| p.Q183H | STAD | 1 |
| p.K246E | READ | 1 |
| p.D470H | UCEC | 1 |
| p.R57W | ACC | 1 |
| p.E290K | UCEC | 1 |
| p.E403D | STAD | 1 |
| p.E393K | SKCM | 1 |
| p.M401I | UCEC | 1 |
| p.N719K | LUAD | 1 |
| p.A169V | THYM | 1 |
| p.E301K | SKCM | 1 |
| p.R572H | STAD | 1 |
| p.A321S | STAD | 1 |
| p.L361P | LIHC | 1 |
| p.G480A | GBM | 1 |
| p.E129Q | LUAD | 1 |
| Top |
| TissGeneCNV for PDZD4 |
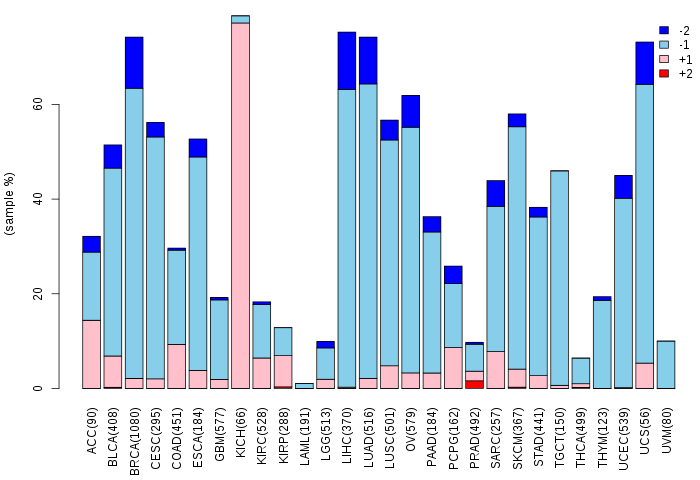
| Copy number variations of TissGene across 28 cancer types (X-axis: cancer type and Y-axis: % of CNV samples) (TCGA Gistic2_CopyNumber_Gistic2_all_data_by_genes, Gistic2 copy number data, version 2016-08-16) |
 |
| Top |
| TissGeneFusions for PDZD4 |
| Fusion genes including TissGene (ChimerDB 3.0, 2016-12-01 and TCGA fusion Portal 2015-12-01) |
| Database | Src | Cancer type | Sample | Fusion gene | ORF | 5'-gene BP | 3'-gene BP |
| Chimerdb3.0 | FusionScan | LUAD | TCGA-38-4630-01A | BCAP31-PDZD4 | Out-of-Frame | chrX:152986326 | chrX:153074050 |
| Chimerdb3.0 | TopHat-Fusion | LUAD | TCGA-38-4630-01A | BCAP31-PDZD4 | Out-of-Frame | chrX:152986326 | chrX:153074049 |
| TCGAfusionPortal | PRADA | LUAD | TCGA-38-4630-01A | BCAP31-PDZD4 | Out-of-frame | ChrX:152986327 | ChrX:153074050 |
| Top |
| TissGeneNet for PDZD4 |
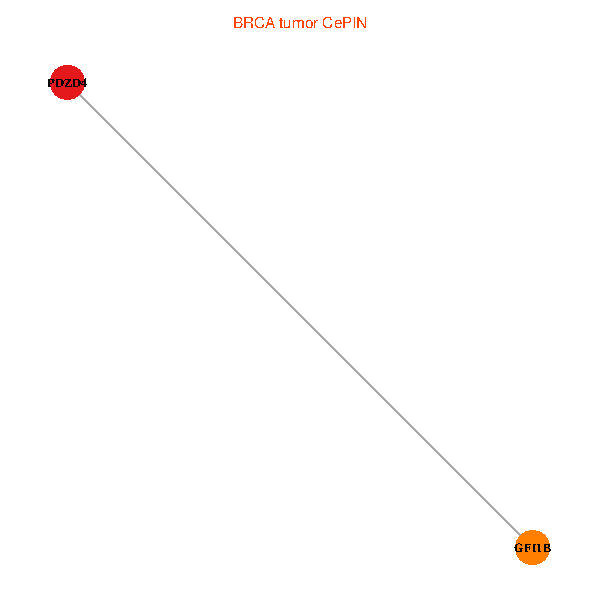
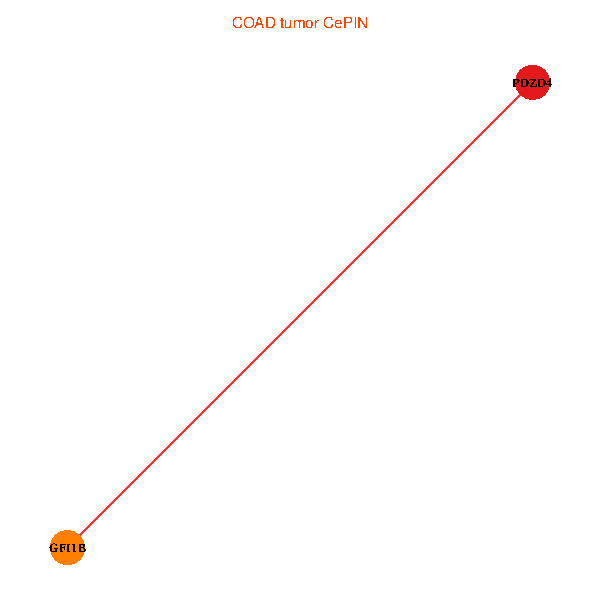
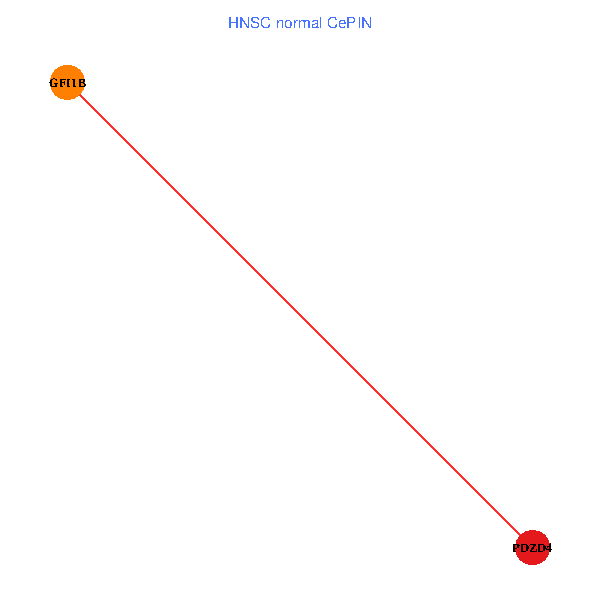
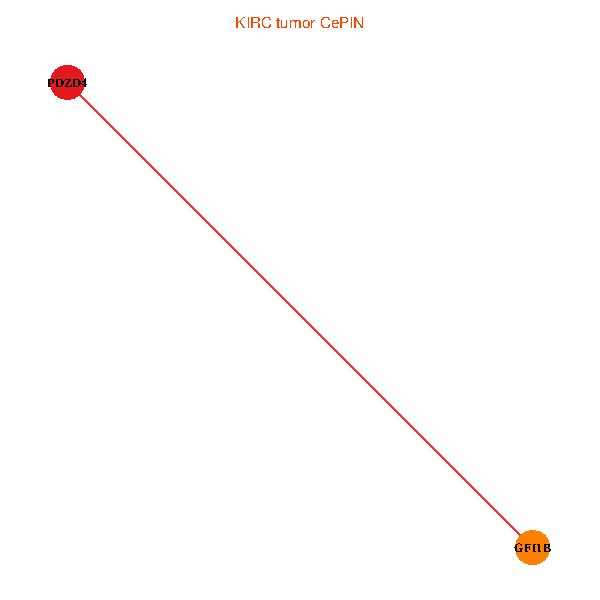
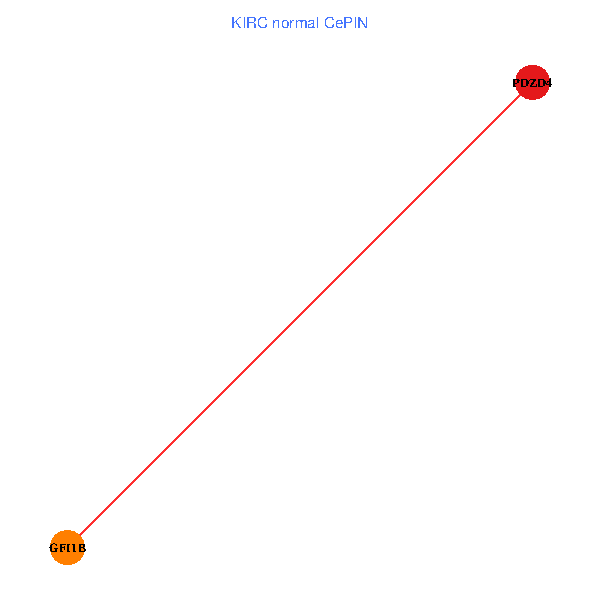
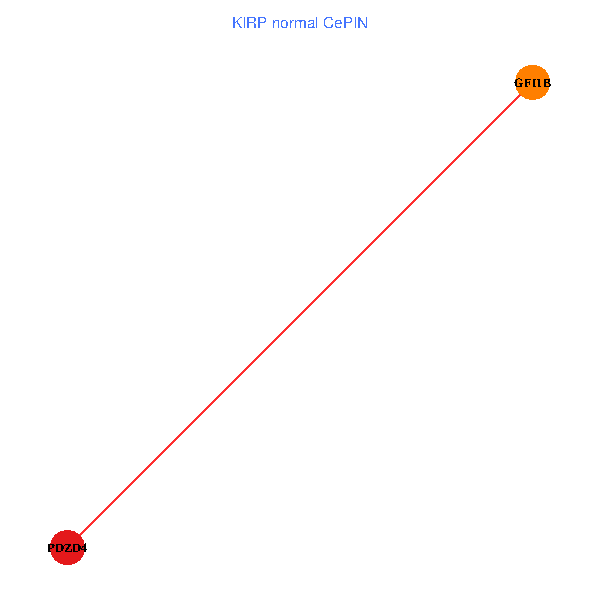
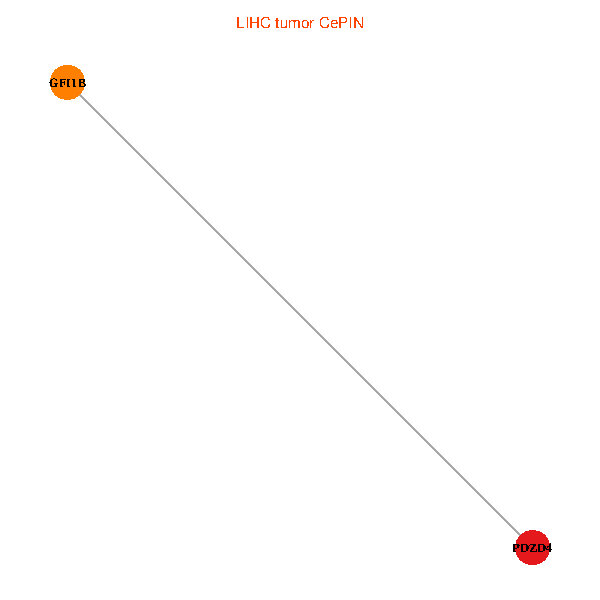
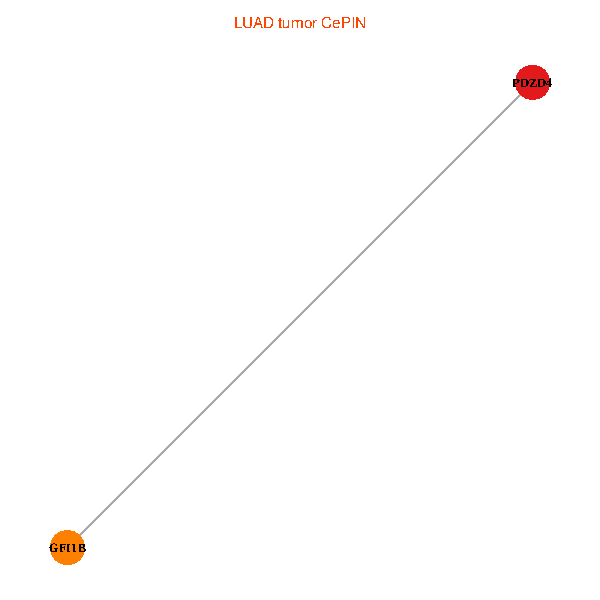
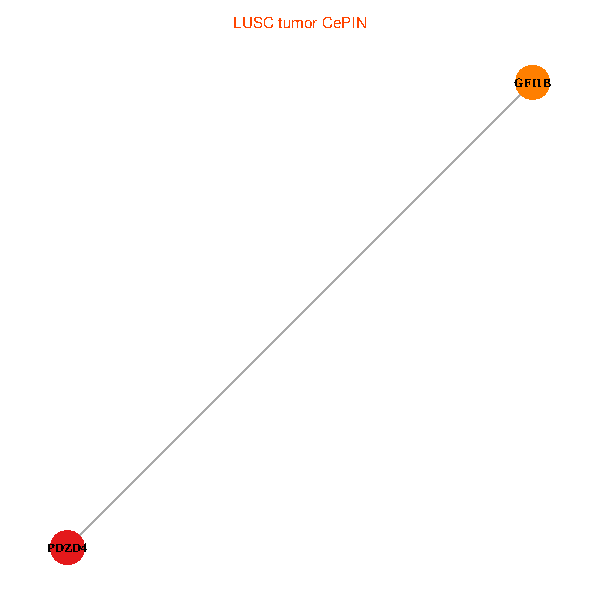
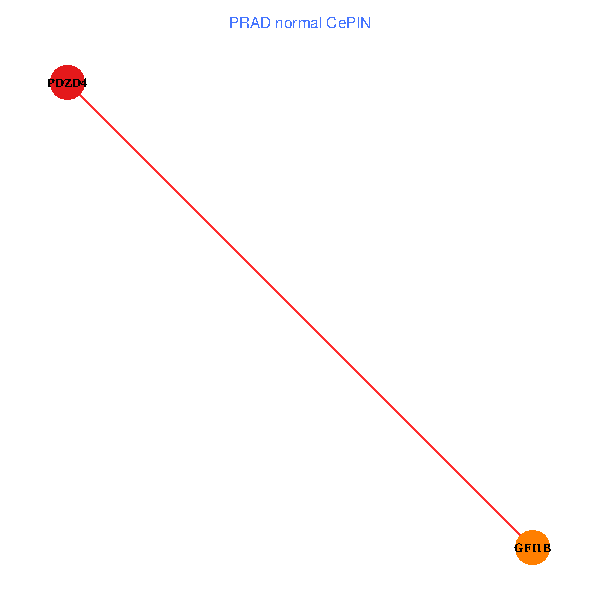
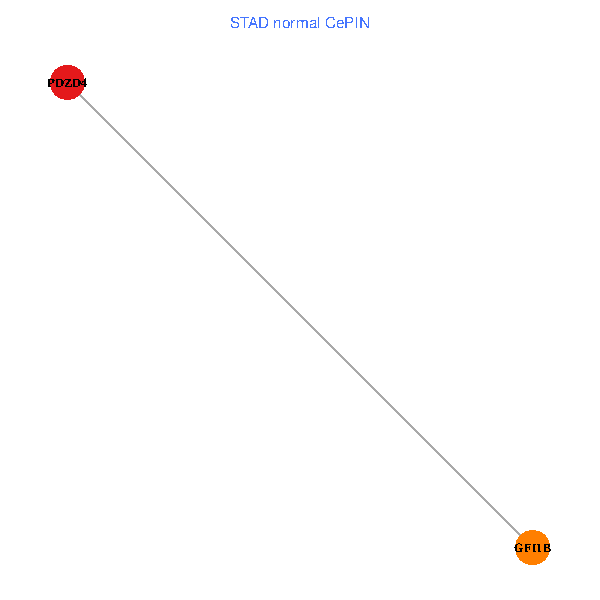
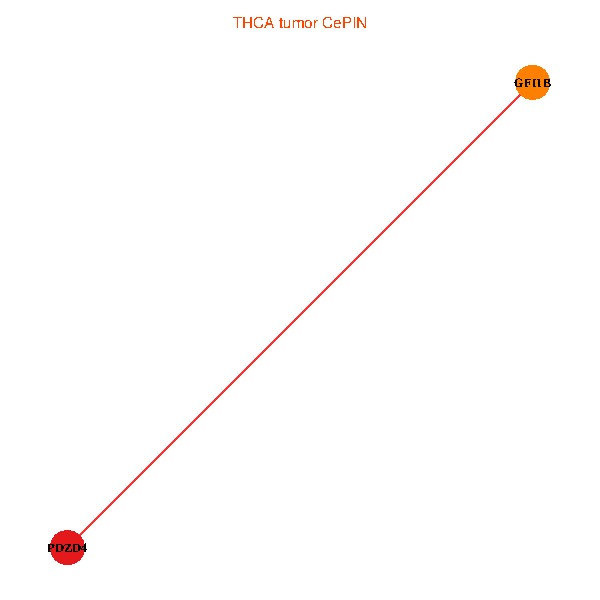
| Co-expressed gene networks based on protein-protein interaction data (CePIN) (TCGA IlluminaHiSeq_RNASeqV2, pan-cancer normalized log2(norm_counts+1) data, version 2016-08-16) (PINA2 ppi data) |
| BRCA (tumor) | BRCA (normal) |
| PDZD4, GFI1B (tumor) | PDZD4, GFI1B (normal) |
 |  |
| COAD (tumor) | COAD (normal) |
| PDZD4, GFI1B (tumor) | PDZD4, GFI1B (normal) |
 |  |
| HNSC (tumor) | HNSC (normal) |
| PDZD4, GFI1B (tumor) | PDZD4, GFI1B (normal) |
 |  |
| KICH (tumor) | KICH (normal) |
| PDZD4, GFI1B (tumor) | PDZD4, GFI1B (normal) |
 |  |
| KIRC (tumor) | KIRC (normal) |
| PDZD4, GFI1B (tumor) | PDZD4, GFI1B (normal) |
 |  |
| KIRP (tumor) | KIRP (normal) |
| PDZD4, GFI1B (tumor) | PDZD4, GFI1B (normal) |
 |  |
| LIHC (tumor) | LIHC (normal) |
| PDZD4, GFI1B (tumor) | PDZD4, GFI1B (normal) |
 |  |
| LUAD (tumor) | LUAD (normal) |
| PDZD4, GFI1B (tumor) | PDZD4, GFI1B (normal) |
 |  |
| LUSC (tumor) | LUSC (normal) |
| PDZD4, GFI1B (tumor) | PDZD4, GFI1B (normal) |
 |  |
| PRAD (tumor) | PRAD (normal) |
| PDZD4, GFI1B (tumor) | PDZD4, GFI1B (normal) |
 |  |
| STAD (tumor) | STAD (normal) |
| PDZD4, GFI1B (tumor) | PDZD4, GFI1B (normal) |
 |  |
| THCA (tumor) | THCA (normal) |
| PDZD4, GFI1B (tumor) | PDZD4, GFI1B (normal) |
 |  |
| Top |
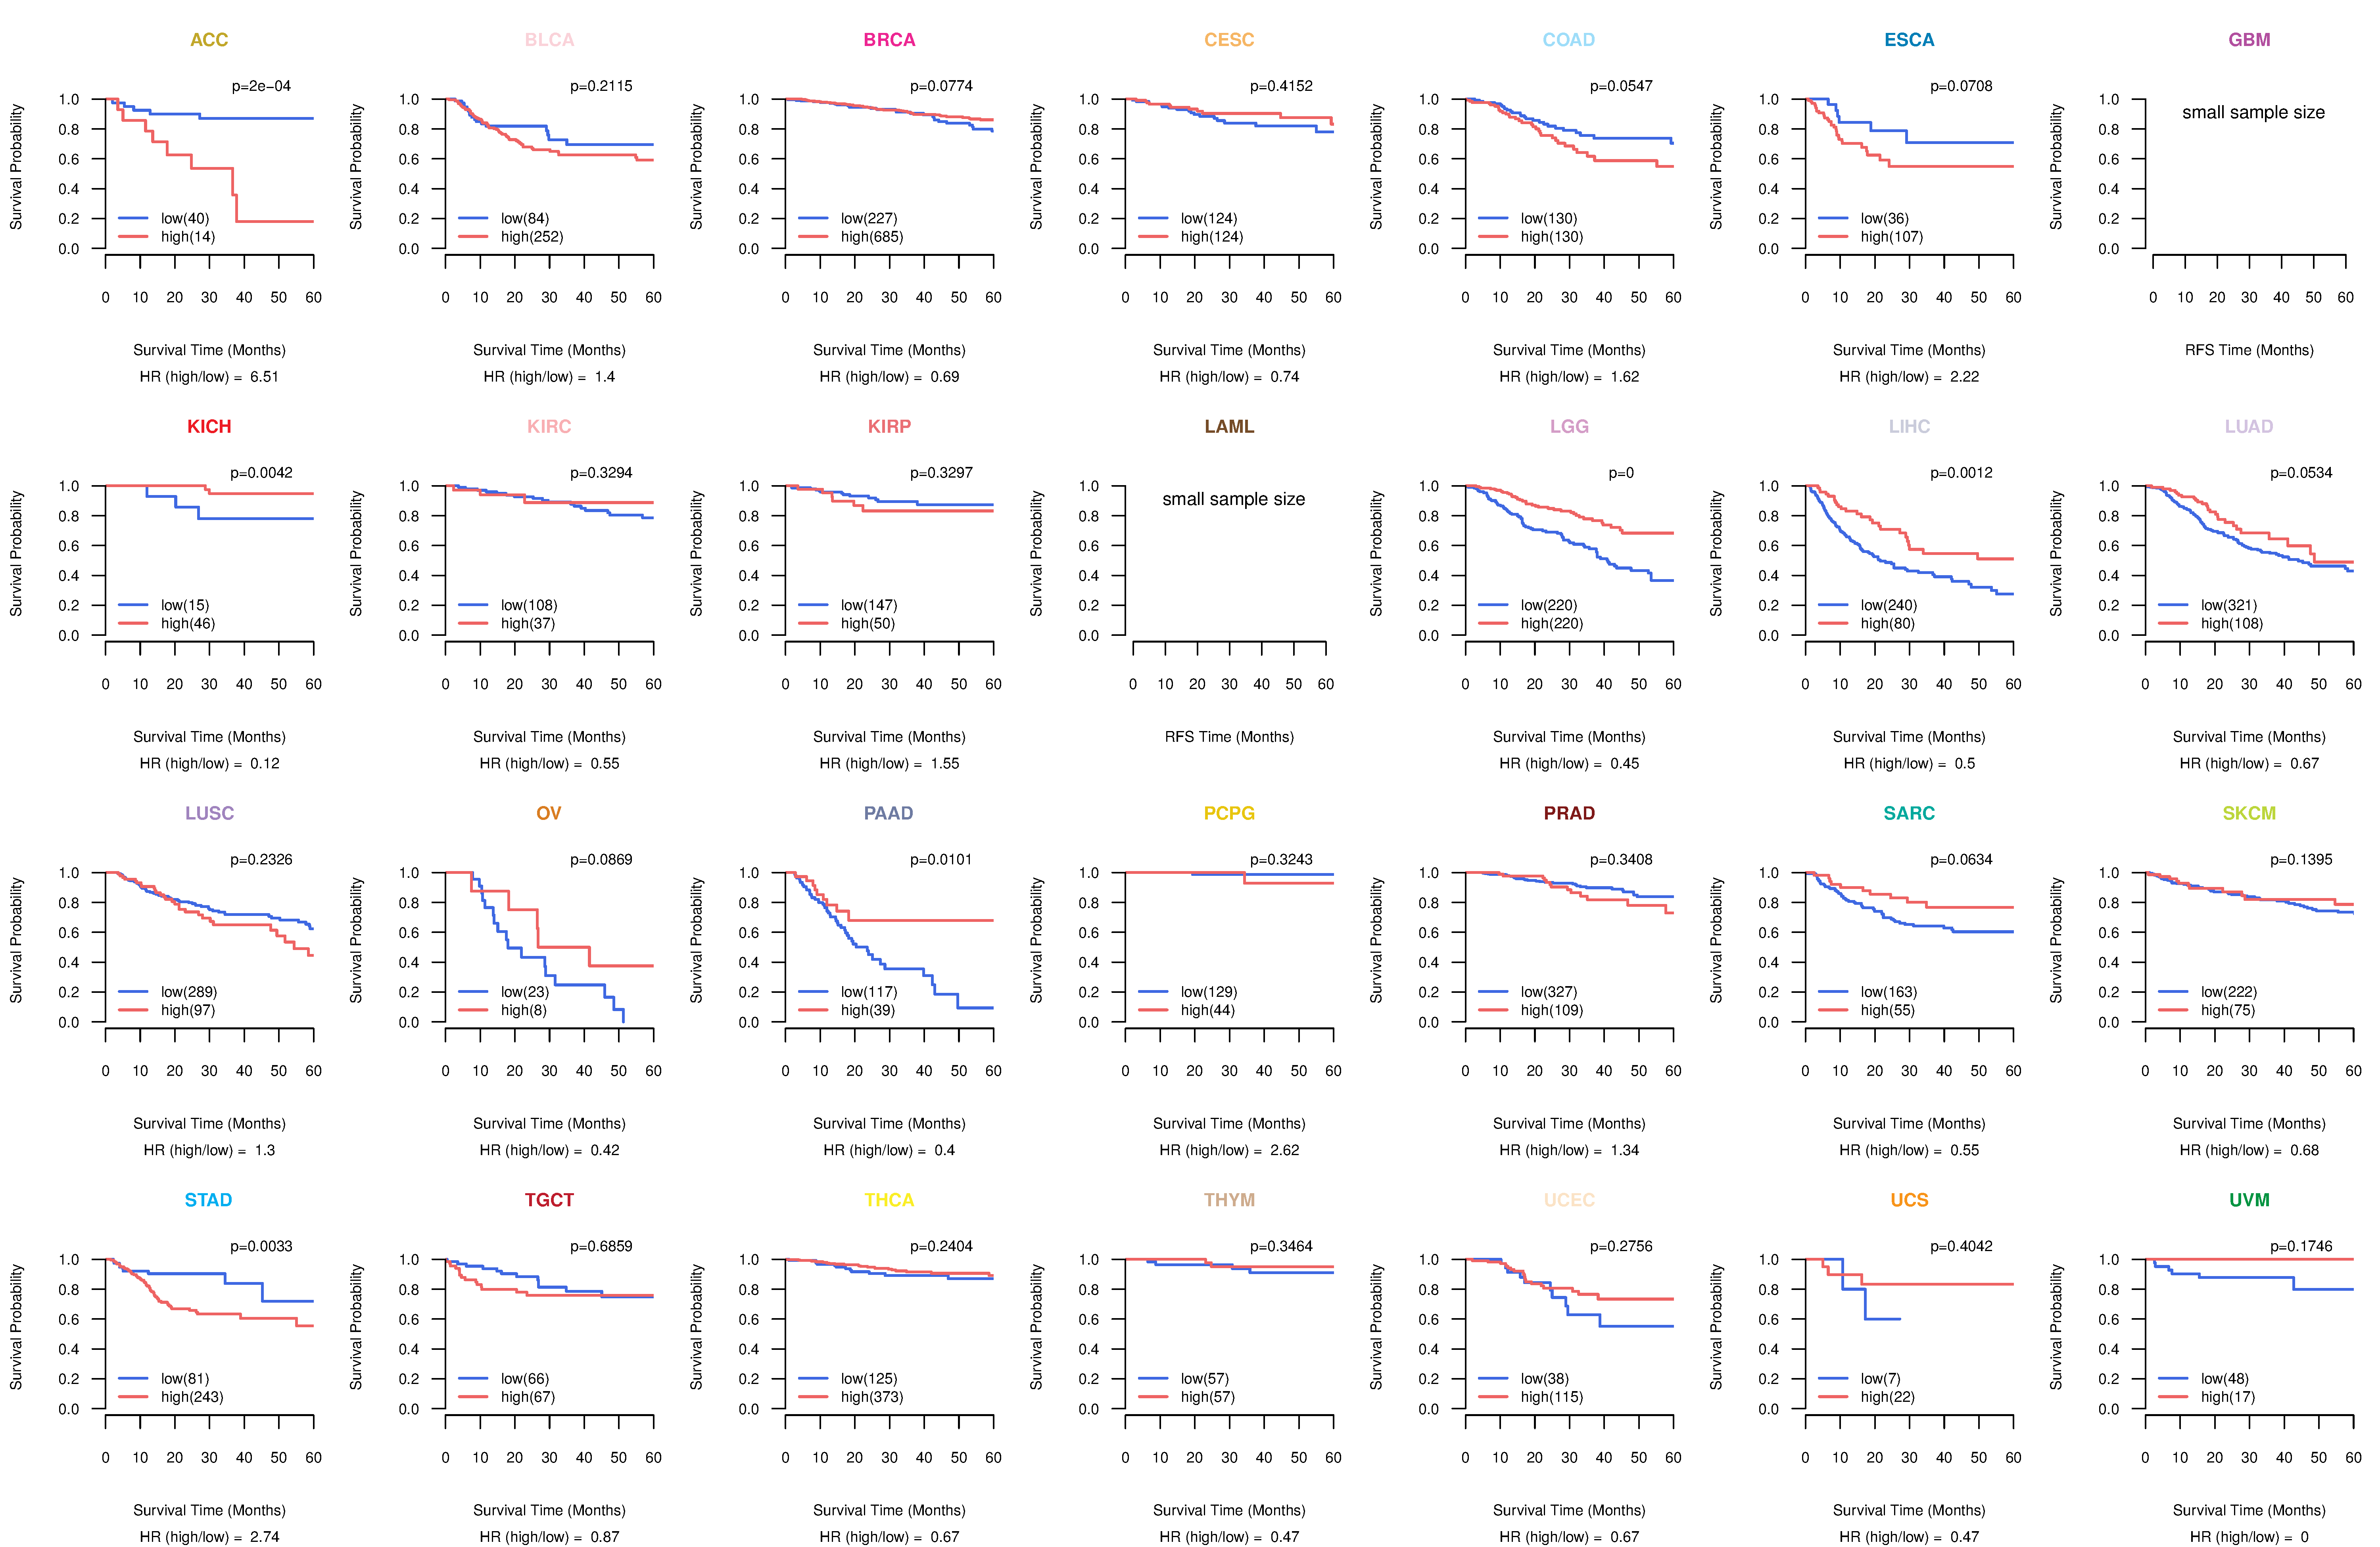
| TissGeneProg for PDZD4 |
| Kaplan-Meier plots with logrank tests of overall survival (OS) using 28 cancer types (TCGA IlluminaHiSeq_RNASeqV2, pan-cancer normalized log2(norm_counts+1) data, version 2016-08-16) (TCGA clinicalMatrix, phenotype data, version 2016-04-27) * Click on the image to enlarge it in a new window. |
 |
| Kaplan-Meier plots with logrank test of relapse free survival (RFS) using 28 cancer types (TCGA IlluminaHiSeq_RNASeqV2, pan-cancer normalized log2(norm_counts+1) data, version 2016-08-16) (TCGA clinicalMatrix, phenotype data, version 2016-04-27) * Click on the image enlarge it in a new window. |
 |
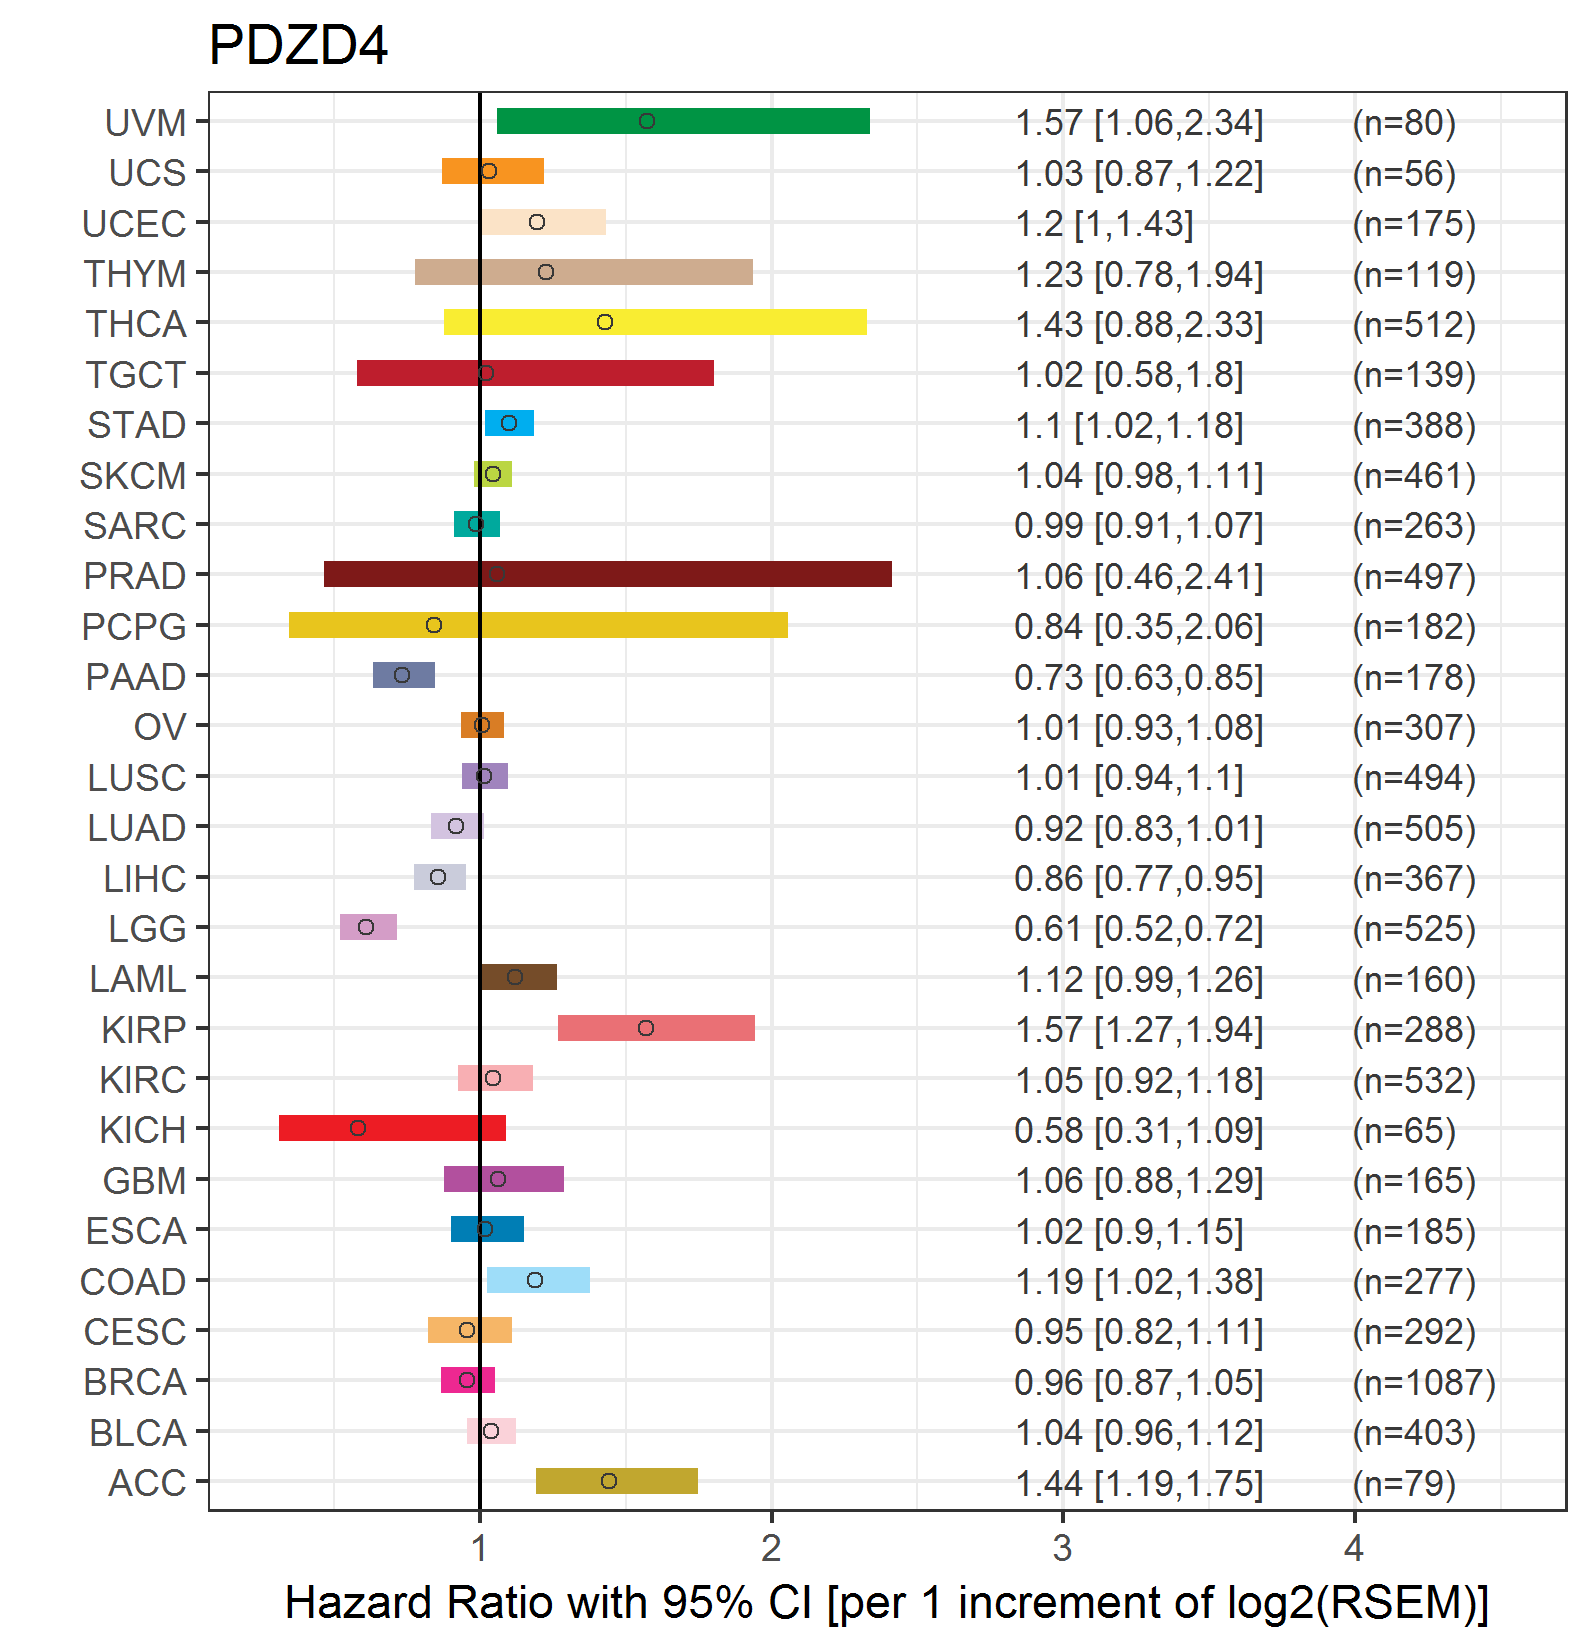
| Forest plot of Cox proportional hazard ratio (HR) and 95% CI of overall survival (OS) using 28 cancer types (TCGA IlluminaHiSeq_RNASeqV2, pan-cancer normalized log2(norm_counts+1) data, version 2016-08-16) (TCGA clinicalMatrix, phenotype data, version 2016-04-27) * Click on the image enlarge it in a new window. |
 |
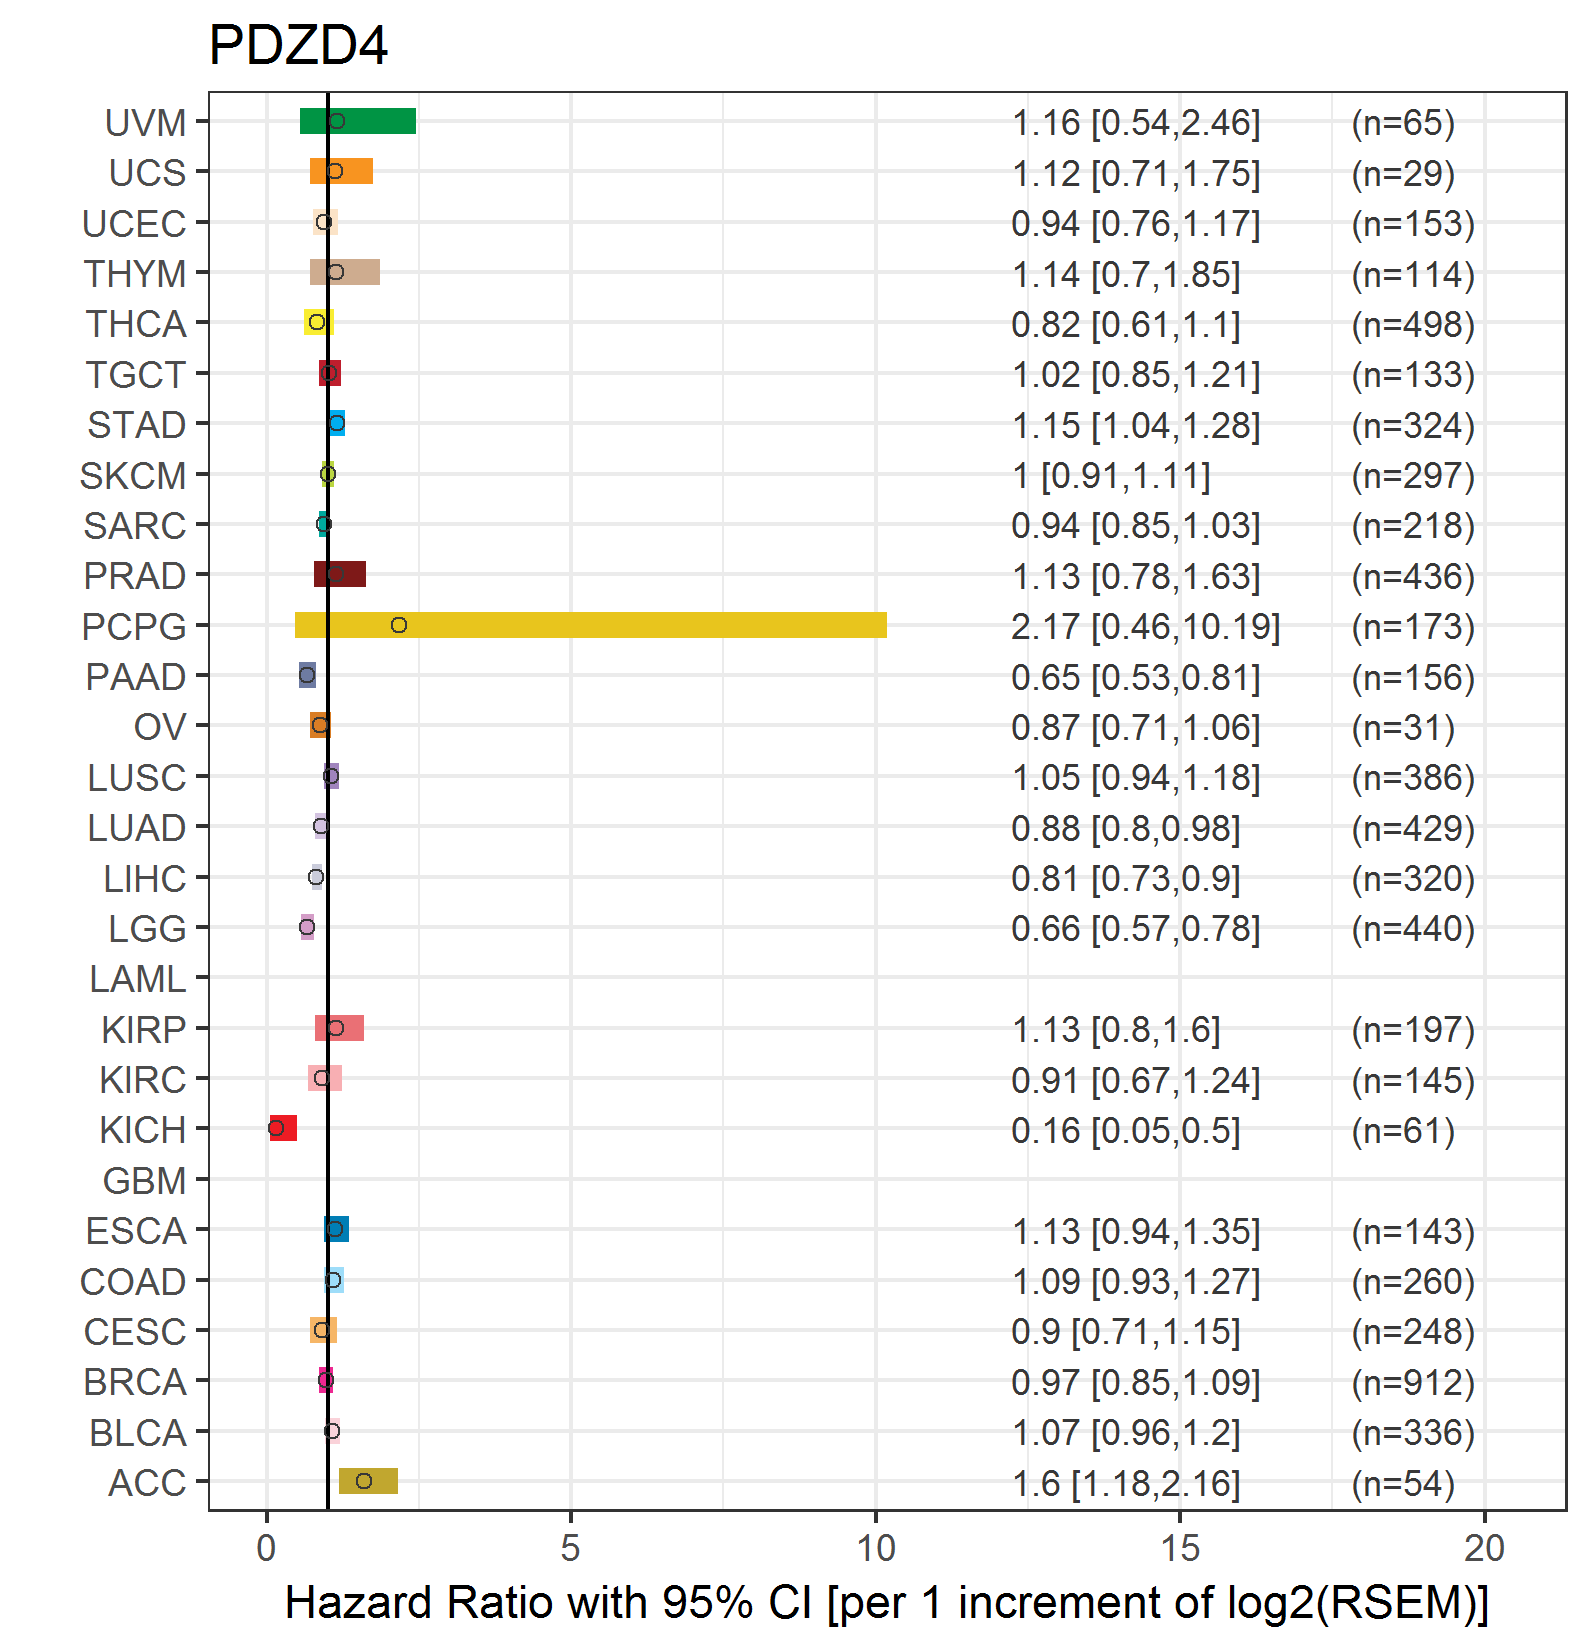
| Forest plot of Cox proportional hazard ratio (HR) and 95% CI of relapse free survival (RFS) using 28 cancer types (TCGA IlluminaHiSeq_RNASeqV2, pan-cancer normalized log2(norm_counts+1) data, version 2016-08-16) (TCGA clinicalMatrix, phenotype data, version 2016-04-27) * Click on the image enlarge it in a new window. |
 |
| Top |
| TissGeneClin for PDZD4 |
| TissGeneDrug for PDZD4 |
| Drug information targeting TissGene (DrugBank Version 5.0.6, 2017-04-01) |
| DrugBank ID | Drug name | Drug activity | Drug type | Drug status |
| Top |
| TissGeneDisease for PDZD4 |
| Disease information associated with TissGene (DisGeNet, 2016-06-01) |
| Disease ID | Disease name | # pubmeds | Source |
| umls:C0039101 | synovial sarcoma | 1 | BeFree |
| umls:C0086981 | Sicca Syndrome | 1 | BeFree |
|
Copyright 2016-Present - The University of Texas Health Science Center at Houston (UTHealth) Web File Viewing | How to Report, Fraud, Waste and Abuse | State of Texas | Statewide Search | Texas Homeland Security | Site Policies |