 |
| |
| |
| |
| |
| |
| |
|

| TissGeneSummary for TRIB3 |
 Gene summary Gene summary |
| Basic gene information | Gene symbol | TRIB3 |
| Gene name | tribbles pseudokinase 3 | |
| Synonyms | C20orf97|NIPK|SINK|SKIP3|TRB3 | |
| Cytomap | UCSC genome browser: 20p13-p12.2 | |
| Type of gene | protein-coding | |
| RefGenes | NM_001301188.1, NM_001301190.1,NM_001301193.1,NM_001301196.1,NM_001301201.1, NM_021158.4, | |
| Description | TRB-3neuronal cell death inducible putative kinaseneuronal cell death-inducible putative kinasep65-interacting inhibitor of NF-kappa-Bp65-interacting inhibitor of NF-kappaBtribbles homolog 3 | |
| Modification date | 20141207 | |
| dbXrefs | MIM : 607898 | |
| HGNC : HGNC | ||
| Ensembl : ENSG00000101255 | ||
| HPRD : 09836 | ||
| Vega : OTTHUMG00000031627 | ||
| Protein | UniProt: go to UniProt's Cross Reference DB Table | |
| Expression | CleanEX: HS_TRIB3 | |
| BioGPS: 57761 | ||
| Pathway | NCI Pathway Interaction Database: TRIB3 | |
| KEGG: TRIB3 | ||
| REACTOME: TRIB3 | ||
| Pathway Commons: TRIB3 | ||
| Context | iHOP: TRIB3 | |
| ligand binding site mutation search in PubMed: TRIB3 | ||
| UCL Cancer Institute: TRIB3 | ||
| Assigned class in TissGDB* | C | |
| Included tissue-specific gene expression resources | TiGER,GTEx | |
| Specific-tissues in normal samples (assigned by TissGDB using HPA, TiGER, and GTEx) | CervixLiver | |
| Cancer types related to the specific-tissues in cancer samples (assigned by TissGDB using TCGA) | CESCLIHC | |
| Reference showing the relevant tissue of TRIB3 | ||
| Description by TissGene annotations | Cancer gene Fused withTSGene | |
| * Class A consists of genes with literature evidence and is part of the cTissGenes. Class B consists of only cTissGenes without additional evidence. The remaining genes belong to Class C. |
| Gene ontology having evidence of Inferred from Direct Assay (IDA) from Entrez |
| GO ID | GO term | PubMed ID | GO:0006469 | negative regulation of protein kinase activity | 12791994 | GO:0034976 | response to endoplasmic reticulum stress | 15775988 | GO:0043405 | regulation of MAP kinase activity | 15299019 | GO:0070059 | intrinsic apoptotic signaling pathway in response to endoplasmic reticulum stress | 15775988 | GO:0006469 | negative regulation of protein kinase activity | 12791994 | GO:0034976 | response to endoplasmic reticulum stress | 15775988 | GO:0043405 | regulation of MAP kinase activity | 15299019 | GO:0070059 | intrinsic apoptotic signaling pathway in response to endoplasmic reticulum stress | 15775988 |
| Top |
| TissGeneExp for TRIB3 |
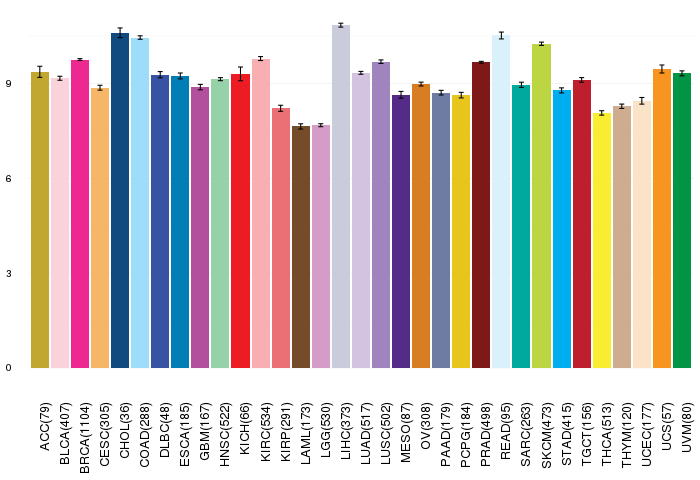
| Gene expressions across 28 cancer types (X-axis: cancer type and Y-axis: log2(norm_counts+1)) (TCGA IlluminaHiSeq_RNASeqV2, pan-cancer normalized log2(norm_counts+1) data, version 2016-08-16) |
 |
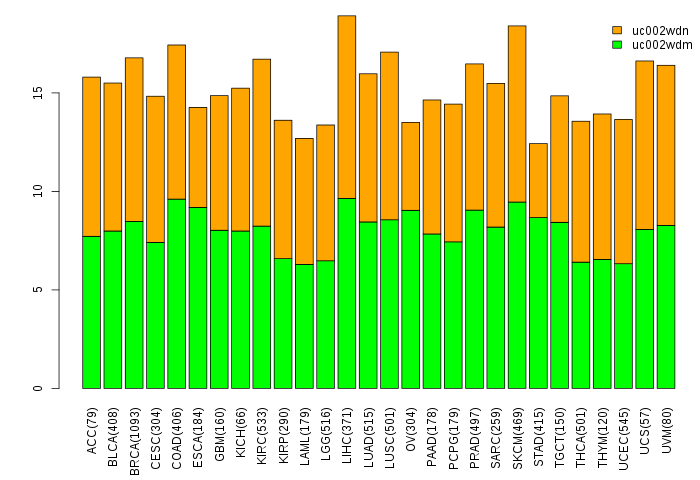
| Gene isoform expressions across 28 cancer types (X-axis: cancer type and Y-axis: log2(norm_counts+1)) (TCGA pan-cancer tcga_rsem_isoform_tpm, version 2016-09-01) |
 |
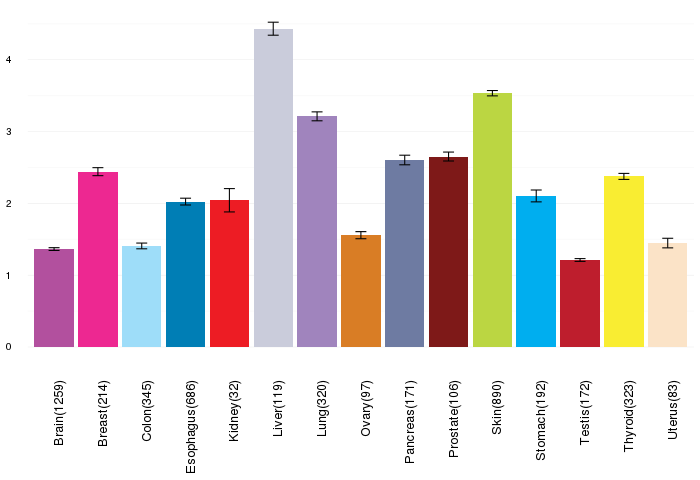
| Gene expressions across normal tissues of GTEx data (GTEx GTEx_Analysis_v6_RNA-seq_RNA-SeQCv1.1.8_gene_rpkm.gct) - Here, we shows the matched tissue types only among our 28 cancer types. |
 |
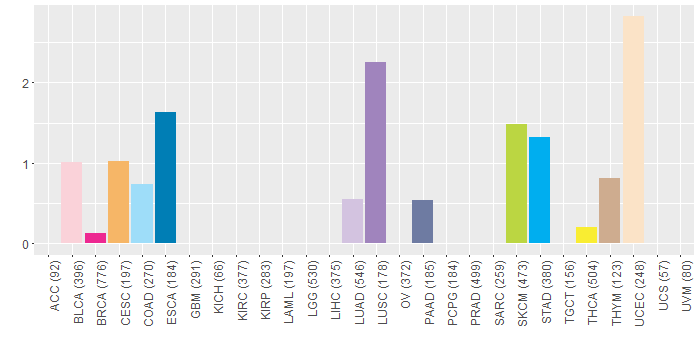
| Different expressions across 14 cancer types with more than 10 samples between matched tumors and normals (X-axis: cancer type and Y-axis: log2(norm_counts+1)) (TCGA IlluminaHiSeq_RNASeqV2, pan-cancer normalized log2(norm_counts+1) data, version 2016-08-16) |
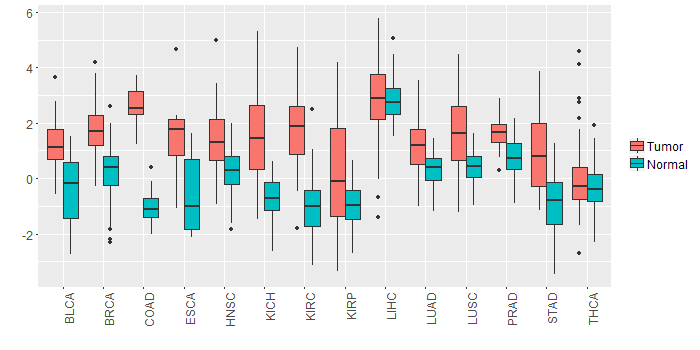 |
| - Significantly differentially expressed cancer types and information. (|Fold change|>1 and FDR<0.05) |
| Cancer type | Mean(exp) in tumor | Mean(exp) in matched normal | Log2FC | P-val. | FDR |
| BRCA | 1.77190663 | 0.222877683 | 1.549028947 | 6.65E-31 | 9.37E-30 |
| KICH | 1.586971121 | -0.635340879 | 2.222312 | 2.67E-06 | 9.34E-06 |
| STAD | 0.999090621 | -0.941712504 | 1.940803125 | 2.39E-07 | 5.43E-06 |
| HNSC | 1.436379866 | 0.230810098 | 1.205569767 | 4.11E-07 | 3.48E-06 |
| KIRC | 1.858348955 | -0.982771879 | 2.841120833 | 1.44E-28 | 2.43E-27 |
| COAD | 2.596256967 | -1.039950725 | 3.636207692 | 1.09E-25 | 2.39E-22 |
| LUSC | 1.673283513 | 0.409038415 | 1.264245098 | 7.18E-08 | 2.05E-07 |
| ESCA | 1.577648576 | -0.591442333 | 2.169090909 | 0.00159 | 0.019866067 |
| KIRP | 0.290018746 | -1.072778129 | 1.362796875 | 0.00145 | 0.00381561 |
| BLCA | 1.244197858 | -0.461854773 | 1.706052632 | 0.000108 | 0.001154769 |
| Top |
| TissGene-miRNA for TRIB3 |
| Significantly anti-correlated miRNAs of TissGene across 28 cancer types (Gene-miRNA relations from TargetScanHuman Relsease 7.1, Conserved_Site_Context_Scores.txt.zip, 06.01.2016) (TCGA IlluminaHiSeq_miRNASeq, log2(RPM+1) data, version 2016-11-21) (TCGA IlluminaHiSeq_RNASeqV2, log2(normalized_count+1) data, version 2016-08-16) (Spearman’s Rank Correlation (p-value<0.05 and coefficient<-0.25)) |
| Cancer type | miRNA id | miRNA accession | P-val. | Coeff. | # samples |
| Top |
| TissGeneMut for TRIB3 |
| TissGeneSNV for TRIB3 |
| nsSNV counts per each loci. Different colors of circles represent different cancer types. Circle size denotes number of samples. (TCGA somatic mutation (SNPs and small INDELs) data, version 2016-04-25) * Click on the image to enlarge it in a new window. |
 |
 |
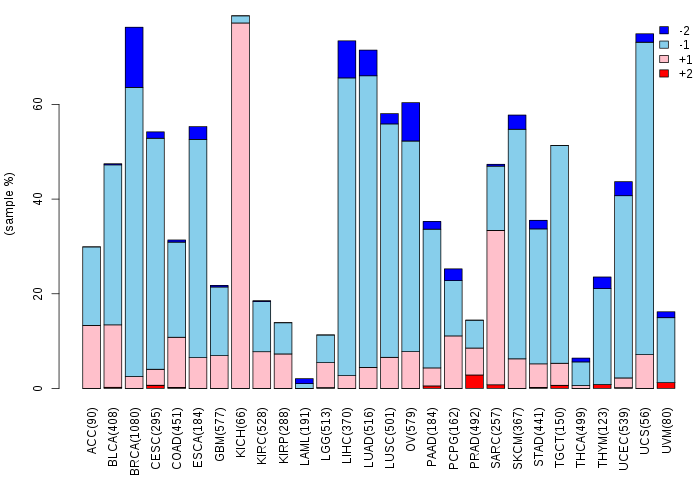
| Somatic nucleotide variants of TissGene across 28 cancer types (X-axis: cancer type and Y-axis: % of mutated samples) The numbers in parentheses are numbers of samples with mutation (nsSNVs). (TCGA somatic mutation (SNPs and small INDELs) data, version 2016-04-25) |
 |
| - nsSNVs sorted by frequency. |
| AAchange | Cancer type | # samples |
| p.V226M | STAD | 1 |
| p.R149* | PAAD | 1 |
| p.A112T | STAD | 1 |
| p.E152K | CESC | 1 |
| p.L170P | STAD | 1 |
| p.R289C | SKCM | 1 |
| p.L304V | SKCM | 1 |
| p.R36* | UCEC | 1 |
| p.K219E | THYM | 1 |
| p.R316* | ESCA | 1 |
| p.A169T | UCEC | 1 |
| p.P300L | ESCA | 1 |
| p.D218G | COAD | 1 |
| p.V208M | BLCA | 1 |
| p.L52S | LUSC | 1 |
| p.P155S | SKCM | 1 |
| p.R56H | UCEC | 1 |
| p.A59V | STAD | 1 |
| p.L329V | BLCA | 1 |
| p.R139Q | COAD | 1 |
| p.S206F | BLCA | 1 |
| p.G368V | LUSC | 1 |
| p.E302K | BLCA | 1 |
| p.A55V | UCEC | 1 |
| p.V62L | LUAD | 1 |
| p.R274C | STAD | 1 |
| p.G211R | LUAD | 1 |
| p.R316X | ESCA | 1 |
| p.R149X | PAAD | 1 |
| p.R29H | STAD | 1 |
| p.A112T | ESCA | 1 |
| p.R275H | THCA | 1 |
| p.T168I | SKCM | 1 |
| p.V276L | LUSC | 1 |
| p.R29H | UCEC | 1 |
| p.R36Q | UCEC | 1 |
| p.V226M | UCEC | 1 |
| p.R67S | SKCM | 1 |
| p.R81Q | READ | 1 |
| p.K299N | CESC | 1 |
| p.R191H | UCEC | 1 |
| p.R2* | UCEC | 1 |
| p.R293S | SKCM | 1 |
| p.P52S | SKCM | 1 |
| p.R108W | LUSC | 1 |
| p.Q32H | BRCA | 1 |
| p.A277T | UCEC | 1 |
| p.R326Q | LUAD | 1 |
| Top |
| TissGeneCNV for TRIB3 |
| Copy number variations of TissGene across 28 cancer types (X-axis: cancer type and Y-axis: % of CNV samples) (TCGA Gistic2_CopyNumber_Gistic2_all_data_by_genes, Gistic2 copy number data, version 2016-08-16) |
 |
| Top |
| TissGeneFusions for TRIB3 |
| Fusion genes including TissGene (ChimerDB 3.0, 2016-12-01 and TCGA fusion Portal 2015-12-01) |
| Database | Src | Cancer type | Sample | Fusion gene | ORF | 5'-gene BP | 3'-gene BP |
| Chimerdb3.0 | ChiTaRs | NA | BP240144 | TRIB3-NADK2 | chr20:368874 | chr5:36227578 | |
| Chimerdb3.0 | ChiTaRs | NA | U02019 | TRIB3-WASF2 | chr20:377410 | chr1:27783598 | |
| TCGAfusionPortal | PRADA | LGG | TCGA-DU-8163-01A | BMP2-TRIB3 | 5UTR-CDS | Chr20:6749522 | Chr20:368655 |
| TCGAfusionPortal | PRADA | LUAD | TCGA-75-6211-01A | TRIB3-DEFB125 | Out-of-frame | Chr20:368945 | Chr20:76646 |
| Top |
| TissGeneNet for TRIB3 |
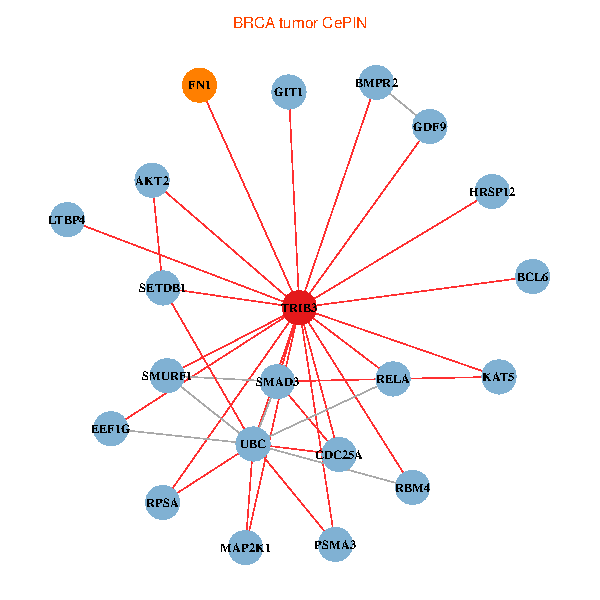
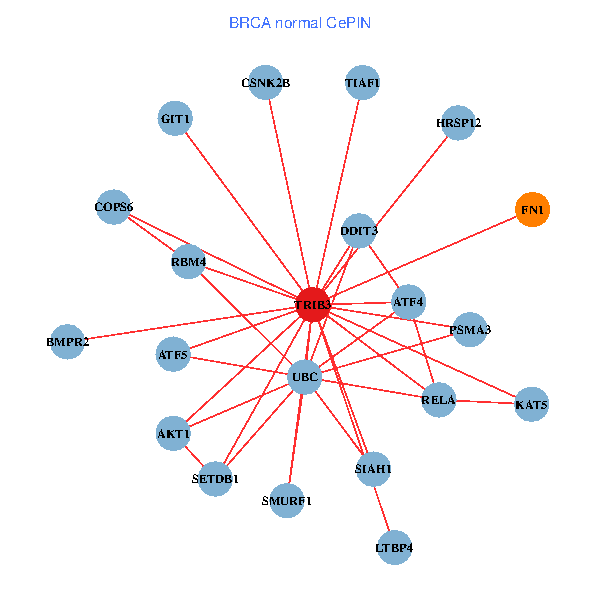
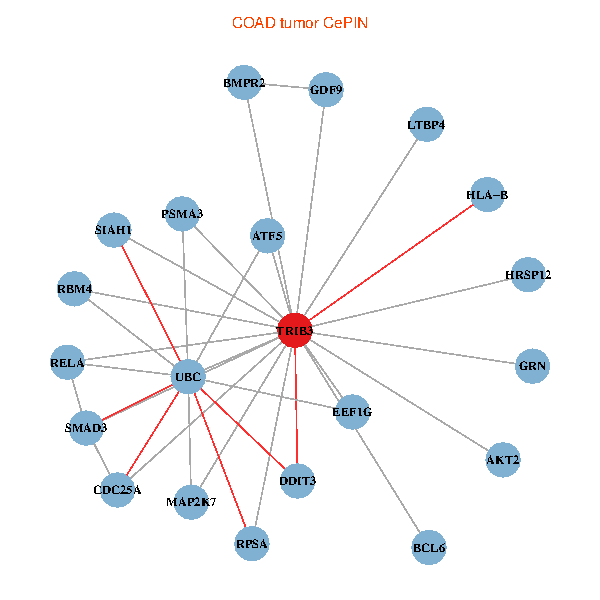
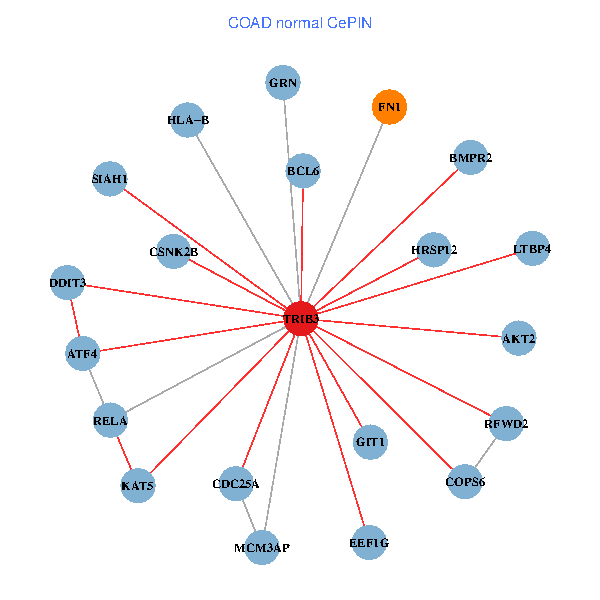
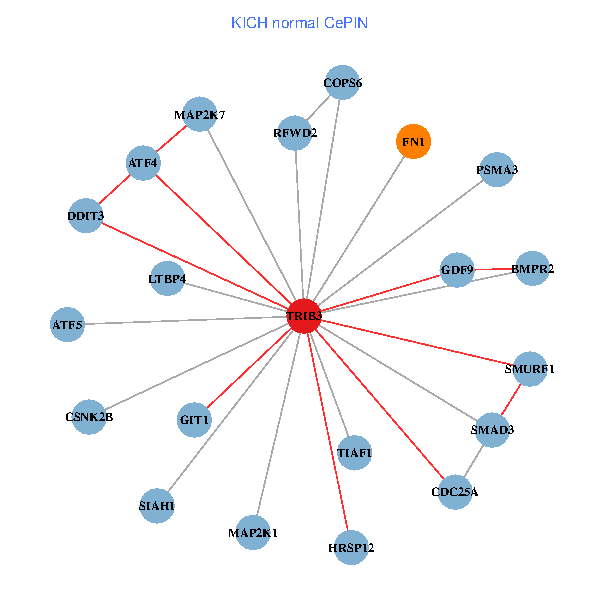
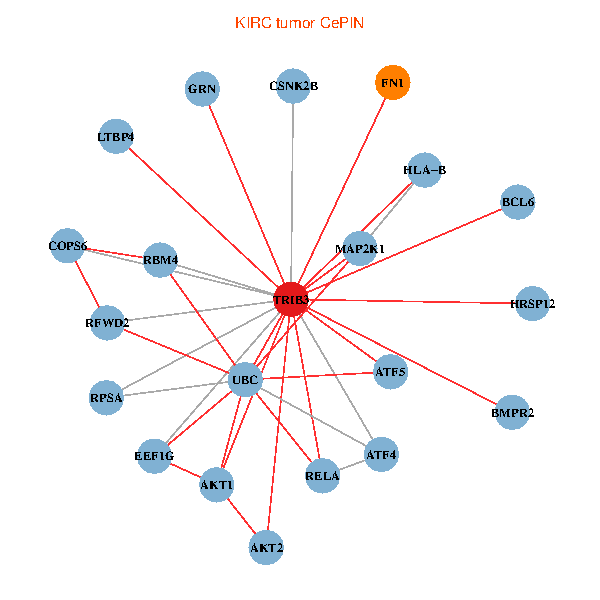
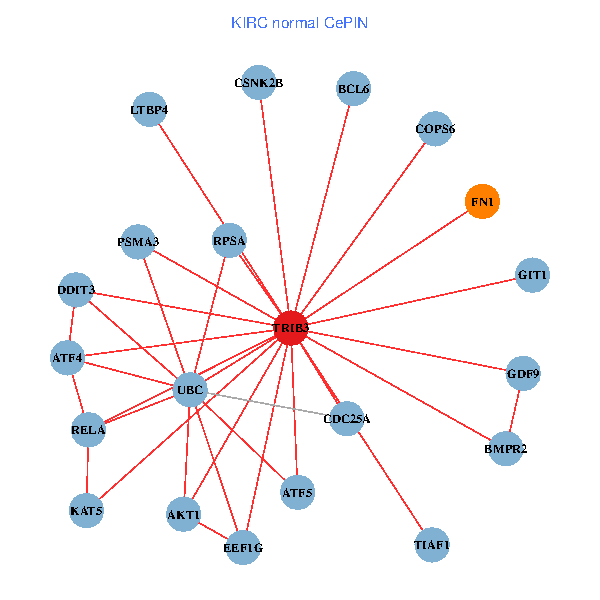
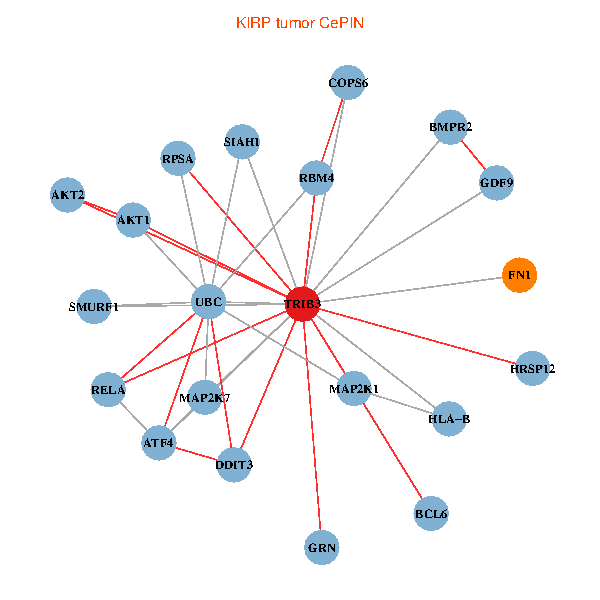
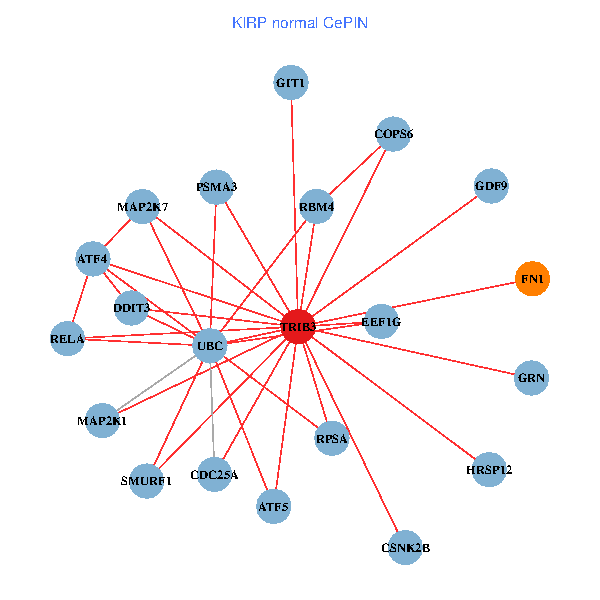
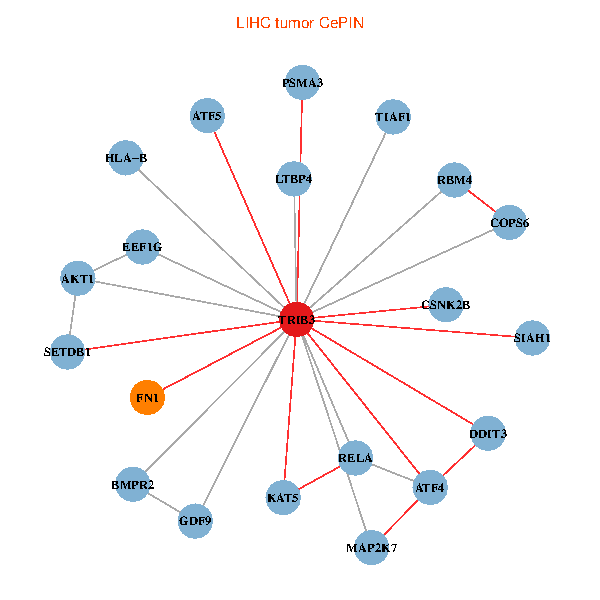
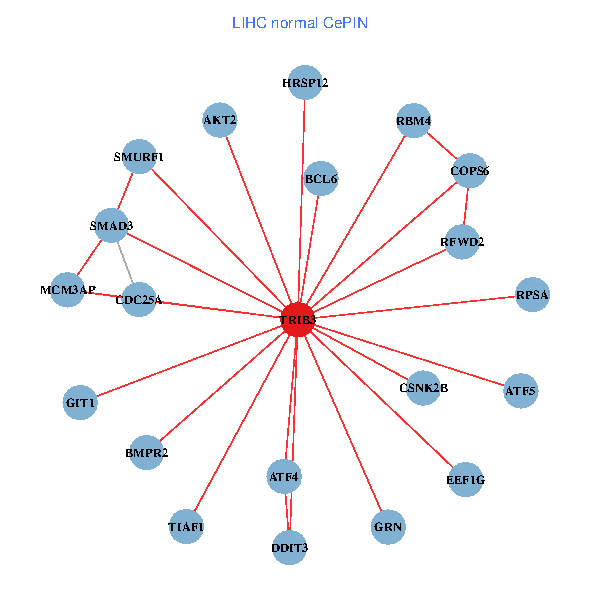
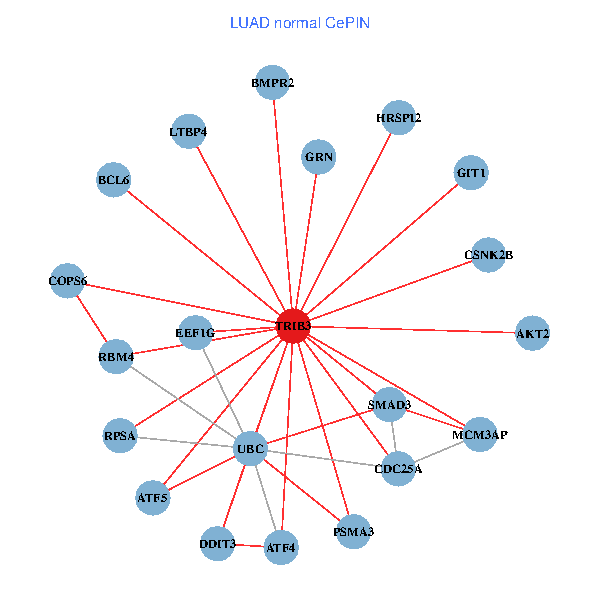
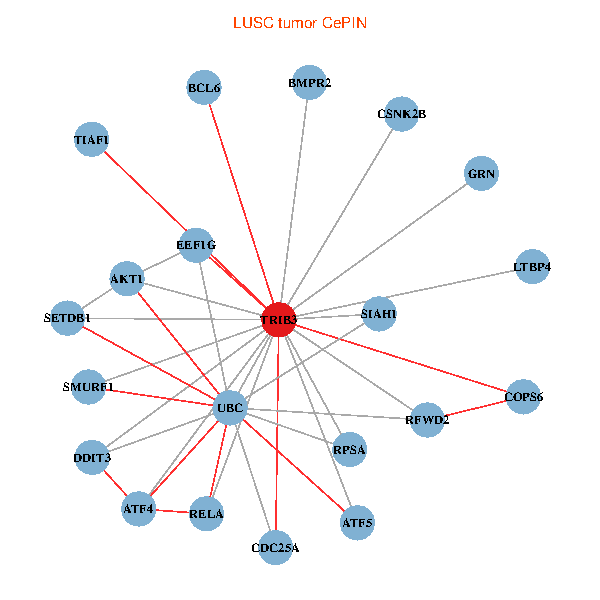
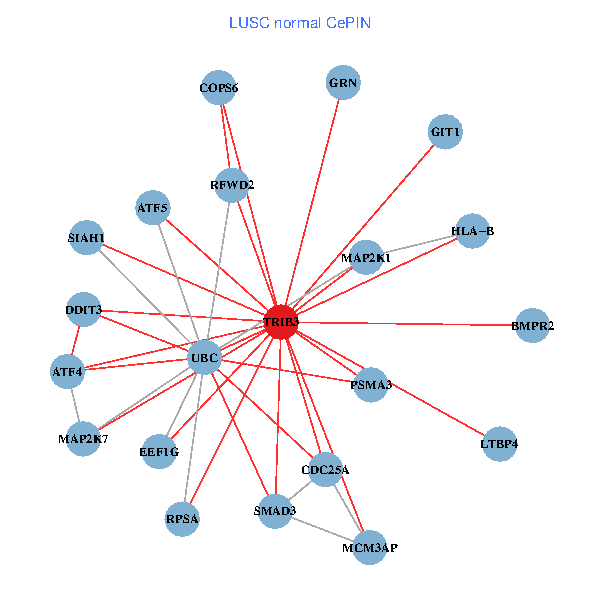
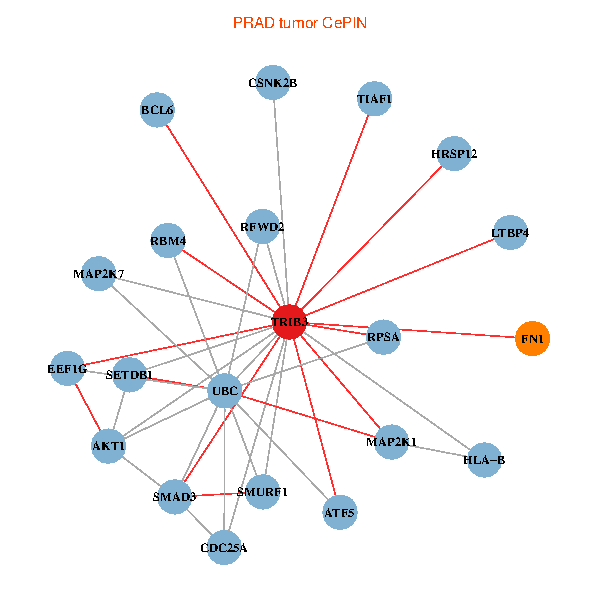
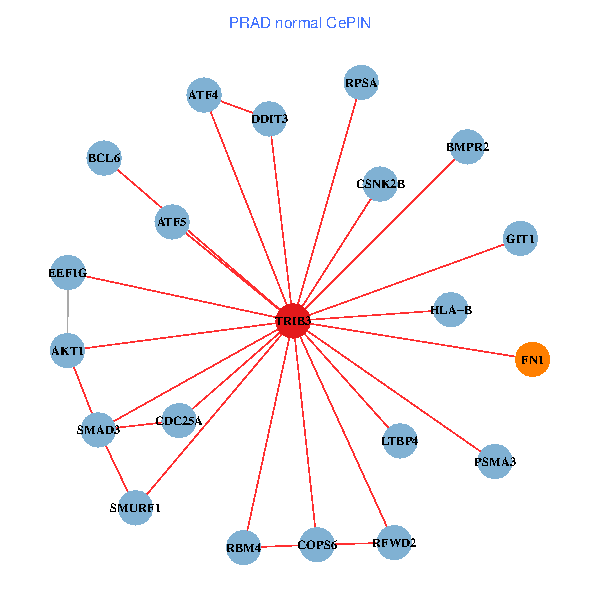
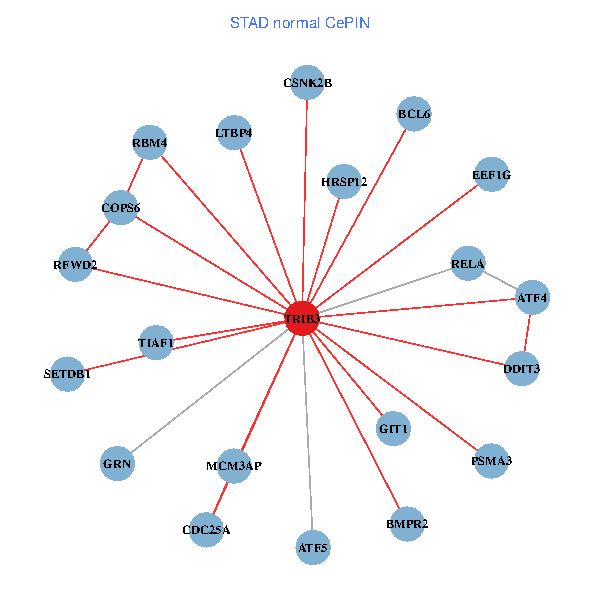
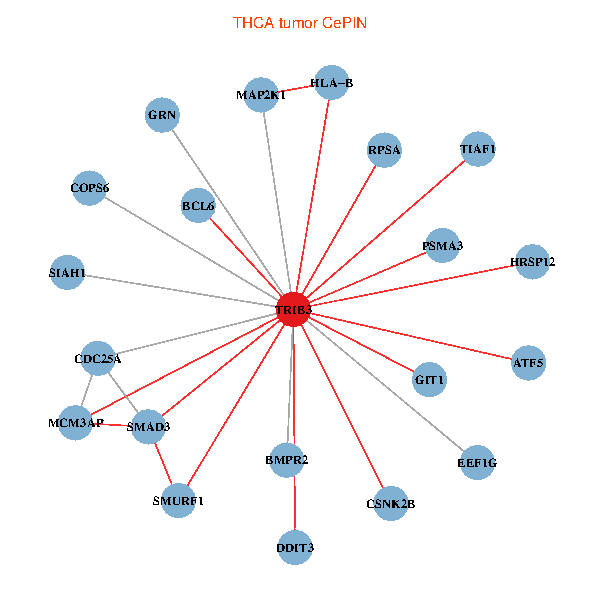
| Co-expressed gene networks based on protein-protein interaction data (CePIN) (TCGA IlluminaHiSeq_RNASeqV2, pan-cancer normalized log2(norm_counts+1) data, version 2016-08-16) (PINA2 ppi data) |
| BRCA (tumor) | BRCA (normal) |
| TRIB3, KAT5, SMAD3, UBC, RELA, SETDB1, BCL6, FN1, MAP2K1, GDF9, SMURF1, RPSA, GIT1, PSMA3, AKT2, EEF1G, BMPR2, CDC25A, HRSP12, LTBP4, RBM4 (tumor) | TRIB3, COPS6, KAT5, UBC, RELA, SETDB1, FN1, ATF5, SMURF1, AKT1, DDIT3, GIT1, CSNK2B, PSMA3, SIAH1, BMPR2, ATF4, HRSP12, LTBP4, RBM4, TIAF1 (normal) |
 |  |
| COAD (tumor) | COAD (normal) |
| TRIB3, SMAD3, UBC, RELA, HLA-B, BCL6, GDF9, ATF5, RPSA, DDIT3, PSMA3, AKT2, SIAH1, EEF1G, BMPR2, MAP2K7, CDC25A, GRN, HRSP12, LTBP4, RBM4 (tumor) | TRIB3, COPS6, KAT5, RELA, HLA-B, BCL6, FN1, DDIT3, GIT1, CSNK2B, AKT2, SIAH1, EEF1G, BMPR2, CDC25A, ATF4, GRN, HRSP12, MCM3AP, RFWD2, LTBP4 (normal) |
 |  |
| HNSC (tumor) | HNSC (normal) |
| TRIB3, COPS6, KAT5, SMAD3, RELA, SETDB1, HLA-B, BCL6, GDF9, RPSA, CSNK2B, SIAH1, EEF1G, BMPR2, ATF4, GRN, HRSP12, MCM3AP, RFWD2, LTBP4, RBM4 (tumor) | TRIB3, COPS6, SMAD3, RELA, SETDB1, BCL6, RPSA, DDIT3, GIT1, CSNK2B, PSMA3, AKT2, EEF1G, BMPR2, ATF4, HRSP12, MCM3AP, RFWD2, LTBP4, RBM4, TIAF1 (normal) |
 |  |
| KICH (tumor) | KICH (normal) |
| TRIB3, KAT5, SMAD3, UBC, RELA, BCL6, FN1, MAP2K1, AKT1, RPSA, DDIT3, GIT1, CSNK2B, PSMA3, AKT2, BMPR2, MAP2K7, GRN, HRSP12, LTBP4, RBM4 (tumor) | TRIB3, COPS6, SMAD3, FN1, MAP2K1, GDF9, ATF5, SMURF1, DDIT3, GIT1, CSNK2B, PSMA3, SIAH1, BMPR2, MAP2K7, CDC25A, ATF4, HRSP12, RFWD2, LTBP4, TIAF1 (normal) |
 |  |
| KIRC (tumor) | KIRC (normal) |
| TRIB3, COPS6, UBC, RELA, HLA-B, BCL6, FN1, MAP2K1, ATF5, AKT1, RPSA, CSNK2B, AKT2, EEF1G, BMPR2, ATF4, GRN, HRSP12, RFWD2, LTBP4, RBM4 (tumor) | TRIB3, COPS6, KAT5, UBC, RELA, BCL6, FN1, GDF9, ATF5, AKT1, RPSA, DDIT3, GIT1, CSNK2B, PSMA3, EEF1G, BMPR2, CDC25A, ATF4, LTBP4, TIAF1 (normal) |
 |  |
| KIRP (tumor) | KIRP (normal) |
| TRIB3, COPS6, UBC, RELA, HLA-B, BCL6, FN1, MAP2K1, GDF9, SMURF1, AKT1, RPSA, DDIT3, AKT2, SIAH1, BMPR2, MAP2K7, ATF4, GRN, HRSP12, RBM4 (tumor) | TRIB3, COPS6, UBC, RELA, FN1, MAP2K1, GDF9, ATF5, SMURF1, RPSA, DDIT3, GIT1, CSNK2B, PSMA3, EEF1G, MAP2K7, CDC25A, ATF4, GRN, HRSP12, RBM4 (normal) |
 |  |
| LIHC (tumor) | LIHC (normal) |
| TRIB3, COPS6, KAT5, RELA, SETDB1, HLA-B, FN1, GDF9, ATF5, AKT1, DDIT3, CSNK2B, PSMA3, SIAH1, EEF1G, BMPR2, MAP2K7, ATF4, LTBP4, RBM4, TIAF1 (tumor) | TRIB3, COPS6, SMAD3, BCL6, ATF5, SMURF1, RPSA, DDIT3, GIT1, CSNK2B, AKT2, EEF1G, BMPR2, CDC25A, ATF4, GRN, HRSP12, MCM3AP, RFWD2, RBM4, TIAF1 (normal) |
 |  |
| LUAD (tumor) | LUAD (normal) |
| TRIB3, COPS6, KAT5, SMAD3, UBC, RELA, BCL6, SMURF1, AKT1, RPSA, CSNK2B, PSMA3, AKT2, EEF1G, BMPR2, CDC25A, GRN, MCM3AP, RFWD2, LTBP4, RBM4 (tumor) | TRIB3, COPS6, SMAD3, UBC, BCL6, ATF5, RPSA, DDIT3, GIT1, CSNK2B, PSMA3, AKT2, EEF1G, BMPR2, CDC25A, ATF4, GRN, HRSP12, MCM3AP, LTBP4, RBM4 (normal) |
 |  |
| LUSC (tumor) | LUSC (normal) |
| TRIB3, COPS6, UBC, RELA, SETDB1, BCL6, ATF5, SMURF1, AKT1, RPSA, DDIT3, CSNK2B, SIAH1, EEF1G, BMPR2, CDC25A, ATF4, GRN, RFWD2, LTBP4, TIAF1 (tumor) | TRIB3, COPS6, SMAD3, UBC, HLA-B, MAP2K1, ATF5, RPSA, DDIT3, GIT1, PSMA3, SIAH1, EEF1G, BMPR2, MAP2K7, CDC25A, ATF4, GRN, MCM3AP, RFWD2, LTBP4 (normal) |
 |  |
| PRAD (tumor) | PRAD (normal) |
| TRIB3, SMAD3, UBC, SETDB1, HLA-B, BCL6, FN1, MAP2K1, ATF5, SMURF1, AKT1, RPSA, CSNK2B, EEF1G, MAP2K7, CDC25A, HRSP12, RFWD2, LTBP4, RBM4, TIAF1 (tumor) | TRIB3, COPS6, SMAD3, HLA-B, BCL6, FN1, ATF5, SMURF1, AKT1, RPSA, DDIT3, GIT1, CSNK2B, PSMA3, EEF1G, BMPR2, CDC25A, ATF4, RFWD2, LTBP4, RBM4 (normal) |
 |  |
| STAD (tumor) | STAD (normal) |
| TRIB3, COPS6, KAT5, SMAD3, UBC, RELA, SETDB1, FN1, MAP2K1, SMURF1, AKT1, DDIT3, GIT1, AKT2, SIAH1, EEF1G, BMPR2, CDC25A, ATF4, GRN, LTBP4 (tumor) | TRIB3, COPS6, RELA, SETDB1, BCL6, ATF5, DDIT3, GIT1, CSNK2B, PSMA3, EEF1G, BMPR2, CDC25A, ATF4, GRN, HRSP12, MCM3AP, RFWD2, LTBP4, RBM4, TIAF1 (normal) |
 |  |
| THCA (tumor) | THCA (normal) |
| TRIB3, COPS6, SMAD3, HLA-B, BCL6, MAP2K1, ATF5, SMURF1, RPSA, DDIT3, GIT1, CSNK2B, PSMA3, SIAH1, EEF1G, BMPR2, CDC25A, GRN, HRSP12, MCM3AP, TIAF1 (tumor) | TRIB3, SMAD3, UBC, SETDB1, BCL6, ATF5, SMURF1, AKT1, RPSA, DDIT3, GIT1, AKT2, SIAH1, EEF1G, BMPR2, CDC25A, ATF4, GRN, LTBP4, RBM4, TIAF1 (normal) |
 |  |
| Top |
| TissGeneProg for TRIB3 |
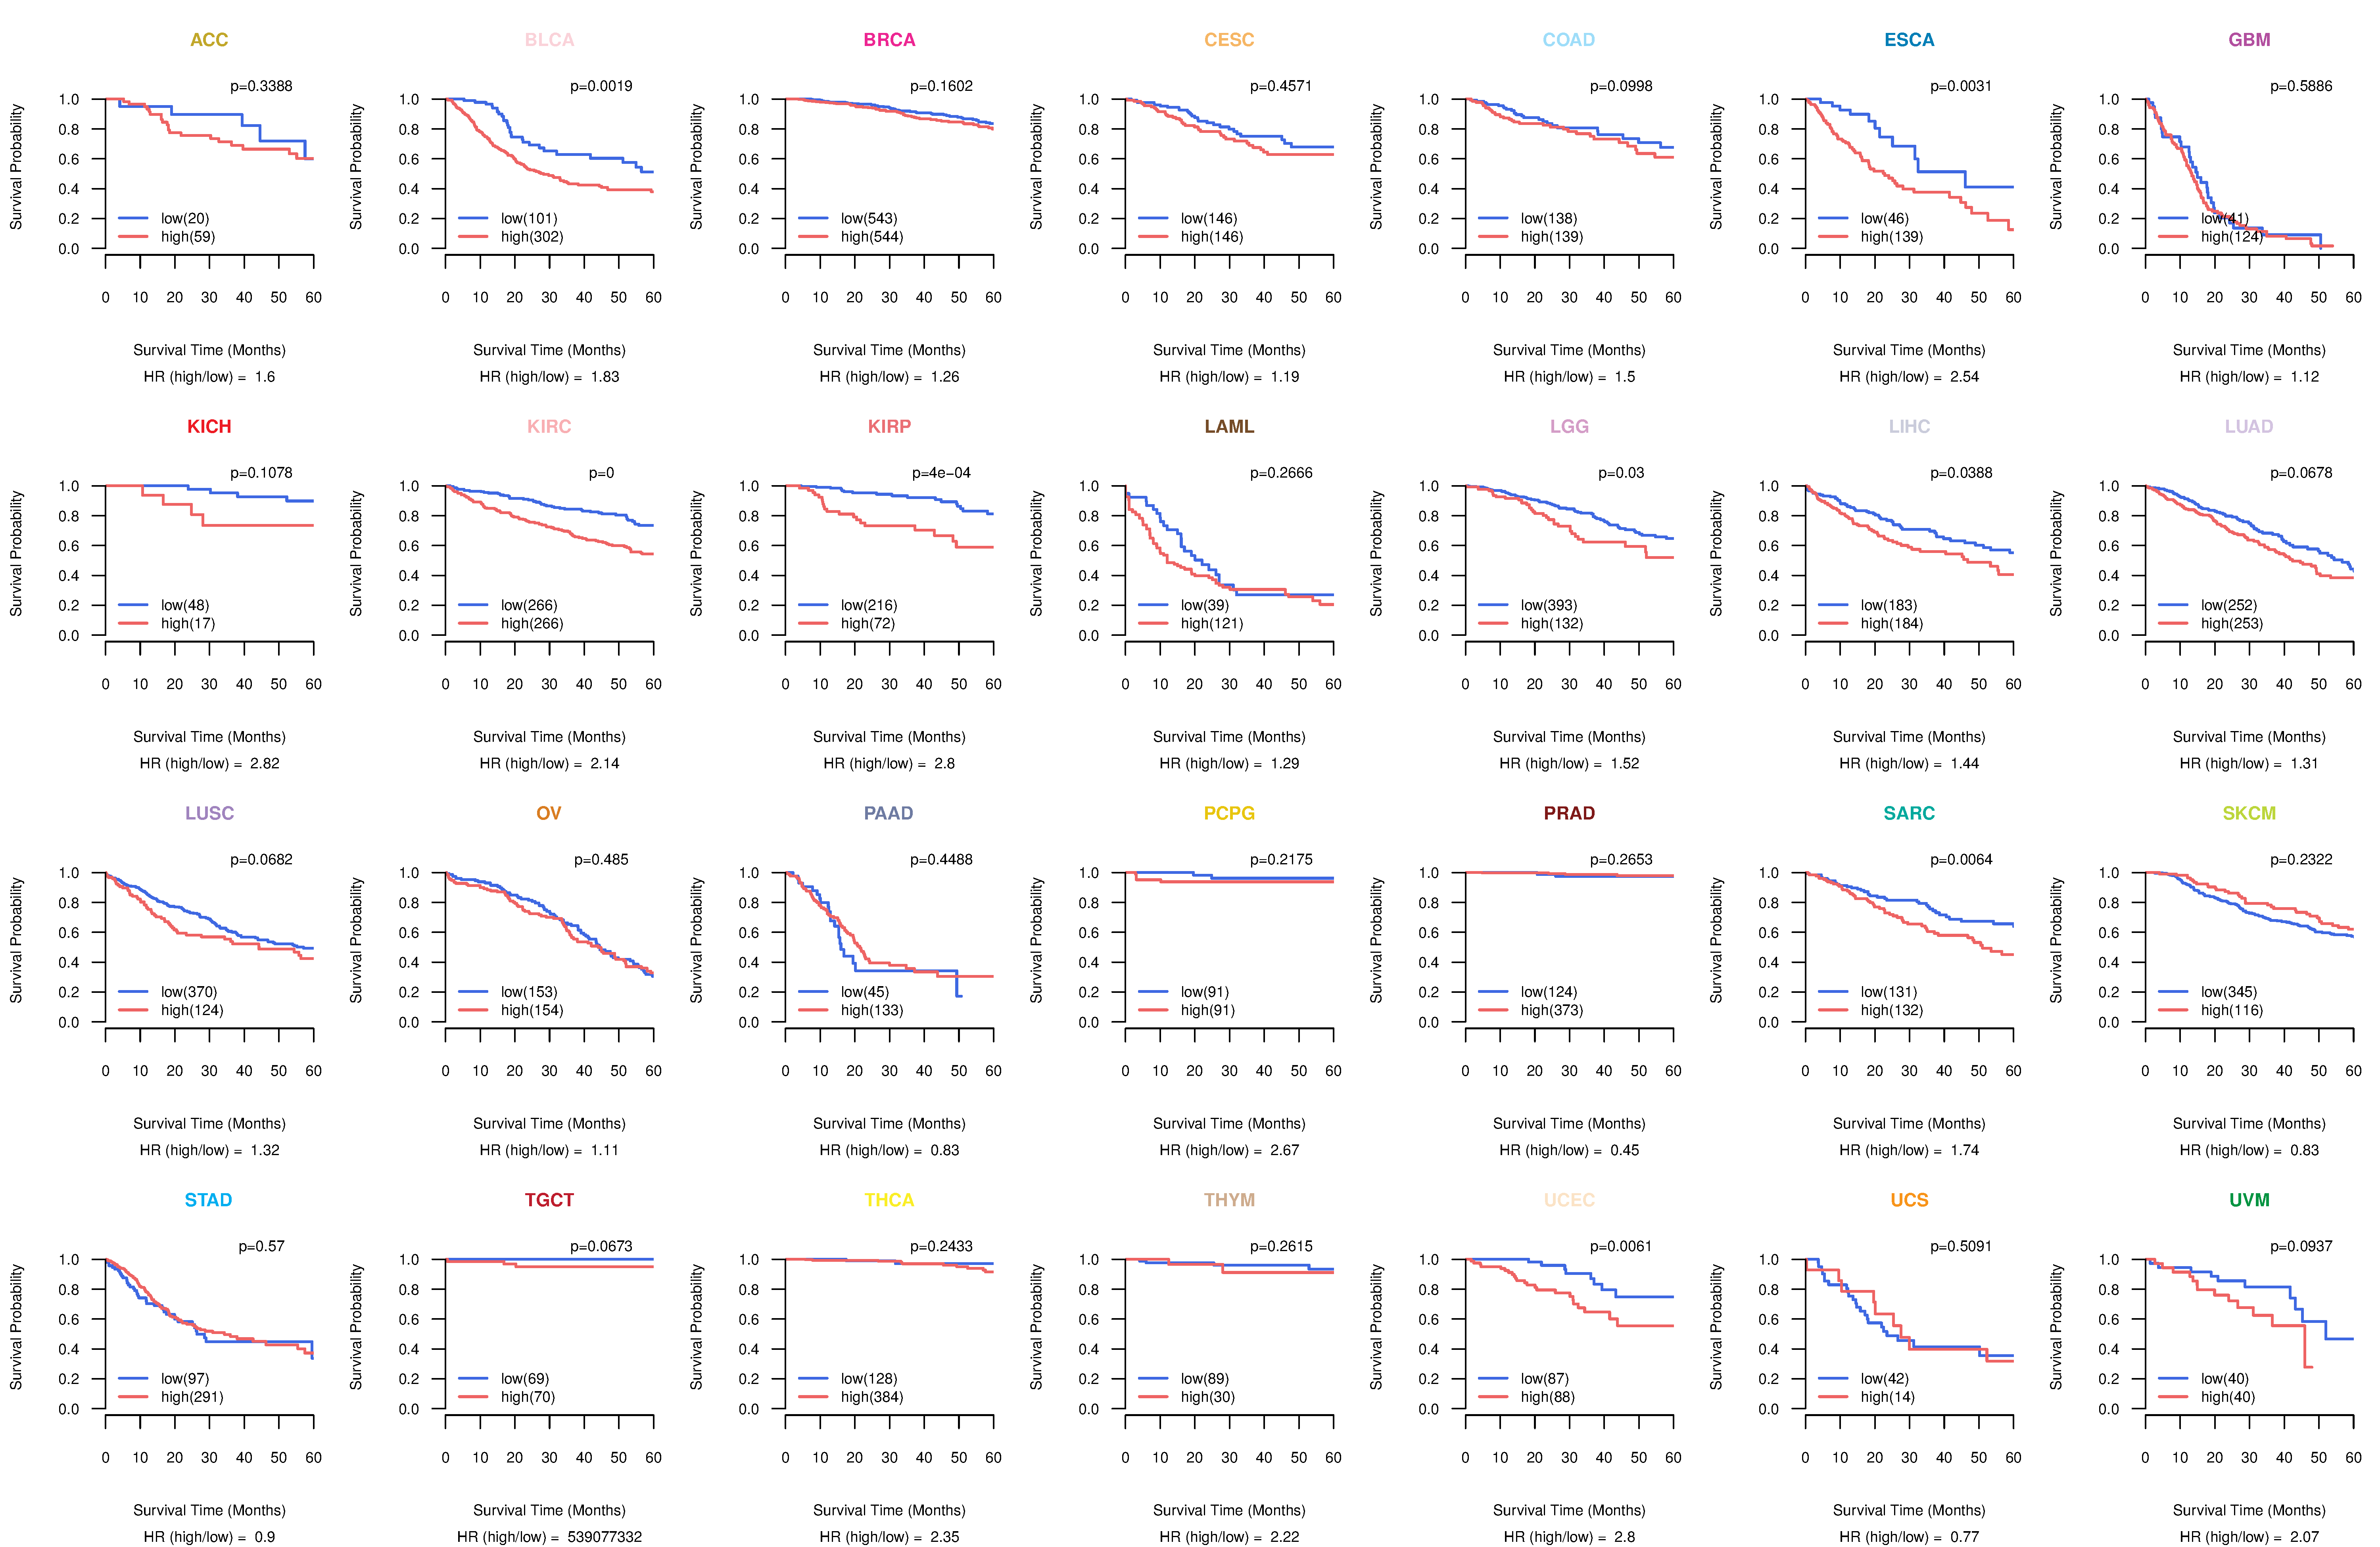
| Kaplan-Meier plots with logrank tests of overall survival (OS) using 28 cancer types (TCGA IlluminaHiSeq_RNASeqV2, pan-cancer normalized log2(norm_counts+1) data, version 2016-08-16) (TCGA clinicalMatrix, phenotype data, version 2016-04-27) * Click on the image to enlarge it in a new window. |
 |
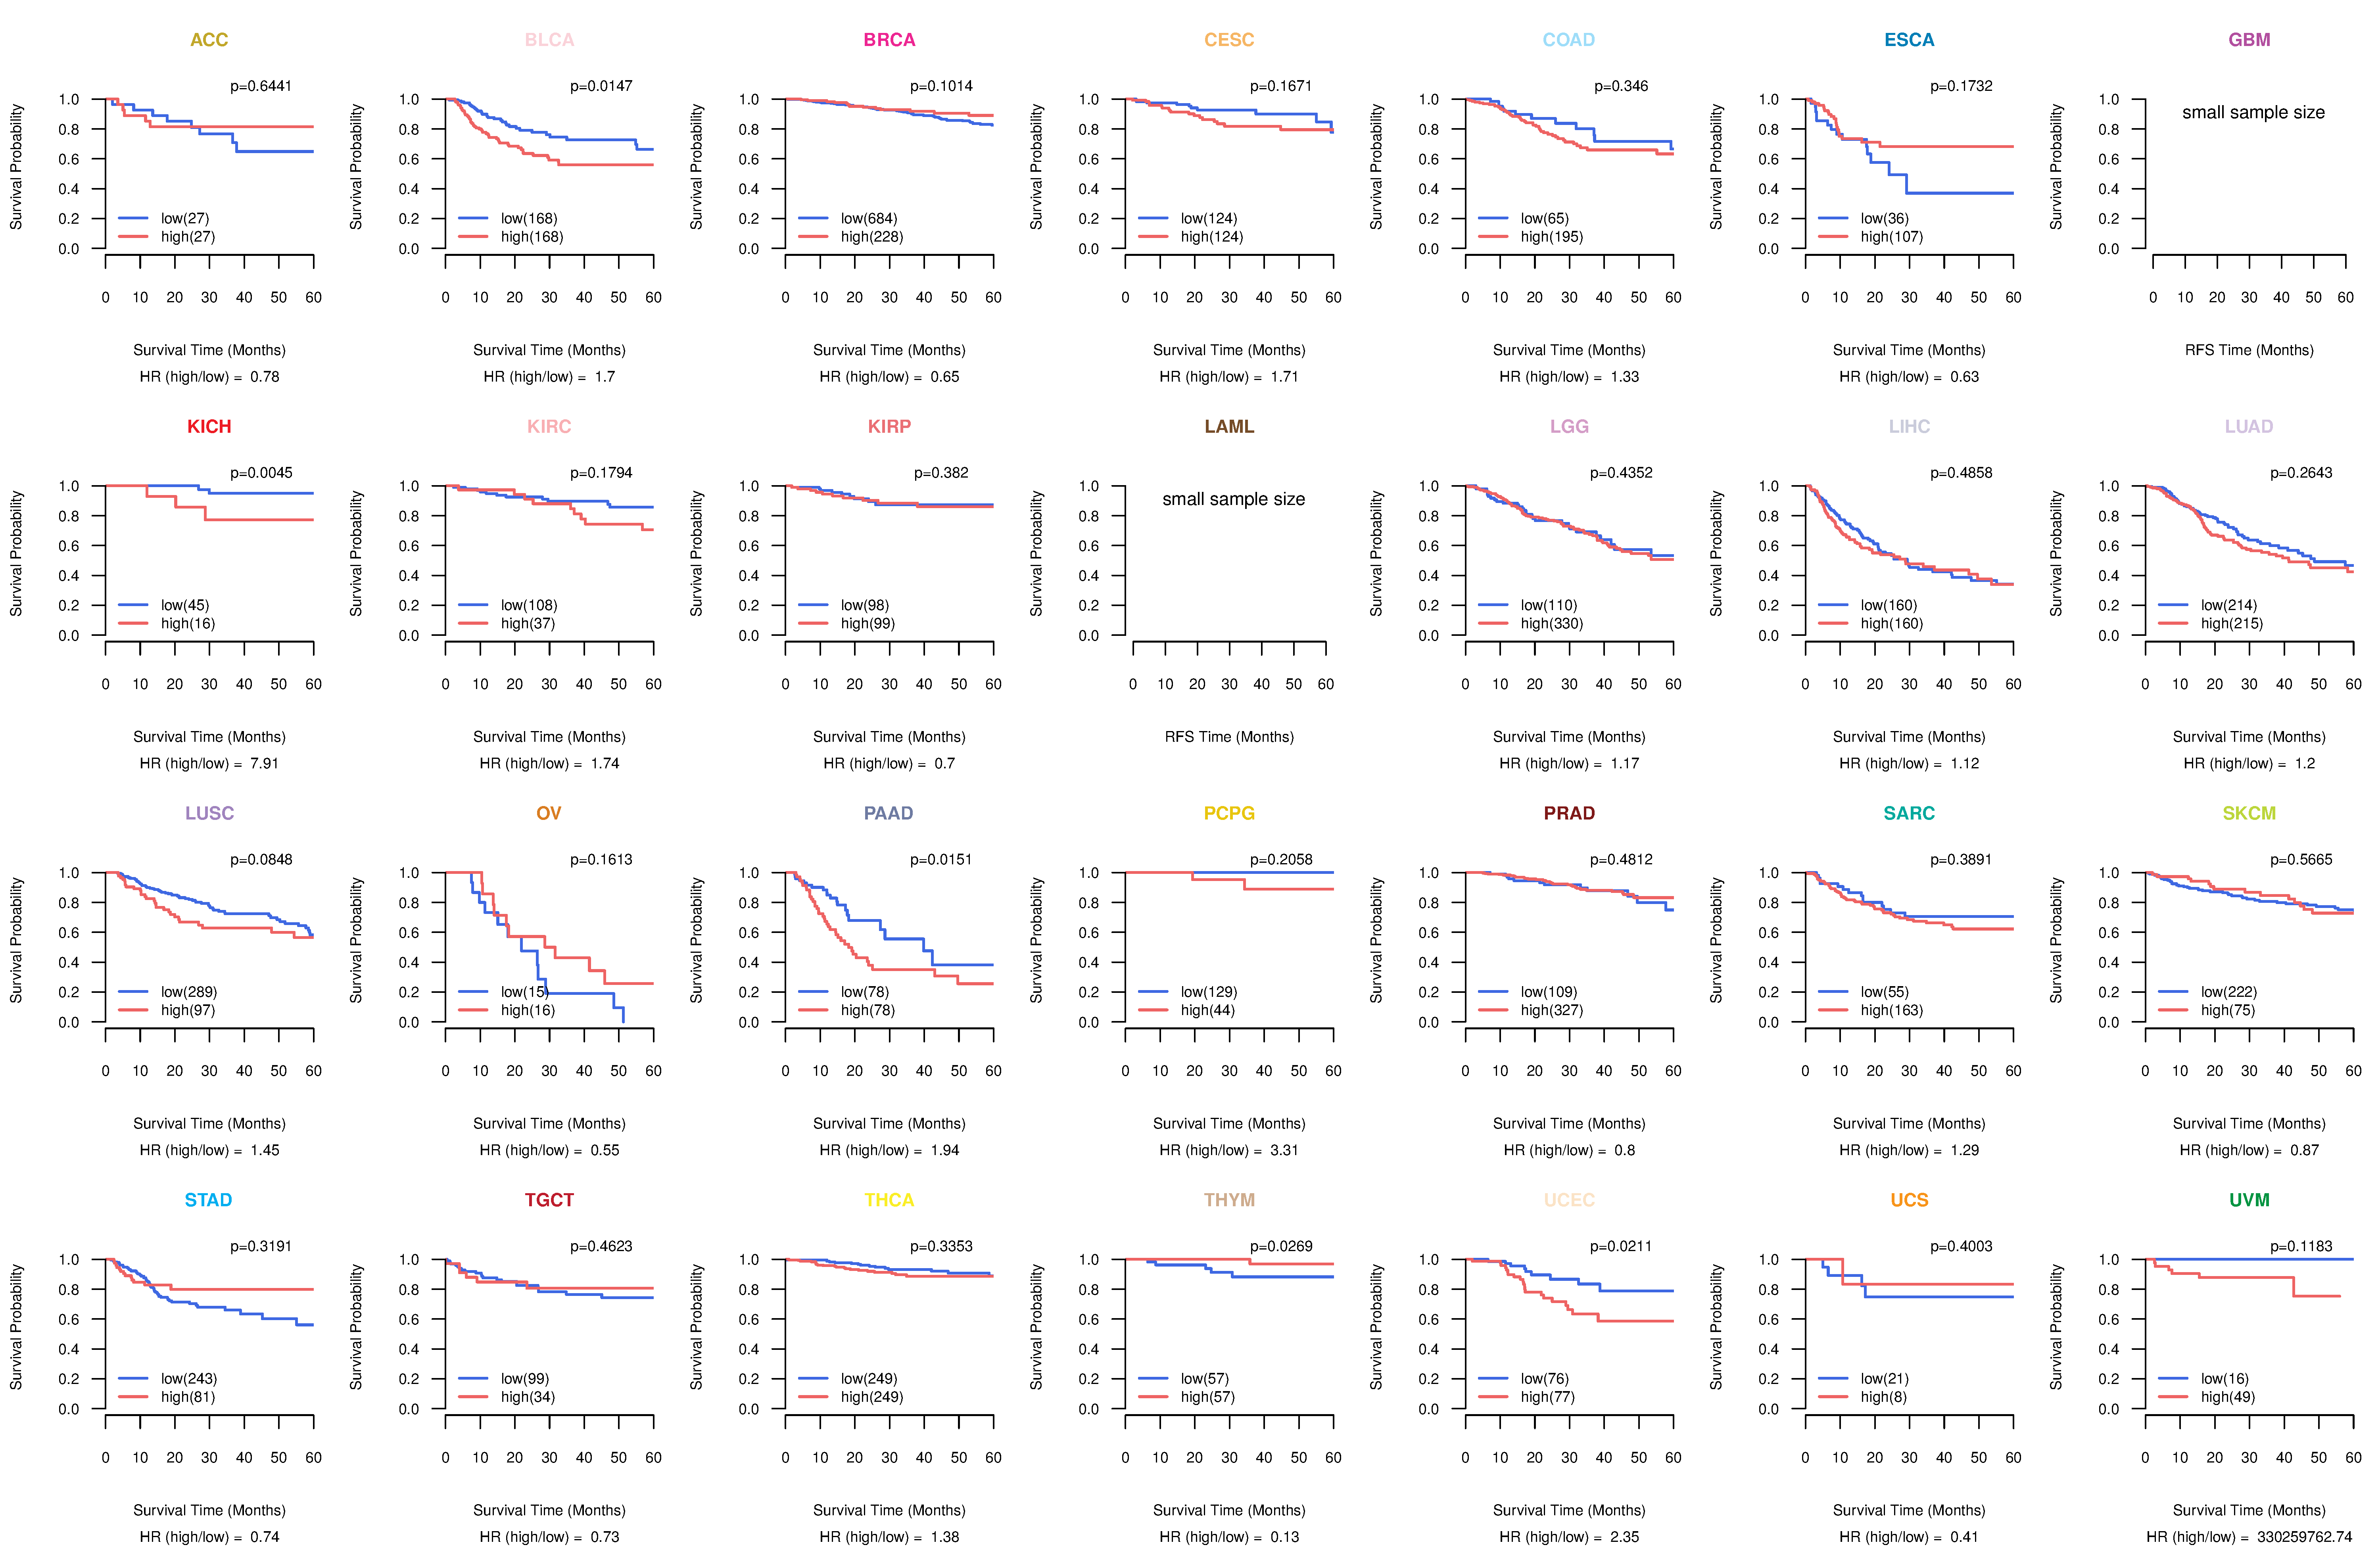
| Kaplan-Meier plots with logrank test of relapse free survival (RFS) using 28 cancer types (TCGA IlluminaHiSeq_RNASeqV2, pan-cancer normalized log2(norm_counts+1) data, version 2016-08-16) (TCGA clinicalMatrix, phenotype data, version 2016-04-27) * Click on the image enlarge it in a new window. |
 |
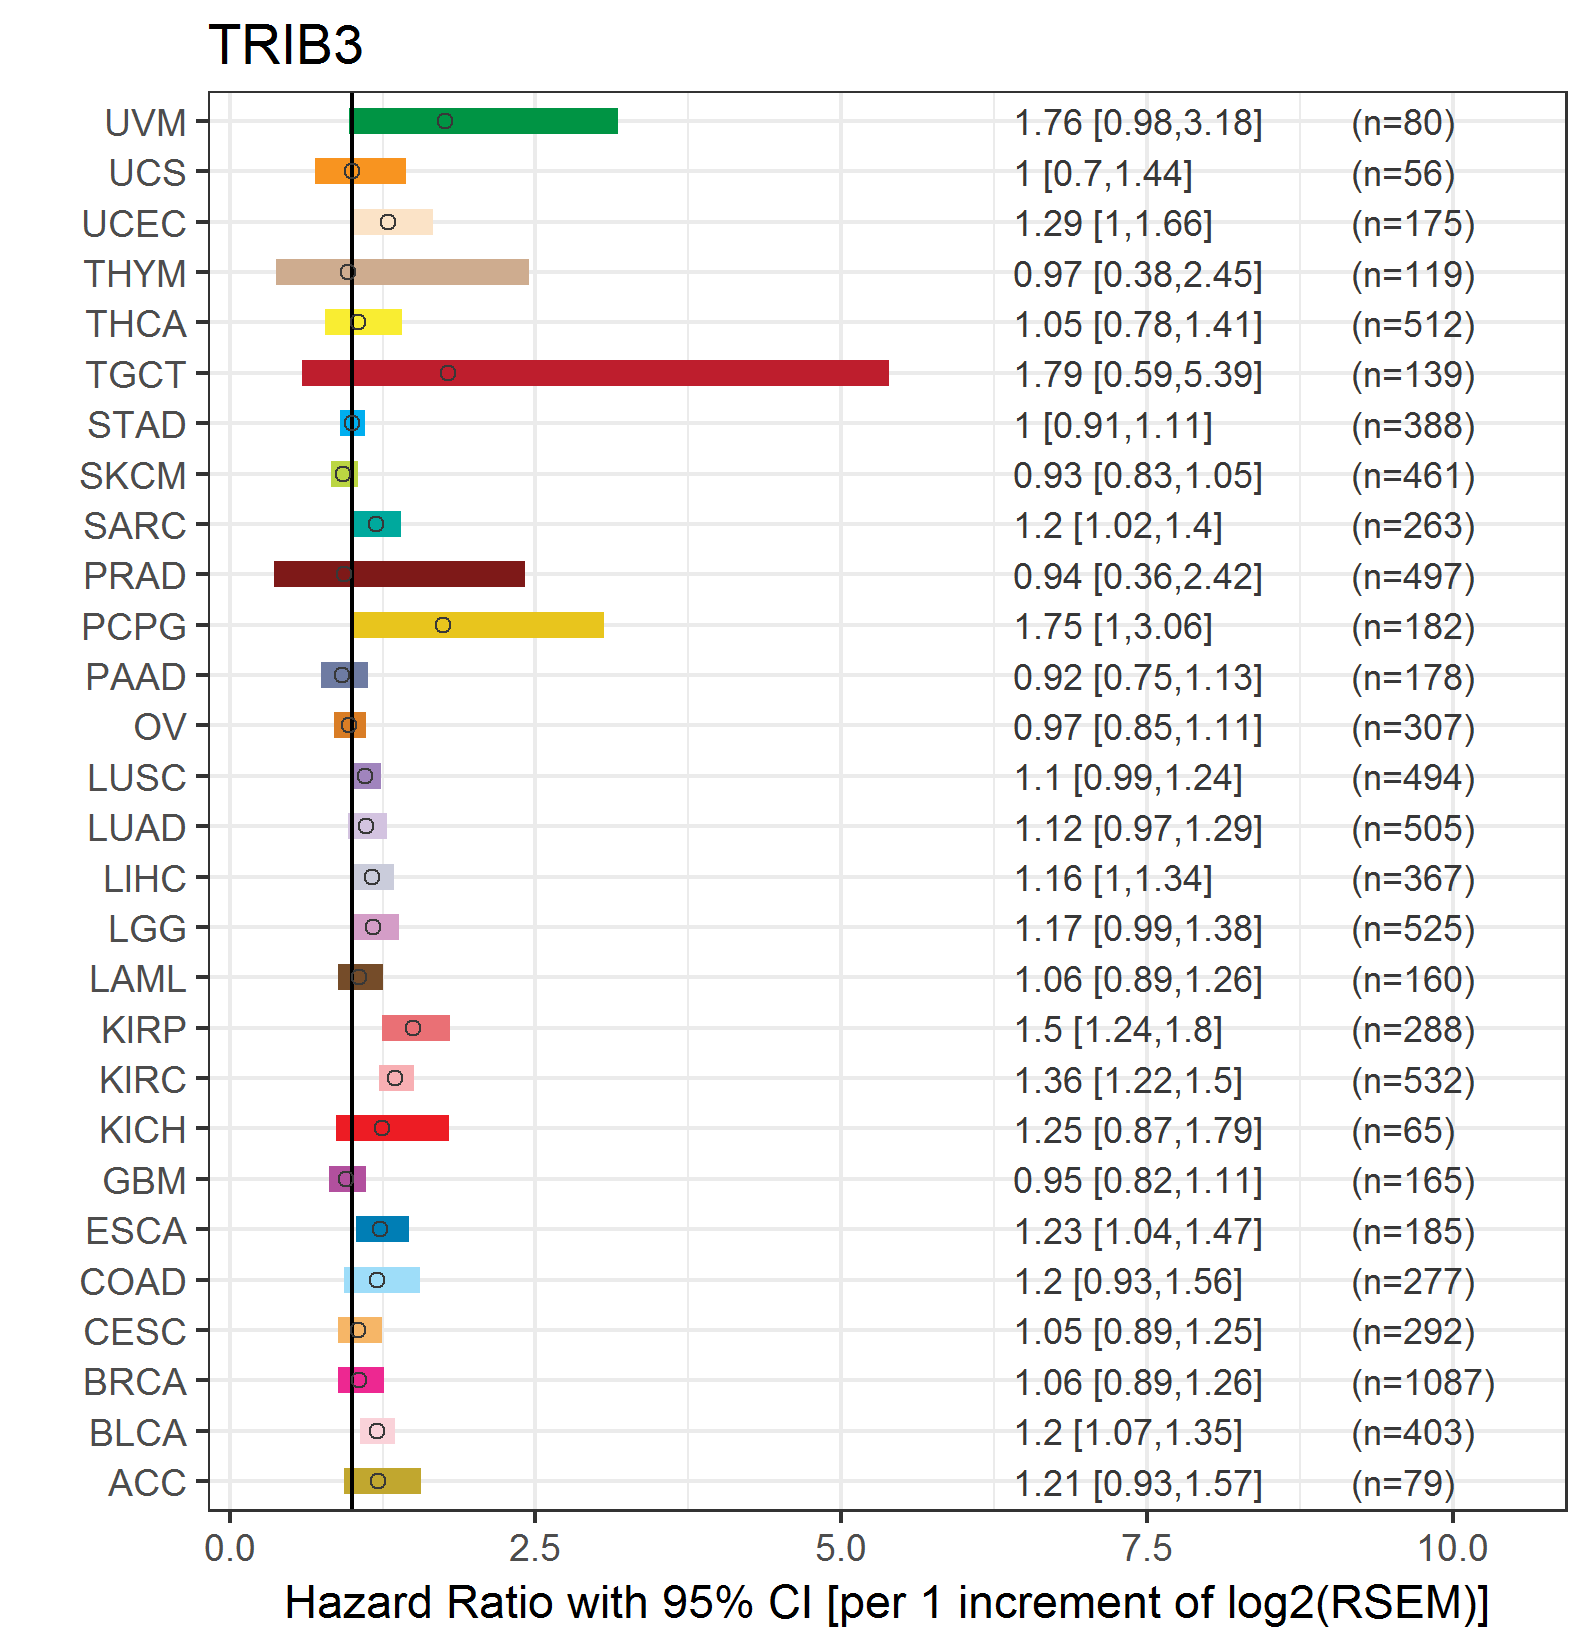
| Forest plot of Cox proportional hazard ratio (HR) and 95% CI of overall survival (OS) using 28 cancer types (TCGA IlluminaHiSeq_RNASeqV2, pan-cancer normalized log2(norm_counts+1) data, version 2016-08-16) (TCGA clinicalMatrix, phenotype data, version 2016-04-27) * Click on the image enlarge it in a new window. |
 |
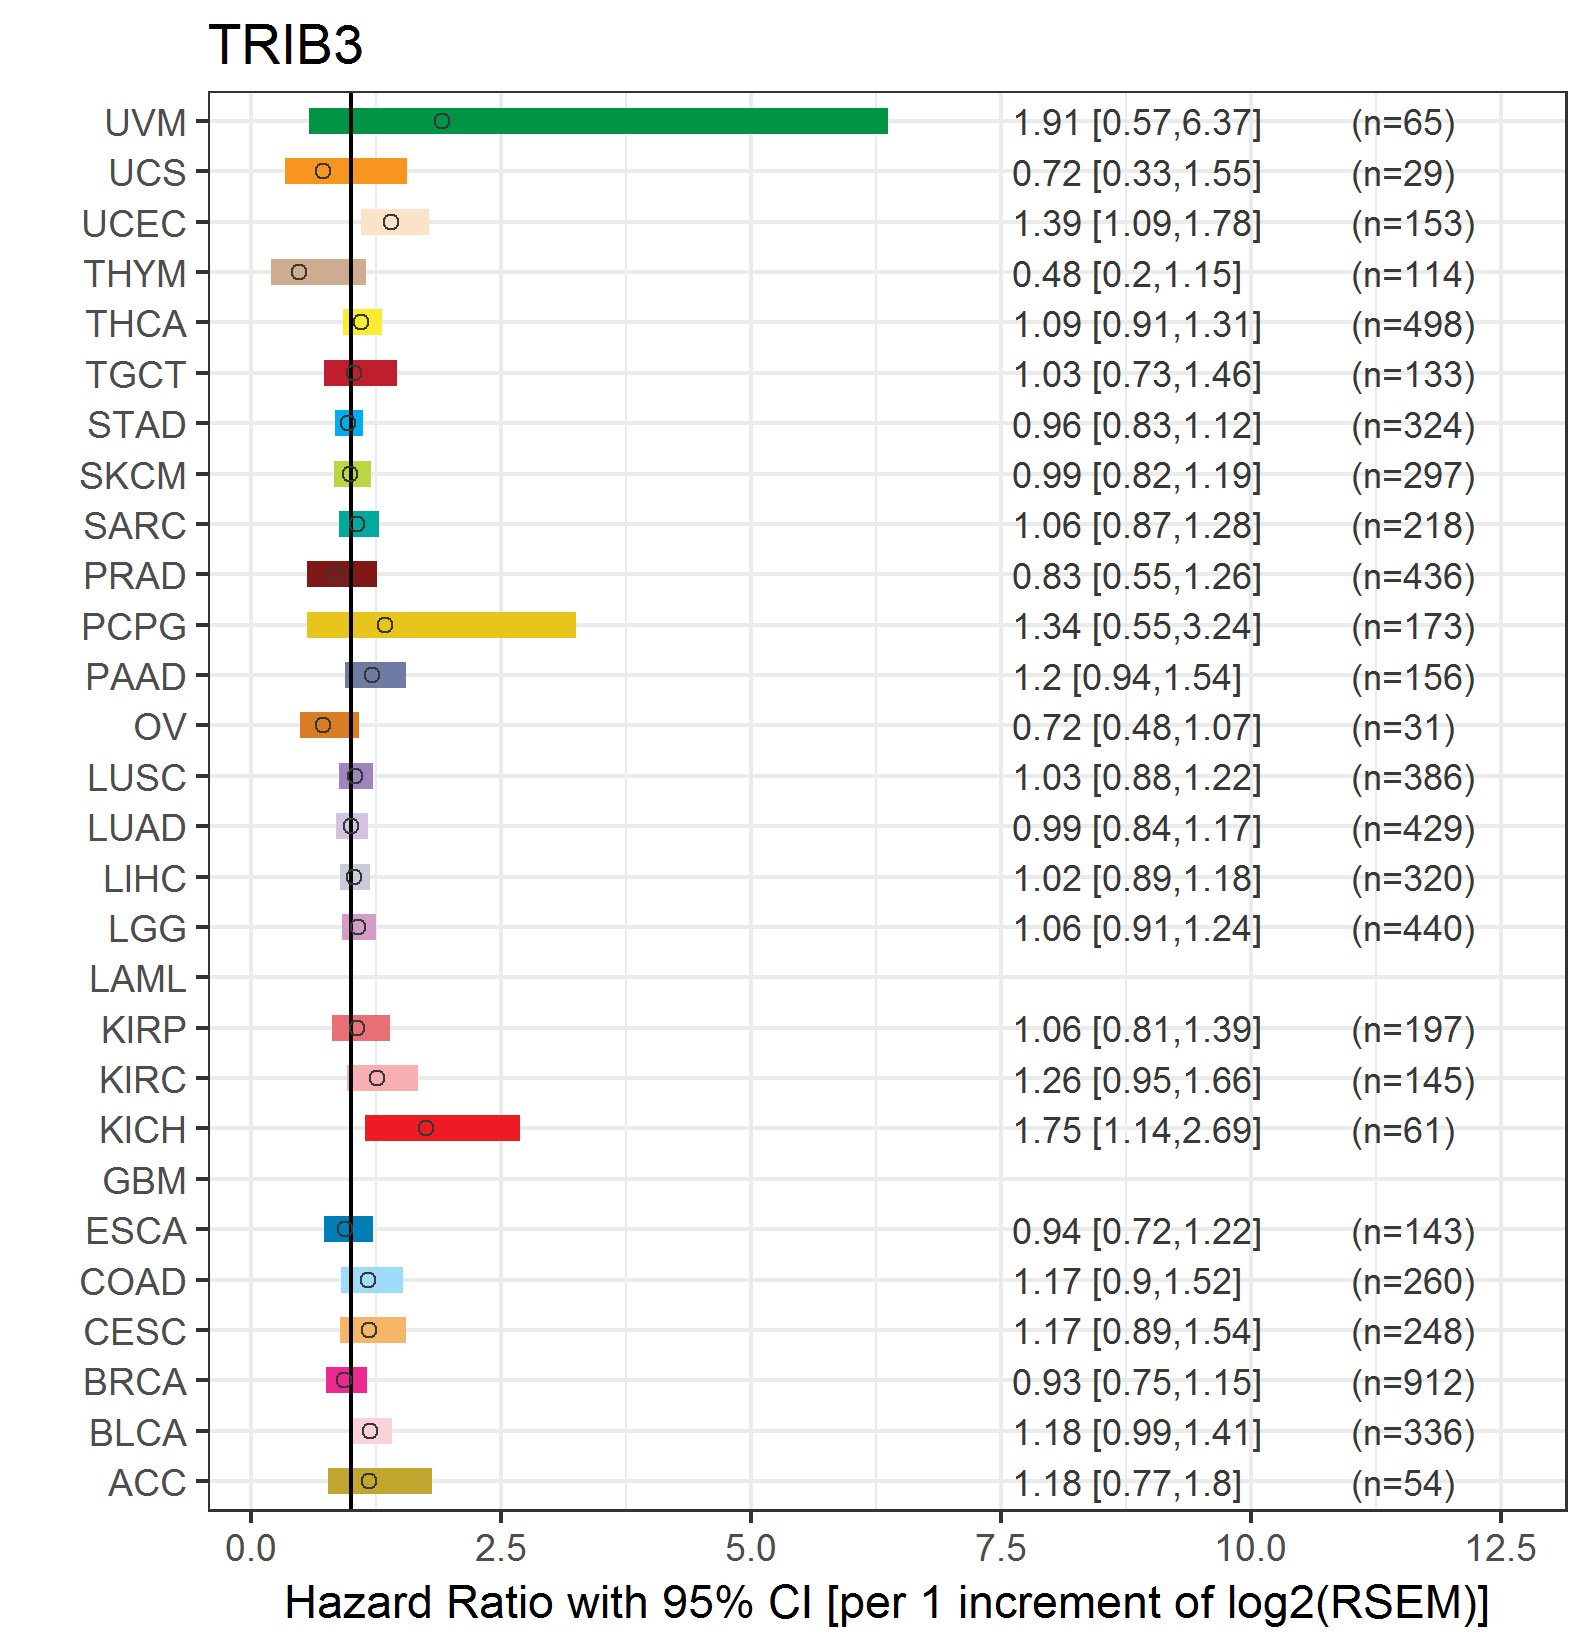
| Forest plot of Cox proportional hazard ratio (HR) and 95% CI of relapse free survival (RFS) using 28 cancer types (TCGA IlluminaHiSeq_RNASeqV2, pan-cancer normalized log2(norm_counts+1) data, version 2016-08-16) (TCGA clinicalMatrix, phenotype data, version 2016-04-27) * Click on the image enlarge it in a new window. |
 |
| Top |
| TissGeneClin for TRIB3 |
| TissGeneDrug for TRIB3 |
| Drug information targeting TissGene (DrugBank Version 5.0.6, 2017-04-01) |
| DrugBank ID | Drug name | Drug activity | Drug type | Drug status |
| Top |
| TissGeneDisease for TRIB3 |
| Disease information associated with TissGene (DisGeNet, 2016-06-01) |
| Disease ID | Disease name | # pubmeds | Source |
| umls:C0011860 | Diabetes Mellitus, Non-Insulin-Dependent | 8 | BeFree,GAD |
| umls:C0006142 | Malignant neoplasm of breast | 5 | BeFree |
| umls:C0678222 | Breast Carcinoma | 5 | BeFree |
| umls:C0007222 | Cardiovascular Diseases | 3 | BeFree |
| umls:C0020456 | Hyperglycemia | 3 | BeFree |
| umls:C1458155 | Mammary Neoplasms | 3 | BeFree |
| umls:C0003850 | Arteriosclerosis | 2 | BeFree |
| umls:C0004153 | Atherosclerosis | 2 | BeFree |
| umls:C0009402 | Colorectal Carcinoma | 2 | BeFree |
| umls:C0011847 | Diabetes | 2 | BeFree |
| umls:C0011849 | Diabetes Mellitus | 2 | BeFree |
| umls:C0021655 | Insulin Resistance | 2 | CTD_human,GAD |
| umls:C0027627 | Neoplasm Metastasis | 2 | BeFree |
| umls:C0271650 | Impaired glucose tolerance | 2 | BeFree |
| umls:C0524620 | Metabolic Syndrome X | 2 | BeFree,CTD_human,GAD |
| umls:C1527249 | Colorectal Cancer | 2 | BeFree |
| umls:C0002395 | Alzheimer's Disease | 1 | GAD |
| umls:C0003130 | Anoxia | 1 | LHGDN |
| umls:C0010054 | Coronary Arteriosclerosis | 1 | BeFree |
| umls:C0010068 | Coronary heart disease | 1 | BeFree |
| umls:C0023418 | leukemia | 1 | BeFree |
| umls:C0023467 | Leukemia, Myelocytic, Acute | 1 | BeFree |
| umls:C0027051 | Myocardial Infarction | 1 | BeFree |
| umls:C0028754 | Obesity | 1 | BeFree |
| umls:C0029408 | Degenerative polyarthritis | 1 | BeFree |
| umls:C0030297 | Pancreatic Neoplasm | 1 | BeFree |
| umls:C0151744 | Myocardial Ischemia | 1 | GAD |
| umls:C0243050 | Cardiovascular Abnormalities | 1 | BeFree |
| umls:C0311277 | Obesity, Abdominal | 1 | BeFree |
| umls:C0349566 | Squamous cell carcinoma of tongue | 1 | BeFree |
| umls:C0376358 | Malignant neoplasm of prostate | 1 | BeFree |
| umls:C0521158 | Recurrent tumor | 1 | BeFree |
| umls:C0577631 | Carotid Atherosclerosis | 1 | BeFree |
| umls:C0596263 | Carcinogenesis | 1 | BeFree |
| umls:C0598608 | Hyperhomocysteinemia | 1 | BeFree |
| umls:C0600139 | Prostate carcinoma | 1 | BeFree |
| umls:C0850666 | Helicobacter pylori infection | 1 | BeFree |
| umls:C1318485 | Liver regeneration disorder | 1 | BeFree |
| umls:C1956346 | Coronary Artery Disease | 1 | BeFree |
| umls:C3495426 | Homocysteinemia | 1 | BeFree |
|
Copyright 2016-Present - The University of Texas Health Science Center at Houston (UTHealth) Web File Viewing | How to Report, Fraud, Waste and Abuse | State of Texas | Statewide Search | Texas Homeland Security | Site Policies |