 |
| |
| |
| |
| |
| |
| |
|

| TissGeneSummary for PRODH2 |
 Gene summary Gene summary |
| Basic gene information | Gene symbol | PRODH2 |
| Gene name | proline dehydrogenase (oxidase) 2 | |
| Synonyms | HSPOX1 | |
| Cytomap | UCSC genome browser: 19q13.1 | |
| Type of gene | protein-coding | |
| RefGenes | NM_021232.1, | |
| Description | kidney and liver proline oxidase 1probable proline dehydrogenase 2probable proline oxidase 2 | |
| Modification date | 20141207 | |
| dbXrefs | HGNC : HGNC | |
| Ensembl : ENSG00000250799 | ||
| HPRD : 17911 | ||
| Vega : OTTHUMG00000180688 | ||
| Protein | UniProt: go to UniProt's Cross Reference DB Table | |
| Expression | CleanEX: HS_PRODH2 | |
| BioGPS: 58510 | ||
| Pathway | NCI Pathway Interaction Database: PRODH2 | |
| KEGG: PRODH2 | ||
| REACTOME: PRODH2 | ||
| Pathway Commons: PRODH2 | ||
| Context | iHOP: PRODH2 | |
| ligand binding site mutation search in PubMed: PRODH2 | ||
| UCL Cancer Institute: PRODH2 | ||
| Assigned class in TissGDB* | C | |
| Included tissue-specific gene expression resources | TiGER,GTEx | |
| Specific-tissues in normal samples (assigned by TissGDB using HPA, TiGER, and GTEx) | KidneyLiver | |
| Cancer types related to the specific-tissues in cancer samples (assigned by TissGDB using TCGA) | KIRC,KIRP,KICHLIHC | |
| Reference showing the relevant tissue of PRODH2 | ||
| Description by TissGene annotations | Significant down-regulated DEG TissgsKTS CNV lost TissGeneKTS | |
| * Class A consists of genes with literature evidence and is part of the cTissGenes. Class B consists of only cTissGenes without additional evidence. The remaining genes belong to Class C. |
| Gene ontology having evidence of Inferred from Direct Assay (IDA) from Entrez |
| GO ID | GO term | PubMed ID |
| Top |
| TissGeneExp for PRODH2 |
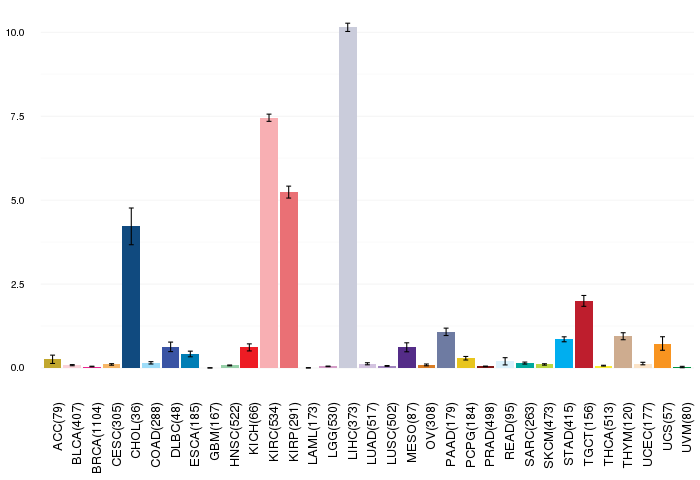
| Gene expressions across 28 cancer types (X-axis: cancer type and Y-axis: log2(norm_counts+1)) (TCGA IlluminaHiSeq_RNASeqV2, pan-cancer normalized log2(norm_counts+1) data, version 2016-08-16) |
 |
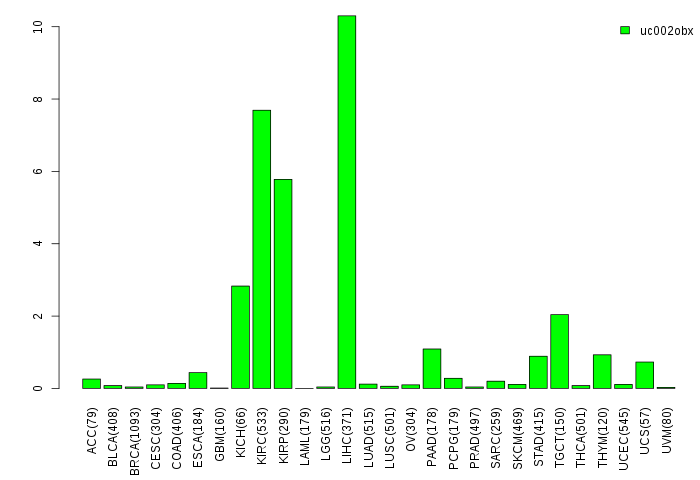
| Gene isoform expressions across 28 cancer types (X-axis: cancer type and Y-axis: log2(norm_counts+1)) (TCGA pan-cancer tcga_rsem_isoform_tpm, version 2016-09-01) |
 |
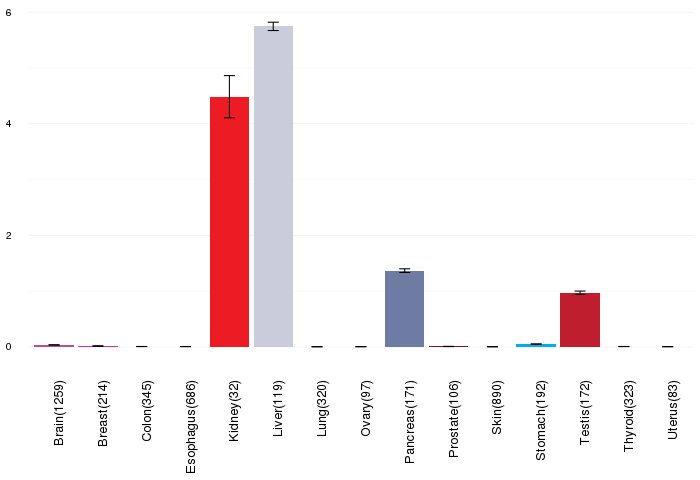
| Gene expressions across normal tissues of GTEx data (GTEx GTEx_Analysis_v6_RNA-seq_RNA-SeQCv1.1.8_gene_rpkm.gct) - Here, we shows the matched tissue types only among our 28 cancer types. |
 |
| Different expressions across 14 cancer types with more than 10 samples between matched tumors and normals (X-axis: cancer type and Y-axis: log2(norm_counts+1)) (TCGA IlluminaHiSeq_RNASeqV2, pan-cancer normalized log2(norm_counts+1) data, version 2016-08-16) |
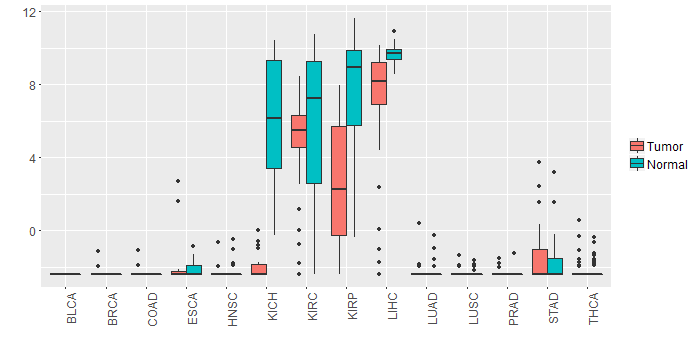 |
| - Significantly differentially expressed cancer types and information. (|Fold change|>1 and FDR<0.05) |
| Cancer type | Mean(exp) in tumor | Mean(exp) in matched normal | Log2FC | P-val. | FDR |
| KIRP | 2.685448421 | 7.603529671 | -4.91808125 | 1.09E-07 | 6.52E-07 |
| LIHC | 7.182101171 | 9.647361171 | -2.46526 | 5.04E-07 | 2.89E-06 |
| KICH | -1.948216829 | 5.956507171 | -7.904724 | 1.49E-11 | 1.38E-10 |
| Top |
| TissGene-miRNA for PRODH2 |
| Significantly anti-correlated miRNAs of TissGene across 28 cancer types (Gene-miRNA relations from TargetScanHuman Relsease 7.1, Conserved_Site_Context_Scores.txt.zip, 06.01.2016) (TCGA IlluminaHiSeq_miRNASeq, log2(RPM+1) data, version 2016-11-21) (TCGA IlluminaHiSeq_RNASeqV2, log2(normalized_count+1) data, version 2016-08-16) (Spearman’s Rank Correlation (p-value<0.05 and coefficient<-0.25)) |
| Cancer type | miRNA id | miRNA accession | P-val. | Coeff. | # samples |
| Top |
| TissGeneMut for PRODH2 |
| TissGeneSNV for PRODH2 |
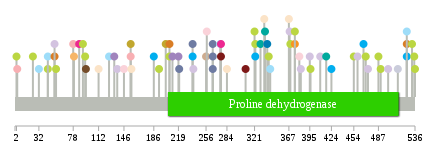
| nsSNV counts per each loci. Different colors of circles represent different cancer types. Circle size denotes number of samples. (TCGA somatic mutation (SNPs and small INDELs) data, version 2016-04-25) * Click on the image to enlarge it in a new window. |
 |
 |
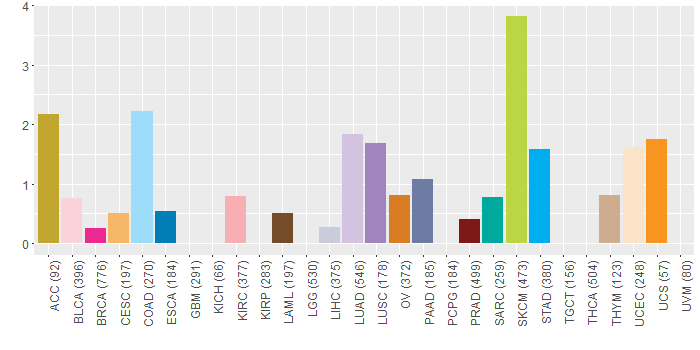
| Somatic nucleotide variants of TissGene across 28 cancer types (X-axis: cancer type and Y-axis: % of mutated samples) The numbers in parentheses are numbers of samples with mutation (nsSNVs). (TCGA somatic mutation (SNPs and small INDELs) data, version 2016-04-25) |
 |
| - nsSNVs sorted by frequency. |
| AAchange | Cancer type | # samples |
| p.V169G | HNSC | 2 |
| p.C44R | SKCM | 1 |
| p.R525W | OV | 1 |
| p.Q275K | COAD | 1 |
| p.P322L | SKCM | 1 |
| p.G395R | LUAD | 1 |
| p.G53A | OV | 1 |
| p.R500L | LUAD | 1 |
| p.S14F | DLBC | 1 |
| p.G220V | PAAD | 1 |
| p.P338L | ESCA | 1 |
| p.E265X | PAAD | 1 |
| p.H368Y | LUAD | 1 |
| p.P126S | COAD | 1 |
| p.G257A | BLCA | 1 |
| p.N276S | BRCA | 1 |
| p.W95* | LAML | 1 |
| p.P487A | SKCM | 1 |
| p.G53C | LUAD | 1 |
| p.Y383* | LUAD | 1 |
| p.Q409H | LUAD | 1 |
| p.E112K | UCEC | 1 |
| p.P91S | SKCM | 1 |
| p.L133M | LUSC | 1 |
| p.N32H | COAD | 1 |
| p.R369K | SKCM | 1 |
| p.P256T | THYM | 1 |
| p.M396I | SKCM | 1 |
| p.G375V | UCS | 1 |
| p.P193S | SKCM | 1 |
| p.N207K | OV | 1 |
| p.S2L | SKCM | 1 |
| p.T238M | PAAD | 1 |
| p.S86C | BRCA | 1 |
| p.R219W | LUSC | 1 |
| p.R79Q | CESC | 1 |
| p.G342R | COAD | 1 |
| p.R525Q | COAD | 1 |
| p.G375R | SKCM | 1 |
| p.L417M | SARC | 1 |
| p.P3H | KIRC | 1 |
| p.P322H | STAD | 1 |
| p.E340D | SKCM | 1 |
| p.V459A | LUAD | 1 |
| p.A329T | SARC | 1 |
| p.S155Y | KIRC | 1 |
| p.P454L | SKCM | 1 |
| p.A284D | UCEC | 1 |
| p.H536Y | SKCM | 1 |
| p.W335* | SARC | 1 |
| p.E265* | PAAD | 1 |
| p.R525W | STAD | 1 |
| p.R146W | BLCA | 1 |
| p.T24I | SKCM | 1 |
| p.C44Y | COAD | 1 |
| p.R532Q | SKCM | 1 |
| p.M211I | LUSC | 1 |
| p.S155F | ACC | 1 |
| p.N276S | PRAD | 1 |
| p.A137S | LUAD | 1 |
| p.A186T | STAD | 1 |
| p.L473P | LUAD | 1 |
| p.R334L | UCEC | 1 |
| p.A239V | LUAD | 1 |
| p.S490F | SKCM | 1 |
| p.V156I | UCEC | 1 |
| p.G381S | BLCA | 1 |
| p.N321S | SKCM | 1 |
| p.H470Y | SKCM | 1 |
| p.R424H | STAD | 1 |
| p.V309M | PRAD | 1 |
| p.T238M | STAD | 1 |
| p.G94D | SKCM | 1 |
| p.P535S | SKCM | 1 |
| p.G55E | SKCM | 1 |
| p.M467V | STAD | 1 |
| p.A202E | ACC | 1 |
| p.N207S | SKCM | 1 |
| p.A367V | UCEC | 1 |
| p.E265V | PAAD | 1 |
| p.R513H | LIHC | 1 |
| p.L78P | KIRC | 1 |
| Top |
| TissGeneCNV for PRODH2 |
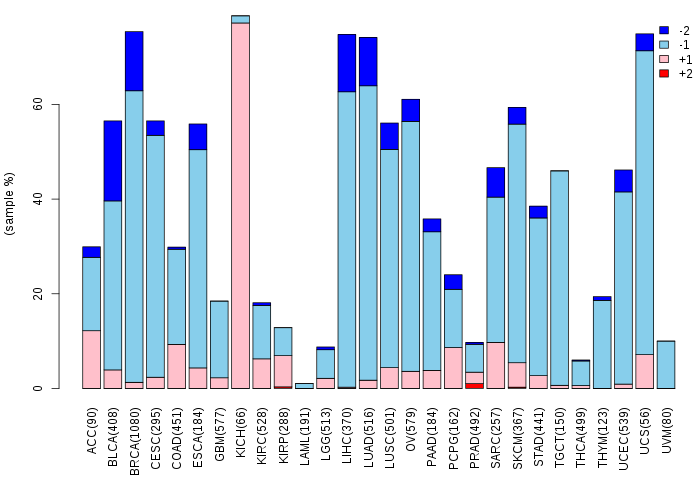
| Copy number variations of TissGene across 28 cancer types (X-axis: cancer type and Y-axis: % of CNV samples) (TCGA Gistic2_CopyNumber_Gistic2_all_data_by_genes, Gistic2 copy number data, version 2016-08-16) |
 |
| Top |
| TissGeneFusions for PRODH2 |
| Fusion genes including TissGene (ChimerDB 3.0, 2016-12-01 and TCGA fusion Portal 2015-12-01) |
| Database | Src | Cancer type | Sample | Fusion gene | ORF | 5'-gene BP | 3'-gene BP |
| Top |
| TissGeneNet for PRODH2 |
| Co-expressed gene networks based on protein-protein interaction data (CePIN) (TCGA IlluminaHiSeq_RNASeqV2, pan-cancer normalized log2(norm_counts+1) data, version 2016-08-16) (PINA2 ppi data) |
| Top |
| TissGeneProg for PRODH2 |
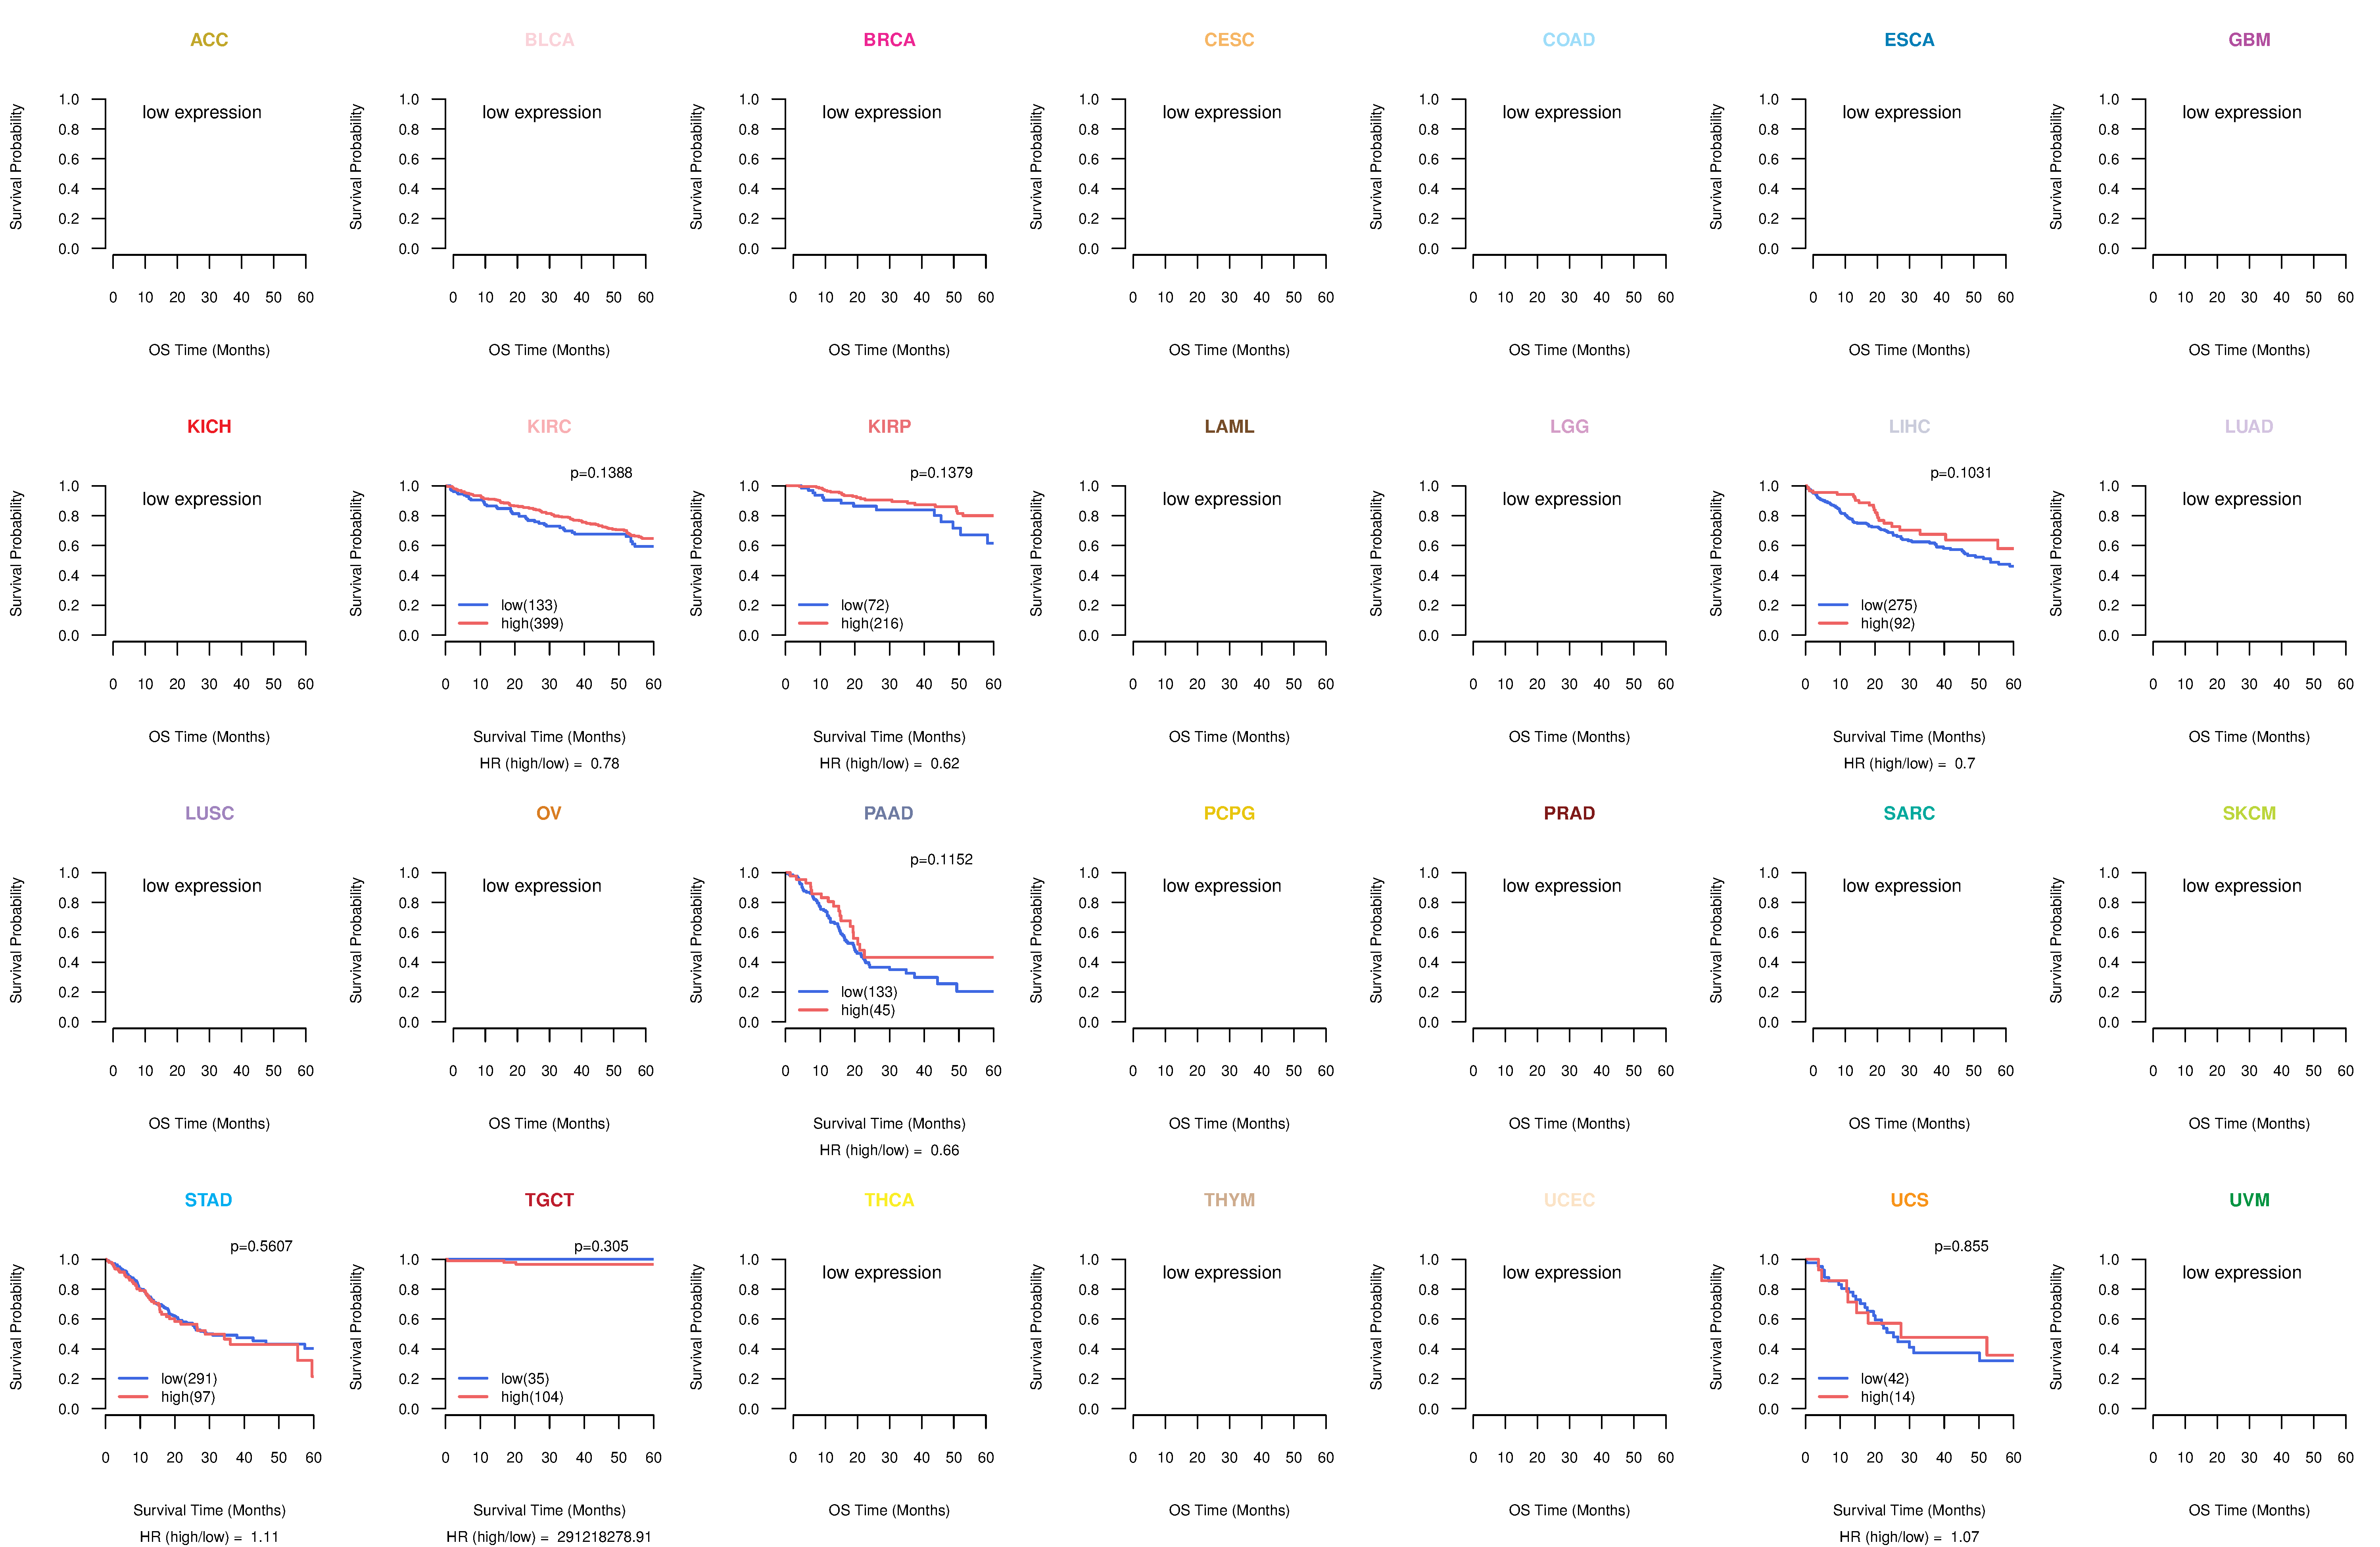
| Kaplan-Meier plots with logrank tests of overall survival (OS) using 28 cancer types (TCGA IlluminaHiSeq_RNASeqV2, pan-cancer normalized log2(norm_counts+1) data, version 2016-08-16) (TCGA clinicalMatrix, phenotype data, version 2016-04-27) * Click on the image to enlarge it in a new window. |
 |
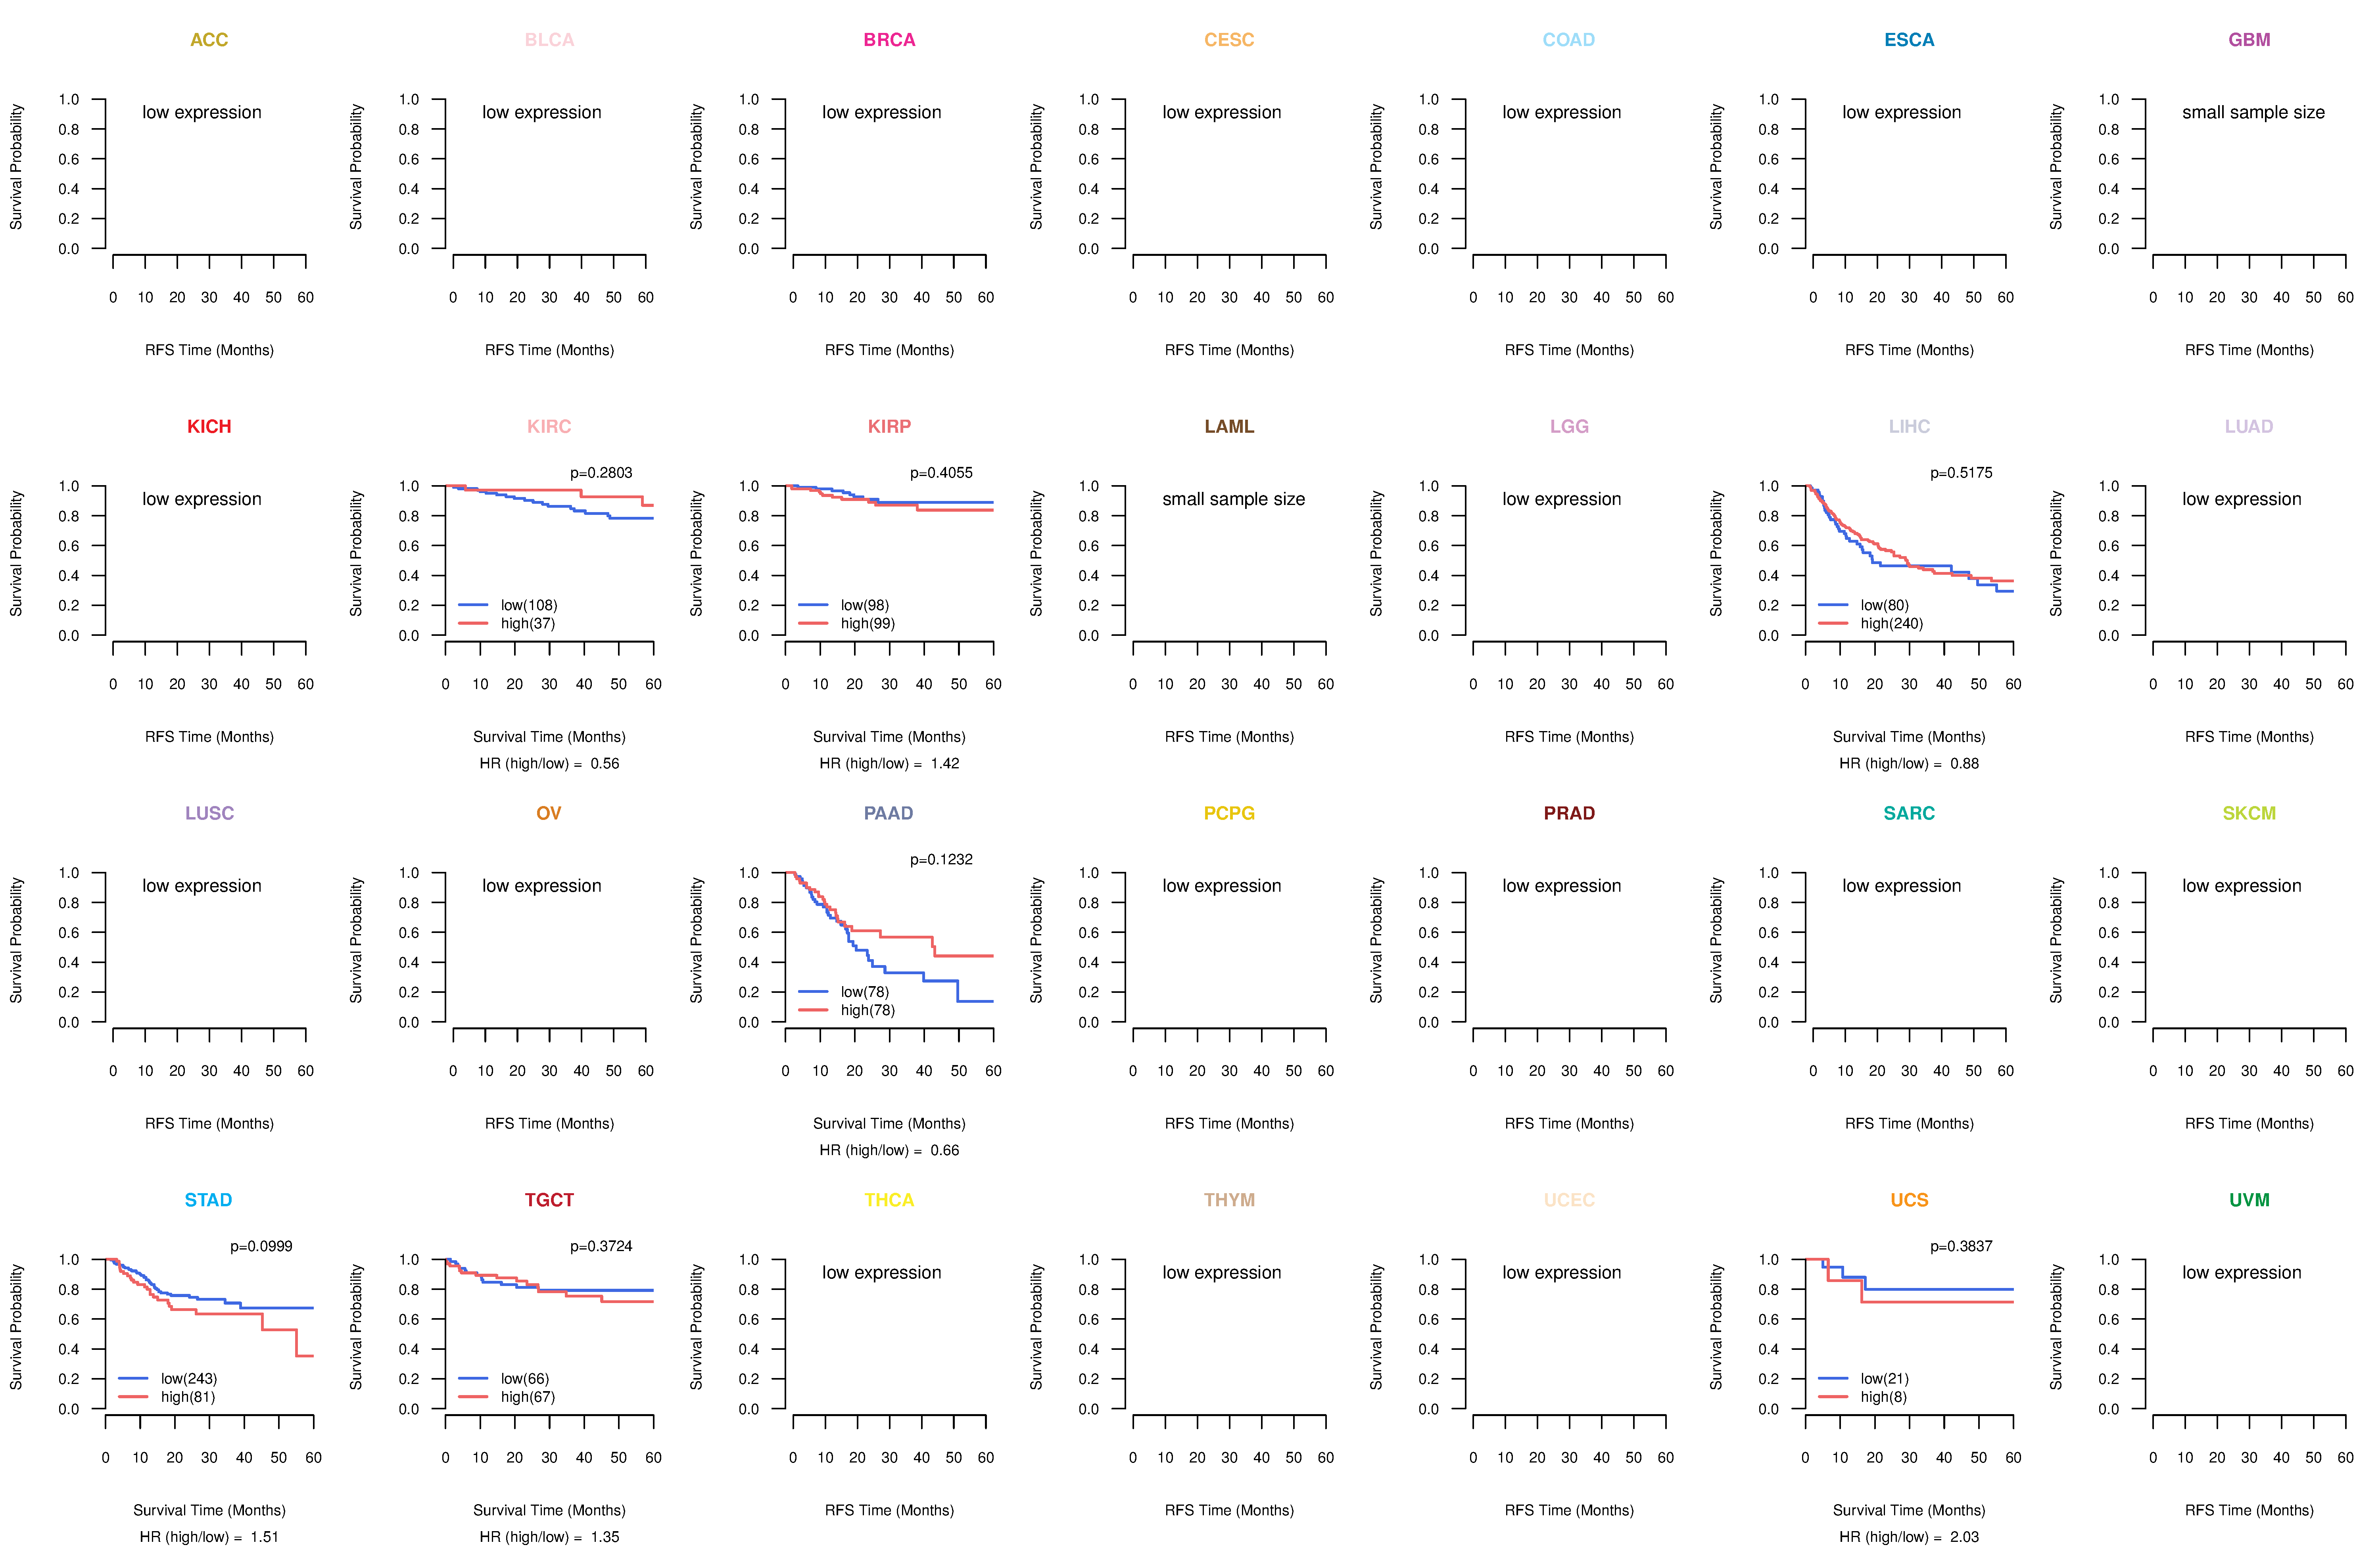
| Kaplan-Meier plots with logrank test of relapse free survival (RFS) using 28 cancer types (TCGA IlluminaHiSeq_RNASeqV2, pan-cancer normalized log2(norm_counts+1) data, version 2016-08-16) (TCGA clinicalMatrix, phenotype data, version 2016-04-27) * Click on the image enlarge it in a new window. |
 |
| Forest plot of Cox proportional hazard ratio (HR) and 95% CI of overall survival (OS) using 28 cancer types (TCGA IlluminaHiSeq_RNASeqV2, pan-cancer normalized log2(norm_counts+1) data, version 2016-08-16) (TCGA clinicalMatrix, phenotype data, version 2016-04-27) * Click on the image enlarge it in a new window. |
 |
| Forest plot of Cox proportional hazard ratio (HR) and 95% CI of relapse free survival (RFS) using 28 cancer types (TCGA IlluminaHiSeq_RNASeqV2, pan-cancer normalized log2(norm_counts+1) data, version 2016-08-16) (TCGA clinicalMatrix, phenotype data, version 2016-04-27) * Click on the image enlarge it in a new window. |
 |
| Top |
| TissGeneClin for PRODH2 |
| TissGeneDrug for PRODH2 |
| Drug information targeting TissGene (DrugBank Version 5.0.6, 2017-04-01) |
| DrugBank ID | Drug name | Drug activity | Drug type | Drug status |
| Top |
| TissGeneDisease for PRODH2 |
| Disease information associated with TissGene (DisGeNet, 2016-06-01) |
| Disease ID | Disease name | # pubmeds | Source |
| umls:C0020501 | Primary Hyperoxaluria | 1 | BeFree |
| umls:C0036341 | Schizophrenia | 1 | BeFree |
|
Copyright 2016-Present - The University of Texas Health Science Center at Houston (UTHealth) Web File Viewing | How to Report, Fraud, Waste and Abuse | State of Texas | Statewide Search | Texas Homeland Security | Site Policies |