 |
| |
| |
| |
| |
| |
| |
|

| TissGeneSummary for BCAT1 |
 Gene summary Gene summary |
| Basic gene information | Gene symbol | BCAT1 |
| Gene name | branched chain amino-acid transaminase 1, cytosolic | |
| Synonyms | BCATC|BCT1|ECA39|MECA39|PNAS121|PP18 | |
| Cytomap | UCSC genome browser: 12p12.1 | |
| Type of gene | protein-coding | |
| RefGenes | NM_001178091.1, NM_001178092.1,NM_001178093.1,NM_001178094.1,NM_005504.6, | |
| Description | branched chain aminotransferase 1, cytosolicbranched-chain-amino-acid aminotransferase, cytosolicplacental protein 18 | |
| Modification date | 20141207 | |
| dbXrefs | MIM : 113520 | |
| HGNC : HGNC | ||
| Ensembl : ENSG00000060982 | ||
| HPRD : 00216 | ||
| Vega : OTTHUMG00000169053 | ||
| Protein | UniProt: go to UniProt's Cross Reference DB Table | |
| Expression | CleanEX: HS_BCAT1 | |
| BioGPS: 586 | ||
| Pathway | NCI Pathway Interaction Database: BCAT1 | |
| KEGG: BCAT1 | ||
| REACTOME: BCAT1 | ||
| Pathway Commons: BCAT1 | ||
| Context | iHOP: BCAT1 | |
| ligand binding site mutation search in PubMed: BCAT1 | ||
| UCL Cancer Institute: BCAT1 | ||
| Assigned class in TissGDB* | C | |
| Included tissue-specific gene expression resources | TiGER,GTEx | |
| Specific-tissues in normal samples (assigned by TissGDB using HPA, TiGER, and GTEx) | PancreasTestis | |
| Cancer types related to the specific-tissues in cancer samples (assigned by TissGDB using TCGA) | PAADTGCT | |
| Reference showing the relevant tissue of BCAT1 | ||
| Description by TissGene annotations | TissgsLTS | |
| * Class A consists of genes with literature evidence and is part of the cTissGenes. Class B consists of only cTissGenes without additional evidence. The remaining genes belong to Class C. |
| Gene ontology having evidence of Inferred from Direct Assay (IDA) from Entrez |
| GO ID | GO term | PubMed ID |
| Top |
| TissGeneExp for BCAT1 |
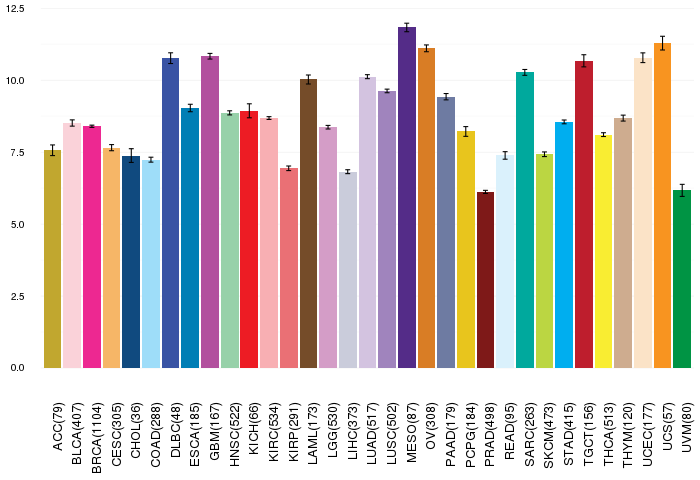
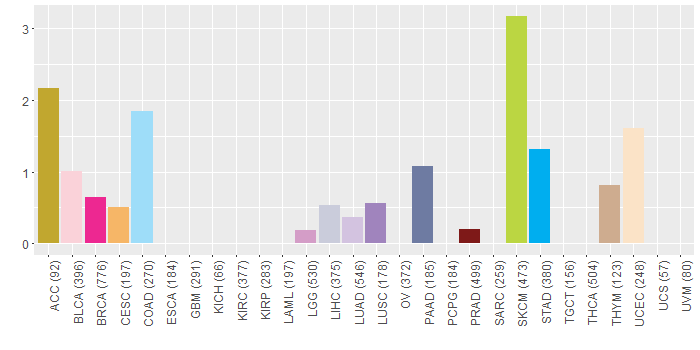
| Gene expressions across 28 cancer types (X-axis: cancer type and Y-axis: log2(norm_counts+1)) (TCGA IlluminaHiSeq_RNASeqV2, pan-cancer normalized log2(norm_counts+1) data, version 2016-08-16) |
 |
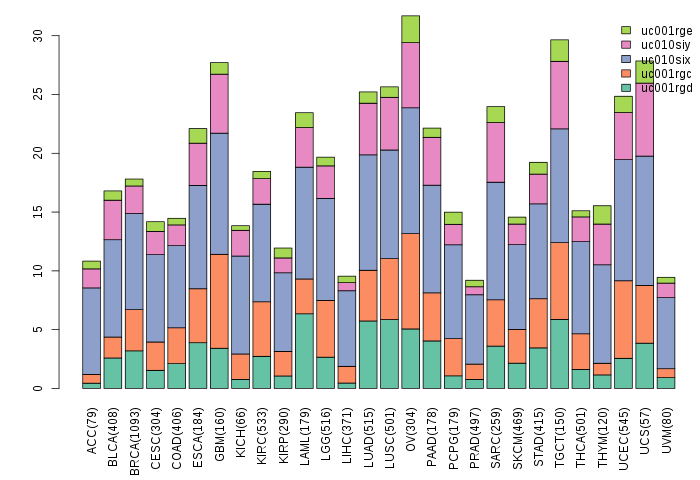
| Gene isoform expressions across 28 cancer types (X-axis: cancer type and Y-axis: log2(norm_counts+1)) (TCGA pan-cancer tcga_rsem_isoform_tpm, version 2016-09-01) |
 |
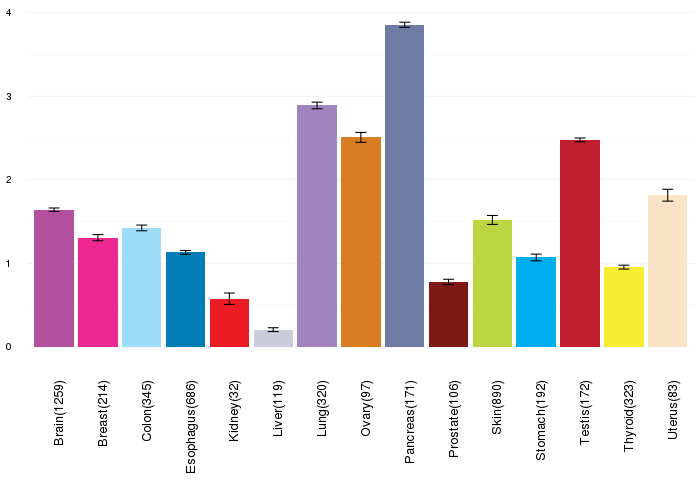
| Gene expressions across normal tissues of GTEx data (GTEx GTEx_Analysis_v6_RNA-seq_RNA-SeQCv1.1.8_gene_rpkm.gct) - Here, we shows the matched tissue types only among our 28 cancer types. |
 |
| Different expressions across 14 cancer types with more than 10 samples between matched tumors and normals (X-axis: cancer type and Y-axis: log2(norm_counts+1)) (TCGA IlluminaHiSeq_RNASeqV2, pan-cancer normalized log2(norm_counts+1) data, version 2016-08-16) |
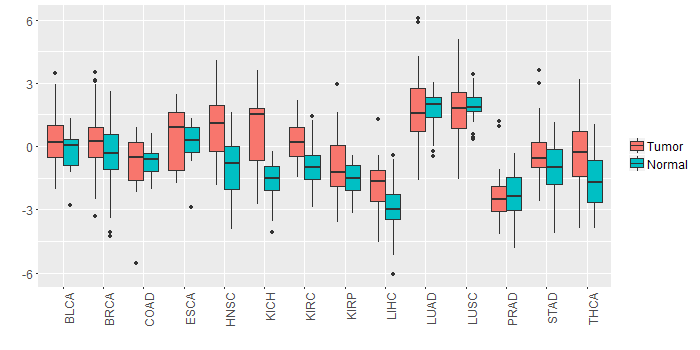 |
| - Significantly differentially expressed cancer types and information. (|Fold change|>1 and FDR<0.05) |
| Cancer type | Mean(exp) in tumor | Mean(exp) in matched normal | Log2FC | P-val. | FDR |
| HNSC | 0.839735366 | -1.002906495 | 1.84264186 | 7.46E-08 | 7.56E-07 |
| LIHC | -1.827102262 | -2.978762262 | 1.15166 | 7.97E-07 | 4.34E-06 |
| THCA | -0.43252033 | -1.623598296 | 1.191077966 | 7.51E-06 | 2.49E-05 |
| KIRC | 0.260348738 | -0.988895707 | 1.249244444 | 4.69E-14 | 2.21E-13 |
| KICH | 0.720919738 | -1.642592262 | 2.363512 | 3.92E-07 | 1.59E-06 |
| Top |
| TissGene-miRNA for BCAT1 |
| Significantly anti-correlated miRNAs of TissGene across 28 cancer types (Gene-miRNA relations from TargetScanHuman Relsease 7.1, Conserved_Site_Context_Scores.txt.zip, 06.01.2016) (TCGA IlluminaHiSeq_miRNASeq, log2(RPM+1) data, version 2016-11-21) (TCGA IlluminaHiSeq_RNASeqV2, log2(normalized_count+1) data, version 2016-08-16) (Spearman’s Rank Correlation (p-value<0.05 and coefficient<-0.25)) |
| Cancer type | miRNA id | miRNA accession | P-val. | Coeff. | # samples |
| UCS | hsa-let-7f-5p | MIMAT0000067 | 0.046 | -0.27 | 56 |
| Top |
| TissGeneMut for BCAT1 |
| TissGeneSNV for BCAT1 |
| nsSNV counts per each loci. Different colors of circles represent different cancer types. Circle size denotes number of samples. (TCGA somatic mutation (SNPs and small INDELs) data, version 2016-04-25) * Click on the image to enlarge it in a new window. |
 |
 |
| Somatic nucleotide variants of TissGene across 28 cancer types (X-axis: cancer type and Y-axis: % of mutated samples) The numbers in parentheses are numbers of samples with mutation (nsSNVs). (TCGA somatic mutation (SNPs and small INDELs) data, version 2016-04-25) |
 |
| - nsSNVs sorted by frequency. |
| AAchange | Cancer type | # samples |
| p.G322E | SKCM | 3 |
| p.R364H | BRCA | 2 |
| p.N200T | PAAD | 1 |
| p.R163C | UCEC | 1 |
| p.L234P | ACC | 1 |
| p.P164S | SKCM | 1 |
| p.A298T | STAD | 1 |
| p.T198P | ACC | 1 |
| p.E377Q | SKCM | 1 |
| p.G197E | SKCM | 1 |
| p.T59M | PRAD | 1 |
| p.C335R | LUSC | 1 |
| p.G259E | HNSC | 1 |
| p.V34A | STAD | 1 |
| p.V384A | BRCA | 1 |
| p.R163C | BLCA | 1 |
| p.V70I | READ | 1 |
| p.P87T | THYM | 1 |
| p.G259R | HNSC | 1 |
| p.M1T | UCEC | 1 |
| p.Q244* | CESC | 1 |
| p.S18L | BRCA | 1 |
| p.G50* | LUAD | 1 |
| p.G168R | SKCM | 1 |
| p.A233V | LGG | 1 |
| p.T54M | STAD | 1 |
| p.E19A | COAD | 1 |
| p.L231F | HNSC | 1 |
| p.W62* | STAD | 1 |
| p.P178H | LIHC | 1 |
| p.P83L | HNSC | 1 |
| p.L295P | LIHC | 1 |
| p.G283D | SKCM | 1 |
| p.G168E | PAAD | 1 |
| p.I108T | SKCM | 1 |
| p.G17E | SKCM | 1 |
| p.T59M | MESO | 1 |
| p.S195L | SKCM | 1 |
| p.L97X | COAD | 1 |
| p.D380N | UCEC | 1 |
| p.T66M | STAD | 1 |
| p.G17R | UCEC | 1 |
| p.S195* | BLCA | 1 |
| p.D239H | BLCA | 1 |
| p.L307P | ACC | 1 |
| p.G16E | SKCM | 1 |
| p.W74X | STAD | 1 |
| p.L6P | COAD | 1 |
| p.S86* | BLCA | 1 |
| p.G261E | SKCM | 1 |
| p.T71M | PRAD | 1 |
| p.I107T | SKCM | 1 |
| p.T35M | COAD | 1 |
| p.M313I | SKCM | 1 |
| p.P190H | LIHC | 1 |
| p.E316X | READ | 1 |
| p.G107R | SKCM | 1 |
| p.G180E | PAAD | 1 |
| p.R163C | SKCM | 1 |
| p.A310T | STAD | 1 |
| p.L295P | ACC | 1 |
| p.P153S | SKCM | 1 |
| p.E275* | UCEC | 1 |
| p.G136E | SKCM | 1 |
| p.P164L | SKCM | 1 |
| p.K176T | STAD | 1 |
| p.R102* | SKCM | 1 |
| p.W205C | LUAD | 1 |
| p.L307P | LIHC | 1 |
| p.V22A | STAD | 1 |
| p.P280L | BRCA | 1 |
| p.K188T | STAD | 1 |
| p.R303C | COAD | 1 |
| p.E316Q | SKCM | 1 |
| Top |
| TissGeneCNV for BCAT1 |
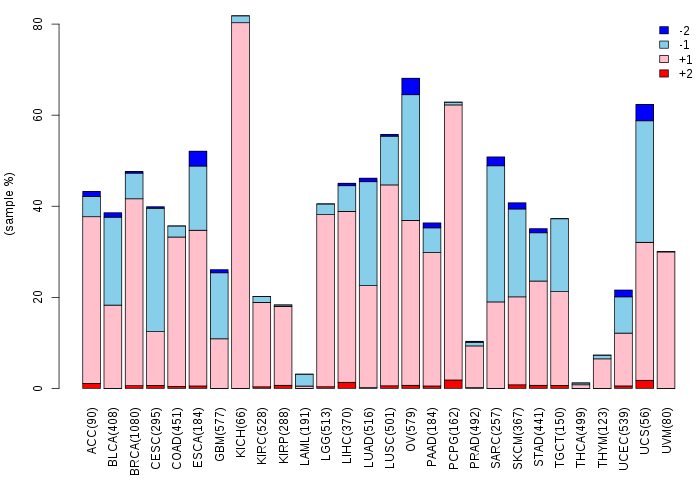
| Copy number variations of TissGene across 28 cancer types (X-axis: cancer type and Y-axis: % of CNV samples) (TCGA Gistic2_CopyNumber_Gistic2_all_data_by_genes, Gistic2 copy number data, version 2016-08-16) |
 |
| Top |
| TissGeneFusions for BCAT1 |
| Fusion genes including TissGene (ChimerDB 3.0, 2016-12-01 and TCGA fusion Portal 2015-12-01) |
| Database | Src | Cancer type | Sample | Fusion gene | ORF | 5'-gene BP | 3'-gene BP |
| Chimerdb3.0 | ChiTaRs | NA | AA743391 | BCAT1-BCAT1 | chr12:24967834 | chr12:24968777 | |
| Chimerdb3.0 | ChiTaRs | NA | AL120469 | BCAT1-MDGA2 | chr12:24966386 | chr14:47647579 | |
| Chimerdb3.0 | ChiTaRs | NA | AI275099 | BCAT1-DNAJC18 | chr12:24964353 | chr5:138746937 | |
| Chimerdb3.0 | ChiTaRs | NA | BF996876 | BCAT1-SLC9A1 | chr12:24968990 | chr1:27429218 | |
| Chimerdb3.0 | FusionScan | BRCA | TCGA-D8-A1XW-01A | BCAT1-MRPS35 | In-Frame | chr12:25031463 | chr12:27908113 |
| Chimerdb3.0 | TopHat-Fusion | BRCA | TCGA-BH-A0DG-01A | BCAT1-GYG2 | Out-of-Frame | chr12:24983722 | chrX:2799092 |
| TCGAfusionPortal | PRADA | BRCA | TCGA-A2-A04U-01A | BCAT1-ITPR2 | In-frame | Chr12:25101861 | Chr12:26493261 |
| TCGAfusionPortal | PRADA | BRCA | TCGA-E2-A1LL-01A | BCAT1-RECQL | CDS-5UTR | Chr12:25101861 | Chr12:21652549 |
| TCGAfusionPortal | PRADA | OV | TCGA-25-1870-01A | BCAT1-PRB3 | In-frame | Chr12:24995016 | Chr12:11421602 |
| Top |
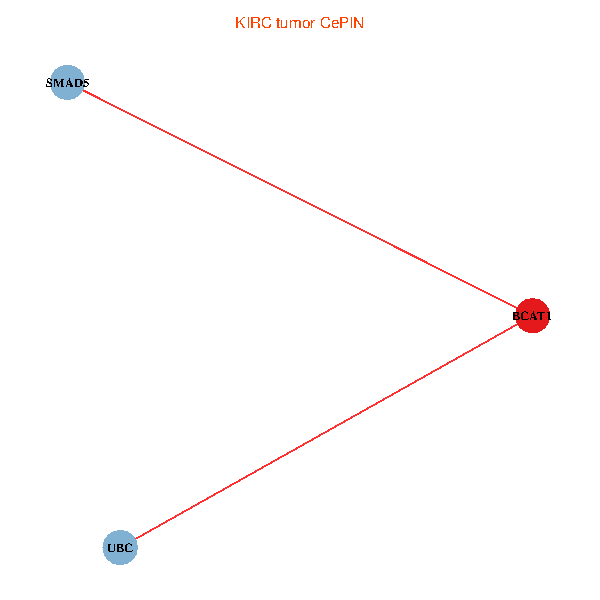
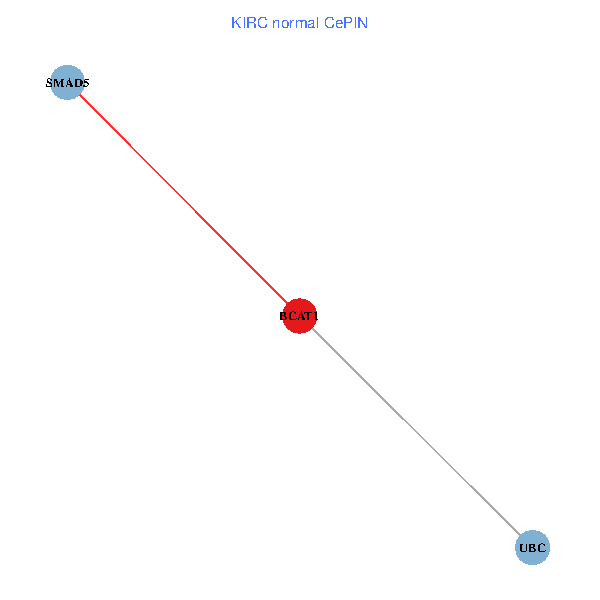
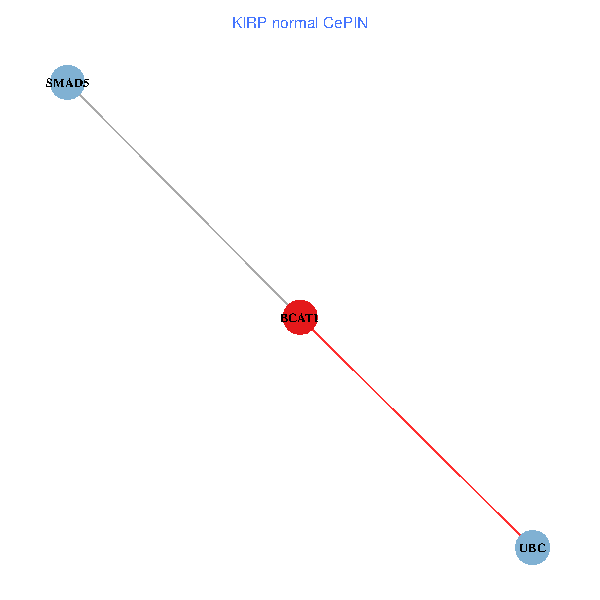
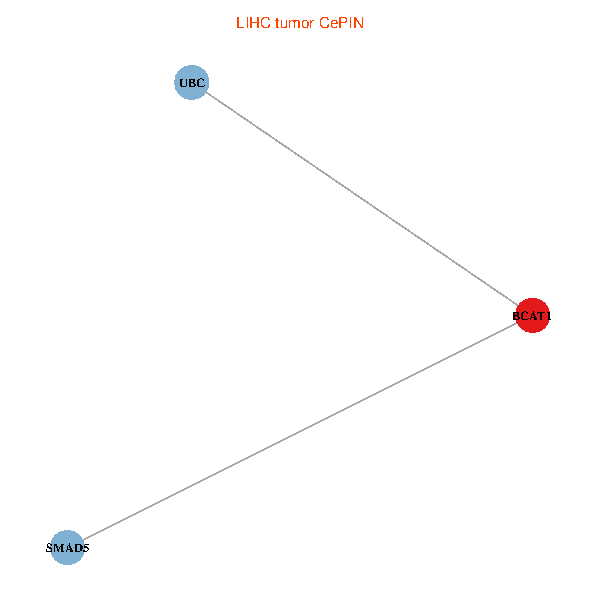
| TissGeneNet for BCAT1 |
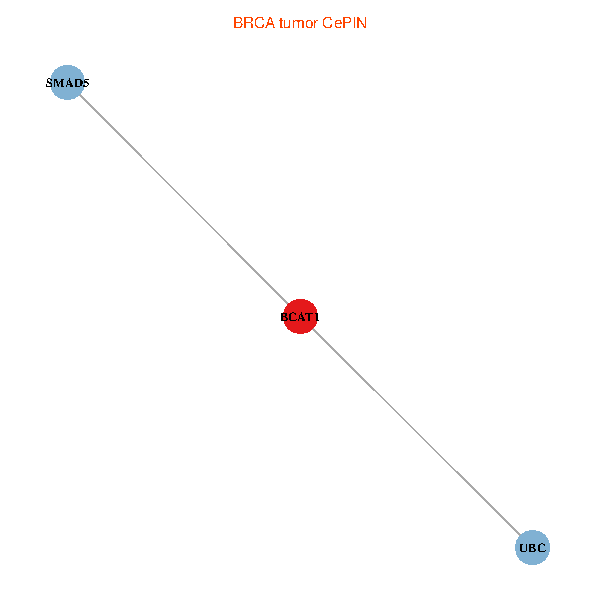
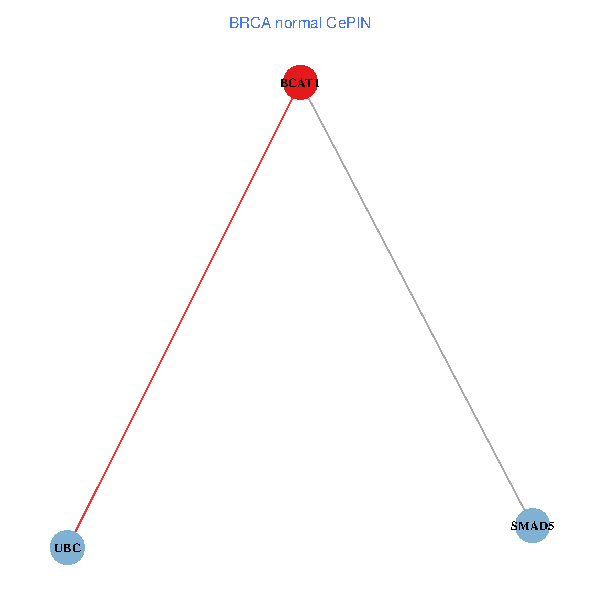
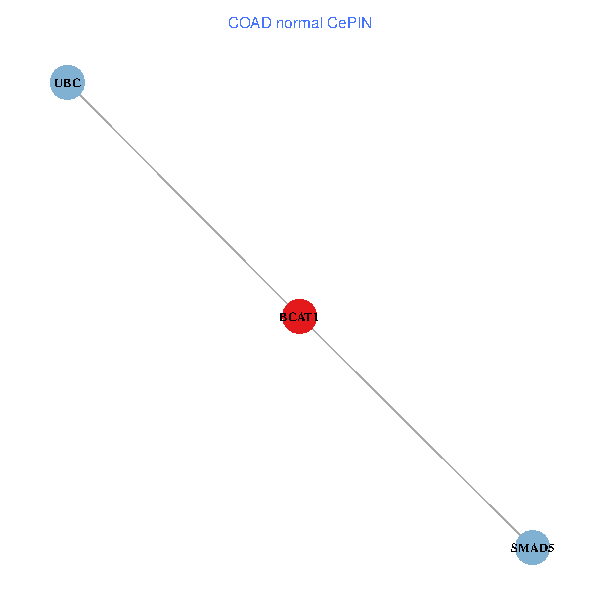
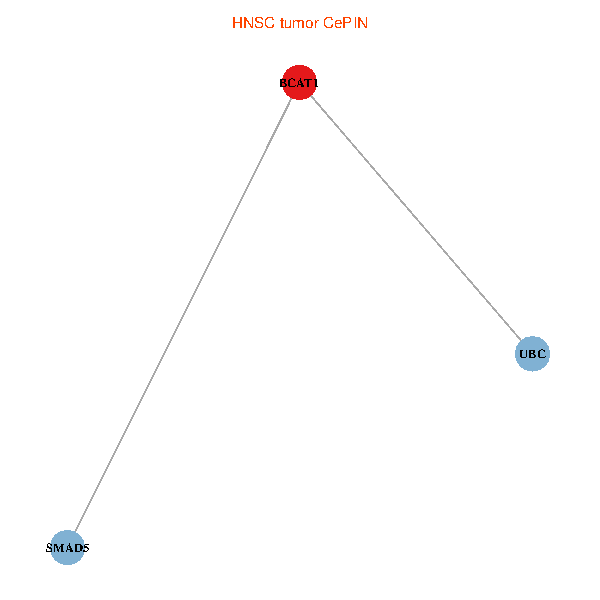
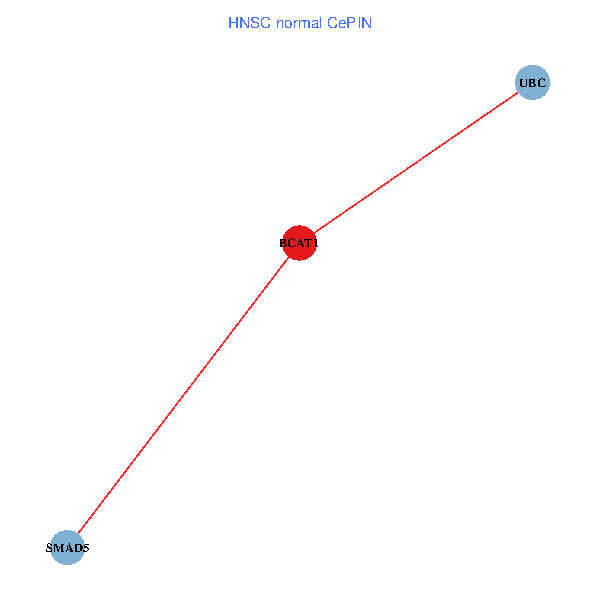
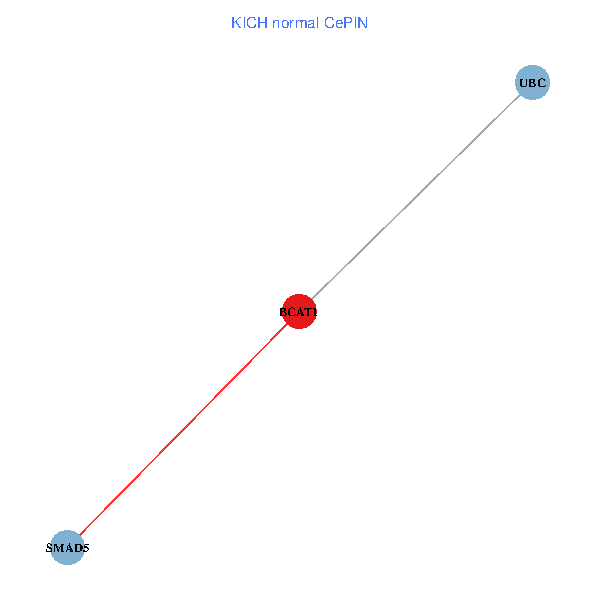
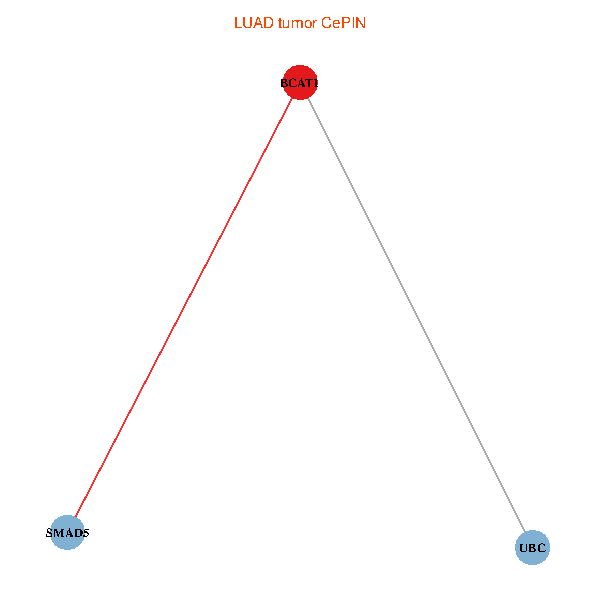
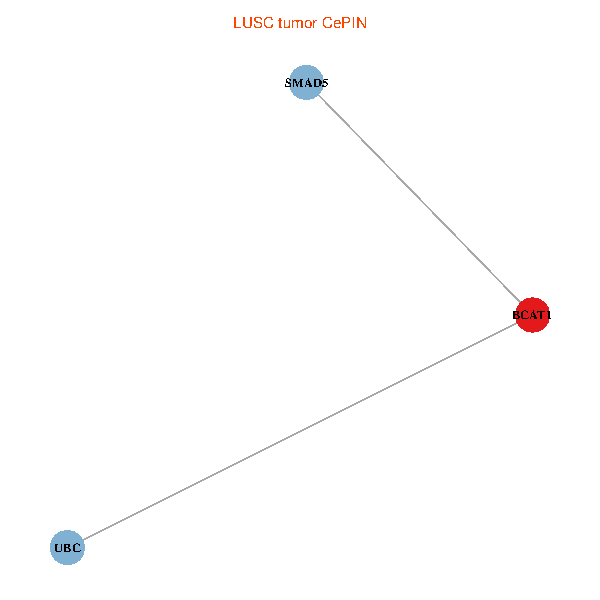
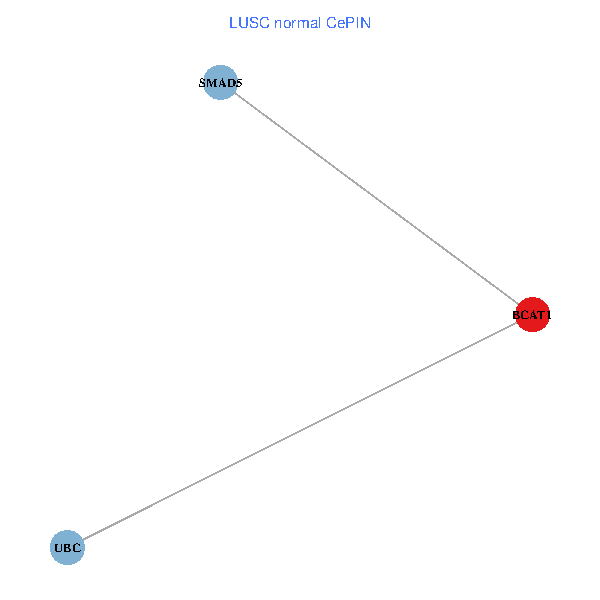
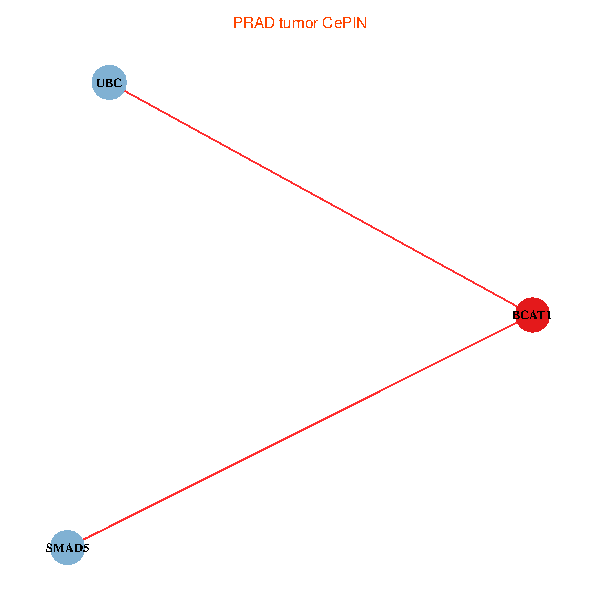
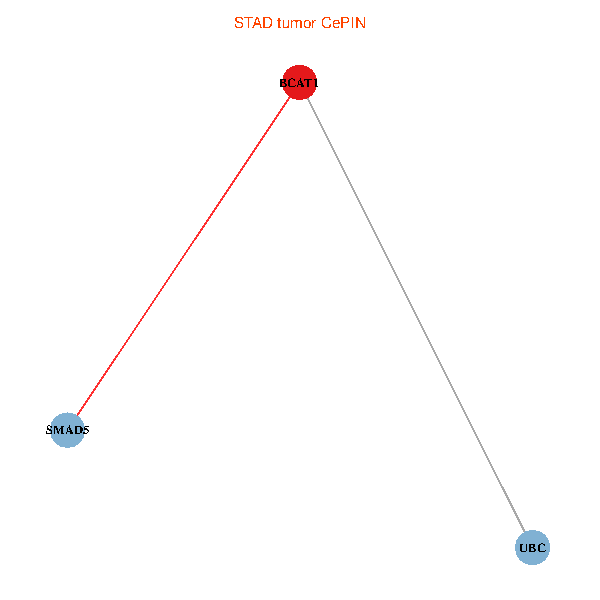
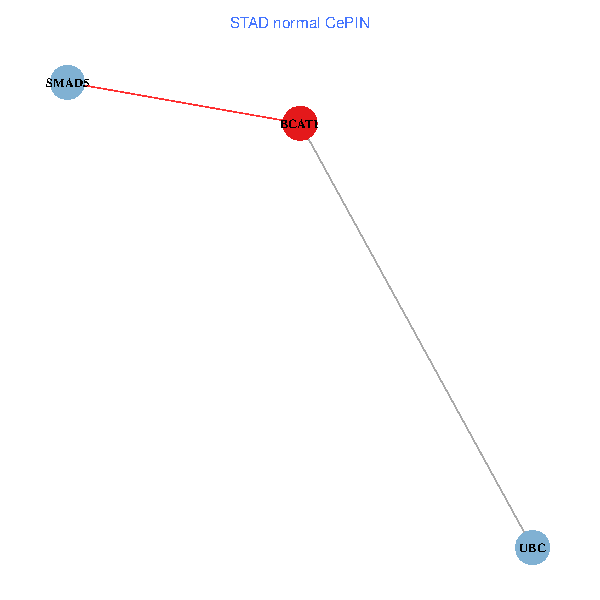
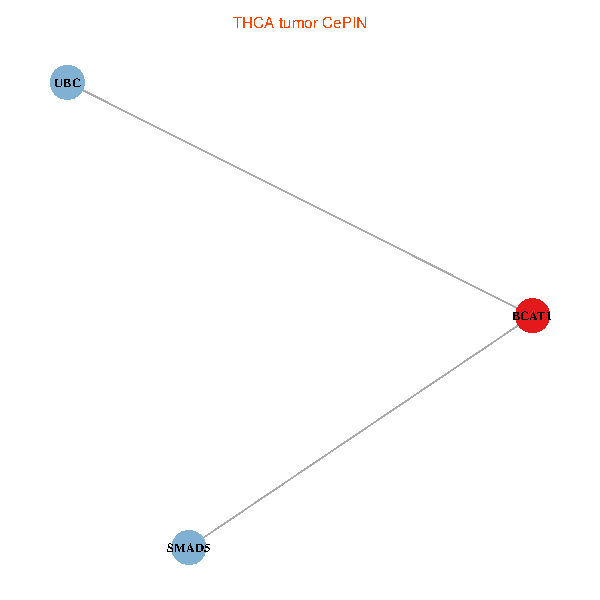
| Co-expressed gene networks based on protein-protein interaction data (CePIN) (TCGA IlluminaHiSeq_RNASeqV2, pan-cancer normalized log2(norm_counts+1) data, version 2016-08-16) (PINA2 ppi data) |
| BRCA (tumor) | BRCA (normal) |
| BCAT1, UBC, SMAD5 (tumor) | BCAT1, UBC, SMAD5 (normal) |
 |  |
| COAD (tumor) | COAD (normal) |
| BCAT1, UBC, SMAD5 (tumor) | BCAT1, UBC, SMAD5 (normal) |
 |  |
| HNSC (tumor) | HNSC (normal) |
| BCAT1, UBC, SMAD5 (tumor) | BCAT1, UBC, SMAD5 (normal) |
 |  |
| KICH (tumor) | KICH (normal) |
| BCAT1, UBC, SMAD5 (tumor) | BCAT1, UBC, SMAD5 (normal) |
 |  |
| KIRC (tumor) | KIRC (normal) |
| BCAT1, UBC, SMAD5 (tumor) | BCAT1, UBC, SMAD5 (normal) |
 |  |
| KIRP (tumor) | KIRP (normal) |
| BCAT1, UBC, SMAD5 (tumor) | BCAT1, UBC, SMAD5 (normal) |
 |  |
| LIHC (tumor) | LIHC (normal) |
| BCAT1, UBC, SMAD5 (tumor) | BCAT1, UBC, SMAD5 (normal) |
 |  |
| LUAD (tumor) | LUAD (normal) |
| BCAT1, UBC, SMAD5 (tumor) | BCAT1, UBC, SMAD5 (normal) |
 |  |
| LUSC (tumor) | LUSC (normal) |
| BCAT1, UBC, SMAD5 (tumor) | BCAT1, UBC, SMAD5 (normal) |
 |  |
| PRAD (tumor) | PRAD (normal) |
| BCAT1, UBC, SMAD5 (tumor) | BCAT1, UBC, SMAD5 (normal) |
 |  |
| STAD (tumor) | STAD (normal) |
| BCAT1, UBC, SMAD5 (tumor) | BCAT1, UBC, SMAD5 (normal) |
 |  |
| THCA (tumor) | THCA (normal) |
| BCAT1, UBC, SMAD5 (tumor) | BCAT1, UBC, SMAD5 (normal) |
 |  |
| Top |
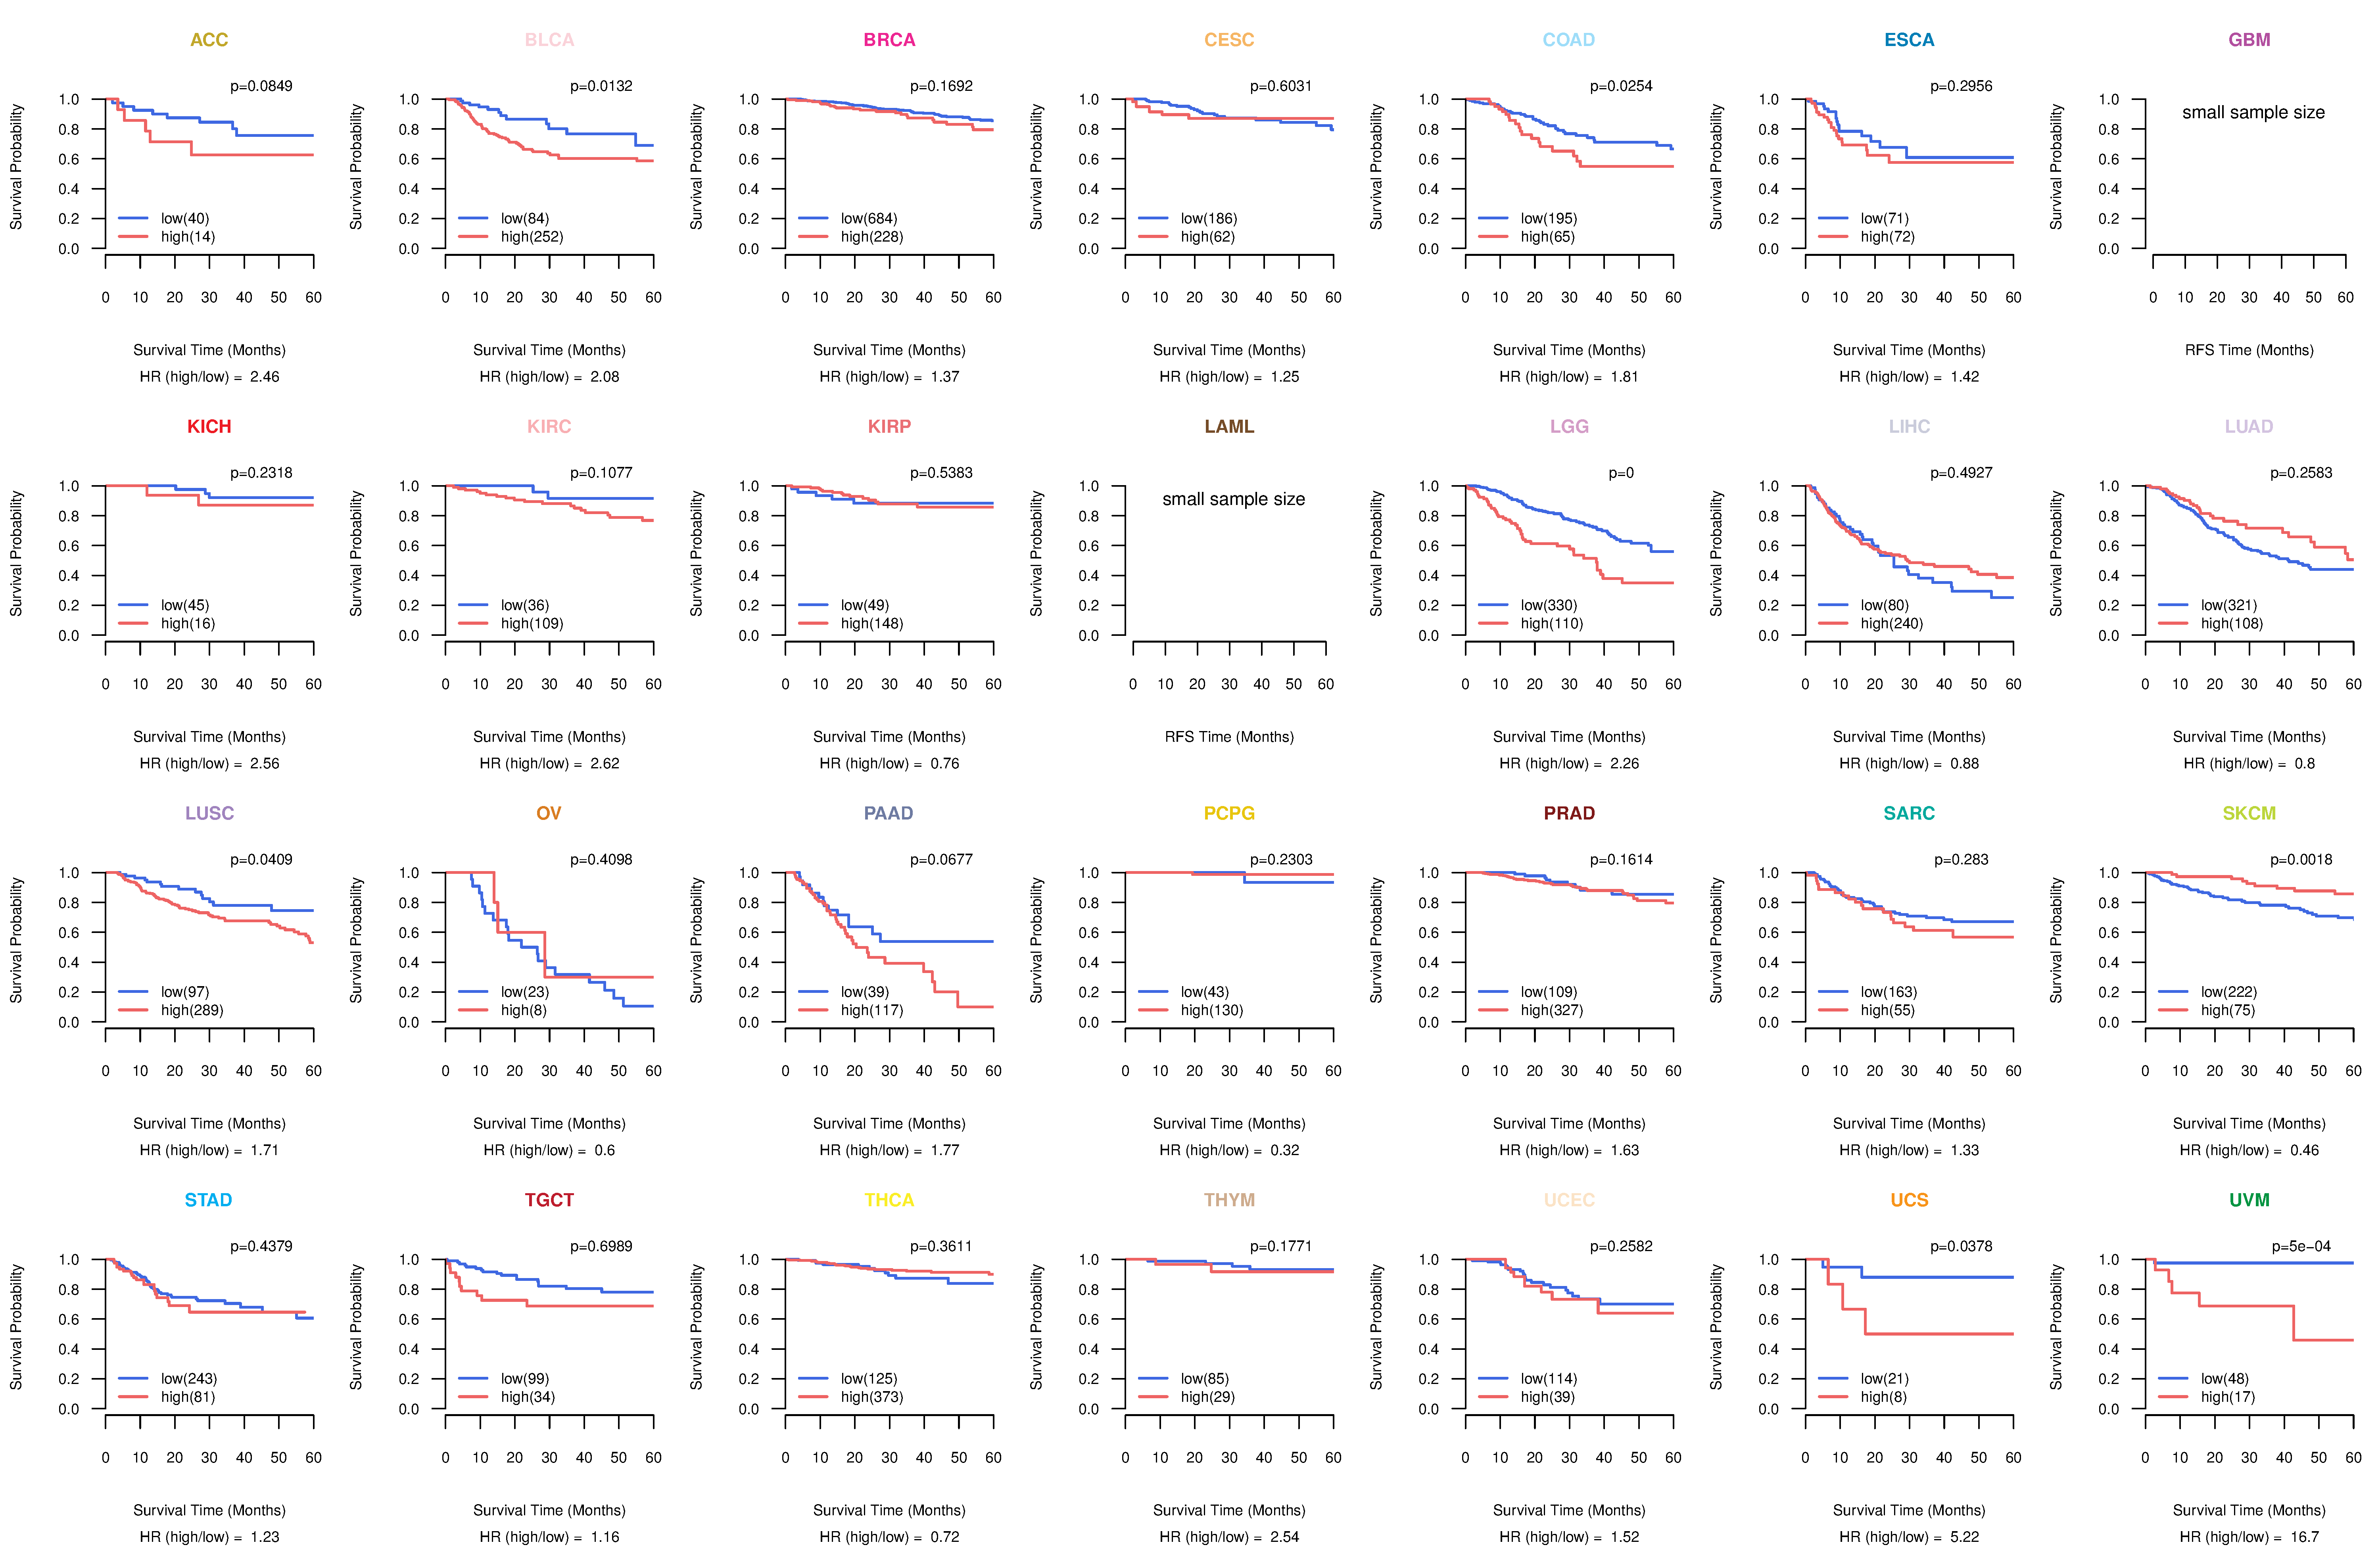
| TissGeneProg for BCAT1 |
| Kaplan-Meier plots with logrank tests of overall survival (OS) using 28 cancer types (TCGA IlluminaHiSeq_RNASeqV2, pan-cancer normalized log2(norm_counts+1) data, version 2016-08-16) (TCGA clinicalMatrix, phenotype data, version 2016-04-27) * Click on the image to enlarge it in a new window. |
 |
| Kaplan-Meier plots with logrank test of relapse free survival (RFS) using 28 cancer types (TCGA IlluminaHiSeq_RNASeqV2, pan-cancer normalized log2(norm_counts+1) data, version 2016-08-16) (TCGA clinicalMatrix, phenotype data, version 2016-04-27) * Click on the image enlarge it in a new window. |
 |
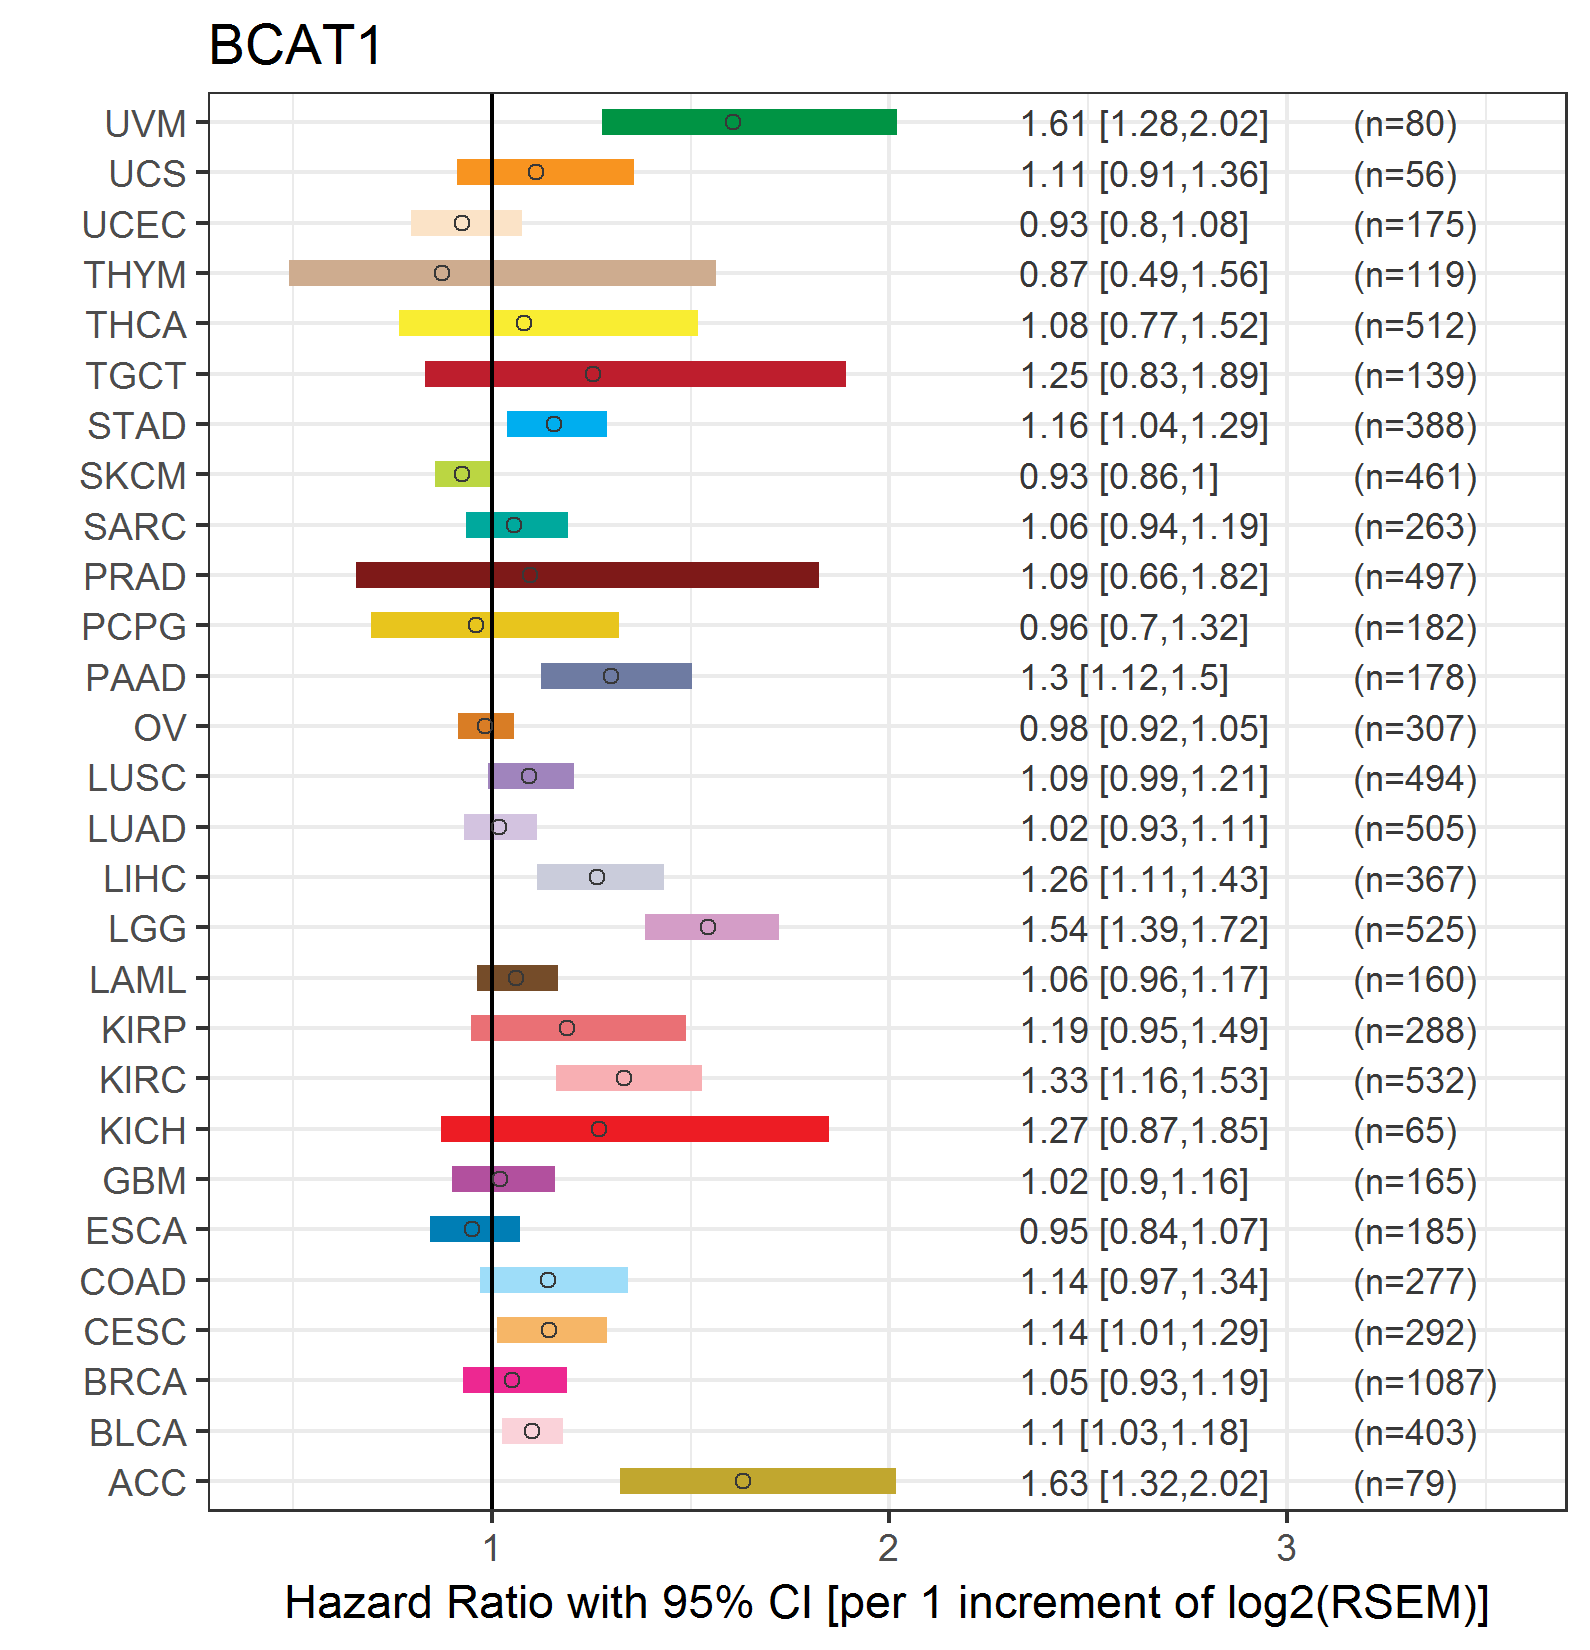
| Forest plot of Cox proportional hazard ratio (HR) and 95% CI of overall survival (OS) using 28 cancer types (TCGA IlluminaHiSeq_RNASeqV2, pan-cancer normalized log2(norm_counts+1) data, version 2016-08-16) (TCGA clinicalMatrix, phenotype data, version 2016-04-27) * Click on the image enlarge it in a new window. |
 |
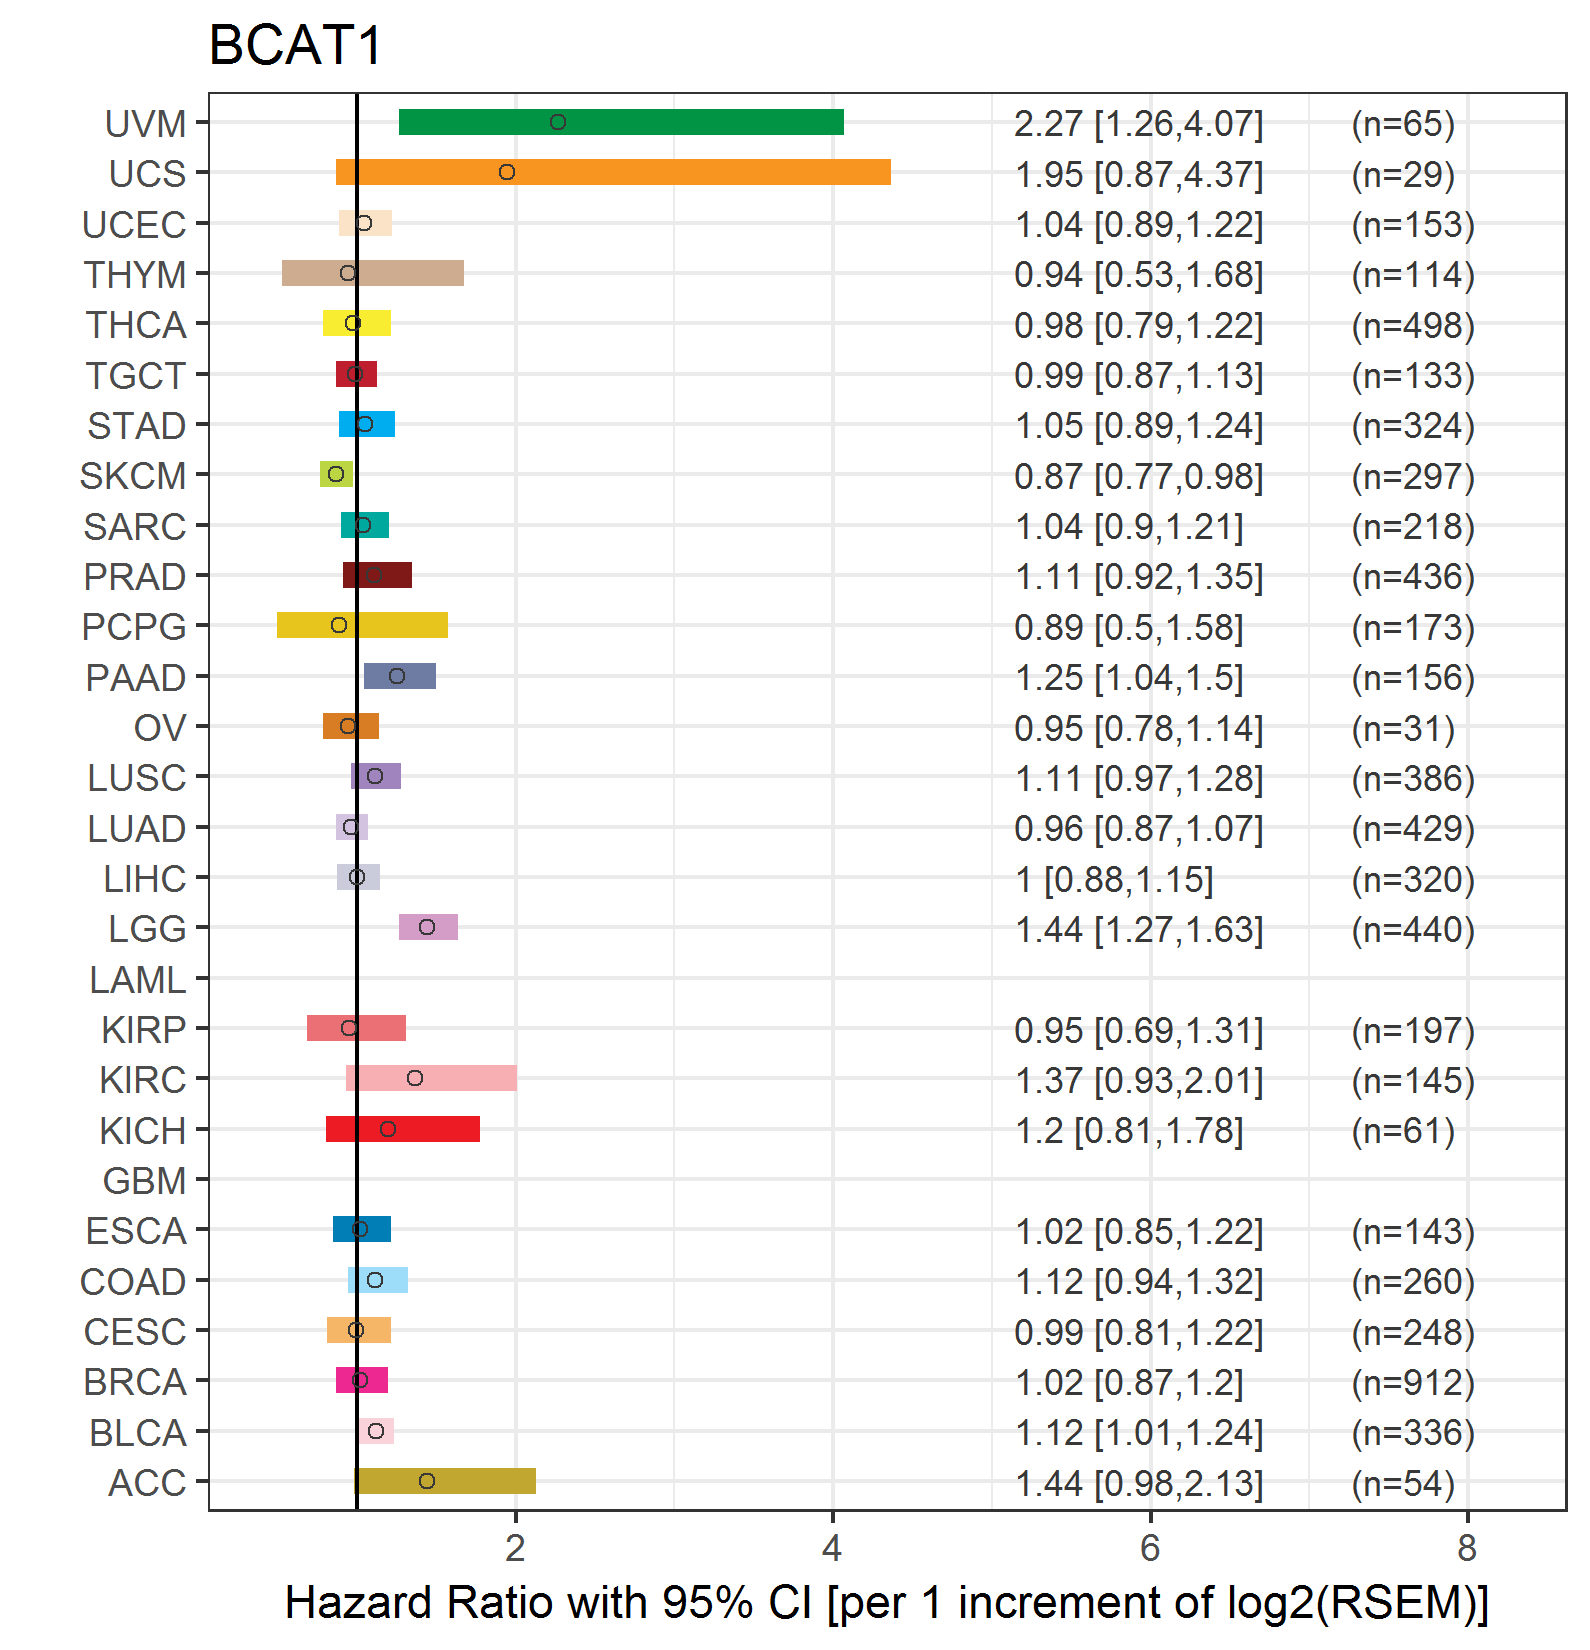
| Forest plot of Cox proportional hazard ratio (HR) and 95% CI of relapse free survival (RFS) using 28 cancer types (TCGA IlluminaHiSeq_RNASeqV2, pan-cancer normalized log2(norm_counts+1) data, version 2016-08-16) (TCGA clinicalMatrix, phenotype data, version 2016-04-27) * Click on the image enlarge it in a new window. |
 |
| Top |
| TissGeneClin for BCAT1 |
| TissGeneDrug for BCAT1 |
| Drug information targeting TissGene (DrugBank Version 5.0.6, 2017-04-01) |
| DrugBank ID | Drug name | Drug activity | Drug type | Drug status |
| DB00149 | L-Leucine | Small molecule | Approved|Nutraceutical | |
| DB00161 | L-Valine | Small molecule | Approved|Nutraceutical | |
| DB00167 | L-Isoleucine | Small molecule | Approved|Nutraceutical |
| Top |
| TissGeneDisease for BCAT1 |
| Disease information associated with TissGene (DisGeNet, 2016-06-01) |
| Disease ID | Disease name | # pubmeds | Source |
| umls:C0009402 | Colorectal Carcinoma | 2 | BeFree |
| umls:C0027627 | Neoplasm Metastasis | 2 | BeFree |
| umls:C1527249 | Colorectal Cancer | 2 | BeFree |
| umls:C2931822 | Nasopharyngeal carcinoma | 2 | BeFree |
| umls:C0009404 | Colorectal Neoplasms | 1 | LHGDN |
| umls:C0011854 | Diabetes Mellitus, Insulin-Dependent | 1 | BeFree |
| umls:C0017636 | Glioblastoma | 1 | BeFree |
| umls:C0017638 | Glioma | 1 | BeFree |
| umls:C0017661 | IGA Glomerulonephritis | 1 | CTD_human |
| umls:C0025149 | Medulloblastoma | 1 | BeFree |
| umls:C0040336 | Tobacco Use Disorder | 1 | GAD |
| umls:C0043094 | Weight Gain | 1 | CTD_human |
| umls:C1520166 | Xenograft Model | 1 | BeFree |
| umls:C1709246 | Non-Neoplastic Disorder | 1 | BeFree |
| umls:C2718067 | Alcoholic Steatohepatitis | 1 | BeFree |
|
Copyright 2016-Present - The University of Texas Health Science Center at Houston (UTHealth) Web File Viewing | How to Report, Fraud, Waste and Abuse | State of Texas | Statewide Search | Texas Homeland Security | Site Policies |