 |
| |
| |
| |
| |
| |
| |
|

| TissGeneSummary for RFX4 |
 Gene summary Gene summary |
| Basic gene information | Gene symbol | RFX4 |
| Gene name | regulatory factor X, 4 (influences HLA class II expression) | |
| Synonyms | NYD-SP10 | |
| Cytomap | UCSC genome browser: 12q24 | |
| Type of gene | protein-coding | |
| RefGenes | NM_001206691.1, NM_032491.5,NM_213594.2,NM_002920.3, | |
| Description | testis development protein NYD-SP10transcription factor RFX4winged-helix transcription factor RFX4 | |
| Modification date | 20141207 | |
| dbXrefs | MIM : 603958 | |
| HGNC : HGNC | ||
| Ensembl : ENSG00000111783 | ||
| HPRD : 04905 | ||
| Vega : OTTHUMG00000169173 | ||
| Protein | UniProt: go to UniProt's Cross Reference DB Table | |
| Expression | CleanEX: HS_RFX4 | |
| BioGPS: 5992 | ||
| Pathway | NCI Pathway Interaction Database: RFX4 | |
| KEGG: RFX4 | ||
| REACTOME: RFX4 | ||
| Pathway Commons: RFX4 | ||
| Context | iHOP: RFX4 | |
| ligand binding site mutation search in PubMed: RFX4 | ||
| UCL Cancer Institute: RFX4 | ||
| Assigned class in TissGDB* | C | |
| Included tissue-specific gene expression resources | TiGER,GTEx | |
| Specific-tissues in normal samples (assigned by TissGDB using HPA, TiGER, and GTEx) | Testis | |
| Cancer types related to the specific-tissues in cancer samples (assigned by TissGDB using TCGA) | TGCT | |
| Reference showing the relevant tissue of RFX4 | ||
| Description by TissGene annotations | Have significant anti-correlated miRNA | |
| * Class A consists of genes with literature evidence and is part of the cTissGenes. Class B consists of only cTissGenes without additional evidence. The remaining genes belong to Class C. |
| Gene ontology having evidence of Inferred from Direct Assay (IDA) from Entrez |
| GO ID | GO term | PubMed ID | GO:0045944 | positive regulation of transcription from RNA polymerase II promoter | 16893423 | GO:0045944 | positive regulation of transcription from RNA polymerase II promoter | 16893423 |
| Top |
| TissGeneExp for RFX4 |
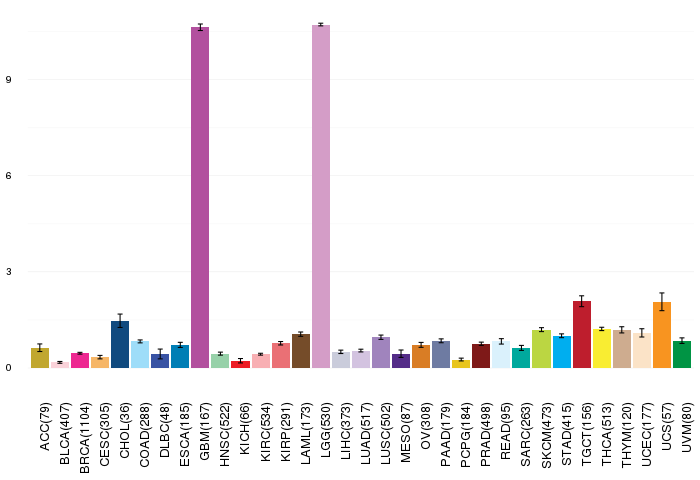
| Gene expressions across 28 cancer types (X-axis: cancer type and Y-axis: log2(norm_counts+1)) (TCGA IlluminaHiSeq_RNASeqV2, pan-cancer normalized log2(norm_counts+1) data, version 2016-08-16) |
 |
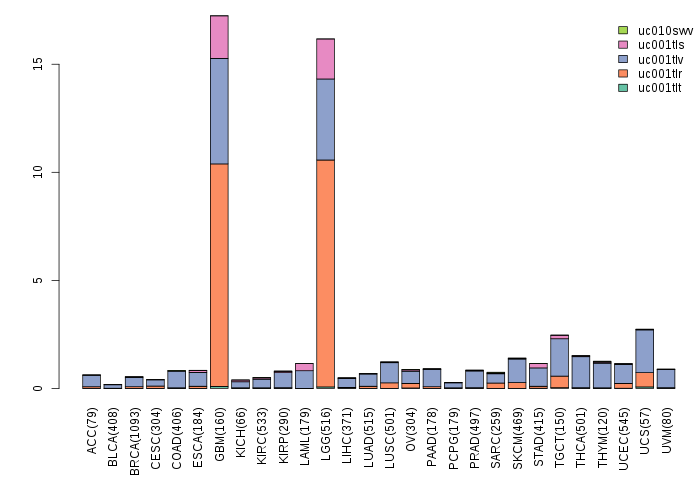
| Gene isoform expressions across 28 cancer types (X-axis: cancer type and Y-axis: log2(norm_counts+1)) (TCGA pan-cancer tcga_rsem_isoform_tpm, version 2016-09-01) |
 |
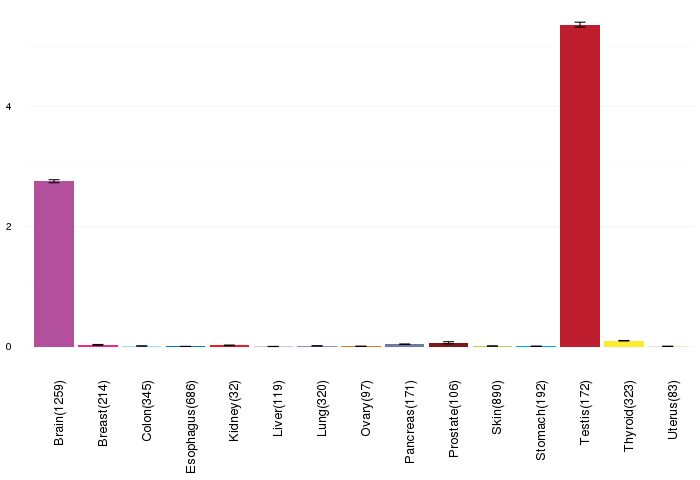
| Gene expressions across normal tissues of GTEx data (GTEx GTEx_Analysis_v6_RNA-seq_RNA-SeQCv1.1.8_gene_rpkm.gct) - Here, we shows the matched tissue types only among our 28 cancer types. |
 |
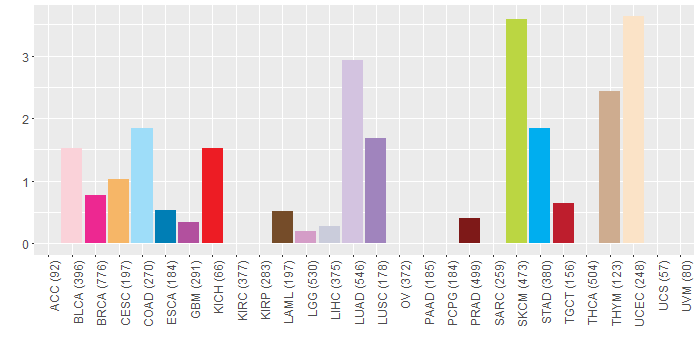
| Different expressions across 14 cancer types with more than 10 samples between matched tumors and normals (X-axis: cancer type and Y-axis: log2(norm_counts+1)) (TCGA IlluminaHiSeq_RNASeqV2, pan-cancer normalized log2(norm_counts+1) data, version 2016-08-16) |
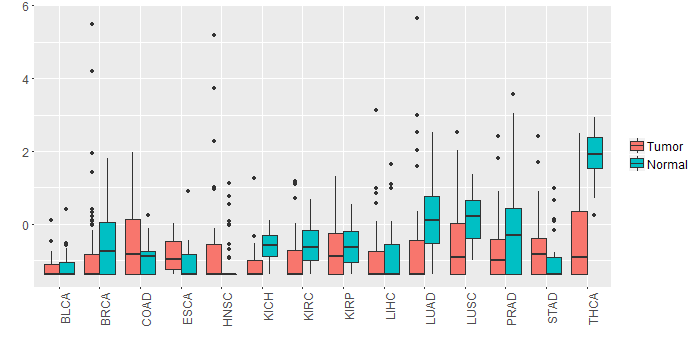 |
| - Significantly differentially expressed cancer types and information. (|Fold change|>1 and FDR<0.05) |
| Cancer type | Mean(exp) in tumor | Mean(exp) in matched normal | Log2FC | P-val. | FDR |
| THCA | -0.306578952 | 1.885624438 | -2.19220339 | 9.30E-22 | 5.15E-20 |
| Top |
| TissGene-miRNA for RFX4 |
| Significantly anti-correlated miRNAs of TissGene across 28 cancer types (Gene-miRNA relations from TargetScanHuman Relsease 7.1, Conserved_Site_Context_Scores.txt.zip, 06.01.2016) (TCGA IlluminaHiSeq_miRNASeq, log2(RPM+1) data, version 2016-11-21) (TCGA IlluminaHiSeq_RNASeqV2, log2(normalized_count+1) data, version 2016-08-16) (Spearman’s Rank Correlation (p-value<0.05 and coefficient<-0.25)) |
| Cancer type | miRNA id | miRNA accession | P-val. | Coeff. | # samples |
| UCS | hsa-miR-19a-3p | MIMAT0000073 | 0.033 | -0.29 | 56 |
| UCS | hsa-miR-19b-3p | MIMAT0000074 | 0.017 | -0.32 | 56 |
| Top |
| TissGeneMut for RFX4 |
| TissGeneSNV for RFX4 |
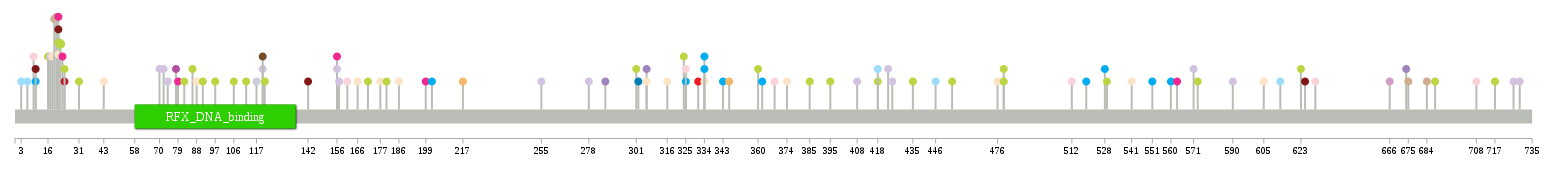
| nsSNV counts per each loci. Different colors of circles represent different cancer types. Circle size denotes number of samples. (TCGA somatic mutation (SNPs and small INDELs) data, version 2016-04-25) * Click on the image to enlarge it in a new window. |
 |
 |
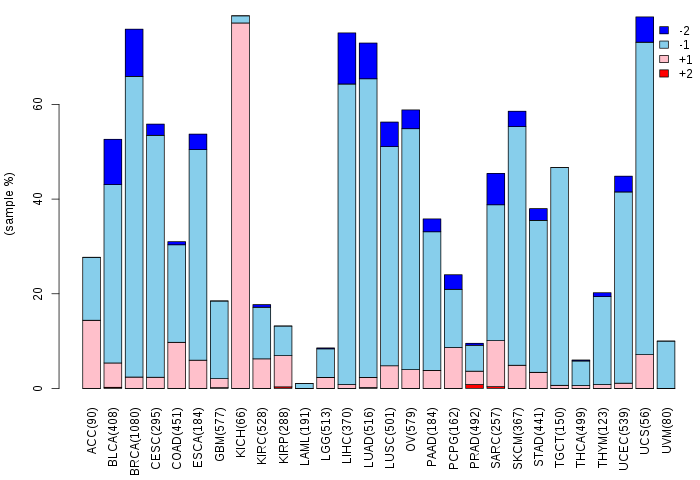
| Somatic nucleotide variants of TissGene across 28 cancer types (X-axis: cancer type and Y-axis: % of mutated samples) The numbers in parentheses are numbers of samples with mutation (nsSNVs). (TCGA somatic mutation (SNPs and small INDELs) data, version 2016-04-25) |
 |
| - nsSNVs sorted by frequency. |
| AAchange | Cancer type | # samples |
| p.S22F | SKCM | 2 |
| p.R331W | KICH | 1 |
| p.A729D | LUAD | 1 |
| p.A519V | STAD | 1 |
| p.H360Y | SKCM | 1 |
| p.D286E | LUSC | 1 |
| p.G446D | COAD | 1 |
| p.C255Y | LUAD | 1 |
| p.T156P | BRCA | 1 |
| p.R171W | SKCM | 1 |
| p.A72T | LUAD | 1 |
| p.Q571K | LUAD | 1 |
| p.V585I | HNSC | 1 |
| p.T359N | HNSC | 1 |
| p.F316L | UCEC | 1 |
| p.D88A | UCEC | 1 |
| p.A6T | COAD | 1 |
| p.L82F | SKCM | 1 |
| p.R117S | LIHC | 1 |
| p.R19W | THYM | 1 |
| p.R284X | READ | 1 |
| p.G120V | LUAD | 1 |
| p.R708C | BLCA | 1 |
| p.L666M | LGG | 1 |
| p.H454Y | SKCM | 1 |
| p.R334Q | UCEC | 1 |
| p.A528V | STAD | 1 |
| p.W302C | ESCA | 1 |
| p.S529F | SKCM | 1 |
| p.G120R | LAML | 1 |
| p.R476W | UCEC | 1 |
| p.G157R | LUAD | 1 |
| p.S435F | SKCM | 1 |
| p.T551M | STAD | 1 |
| p.L202Q | STAD | 1 |
| p.I346M | CESC | 1 |
| p.E70Q | LUAD | 1 |
| p.H386N | HNSC | 1 |
| p.Y78* | GBM | 1 |
| p.E385K | SKCM | 1 |
| p.S325P | STAD | 1 |
| p.C408F | LUAD | 1 |
| p.W684C | THYM | 1 |
| p.V362M | STAD | 1 |
| p.N726K | LUAD | 1 |
| p.S418L | COAD | 1 |
| p.Y177* | UCEC | 1 |
| p.G324R | SKCM | 1 |
| p.T731I | HNSC | 1 |
| p.S325* | BLCA | 1 |
| p.P121S | SKCM | 1 |
| p.R16K | SKCM | 1 |
| p.R374Q | UCEC | 1 |
| p.A306T | LUSC | 1 |
| p.V423M | LUAD | 1 |
| p.G418R | SKCM | 1 |
| p.D186Y | UCEC | 1 |
| p.Q18K | UCEC | 1 |
| p.P625H | PRAD | 1 |
| p.E24K | TGCT | 1 |
| p.R20H | THYM | 1 |
| p.Q379* | HNSC | 1 |
| p.T613M | COAD | 1 |
| p.N605S | UCEC | 1 |
| p.P688L | SKCM | 1 |
| p.P534H | HNSC | 1 |
| p.R315X | CHOL | 1 |
| p.R79C | BRCA | 1 |
| p.P573S | SKCM | 1 |
| p.S512L | BLCA | 1 |
| p.R674I | LUSC | 1 |
| p.T560M | STAD | 1 |
| p.D142N | PRAD | 1 |
| p.S21L | SKCM | 1 |
| p.E24K | SKCM | 1 |
| p.P97L | SKCM | 1 |
| p.S21L | BRCA | 1 |
| p.E43* | UCEC | 1 |
| p.Q119R | READ | 1 |
| p.D10Y | STAD | 1 |
| p.P479S | SKCM | 1 |
| p.S21L | PRAD | 1 |
| p.V161G | BLCA | 1 |
| p.E479K | SKCM | 1 |
| p.I630M | BLCA | 1 |
| p.P9S | BLCA | 1 |
| p.S278C | LUAD | 1 |
| p.W3L | COAD | 1 |
| p.R343Q | STAD | 1 |
| p.V166M | UCEC | 1 |
| p.L91F | SKCM | 1 |
| p.L541I | UCEC | 1 |
| p.G74V | LUAD | 1 |
| p.T156K | LUAD | 1 |
| p.D368H | BLCA | 1 |
| p.E86K | SKCM | 1 |
| p.S21L | READ | 1 |
| p.P106L | SKCM | 1 |
| p.Q623P | SKCM | 1 |
| p.P590R | LUAD | 1 |
| p.H217D | CESC | 1 |
| p.R334Q | STAD | 1 |
| p.W675C | THYM | 1 |
| p.Q425L | LUAD | 1 |
| p.S334P | STAD | 1 |
| p.W17C | LUAD | 1 |
| p.S199C | BRCA | 1 |
| p.E31K | SKCM | 1 |
| p.E180K | SKCM | 1 |
| p.E395K | SKCM | 1 |
| p.N23K | BRCA | 1 |
| p.E301K | SKCM | 1 |
| p.P112S | SKCM | 1 |
| p.Q717P | SKCM | 1 |
| p.R306* | UCEC | 1 |
| p.S21L | UCEC | 1 |
| p.G563W | BRCA | 1 |
| p.A10V | PRAD | 1 |
| Top |
| TissGeneCNV for RFX4 |
| Copy number variations of TissGene across 28 cancer types (X-axis: cancer type and Y-axis: % of CNV samples) (TCGA Gistic2_CopyNumber_Gistic2_all_data_by_genes, Gistic2 copy number data, version 2016-08-16) |
 |
| Top |
| TissGeneFusions for RFX4 |
| Fusion genes including TissGene (ChimerDB 3.0, 2016-12-01 and TCGA fusion Portal 2015-12-01) |
| Database | Src | Cancer type | Sample | Fusion gene | ORF | 5'-gene BP | 3'-gene BP |
| Chimerdb3.0 | FusionScan | BRCA | TCGA-A7-A26G-01A | RIC8B-RFX4 | In-Frame | chr12:107245372 | chr12:107033109 |
| TCGAfusionPortal | PRADA | BRCA | TCGA-A7-A26G-01A | RIC8B-RFX4 | In-frame | Chr12:107245372 | Chr12:107033110 |
| TCGAfusionPortal | PRADA | BRCA | TCGA-EW-A3U0-01A | C12orf23-RFX4 | In-frame | Chr12:107360958 | Chr12:107033110 |
| TCGAfusionPortal | PRADA | HNSC | TCGA-CV-7183-01A | CHST11-RFX4 | In-frame | Chr12:104995769 | Chr12:107075771 |
| Top |
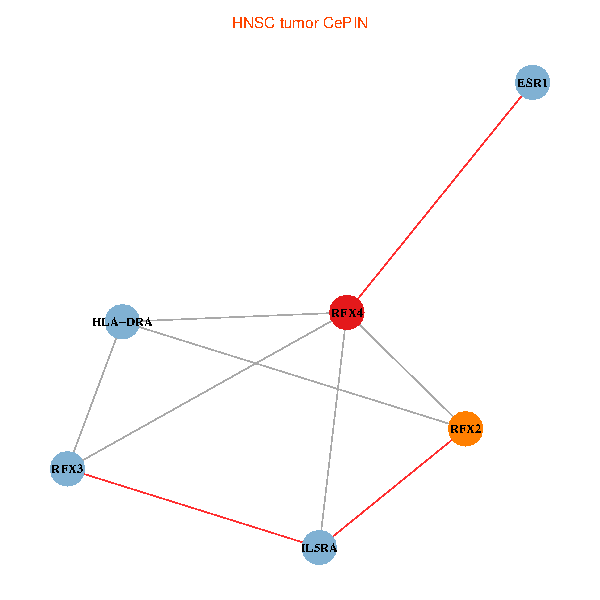
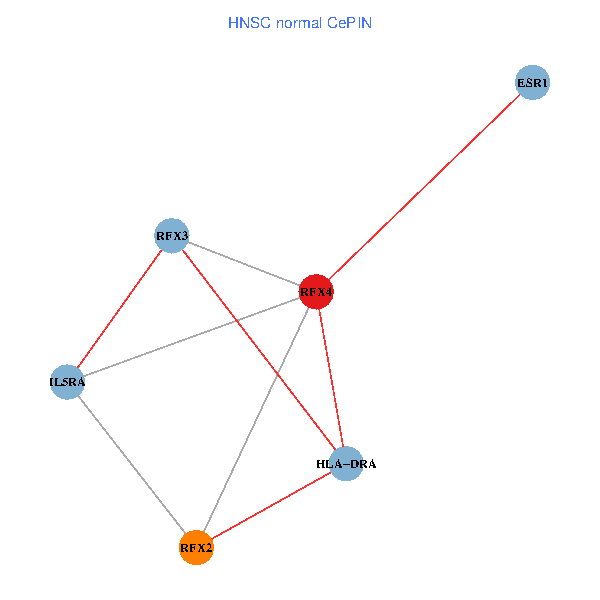
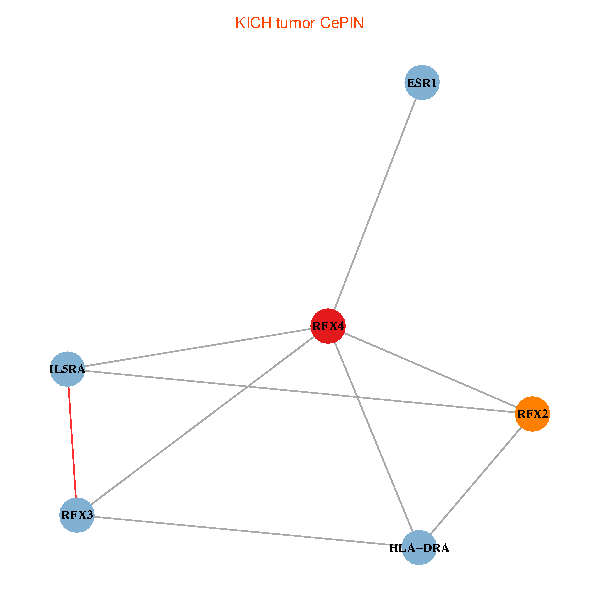
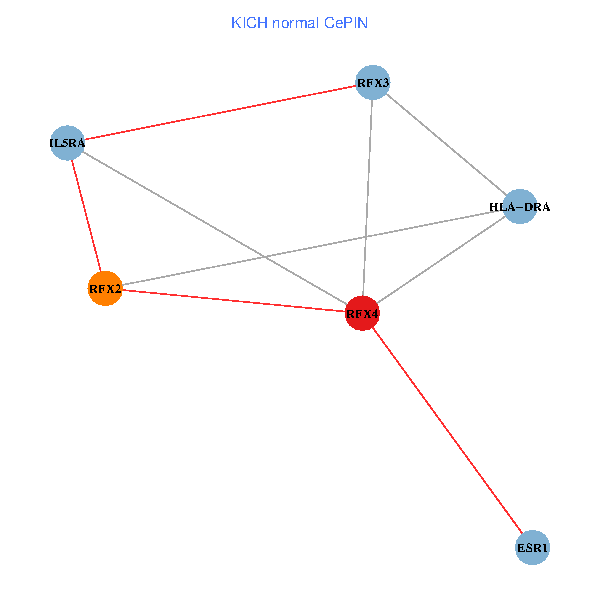
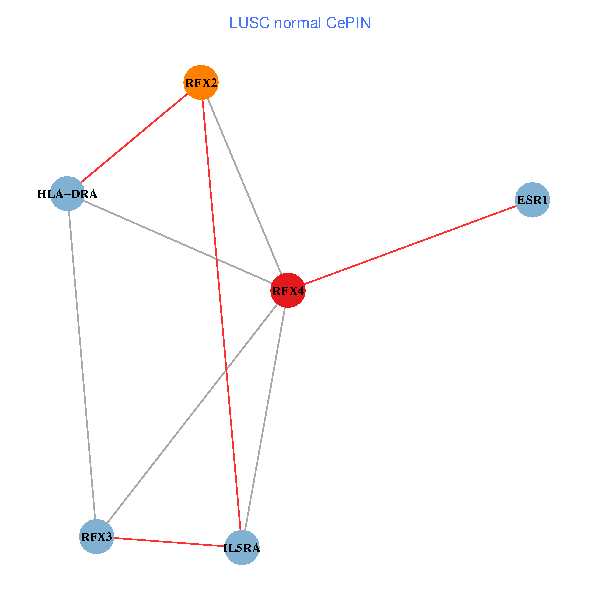
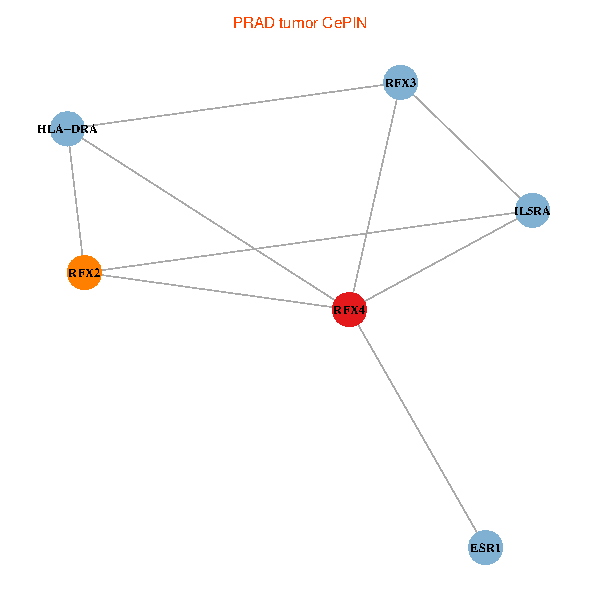
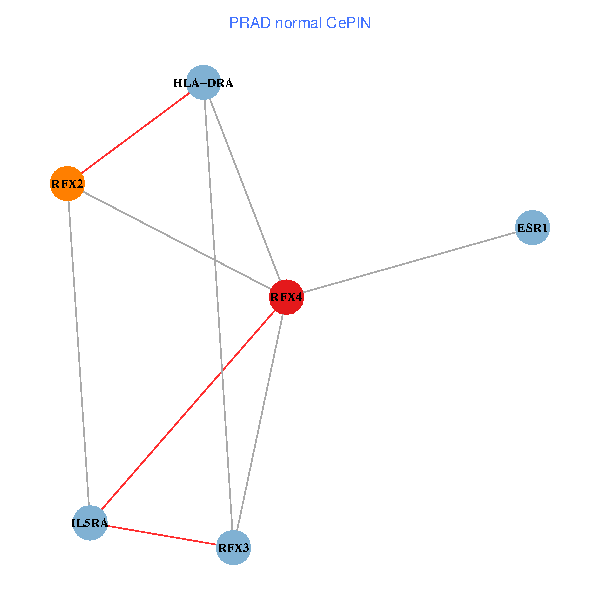
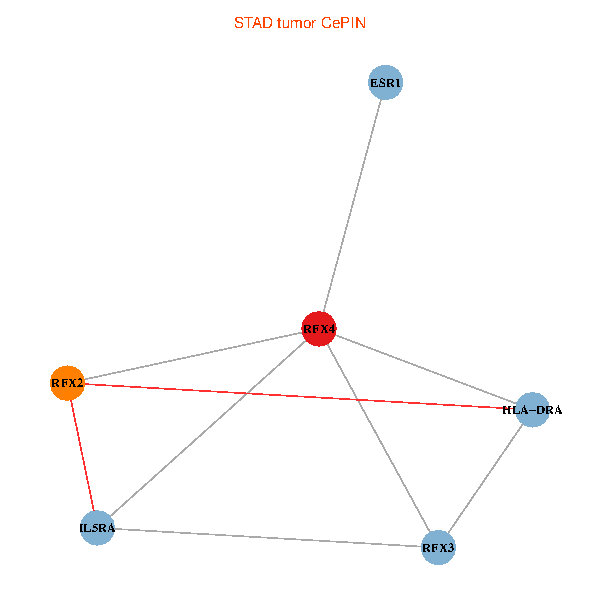
| TissGeneNet for RFX4 |
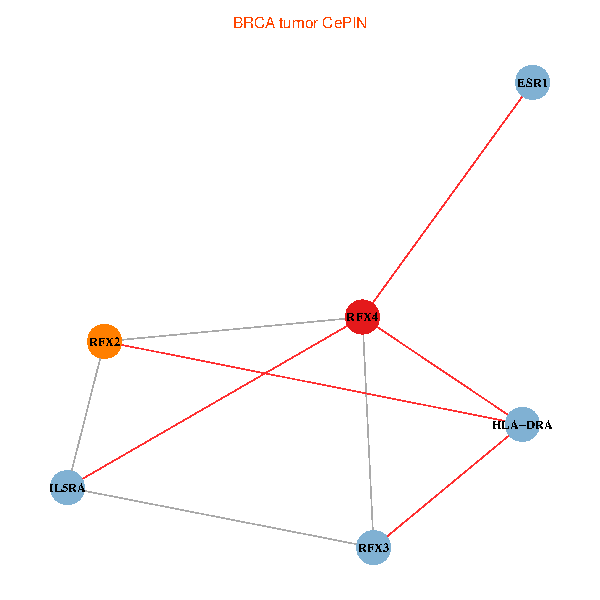
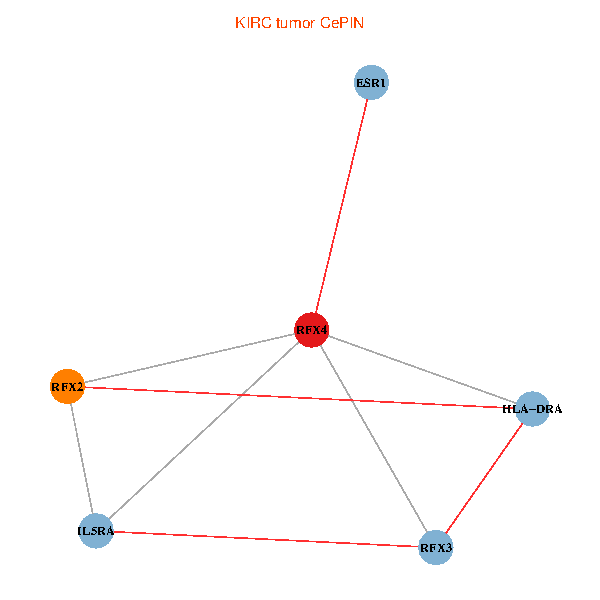
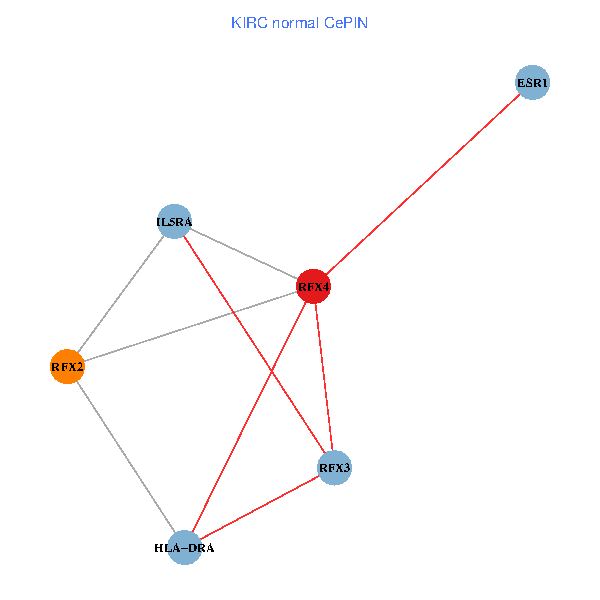
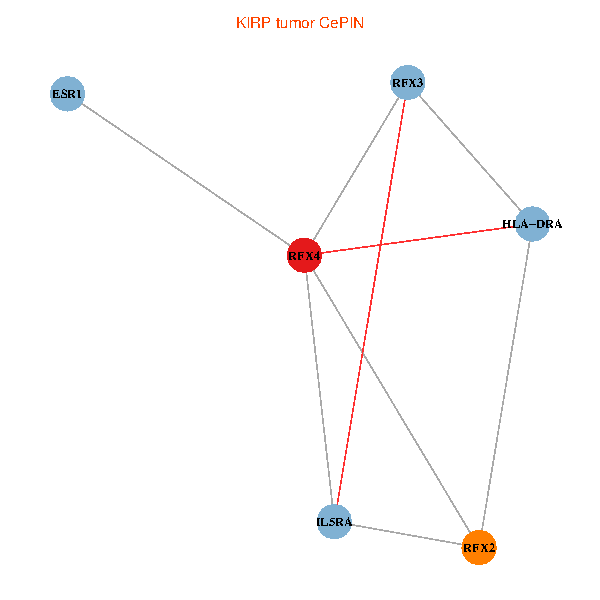
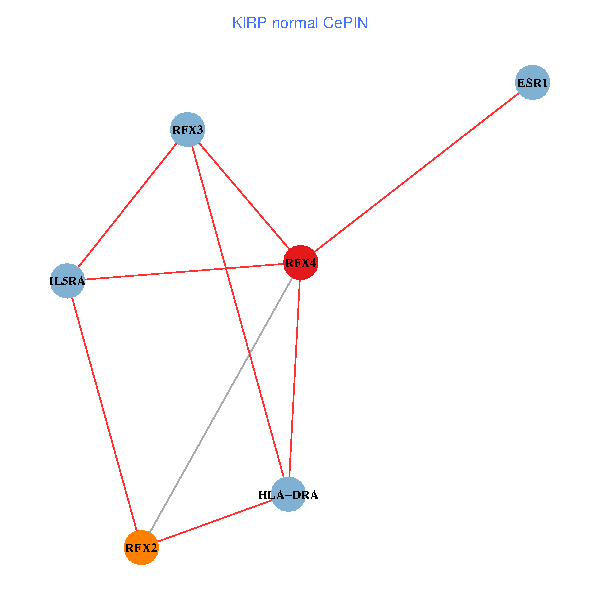
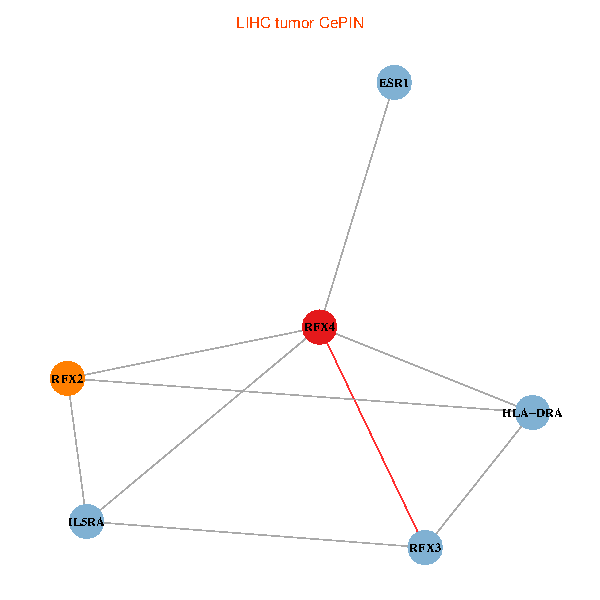
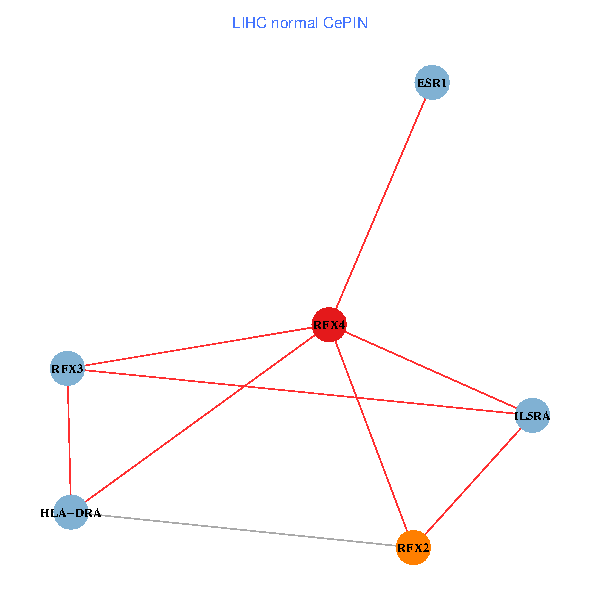
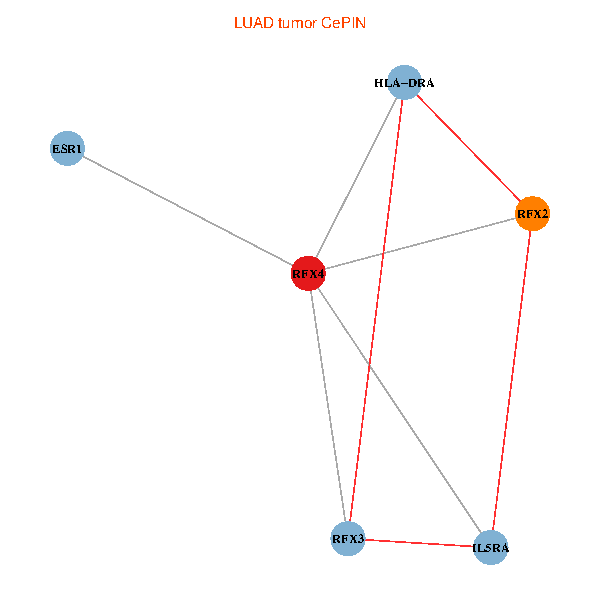
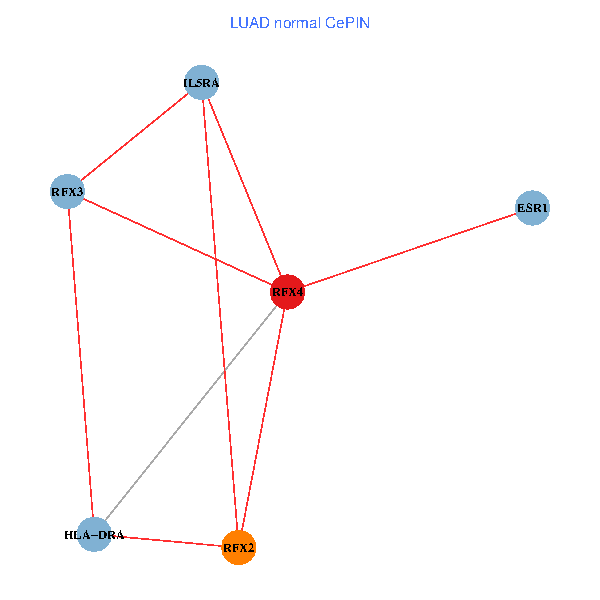
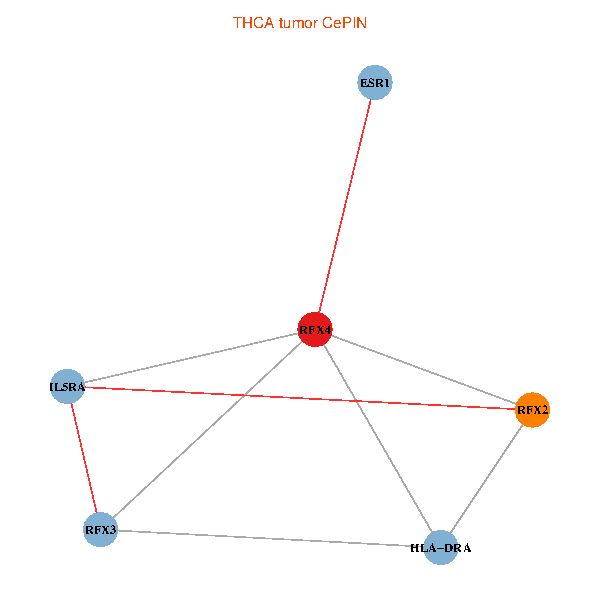
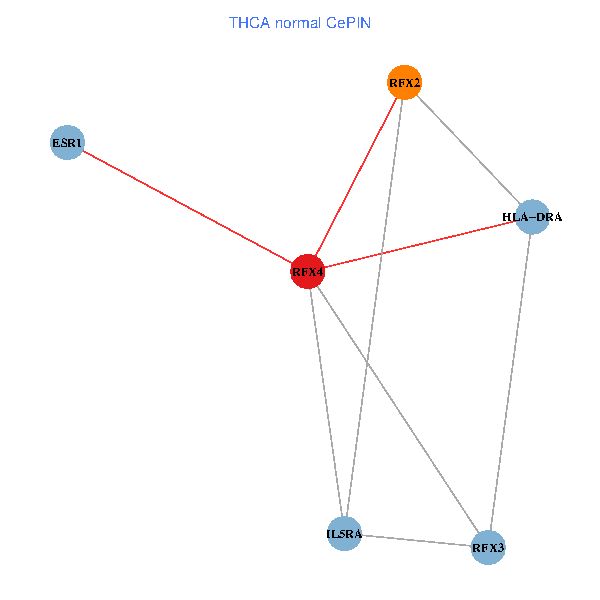
| Co-expressed gene networks based on protein-protein interaction data (CePIN) (TCGA IlluminaHiSeq_RNASeqV2, pan-cancer normalized log2(norm_counts+1) data, version 2016-08-16) (PINA2 ppi data) |
| BRCA (tumor) | BRCA (normal) |
| RFX4, ESR1, RFX3, RFX2, HLA-DRA, IL5RA (tumor) | RFX4, ESR1, RFX3, RFX2, HLA-DRA, IL5RA (normal) |
 |  |
| COAD (tumor) | COAD (normal) |
| RFX4, ESR1, RFX3, RFX2, HLA-DRA, IL5RA (tumor) | RFX4, ESR1, RFX3, RFX2, HLA-DRA, IL5RA (normal) |
 |  |
| HNSC (tumor) | HNSC (normal) |
| RFX4, ESR1, RFX3, RFX2, HLA-DRA, IL5RA (tumor) | RFX4, ESR1, RFX3, RFX2, HLA-DRA, IL5RA (normal) |
 |  |
| KICH (tumor) | KICH (normal) |
| RFX4, ESR1, RFX3, RFX2, HLA-DRA, IL5RA (tumor) | RFX4, ESR1, RFX3, RFX2, HLA-DRA, IL5RA (normal) |
 |  |
| KIRC (tumor) | KIRC (normal) |
| RFX4, ESR1, RFX3, RFX2, HLA-DRA, IL5RA (tumor) | RFX4, ESR1, RFX3, RFX2, HLA-DRA, IL5RA (normal) |
 |  |
| KIRP (tumor) | KIRP (normal) |
| RFX4, ESR1, RFX3, RFX2, HLA-DRA, IL5RA (tumor) | RFX4, ESR1, RFX3, RFX2, HLA-DRA, IL5RA (normal) |
 |  |
| LIHC (tumor) | LIHC (normal) |
| RFX4, ESR1, RFX3, RFX2, HLA-DRA, IL5RA (tumor) | RFX4, ESR1, RFX3, RFX2, HLA-DRA, IL5RA (normal) |
 |  |
| LUAD (tumor) | LUAD (normal) |
| RFX4, ESR1, RFX3, RFX2, HLA-DRA, IL5RA (tumor) | RFX4, ESR1, RFX3, RFX2, HLA-DRA, IL5RA (normal) |
 |  |
| LUSC (tumor) | LUSC (normal) |
| RFX4, ESR1, RFX3, RFX2, HLA-DRA, IL5RA (tumor) | RFX4, ESR1, RFX3, RFX2, HLA-DRA, IL5RA (normal) |
 |  |
| PRAD (tumor) | PRAD (normal) |
| RFX4, ESR1, RFX3, RFX2, HLA-DRA, IL5RA (tumor) | RFX4, ESR1, RFX3, RFX2, HLA-DRA, IL5RA (normal) |
 |  |
| STAD (tumor) | STAD (normal) |
| RFX4, ESR1, RFX3, RFX2, HLA-DRA, IL5RA (tumor) | RFX4, ESR1, RFX3, RFX2, HLA-DRA, IL5RA (normal) |
 |  |
| THCA (tumor) | THCA (normal) |
| RFX4, ESR1, RFX3, RFX2, HLA-DRA, IL5RA (tumor) | RFX4, ESR1, RFX3, RFX2, HLA-DRA, IL5RA (normal) |
 |  |
| Top |
| TissGeneProg for RFX4 |
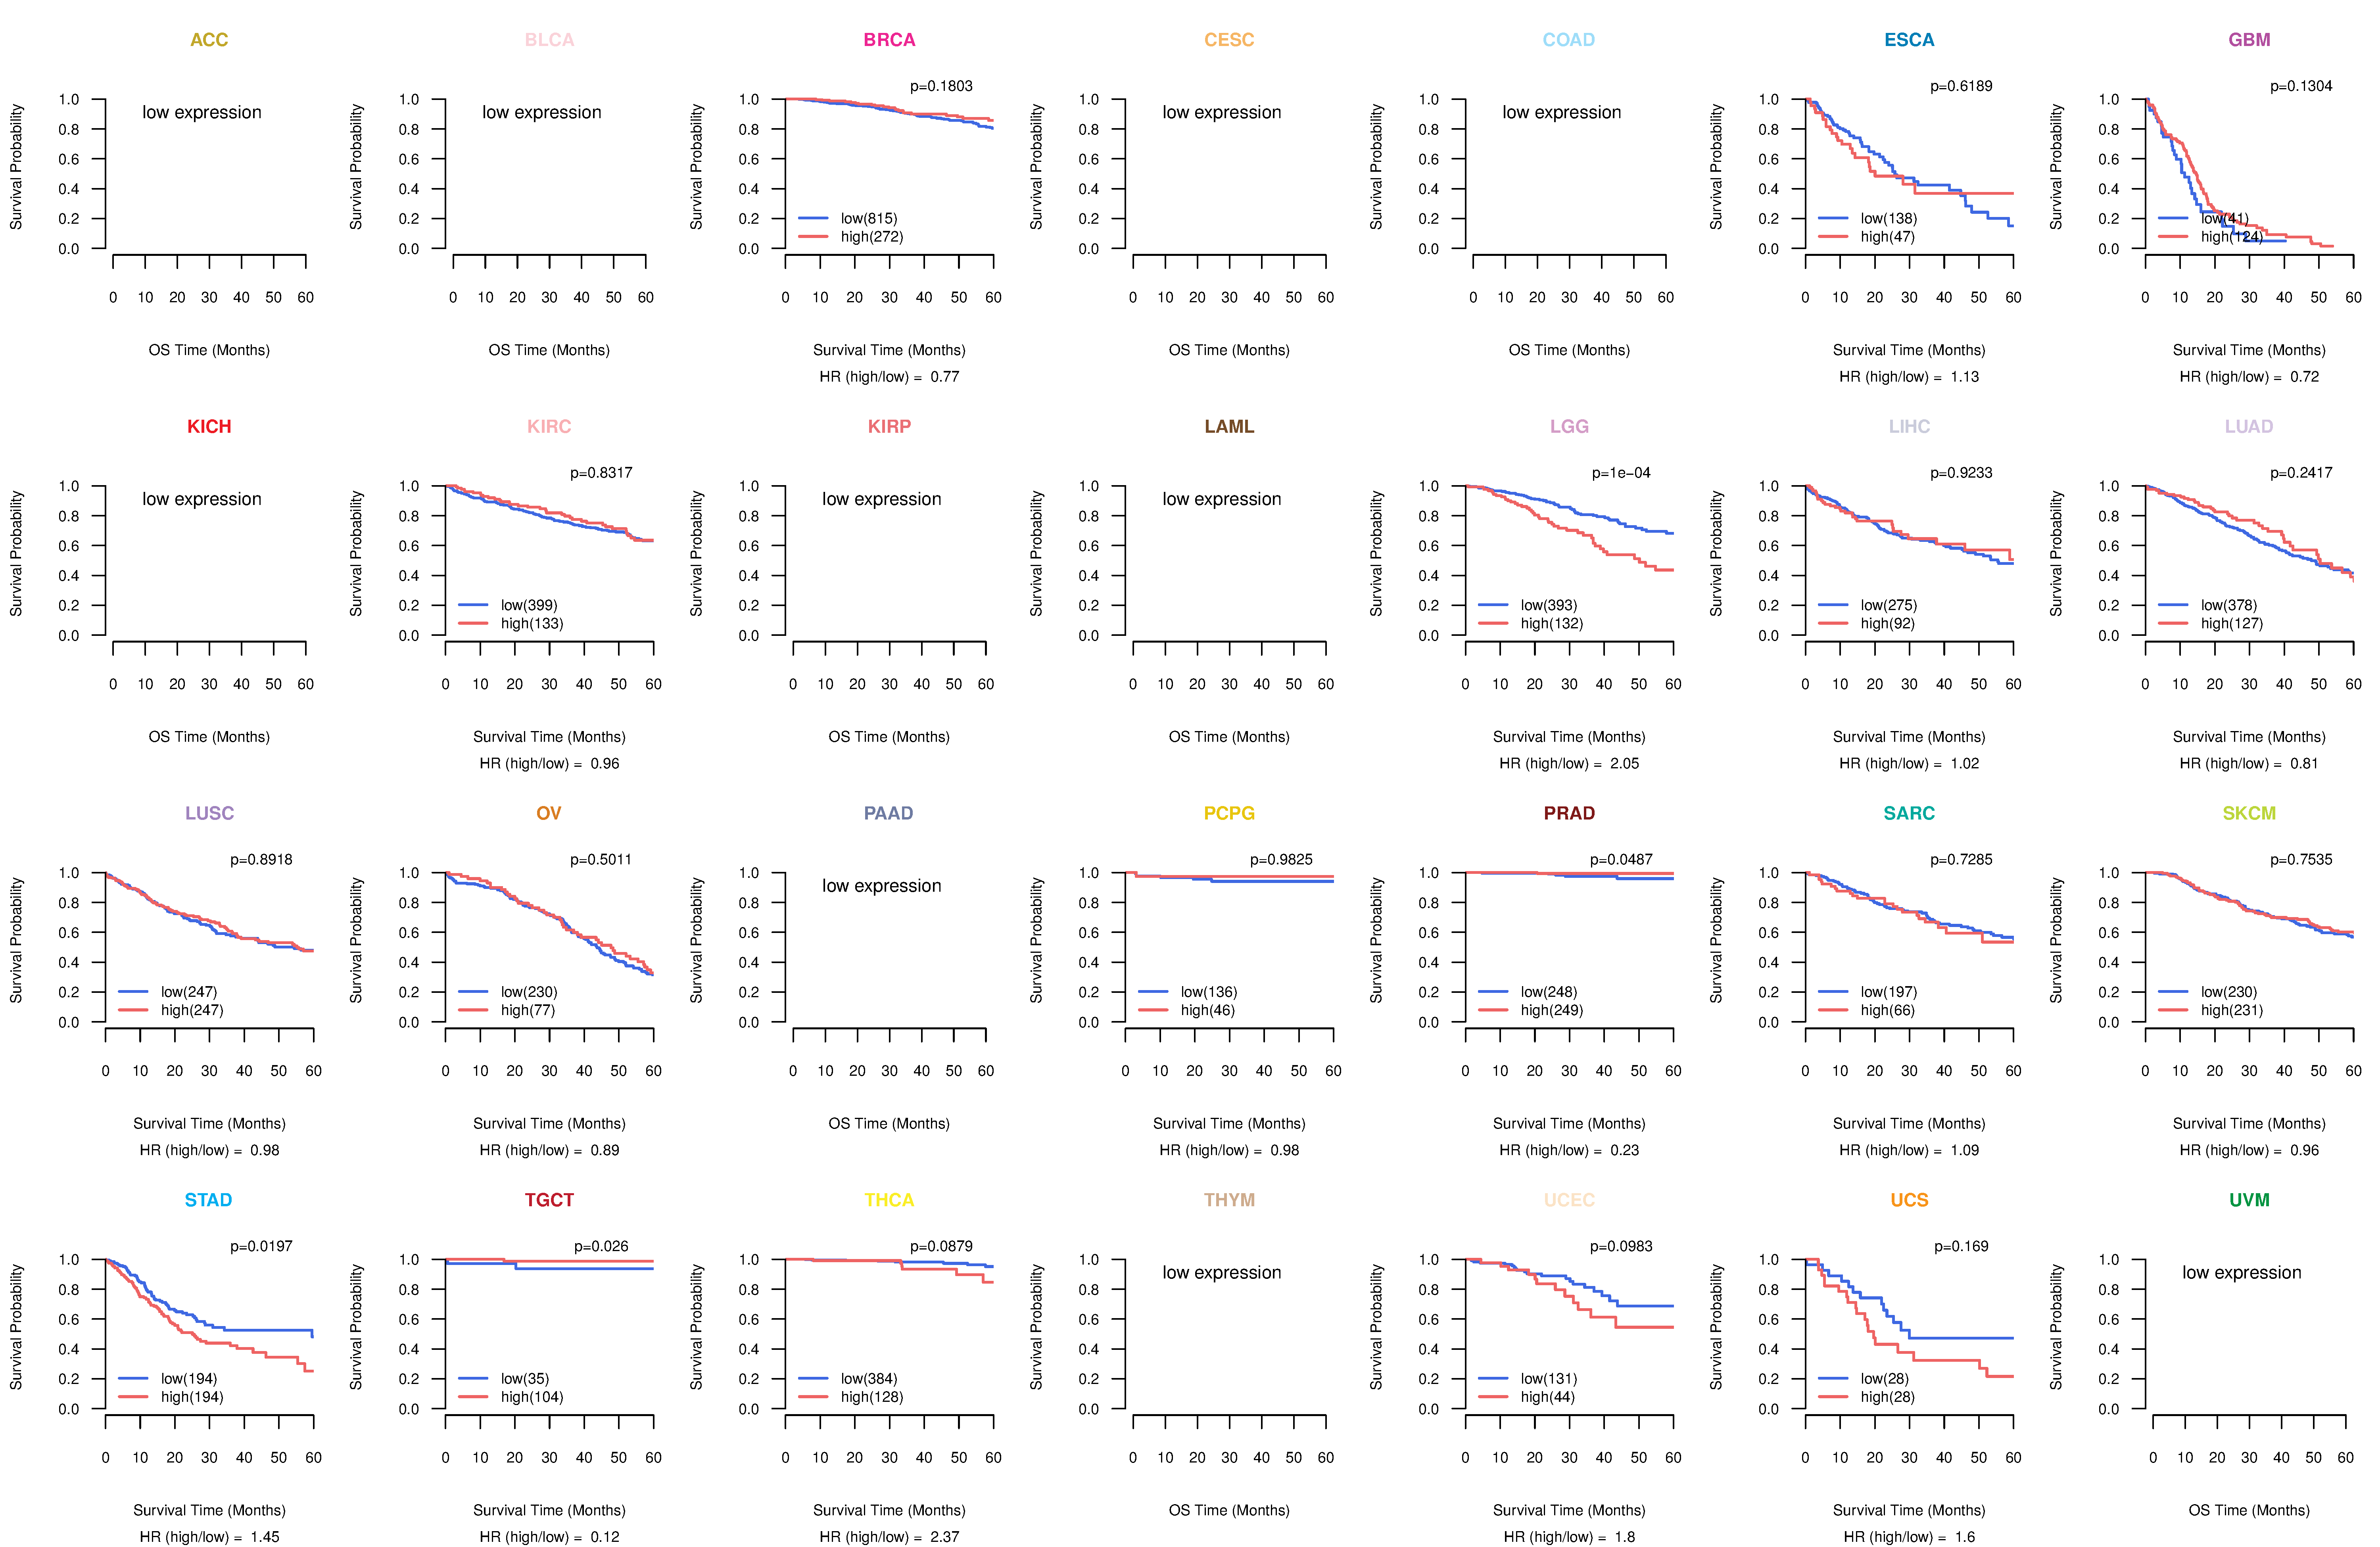
| Kaplan-Meier plots with logrank tests of overall survival (OS) using 28 cancer types (TCGA IlluminaHiSeq_RNASeqV2, pan-cancer normalized log2(norm_counts+1) data, version 2016-08-16) (TCGA clinicalMatrix, phenotype data, version 2016-04-27) * Click on the image to enlarge it in a new window. |
 |
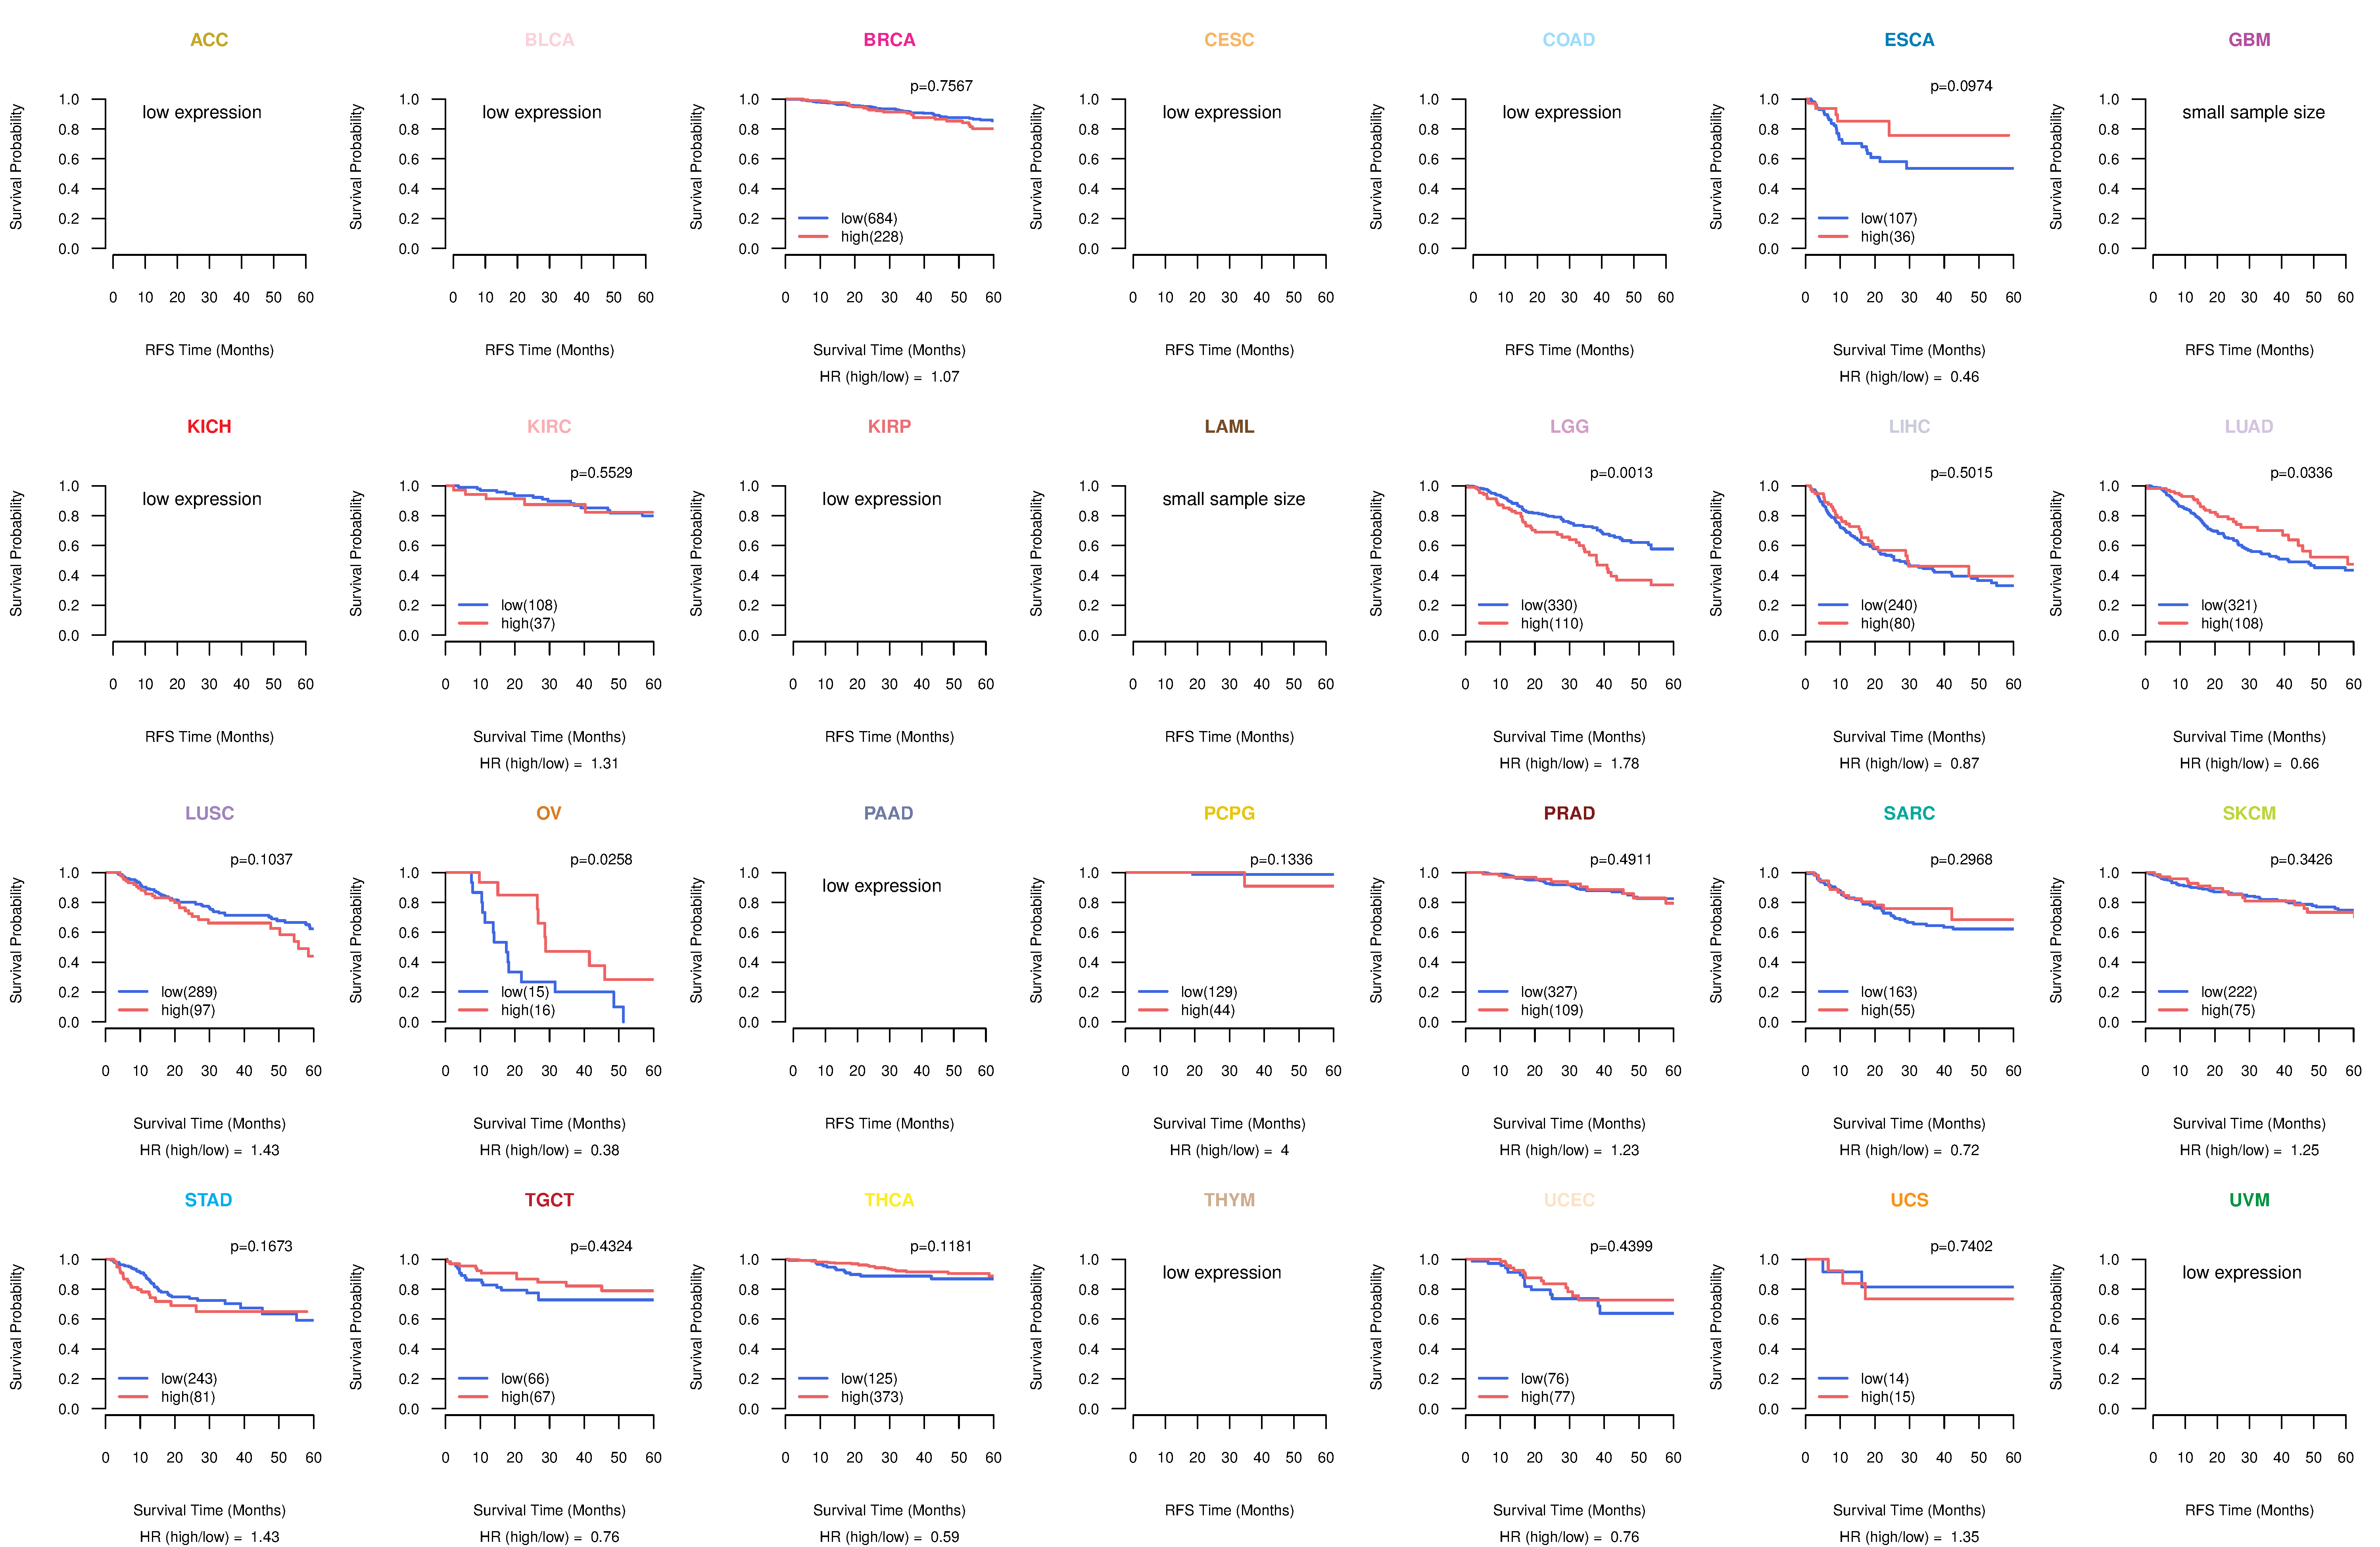
| Kaplan-Meier plots with logrank test of relapse free survival (RFS) using 28 cancer types (TCGA IlluminaHiSeq_RNASeqV2, pan-cancer normalized log2(norm_counts+1) data, version 2016-08-16) (TCGA clinicalMatrix, phenotype data, version 2016-04-27) * Click on the image enlarge it in a new window. |
 |
| Forest plot of Cox proportional hazard ratio (HR) and 95% CI of overall survival (OS) using 28 cancer types (TCGA IlluminaHiSeq_RNASeqV2, pan-cancer normalized log2(norm_counts+1) data, version 2016-08-16) (TCGA clinicalMatrix, phenotype data, version 2016-04-27) * Click on the image enlarge it in a new window. |
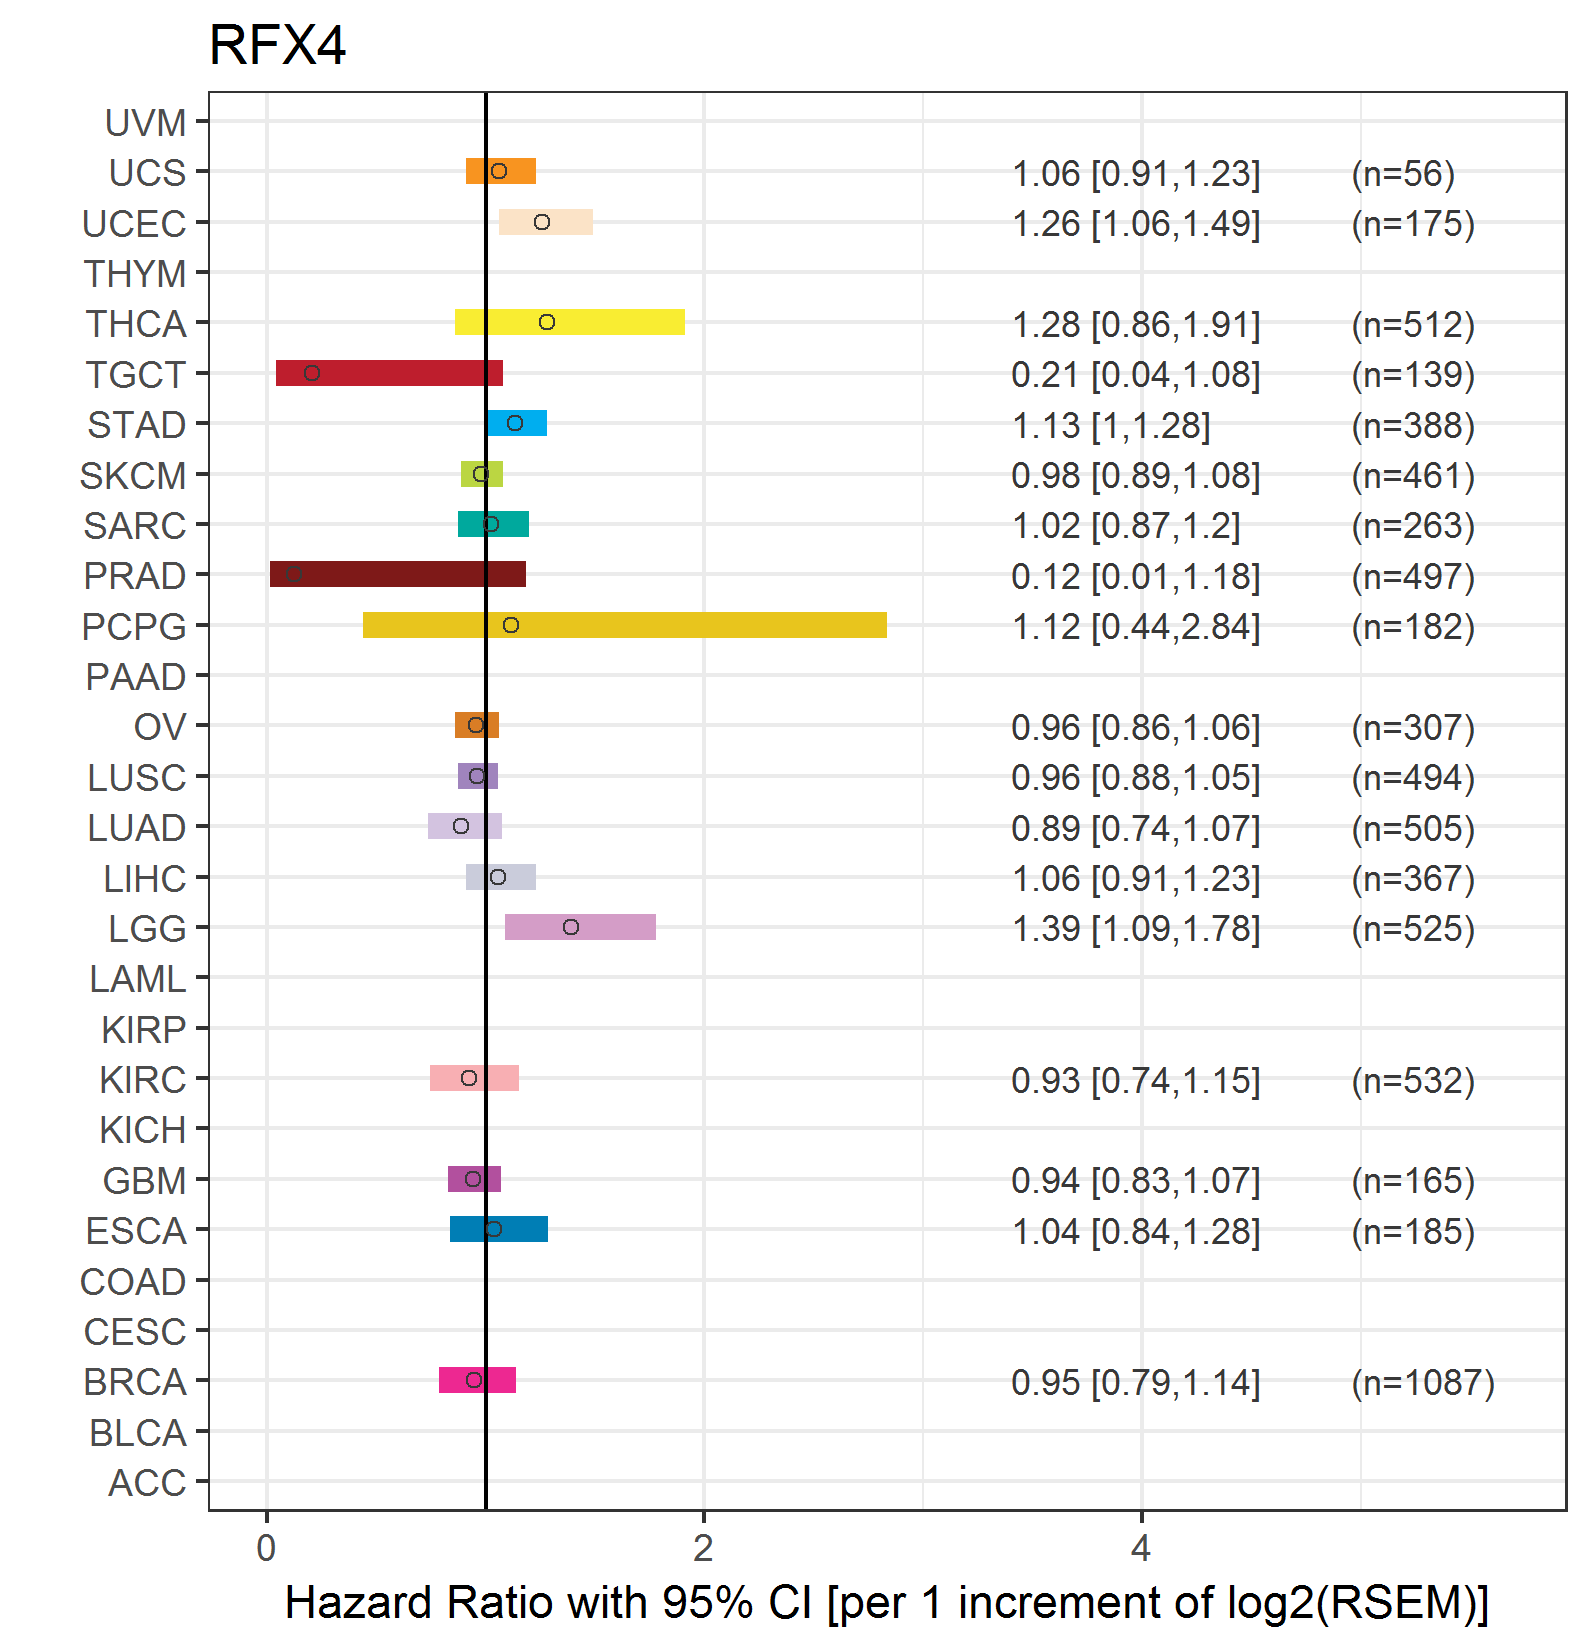 |
| Forest plot of Cox proportional hazard ratio (HR) and 95% CI of relapse free survival (RFS) using 28 cancer types (TCGA IlluminaHiSeq_RNASeqV2, pan-cancer normalized log2(norm_counts+1) data, version 2016-08-16) (TCGA clinicalMatrix, phenotype data, version 2016-04-27) * Click on the image enlarge it in a new window. |
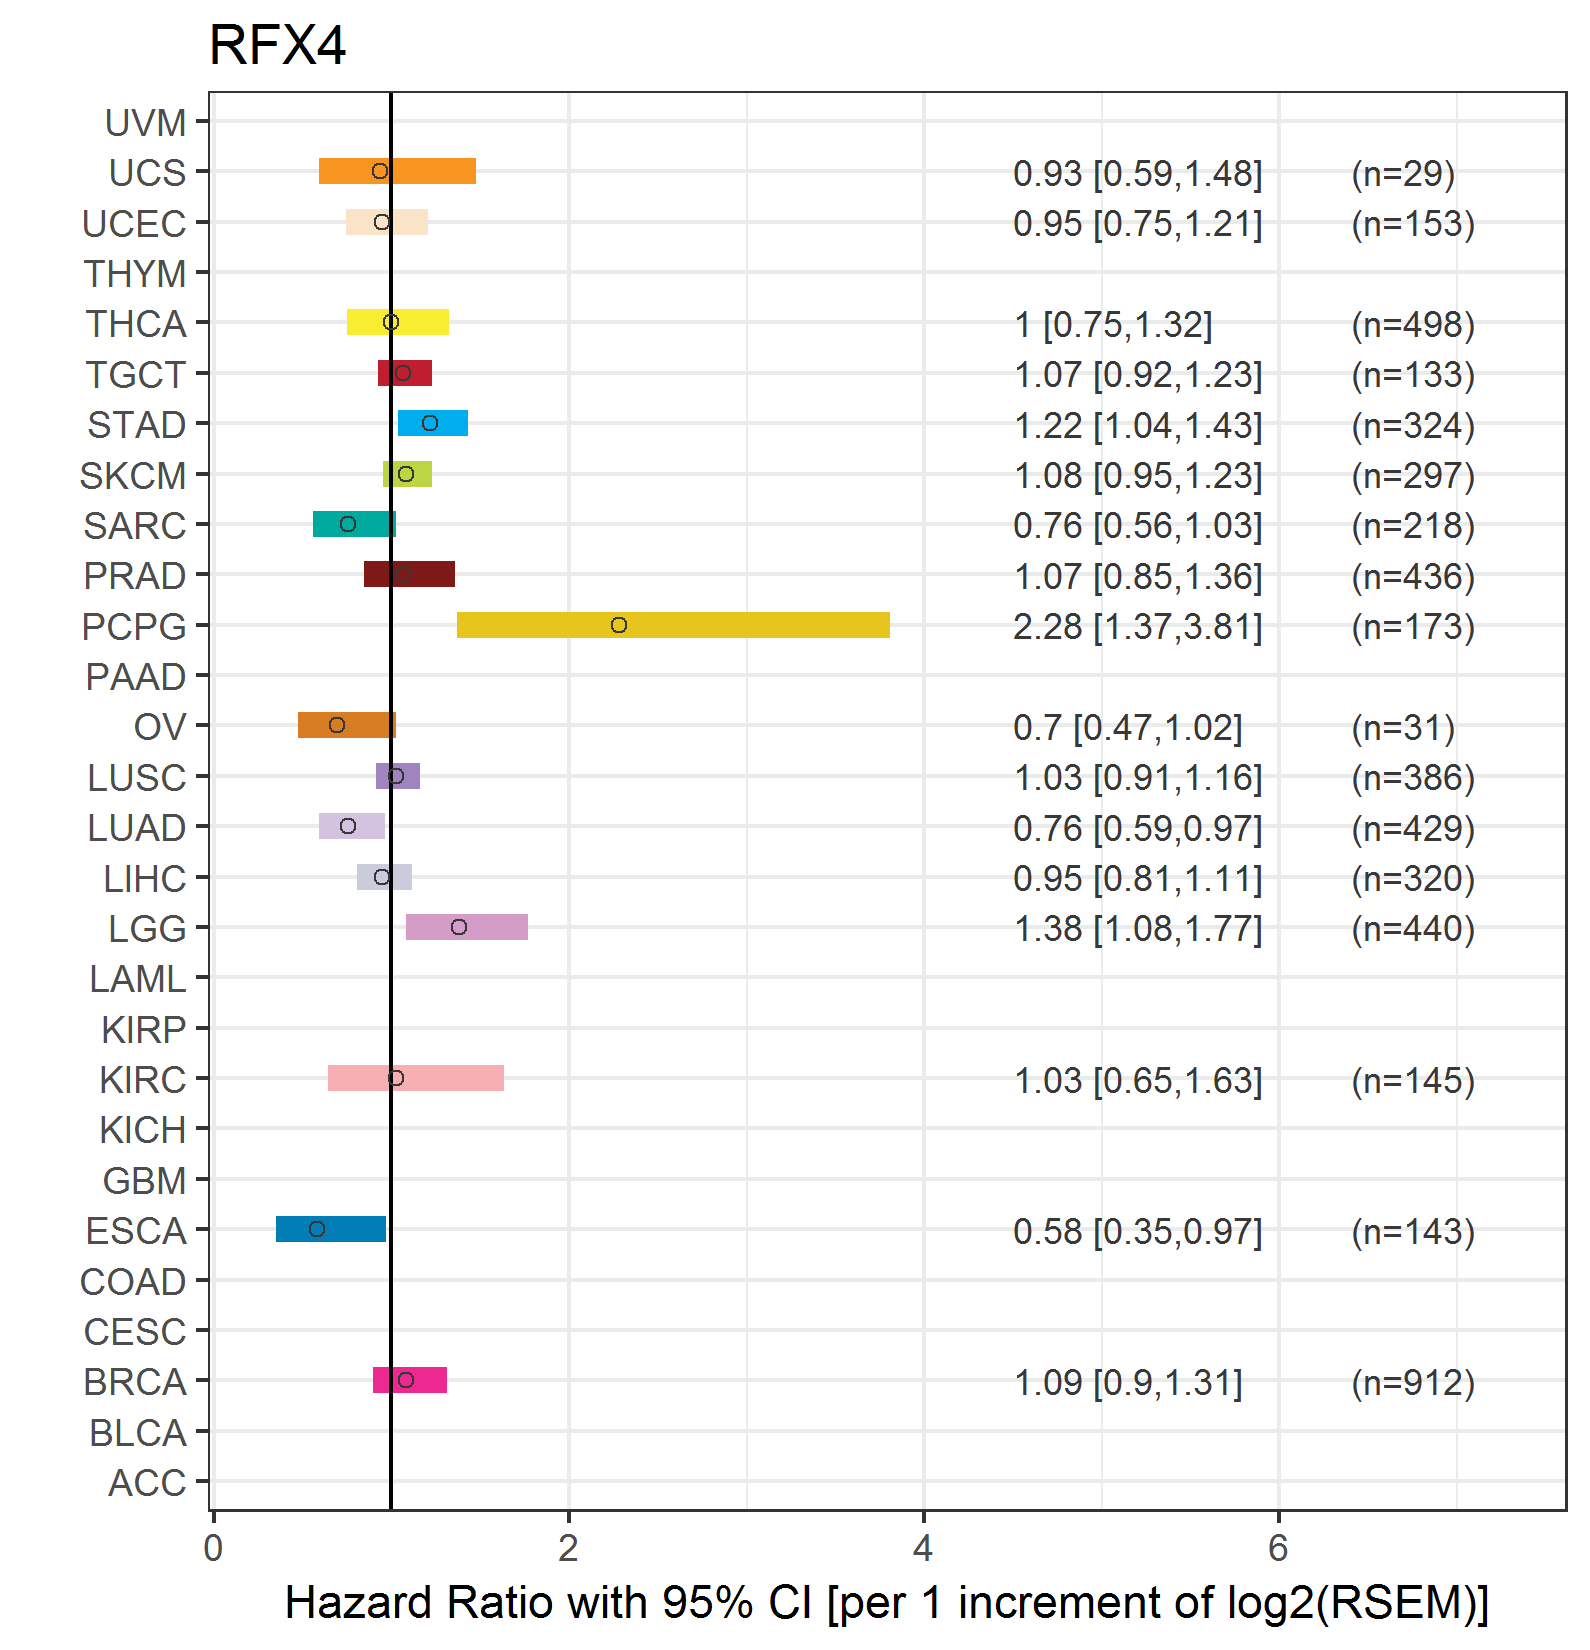 |
| Top |
| TissGeneClin for RFX4 |
| TissGeneDrug for RFX4 |
| Drug information targeting TissGene (DrugBank Version 5.0.6, 2017-04-01) |
| DrugBank ID | Drug name | Drug activity | Drug type | Drug status |
| Top |
| TissGeneDisease for RFX4 |
| Disease information associated with TissGene (DisGeNet, 2016-06-01) |
| Disease ID | Disease name | # pubmeds | Source |
| umls:C0005586 | Bipolar Disorder | 3 | BeFree,GAD,LHGDN |
| umls:C0001973 | Alcoholic Intoxication, Chronic | 1 | BeFree |
|
Copyright 2016-Present - The University of Texas Health Science Center at Houston (UTHealth) Web File Viewing | How to Report, Fraud, Waste and Abuse | State of Texas | Statewide Search | Texas Homeland Security | Site Policies |