 |
| |
| |
| |
| |
| |
| |
|

| TissGeneSummary for RGS16 |
 Gene summary Gene summary |
| Basic gene information | Gene symbol | RGS16 |
| Gene name | regulator of G-protein signaling 16 | |
| Synonyms | A28-RGS14|A28-RGS14P|RGS-R | |
| Cytomap | UCSC genome browser: 1q25-q31 | |
| Type of gene | protein-coding | |
| RefGenes | NM_002928.3, | |
| Description | hRGS-rregulator of G-protein signalling 16retinal-specific RGSretinally abundant regulator of G-protein signaling | |
| Modification date | 20141207 | |
| dbXrefs | MIM : 602514 | |
| HGNC : HGNC | ||
| Ensembl : ENSG00000143333 | ||
| HPRD : 03945 | ||
| Vega : OTTHUMG00000035212 | ||
| Protein | UniProt: go to UniProt's Cross Reference DB Table | |
| Expression | CleanEX: HS_RGS16 | |
| BioGPS: 6004 | ||
| Pathway | NCI Pathway Interaction Database: RGS16 | |
| KEGG: RGS16 | ||
| REACTOME: RGS16 | ||
| Pathway Commons: RGS16 | ||
| Context | iHOP: RGS16 | |
| ligand binding site mutation search in PubMed: RGS16 | ||
| UCL Cancer Institute: RGS16 | ||
| Assigned class in TissGDB* | C | |
| Included tissue-specific gene expression resources | HPA,GTEx | |
| Specific-tissues in normal samples (assigned by TissGDB using HPA, TiGER, and GTEx) | Thyroid gland | |
| Cancer types related to the specific-tissues in cancer samples (assigned by TissGDB using TCGA) | THCA | |
| Reference showing the relevant tissue of RGS16 | ||
| Description by TissGene annotations | Risk TissGene in OS Cancer gene | |
| * Class A consists of genes with literature evidence and is part of the cTissGenes. Class B consists of only cTissGenes without additional evidence. The remaining genes belong to Class C. |
| Gene ontology having evidence of Inferred from Direct Assay (IDA) from Entrez |
| GO ID | GO term | PubMed ID |
| Top |
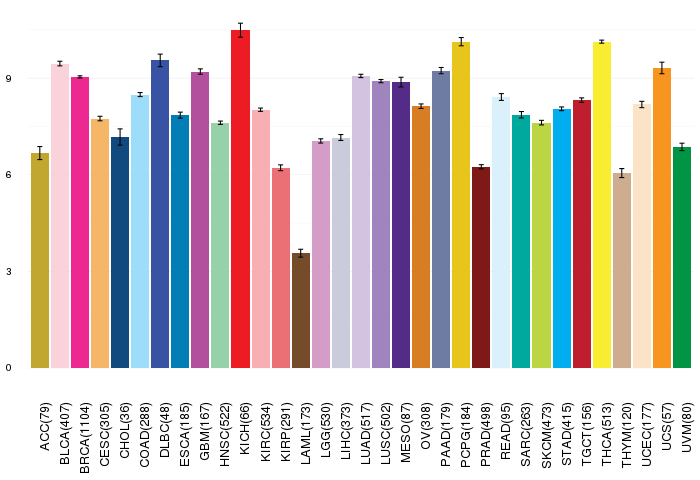
| TissGeneExp for RGS16 |
| Gene expressions across 28 cancer types (X-axis: cancer type and Y-axis: log2(norm_counts+1)) (TCGA IlluminaHiSeq_RNASeqV2, pan-cancer normalized log2(norm_counts+1) data, version 2016-08-16) |
 |
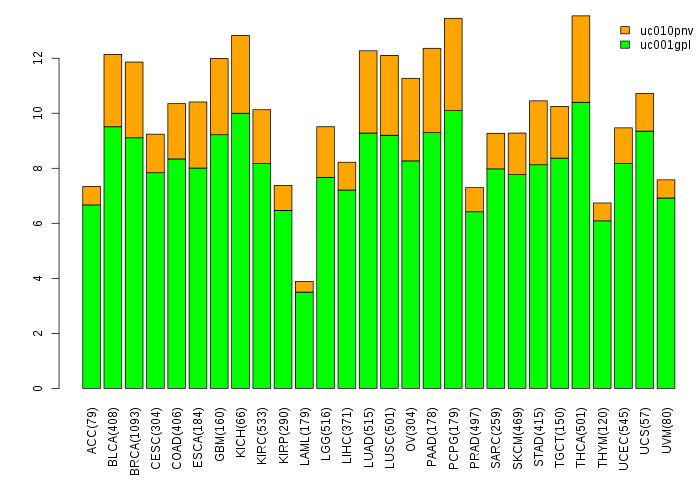
| Gene isoform expressions across 28 cancer types (X-axis: cancer type and Y-axis: log2(norm_counts+1)) (TCGA pan-cancer tcga_rsem_isoform_tpm, version 2016-09-01) |
 |
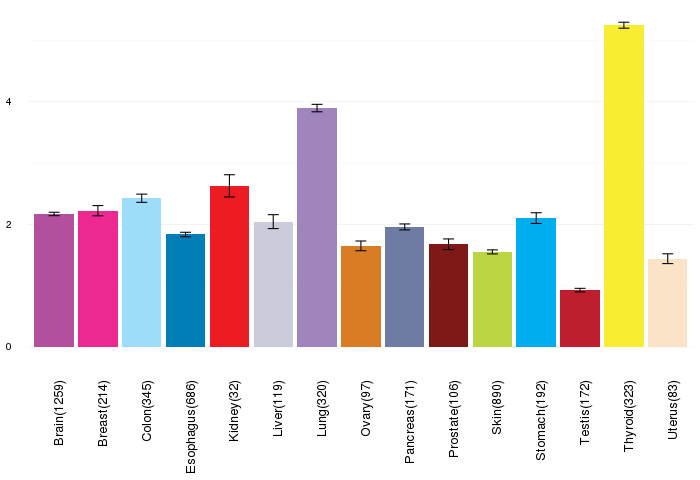
| Gene expressions across normal tissues of GTEx data (GTEx GTEx_Analysis_v6_RNA-seq_RNA-SeQCv1.1.8_gene_rpkm.gct) - Here, we shows the matched tissue types only among our 28 cancer types. |
 |
| Different expressions across 14 cancer types with more than 10 samples between matched tumors and normals (X-axis: cancer type and Y-axis: log2(norm_counts+1)) (TCGA IlluminaHiSeq_RNASeqV2, pan-cancer normalized log2(norm_counts+1) data, version 2016-08-16) |
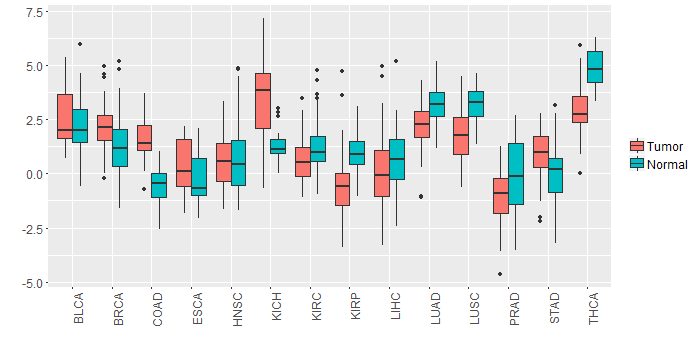 |
| - Significantly differentially expressed cancer types and information. (|Fold change|>1 and FDR<0.05) |
| Cancer type | Mean(exp) in tumor | Mean(exp) in matched normal | Log2FC | P-val. | FDR |
| LUSC | 1.925401325 | 3.25971309 | -1.334311765 | 2.38E-08 | 7.18E-08 |
| KICH | 3.343823443 | 1.335263443 | 2.00856 | 2.22E-05 | 6.56E-05 |
| THCA | 2.967270019 | 4.840864934 | -1.873594915 | 1.93E-17 | 3.96E-16 |
| COAD | 1.506164674 | -0.549608403 | 2.055773077 | 1.57E-10 | 2.11E-09 |
| KIRP | -0.491173307 | 1.007995443 | -1.49916875 | 0.000131 | 0.000433829 |
| Top |
| TissGene-miRNA for RGS16 |
| Significantly anti-correlated miRNAs of TissGene across 28 cancer types (Gene-miRNA relations from TargetScanHuman Relsease 7.1, Conserved_Site_Context_Scores.txt.zip, 06.01.2016) (TCGA IlluminaHiSeq_miRNASeq, log2(RPM+1) data, version 2016-11-21) (TCGA IlluminaHiSeq_RNASeqV2, log2(normalized_count+1) data, version 2016-08-16) (Spearman’s Rank Correlation (p-value<0.05 and coefficient<-0.25)) |
| Cancer type | miRNA id | miRNA accession | P-val. | Coeff. | # samples |
| Top |
| TissGeneMut for RGS16 |
| TissGeneSNV for RGS16 |
| nsSNV counts per each loci. Different colors of circles represent different cancer types. Circle size denotes number of samples. (TCGA somatic mutation (SNPs and small INDELs) data, version 2016-04-25) * Click on the image to enlarge it in a new window. |
 |
 |
| Somatic nucleotide variants of TissGene across 28 cancer types (X-axis: cancer type and Y-axis: % of mutated samples) The numbers in parentheses are numbers of samples with mutation (nsSNVs). (TCGA somatic mutation (SNPs and small INDELs) data, version 2016-04-25) |
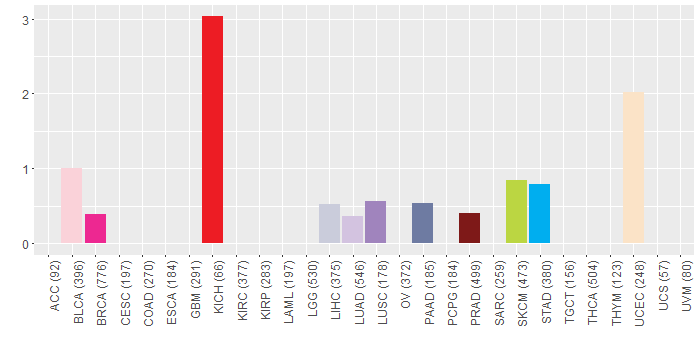 |
| - nsSNVs sorted by frequency. |
| AAchange | Cancer type | # samples |
| p.R22H | LIHC | 1 |
| p.W95* | LUAD | 1 |
| p.L162Q | LIHC | 1 |
| p.M142I | HNSC | 1 |
| p.S174L | UCEC | 1 |
| p.K41R | STAD | 1 |
| p.E129K | BLCA | 1 |
| p.S30L | BLCA | 1 |
| p.P169S | BRCA | 1 |
| p.S65W | PRAD | 1 |
| p.T140M | STAD | 1 |
| p.E198K | SKCM | 1 |
| p.S88N | KICH | 1 |
| p.I132V | LUAD | 1 |
| p.A149S | UCEC | 1 |
| p.A155V | UCEC | 1 |
| p.G24V | BLCA | 1 |
| p.R178W | BRCA | 1 |
| p.T140M | PRAD | 1 |
| p.F19L | KICH | 1 |
| p.A97T | UCEC | 1 |
| p.E129X | SKCM | 1 |
| p.L60P | STAD | 1 |
| p.A16V | LUSC | 1 |
| p.A154V | PAAD | 1 |
| p.T39I | UCEC | 1 |
| p.S174L | SKCM | 1 |
| p.F19L | BRCA | 1 |
| p.A154V | BLCA | 1 |
| p.P127L | SKCM | 1 |
| p.E129* | SKCM | 1 |
| Top |
| TissGeneCNV for RGS16 |
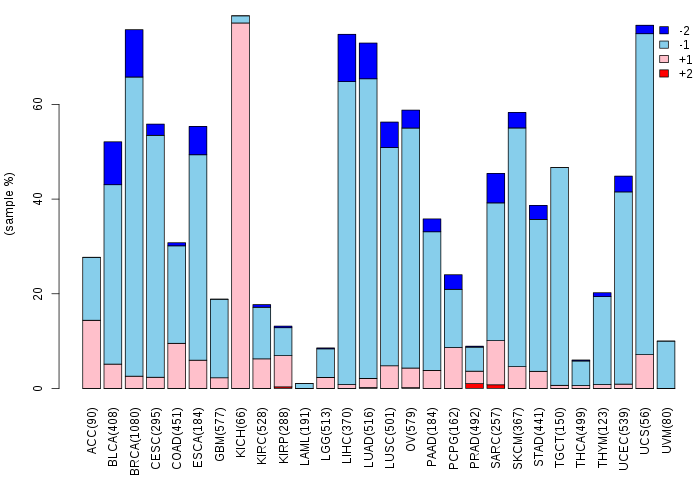
| Copy number variations of TissGene across 28 cancer types (X-axis: cancer type and Y-axis: % of CNV samples) (TCGA Gistic2_CopyNumber_Gistic2_all_data_by_genes, Gistic2 copy number data, version 2016-08-16) |
 |
| Top |
| TissGeneFusions for RGS16 |
| Fusion genes including TissGene (ChimerDB 3.0, 2016-12-01 and TCGA fusion Portal 2015-12-01) |
| Database | Src | Cancer type | Sample | Fusion gene | ORF | 5'-gene BP | 3'-gene BP |
| Top |
| TissGeneNet for RGS16 |
| Co-expressed gene networks based on protein-protein interaction data (CePIN) (TCGA IlluminaHiSeq_RNASeqV2, pan-cancer normalized log2(norm_counts+1) data, version 2016-08-16) (PINA2 ppi data) |
| BRCA (tumor) | BRCA (normal) |
| RGS16, SCN9A, SRC, GNAQ, LYN, EGFR, GNAI2, CSK, GNAO1, GNAI1, GNAI3, CREB3L2, GNA13, GDE1, ST14, GNAT1 (tumor) | RGS16, SCN9A, SRC, GNAQ, LYN, EGFR, GNAI2, CSK, GNAO1, GNAI1, GNAI3, CREB3L2, GNA13, GDE1, ST14, GNAT1 (normal) |
 |  |
| COAD (tumor) | COAD (normal) |
| RGS16, SCN9A, SRC, GNAQ, LYN, EGFR, GNAI2, CSK, GNAO1, GNAI1, GNAI3, CREB3L2, GNA13, GDE1, ST14, GNAT1 (tumor) | RGS16, SCN9A, SRC, GNAQ, LYN, EGFR, GNAI2, CSK, GNAO1, GNAI1, GNAI3, CREB3L2, GNA13, GDE1, ST14, GNAT1 (normal) |
 |  |
| HNSC (tumor) | HNSC (normal) |
| RGS16, SCN9A, SRC, GNAQ, LYN, EGFR, GNAI2, CSK, GNAO1, GNAI1, GNAI3, CREB3L2, GNA13, GDE1, ST14, GNAT1 (tumor) | RGS16, SCN9A, SRC, GNAQ, LYN, EGFR, GNAI2, CSK, GNAO1, GNAI1, GNAI3, CREB3L2, GNA13, GDE1, ST14, GNAT1 (normal) |
 |  |
| KICH (tumor) | KICH (normal) |
| RGS16, SCN9A, SRC, GNAQ, LYN, EGFR, GNAI2, CSK, GNAO1, GNAI1, GNAI3, CREB3L2, GNA13, GDE1, ST14, GNAT1 (tumor) | RGS16, SCN9A, SRC, GNAQ, LYN, EGFR, GNAI2, CSK, GNAO1, GNAI1, GNAI3, CREB3L2, GNA13, GDE1, ST14, GNAT1 (normal) |
 |  |
| KIRC (tumor) | KIRC (normal) |
| RGS16, SCN9A, SRC, GNAQ, LYN, EGFR, GNAI2, CSK, GNAO1, GNAI1, GNAI3, CREB3L2, GNA13, GDE1, ST14, GNAT1 (tumor) | RGS16, SCN9A, SRC, GNAQ, LYN, EGFR, GNAI2, CSK, GNAO1, GNAI1, GNAI3, CREB3L2, GNA13, GDE1, ST14, GNAT1 (normal) |
 |  |
| KIRP (tumor) | KIRP (normal) |
| RGS16, SCN9A, SRC, GNAQ, LYN, EGFR, GNAI2, CSK, GNAO1, GNAI1, GNAI3, CREB3L2, GNA13, GDE1, ST14, GNAT1 (tumor) | RGS16, SCN9A, SRC, GNAQ, LYN, EGFR, GNAI2, CSK, GNAO1, GNAI1, GNAI3, CREB3L2, GNA13, GDE1, ST14, GNAT1 (normal) |
 |  |
| LIHC (tumor) | LIHC (normal) |
| RGS16, SCN9A, SRC, GNAQ, LYN, EGFR, GNAI2, CSK, GNAO1, GNAI1, GNAI3, CREB3L2, GNA13, GDE1, ST14, GNAT1 (tumor) | RGS16, SCN9A, SRC, GNAQ, LYN, EGFR, GNAI2, CSK, GNAO1, GNAI1, GNAI3, CREB3L2, GNA13, GDE1, ST14, GNAT1 (normal) |
 |  |
| LUAD (tumor) | LUAD (normal) |
| RGS16, SCN9A, SRC, GNAQ, LYN, EGFR, GNAI2, CSK, GNAO1, GNAI1, GNAI3, CREB3L2, GNA13, GDE1, ST14, GNAT1 (tumor) | RGS16, SCN9A, SRC, GNAQ, LYN, EGFR, GNAI2, CSK, GNAO1, GNAI1, GNAI3, CREB3L2, GNA13, GDE1, ST14, GNAT1 (normal) |
 |  |
| LUSC (tumor) | LUSC (normal) |
| RGS16, SCN9A, SRC, GNAQ, LYN, EGFR, GNAI2, CSK, GNAO1, GNAI1, GNAI3, CREB3L2, GNA13, GDE1, ST14, GNAT1 (tumor) | RGS16, SCN9A, SRC, GNAQ, LYN, EGFR, GNAI2, CSK, GNAO1, GNAI1, GNAI3, CREB3L2, GNA13, GDE1, ST14, GNAT1 (normal) |
 |  |
| PRAD (tumor) | PRAD (normal) |
| RGS16, SCN9A, SRC, GNAQ, LYN, EGFR, GNAI2, CSK, GNAO1, GNAI1, GNAI3, CREB3L2, GNA13, GDE1, ST14, GNAT1 (tumor) | RGS16, SCN9A, SRC, GNAQ, LYN, EGFR, GNAI2, CSK, GNAO1, GNAI1, GNAI3, CREB3L2, GNA13, GDE1, ST14, GNAT1 (normal) |
 |  |
| STAD (tumor) | STAD (normal) |
| RGS16, SCN9A, SRC, GNAQ, LYN, EGFR, GNAI2, CSK, GNAO1, GNAI1, GNAI3, CREB3L2, GNA13, GDE1, ST14, GNAT1 (tumor) | RGS16, SCN9A, SRC, GNAQ, LYN, EGFR, GNAI2, CSK, GNAO1, GNAI1, GNAI3, CREB3L2, GNA13, GDE1, ST14, GNAT1 (normal) |
 |  |
| THCA (tumor) | THCA (normal) |
| RGS16, SCN9A, SRC, GNAQ, LYN, EGFR, GNAI2, CSK, GNAO1, GNAI1, GNAI3, CREB3L2, GNA13, GDE1, ST14, GNAT1 (tumor) | RGS16, SCN9A, SRC, GNAQ, LYN, EGFR, GNAI2, CSK, GNAO1, GNAI1, GNAI3, CREB3L2, GNA13, GDE1, ST14, GNAT1 (normal) |
 |  |
| Top |
| TissGeneProg for RGS16 |
| Kaplan-Meier plots with logrank tests of overall survival (OS) using 28 cancer types (TCGA IlluminaHiSeq_RNASeqV2, pan-cancer normalized log2(norm_counts+1) data, version 2016-08-16) (TCGA clinicalMatrix, phenotype data, version 2016-04-27) * Click on the image to enlarge it in a new window. |
 |
| Kaplan-Meier plots with logrank test of relapse free survival (RFS) using 28 cancer types (TCGA IlluminaHiSeq_RNASeqV2, pan-cancer normalized log2(norm_counts+1) data, version 2016-08-16) (TCGA clinicalMatrix, phenotype data, version 2016-04-27) * Click on the image enlarge it in a new window. |
 |
| Forest plot of Cox proportional hazard ratio (HR) and 95% CI of overall survival (OS) using 28 cancer types (TCGA IlluminaHiSeq_RNASeqV2, pan-cancer normalized log2(norm_counts+1) data, version 2016-08-16) (TCGA clinicalMatrix, phenotype data, version 2016-04-27) * Click on the image enlarge it in a new window. |
 |
| Forest plot of Cox proportional hazard ratio (HR) and 95% CI of relapse free survival (RFS) using 28 cancer types (TCGA IlluminaHiSeq_RNASeqV2, pan-cancer normalized log2(norm_counts+1) data, version 2016-08-16) (TCGA clinicalMatrix, phenotype data, version 2016-04-27) * Click on the image enlarge it in a new window. |
 |
| Top |
| TissGeneClin for RGS16 |
| TissGeneDrug for RGS16 |
| Drug information targeting TissGene (DrugBank Version 5.0.6, 2017-04-01) |
| DrugBank ID | Drug name | Drug activity | Drug type | Drug status |
| Top |
| TissGeneDisease for RGS16 |
| Disease information associated with TissGene (DisGeNet, 2016-06-01) |
| Disease ID | Disease name | # pubmeds | Source |
| umls:C0027627 | Neoplasm Metastasis | 2 | BeFree |
| umls:C0007137 | Squamous cell carcinoma | 1 | GAD |
| umls:C0009402 | Colorectal Carcinoma | 1 | BeFree |
| umls:C0018671 | Head and Neck Neoplasms | 1 | GAD |
| umls:C0027643 | Neoplasm Recurrence, Local | 1 | GAD |
| umls:C0027819 | Neuroblastoma | 1 | BeFree |
| umls:C0036341 | Schizophrenia | 1 | GAD |
| umls:C0085183 | Neoplasms, Second Primary | 1 | GAD |
| umls:C0178874 | Tumor Progression | 1 | BeFree |
| umls:C0235974 | Pancreatic carcinoma | 1 | BeFree |
| umls:C0346647 | Malignant neoplasm of pancreas | 1 | BeFree |
| umls:C0685938 | Malignant neoplasm of gastrointestinal tract | 1 | BeFree |
| umls:C0686619 | Secondary malignant neoplasm of lymph node | 1 | BeFree |
| umls:C0700095 | Central neuroblastoma | 1 | BeFree |
| umls:C1458155 | Mammary Neoplasms | 1 | BeFree |
| umls:C1527249 | Colorectal Cancer | 1 | BeFree |
|
Copyright 2016-Present - The University of Texas Health Science Center at Houston (UTHealth) Web File Viewing | How to Report, Fraud, Waste and Abuse | State of Texas | Statewide Search | Texas Homeland Security | Site Policies |