 |
| |
| |
| |
| |
| |
| |
|

| TissGeneSummary for RHCE |
 Gene summary Gene summary |
| Basic gene information | Gene symbol | RHCE |
| Gene name | ||
| Synonyms | ||
| Cytomap | UCSC genome browser: | |
| Type of gene | ||
| RefGenes | ||
| Description | ||
| Modification date | ||
| dbXrefs | ||
| Protein | UniProt: go to UniProt's Cross Reference DB Table | |
| Expression | CleanEX: HS_RHCE | |
| BioGPS: 6007 | ||
| Pathway | NCI Pathway Interaction Database: RHCE | |
| KEGG: RHCE | ||
| REACTOME: RHCE | ||
| Pathway Commons: RHCE | ||
| Context | iHOP: RHCE | |
| ligand binding site mutation search in PubMed: RHCE | ||
| UCL Cancer Institute: RHCE | ||
| Assigned class in TissGDB* | C | |
| Included tissue-specific gene expression resources | HPA,TiGER | |
| Specific-tissues in normal samples (assigned by TissGDB using HPA, TiGER, and GTEx) | BladderBone marrow | |
| Cancer types related to the specific-tissues in cancer samples (assigned by TissGDB using TCGA) | BLCALAML | |
| Reference showing the relevant tissue of RHCE | ||
| Description by TissGene annotations | ||
| * Class A consists of genes with literature evidence and is part of the cTissGenes. Class B consists of only cTissGenes without additional evidence. The remaining genes belong to Class C. |
| Gene ontology having evidence of Inferred from Direct Assay (IDA) from Entrez |
| GO ID | GO term | PubMed ID |
| Top |
| TissGeneExp for RHCE |
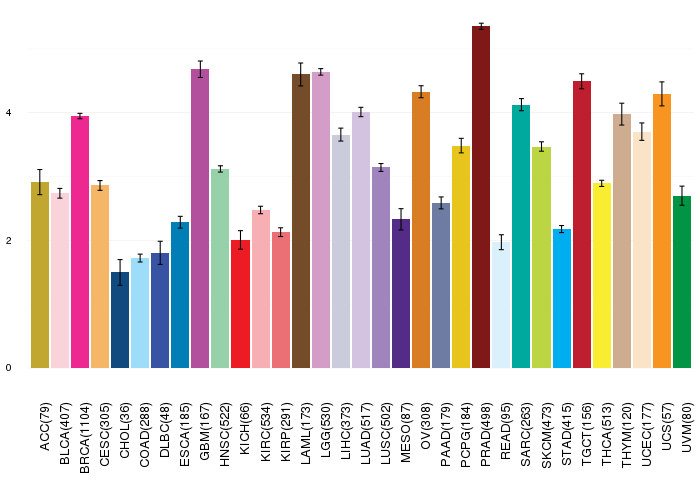
| Gene expressions across 28 cancer types (X-axis: cancer type and Y-axis: log2(norm_counts+1)) (TCGA IlluminaHiSeq_RNASeqV2, pan-cancer normalized log2(norm_counts+1) data, version 2016-08-16) |
 |
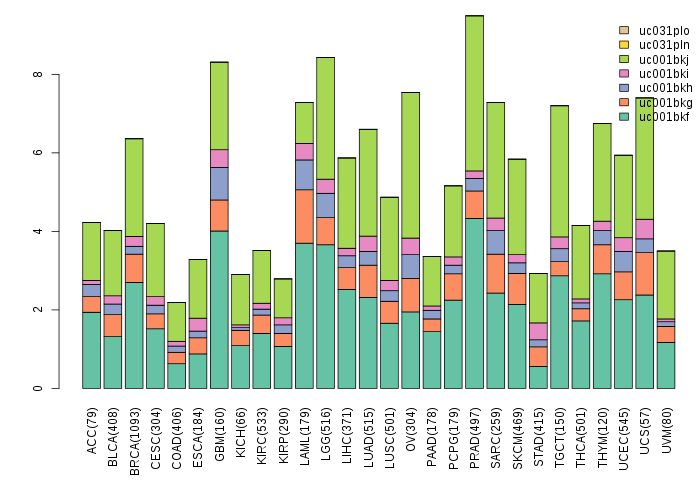
| Gene isoform expressions across 28 cancer types (X-axis: cancer type and Y-axis: log2(norm_counts+1)) (TCGA pan-cancer tcga_rsem_isoform_tpm, version 2016-09-01) |
 |
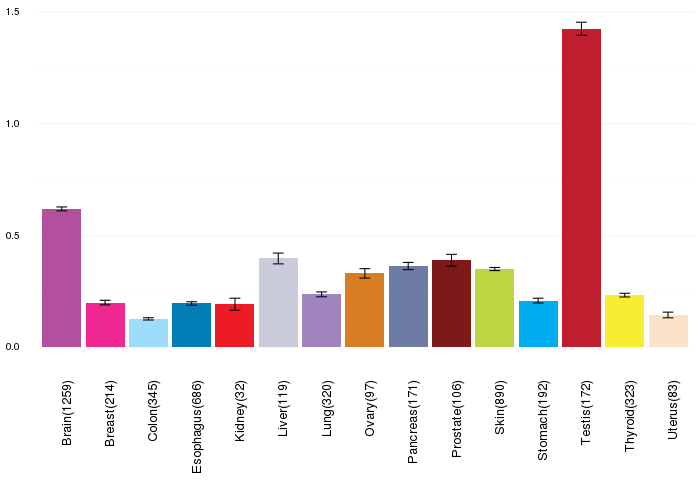
| Gene expressions across normal tissues of GTEx data (GTEx GTEx_Analysis_v6_RNA-seq_RNA-SeQCv1.1.8_gene_rpkm.gct) - Here, we shows the matched tissue types only among our 28 cancer types. |
 |
| Different expressions across 14 cancer types with more than 10 samples between matched tumors and normals (X-axis: cancer type and Y-axis: log2(norm_counts+1)) (TCGA IlluminaHiSeq_RNASeqV2, pan-cancer normalized log2(norm_counts+1) data, version 2016-08-16) |
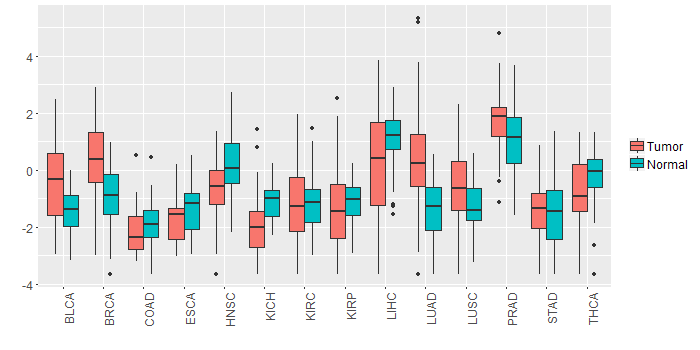 |
| - Significantly differentially expressed cancer types and information. (|Fold change|>1 and FDR<0.05) |
| Cancer type | Mean(exp) in tumor | Mean(exp) in matched normal | Log2FC | P-val. | FDR |
| LUAD | 0.473118412 | -1.314000553 | 1.787118966 | 4.25E-09 | 2.01E-08 |
| BRCA | 0.403167232 | -0.897688031 | 1.300855263 | 2.15E-15 | 1.14E-14 |
| Top |
| TissGene-miRNA for RHCE |
| Significantly anti-correlated miRNAs of TissGene across 28 cancer types (Gene-miRNA relations from TargetScanHuman Relsease 7.1, Conserved_Site_Context_Scores.txt.zip, 06.01.2016) (TCGA IlluminaHiSeq_miRNASeq, log2(RPM+1) data, version 2016-11-21) (TCGA IlluminaHiSeq_RNASeqV2, log2(normalized_count+1) data, version 2016-08-16) (Spearman’s Rank Correlation (p-value<0.05 and coefficient<-0.25)) |
| Cancer type | miRNA id | miRNA accession | P-val. | Coeff. | # samples |
| Top |
| TissGeneMut for RHCE |
| TissGeneSNV for RHCE |
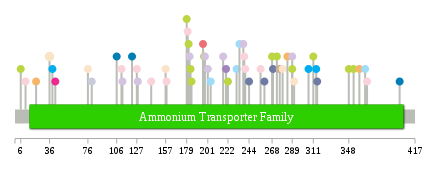
| nsSNV counts per each loci. Different colors of circles represent different cancer types. Circle size denotes number of samples. (TCGA somatic mutation (SNPs and small INDELs) data, version 2016-04-25) * Click on the image to enlarge it in a new window. |
 |
 |
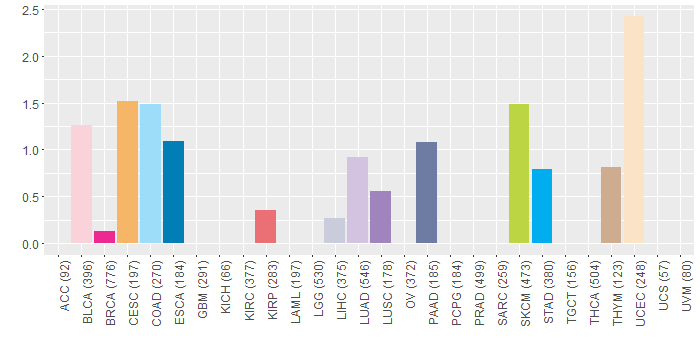
| Somatic nucleotide variants of TissGene across 28 cancer types (X-axis: cancer type and Y-axis: % of mutated samples) The numbers in parentheses are numbers of samples with mutation (nsSNVs). (TCGA somatic mutation (SNPs and small INDELs) data, version 2016-04-25) |
 |
| - nsSNVs sorted by frequency. |
| AAchange | Cancer type | # samples |
| p.A36T | UCEC | 2 |
| p.S158N | BLCA | 1 |
| p.F401L | ESCA | 1 |
| p.V314G | STAD | 1 |
| p.N182S | LUAD | 1 |
| p.V279M | UCEC | 1 |
| p.A127V | BLCA | 1 |
| p.P273S | SKCM | 1 |
| p.E367* | BLCA | 1 |
| p.V311I | SKCM | 1 |
| p.E353K | SKCM | 1 |
| p.D197N | SKCM | 1 |
| p.S238* | LUAD | 1 |
| p.L348F | SKCM | 1 |
| p.V289F | LUAD | 1 |
| p.N80K | LIHC | 1 |
| p.P184S | SKCM | 1 |
| p.P6L | SKCM | 1 |
| p.S76G | UCEC | 1 |
| p.V222I | SKCM | 1 |
| p.S179L | SKCM | 1 |
| p.H22Y | CESC | 1 |
| p.G112C | HNSC | 1 |
| p.S240L | BLCA | 1 |
| p.S122L | ESCA | 1 |
| p.V359M | CESC | 1 |
| p.H260Y | PAAD | 1 |
| p.S289F | SKCM | 1 |
| p.A111V | BLCA | 1 |
| p.I306V | STAD | 1 |
| p.S106L | ESCA | 1 |
| p.W217C | LUAD | 1 |
| p.S268L | SKCM | 1 |
| p.R11H | BLCA | 1 |
| p.E180K | BLCA | 1 |
| p.A276T | THYM | 1 |
| p.I157V | UCEC | 1 |
| p.S284* | CESC | 1 |
| p.K42M | BRCA | 1 |
| p.S142N | BLCA | 1 |
| p.N198S | LUAD | 1 |
| p.V359M | HNSC | 1 |
| p.E39D | STAD | 1 |
| p.W315* | PAAD | 1 |
| p.S256L | BLCA | 1 |
| p.H244Y | PAAD | 1 |
| p.W201C | LUAD | 1 |
| p.L365I | COAD | 1 |
| p.P291R | UCEC | 1 |
| p.W269* | PAAD | 1 |
| p.A204T | COAD | 1 |
| p.R234M | COAD | 1 |
| p.G231C | COAD | 1 |
| p.D181N | SKCM | 1 |
| p.E196G | KIRP | 1 |
| p.G128C | LUAD | 1 |
| p.G112C | LUAD | 1 |
| p.W220L | LUSC | 1 |
| p.G239R | BLCA | 1 |
| p.D183N | SKCM | 1 |
| Top |
| TissGeneCNV for RHCE |
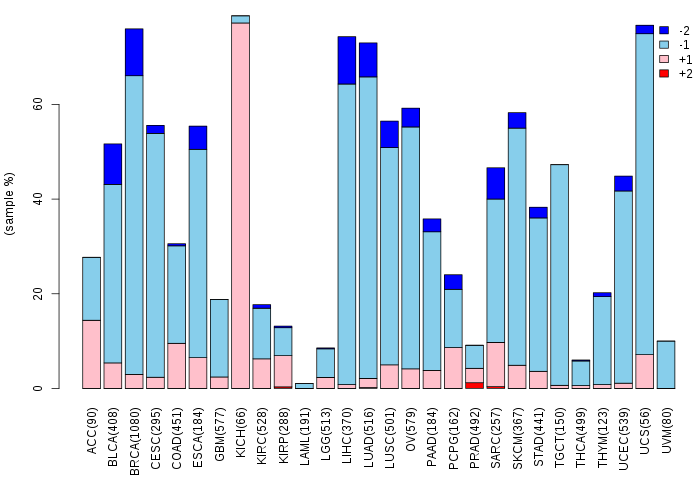
| Copy number variations of TissGene across 28 cancer types (X-axis: cancer type and Y-axis: % of CNV samples) (TCGA Gistic2_CopyNumber_Gistic2_all_data_by_genes, Gistic2 copy number data, version 2016-08-16) |
 |
| Top |
| TissGeneFusions for RHCE |
| Fusion genes including TissGene (ChimerDB 3.0, 2016-12-01 and TCGA fusion Portal 2015-12-01) |
| Database | Src | Cancer type | Sample | Fusion gene | ORF | 5'-gene BP | 3'-gene BP |
| Chimerdb3.0 | FusionScan | HNSC | TCGA-DQ-7591-01A | KPNA6-RHCE | In-Frame | chr1:32573735 | chr1:25697031 |
| TCGAfusionPortal | PRADA | HNSC | TCGA-DQ-7591-01A | KPNA6-RHCE | In-frame | Chr1:32573735 | Chr1:25697031 |
| Top |
| TissGeneNet for RHCE |
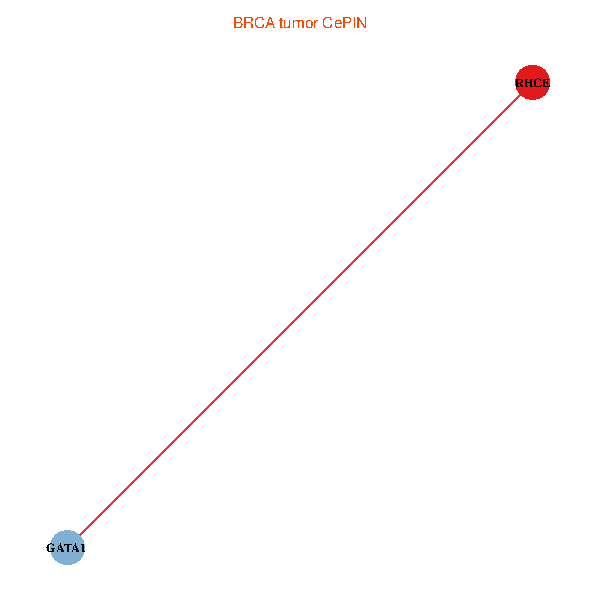
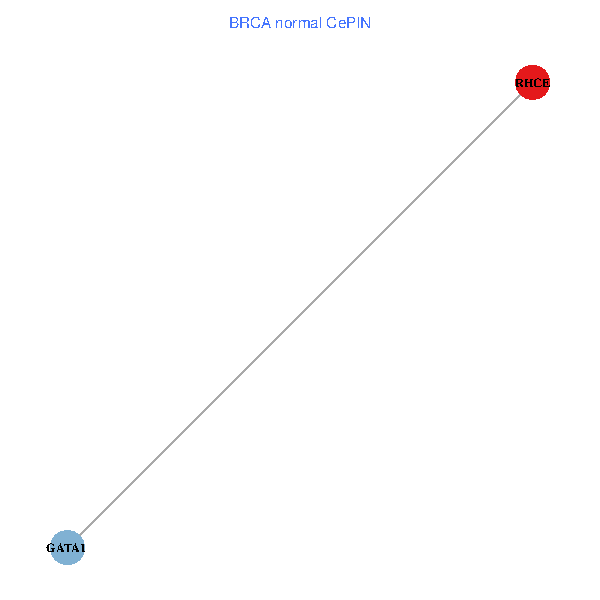
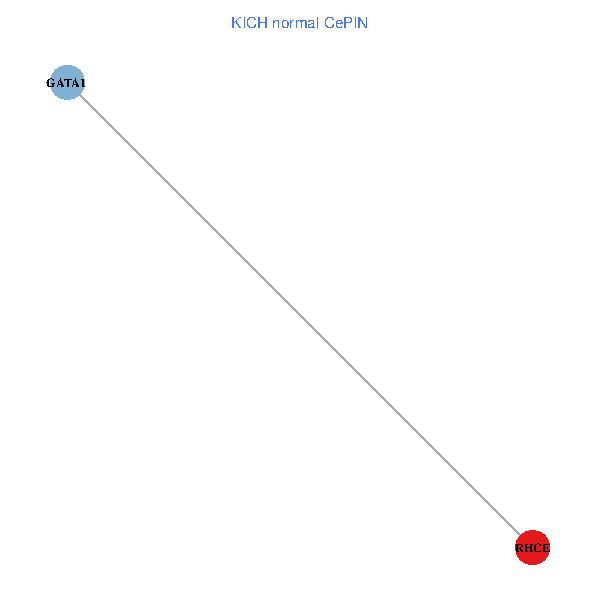
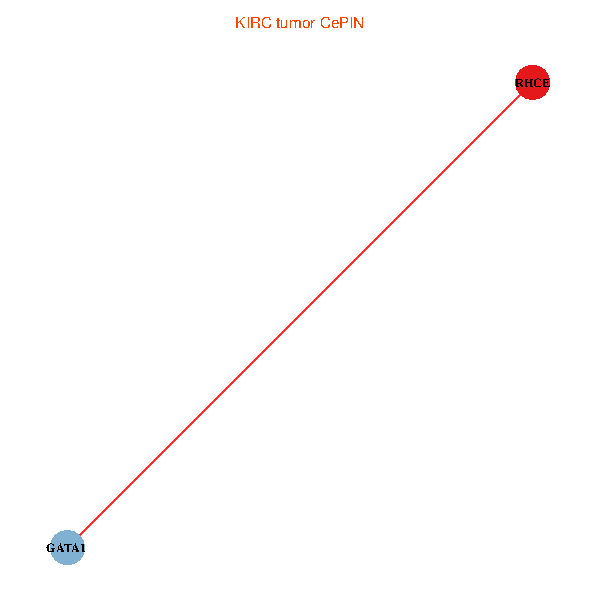
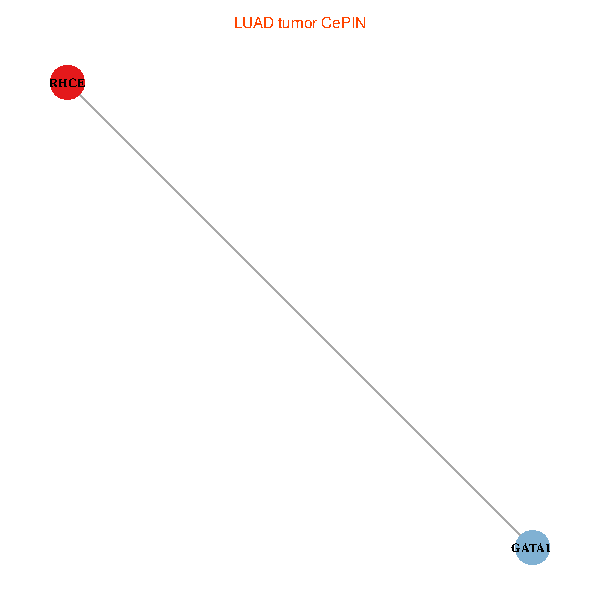
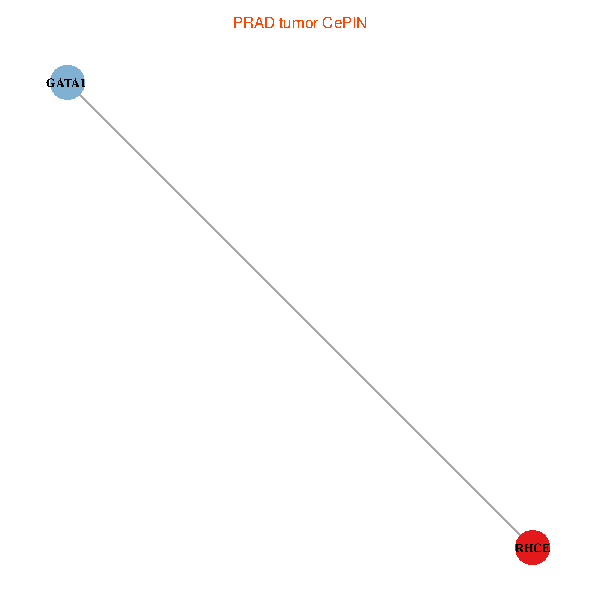
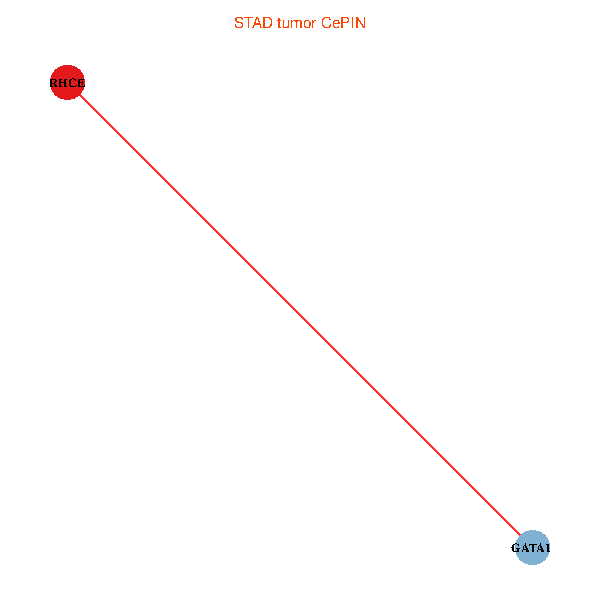
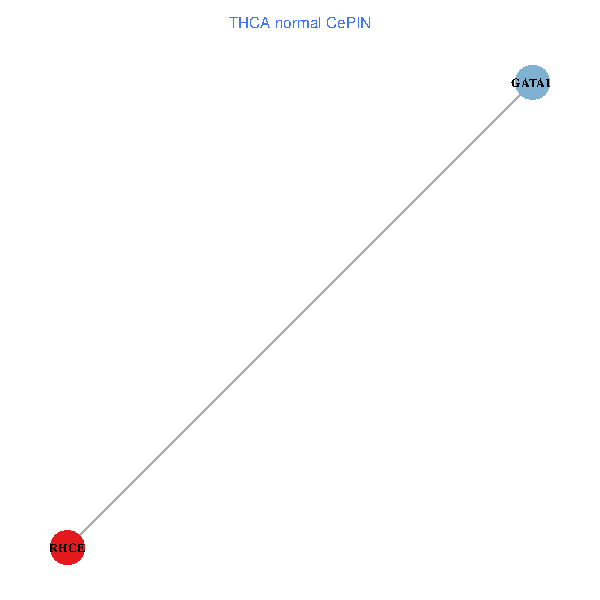
| Co-expressed gene networks based on protein-protein interaction data (CePIN) (TCGA IlluminaHiSeq_RNASeqV2, pan-cancer normalized log2(norm_counts+1) data, version 2016-08-16) (PINA2 ppi data) |
| BRCA (tumor) | BRCA (normal) |
| RHCE, GATA1 (tumor) | RHCE, GATA1 (normal) |
 |  |
| COAD (tumor) | COAD (normal) |
| RHCE, GATA1 (tumor) | RHCE, GATA1 (normal) |
 |  |
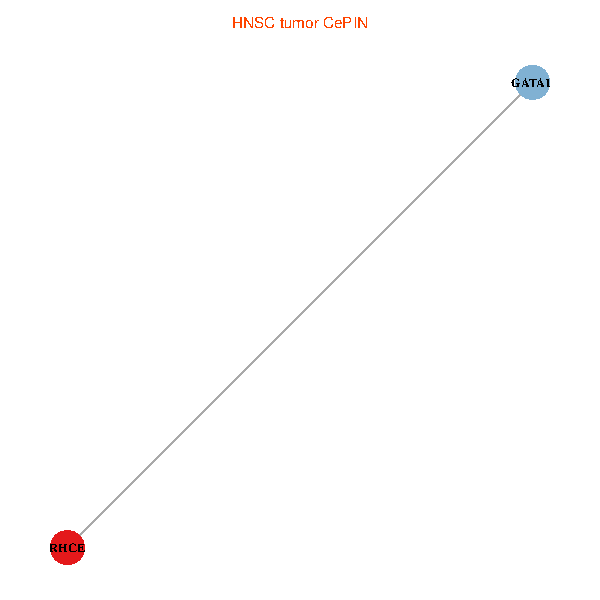
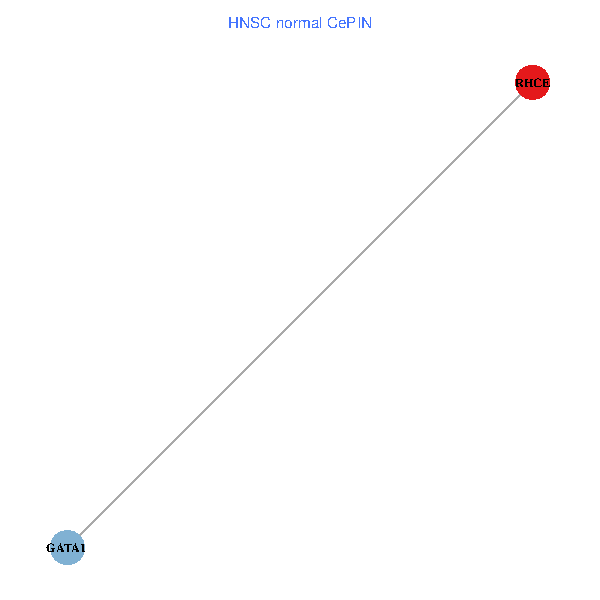
| HNSC (tumor) | HNSC (normal) |
| RHCE, GATA1 (tumor) | RHCE, GATA1 (normal) |
 |  |
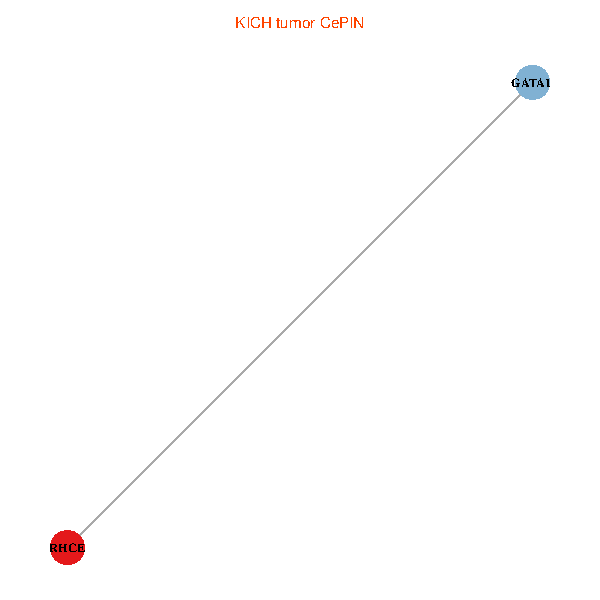
| KICH (tumor) | KICH (normal) |
| RHCE, GATA1 (tumor) | RHCE, GATA1 (normal) |
 |  |
| KIRC (tumor) | KIRC (normal) |
| RHCE, GATA1 (tumor) | RHCE, GATA1 (normal) |
 |  |
| KIRP (tumor) | KIRP (normal) |
| RHCE, GATA1 (tumor) | RHCE, GATA1 (normal) |
 |  |
| LIHC (tumor) | LIHC (normal) |
| RHCE, GATA1 (tumor) | RHCE, GATA1 (normal) |
 |  |
| LUAD (tumor) | LUAD (normal) |
| RHCE, GATA1 (tumor) | RHCE, GATA1 (normal) |
 |  |
| LUSC (tumor) | LUSC (normal) |
| RHCE, GATA1 (tumor) | RHCE, GATA1 (normal) |
 |  |
| PRAD (tumor) | PRAD (normal) |
| RHCE, GATA1 (tumor) | RHCE, GATA1 (normal) |
 |  |
| STAD (tumor) | STAD (normal) |
| RHCE, GATA1 (tumor) | RHCE, GATA1 (normal) |
 |  |
| THCA (tumor) | THCA (normal) |
| RHCE, GATA1 (tumor) | RHCE, GATA1 (normal) |
 |  |
| Top |
| TissGeneProg for RHCE |
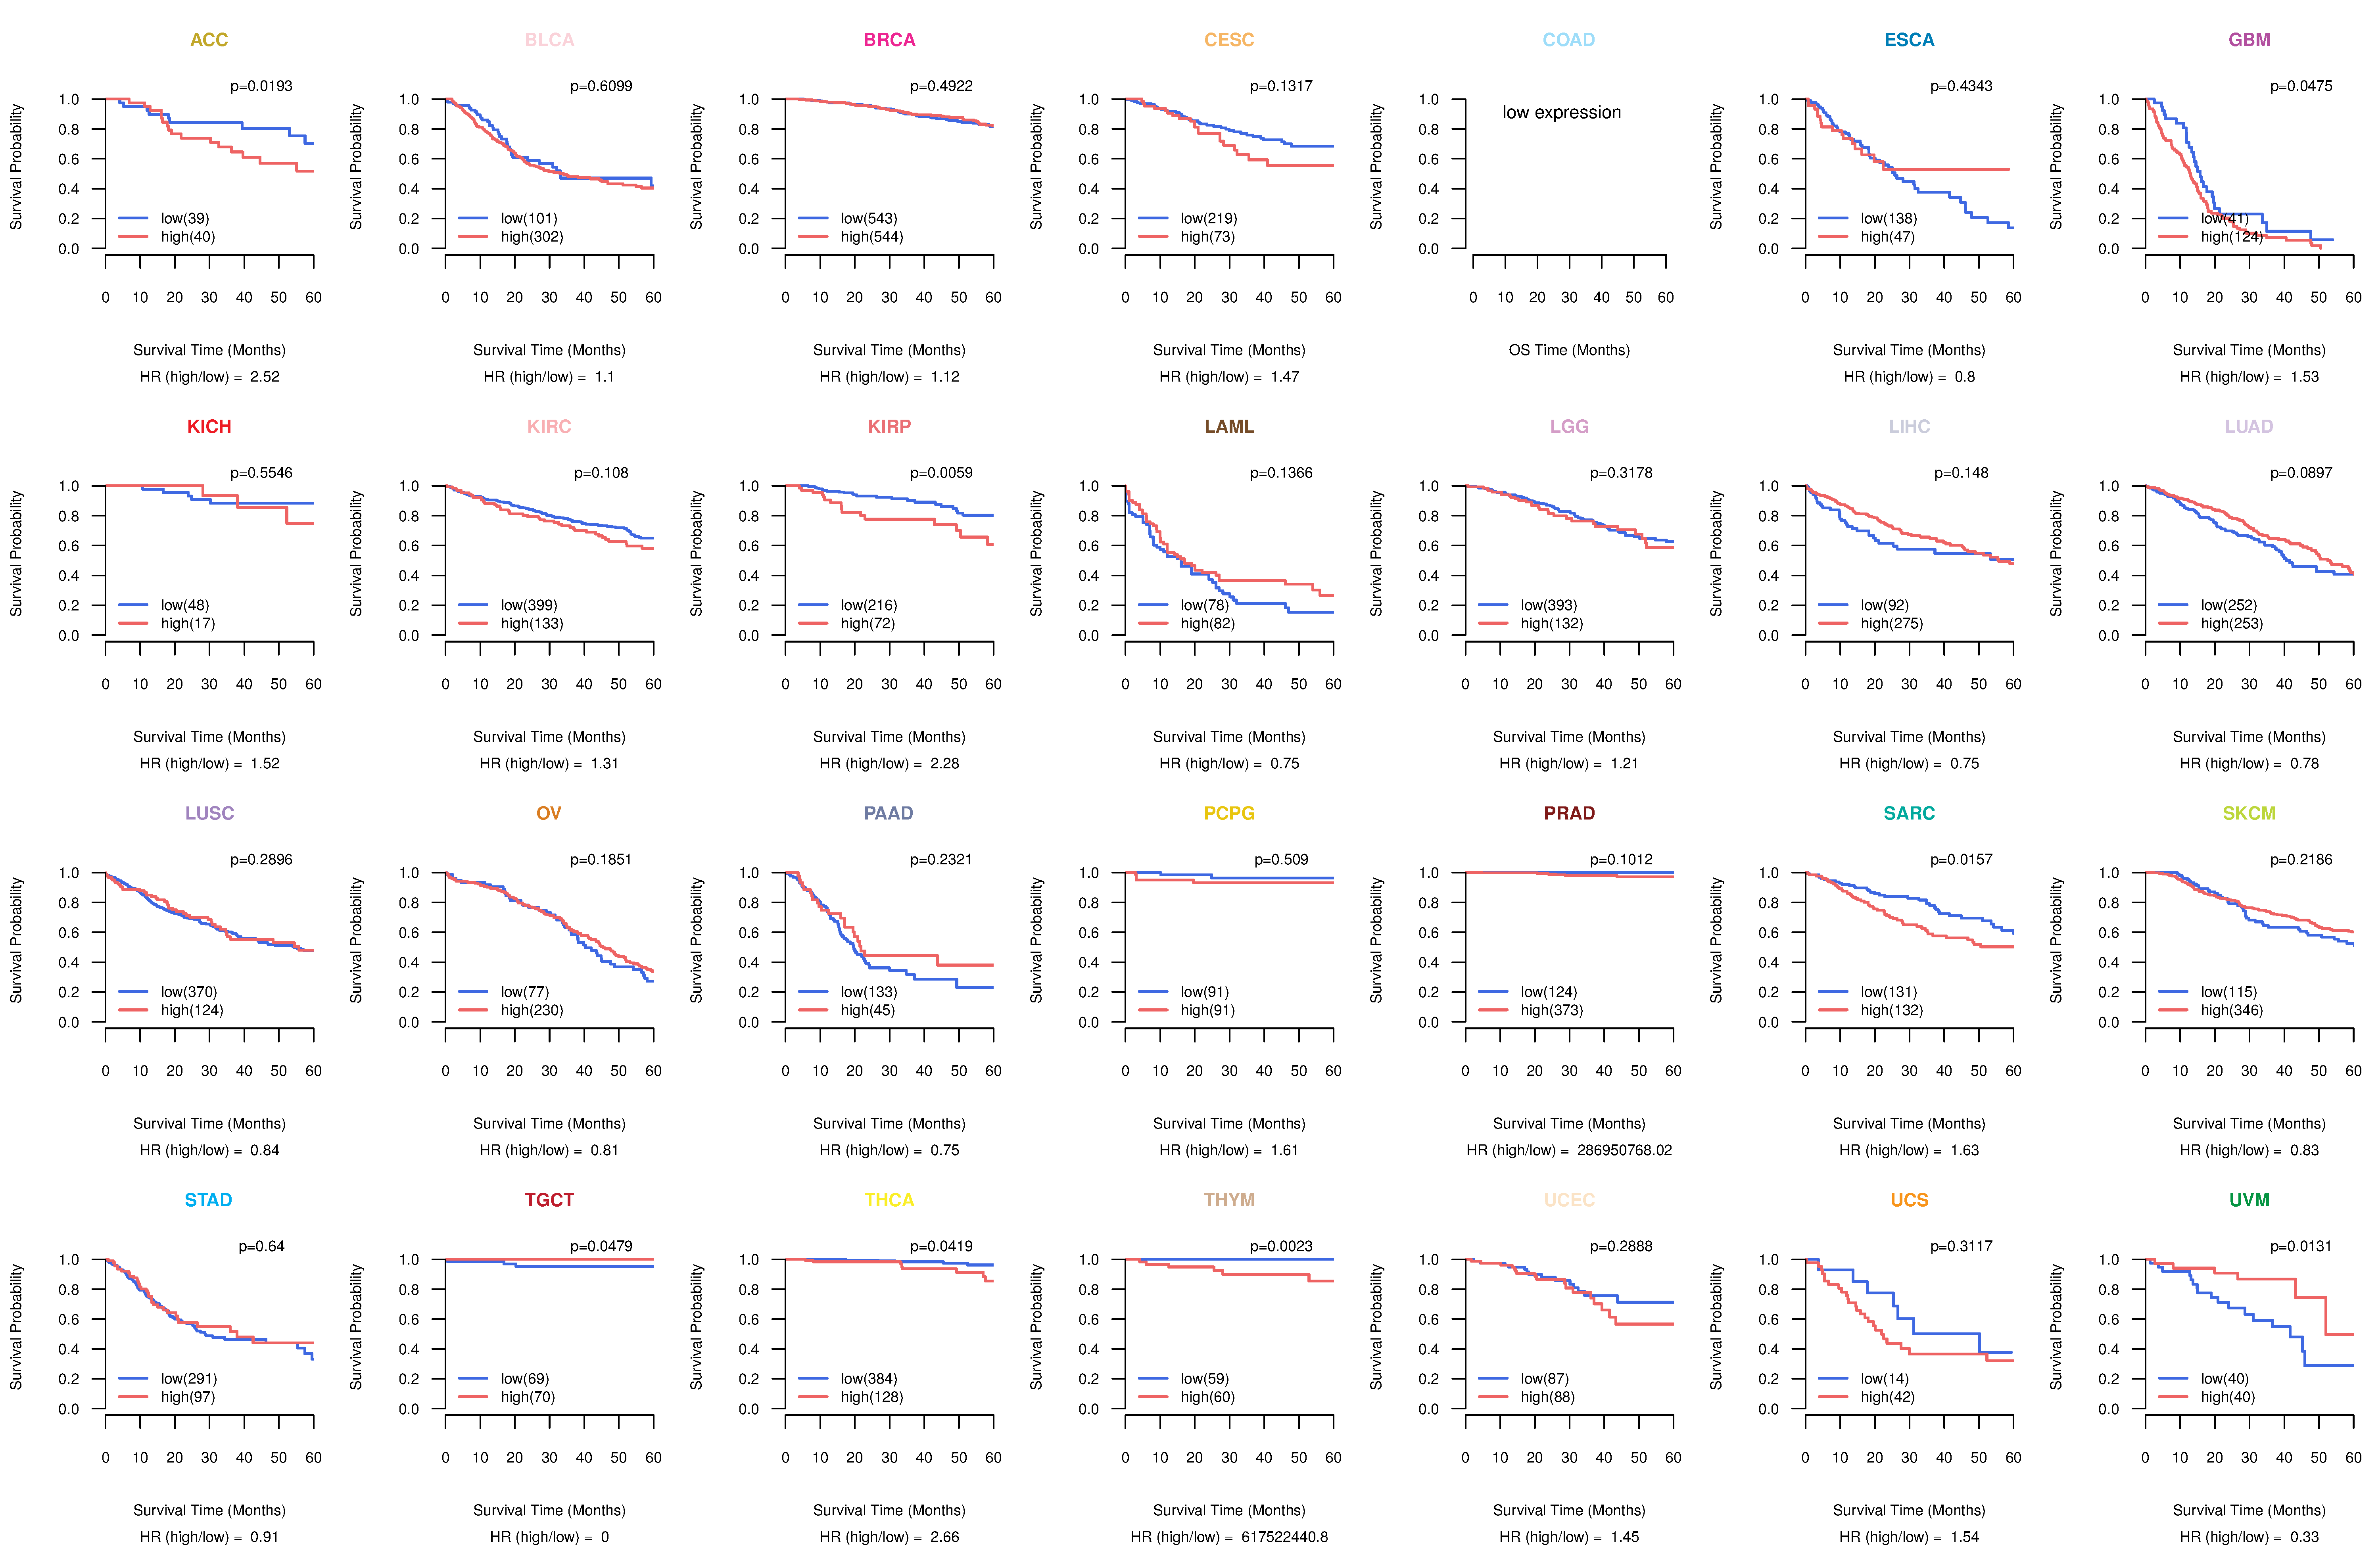
| Kaplan-Meier plots with logrank tests of overall survival (OS) using 28 cancer types (TCGA IlluminaHiSeq_RNASeqV2, pan-cancer normalized log2(norm_counts+1) data, version 2016-08-16) (TCGA clinicalMatrix, phenotype data, version 2016-04-27) * Click on the image to enlarge it in a new window. |
 |
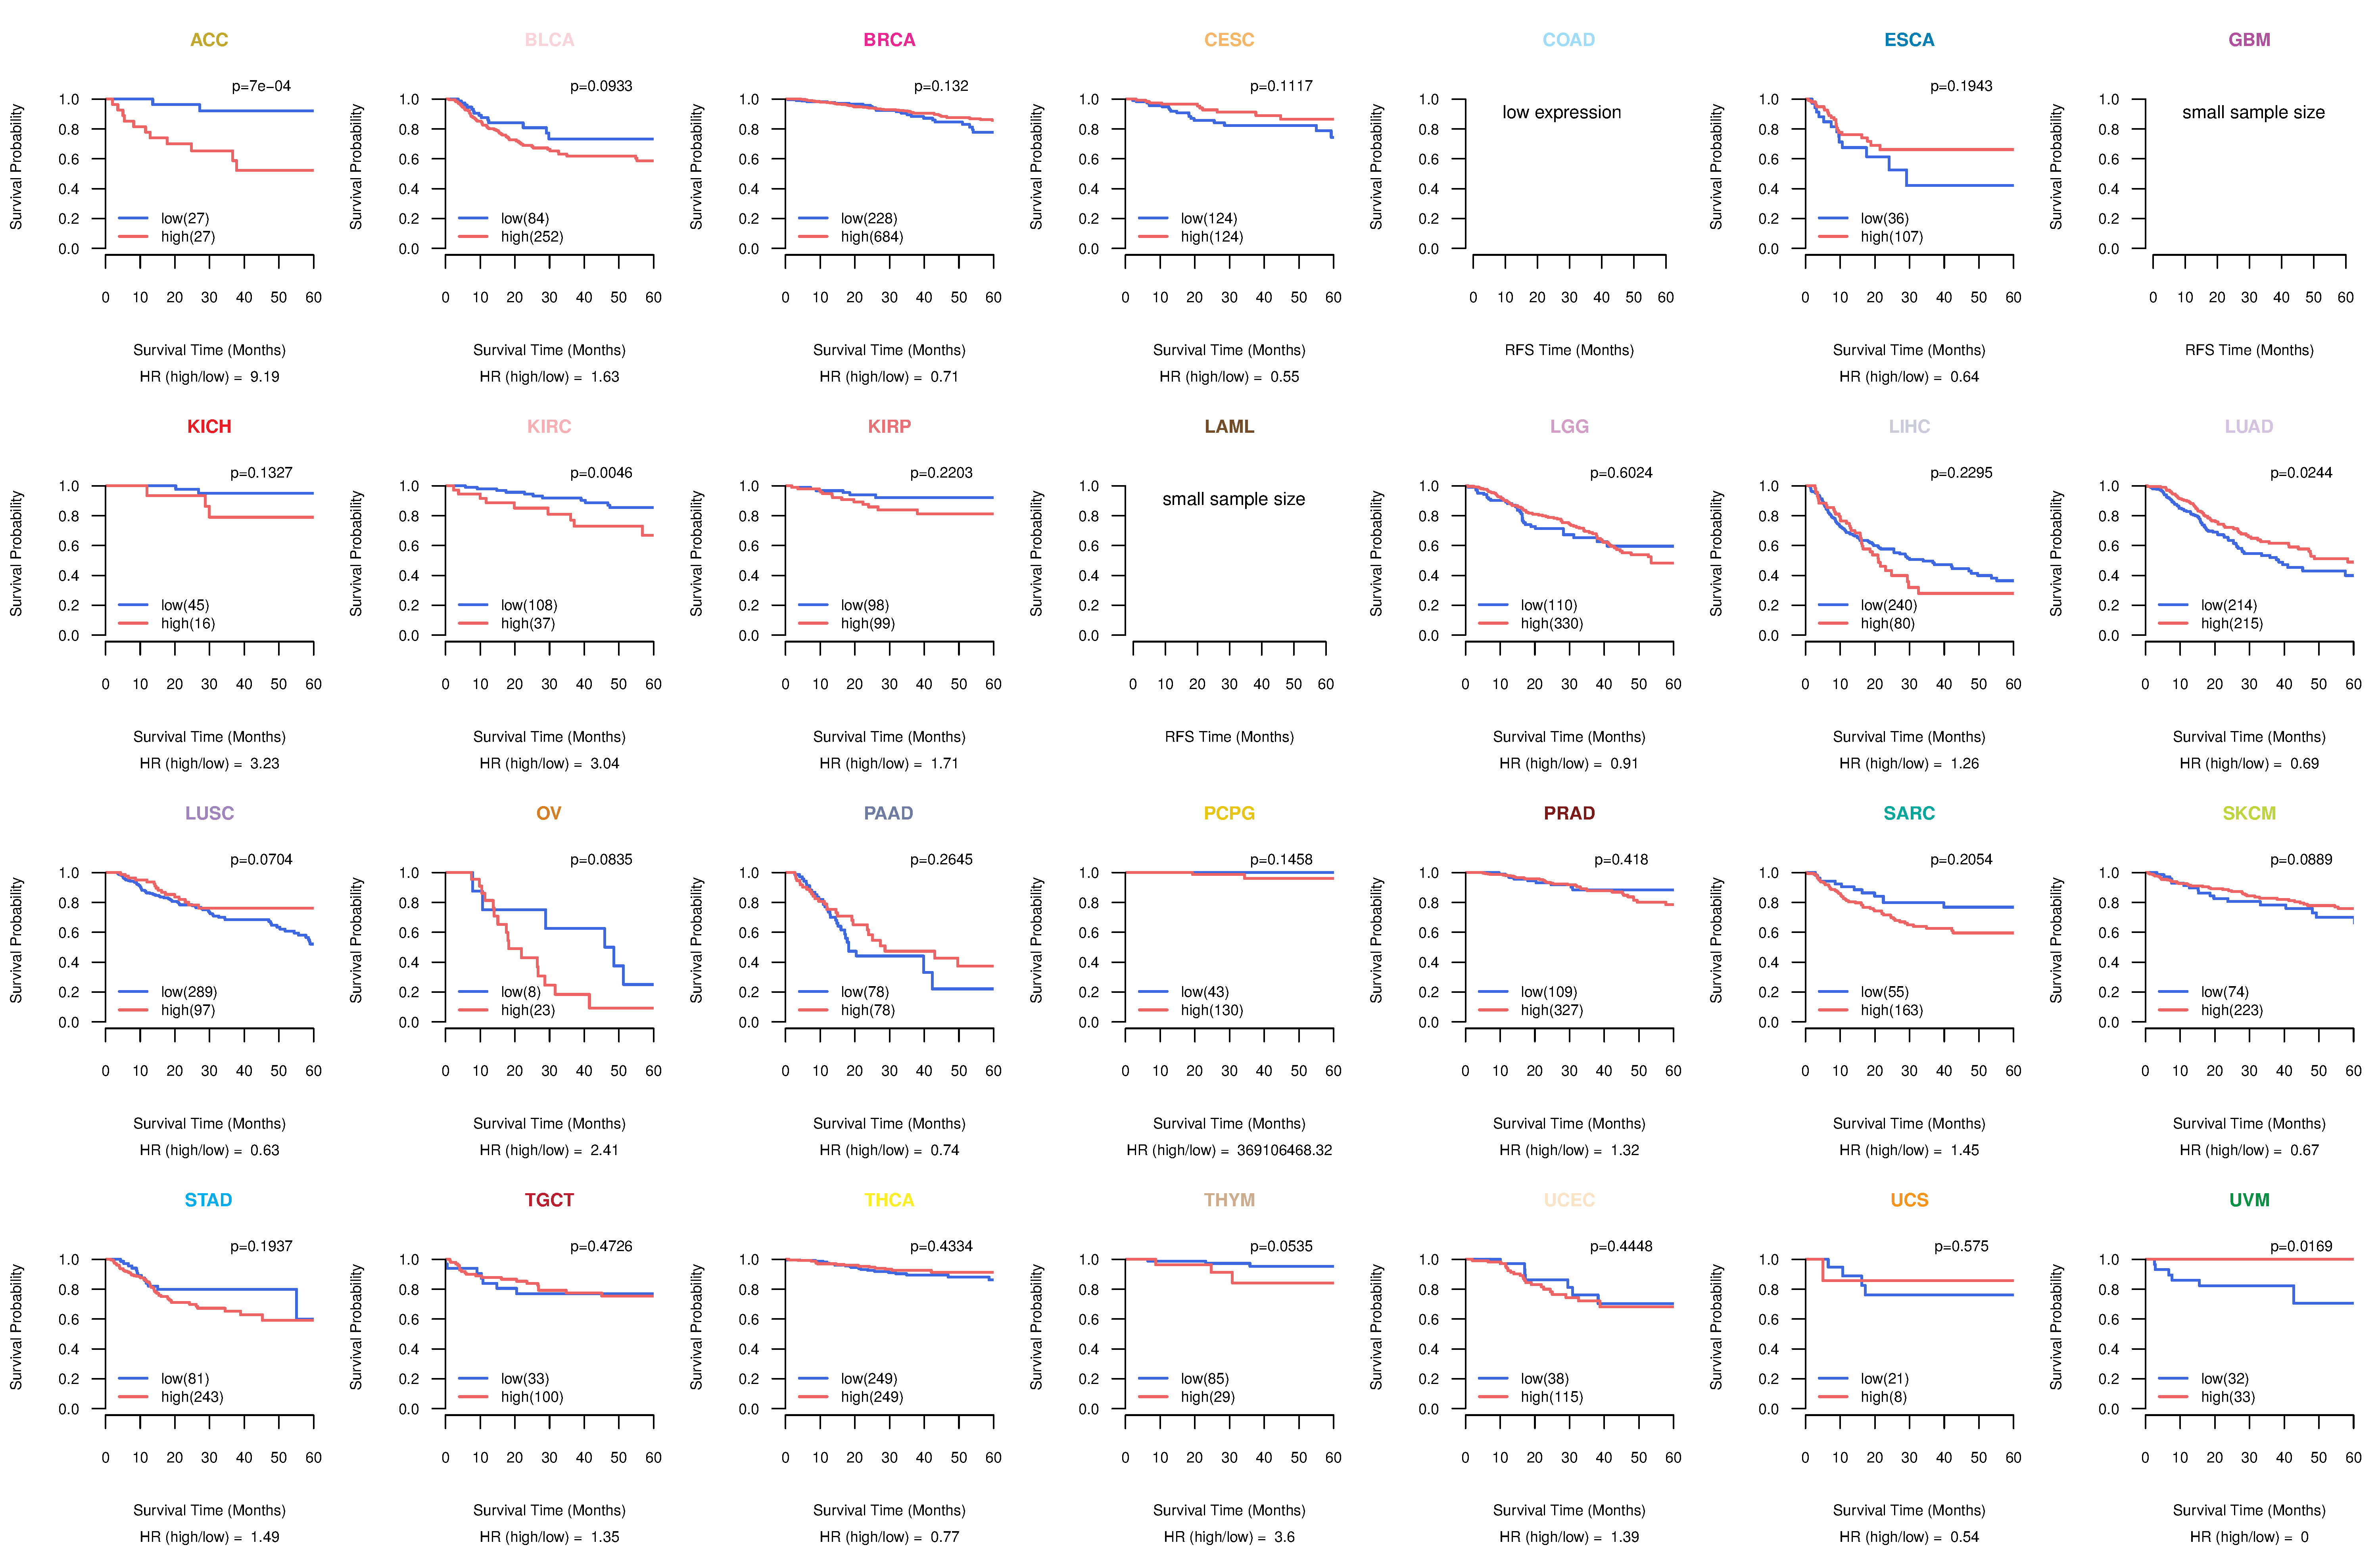
| Kaplan-Meier plots with logrank test of relapse free survival (RFS) using 28 cancer types (TCGA IlluminaHiSeq_RNASeqV2, pan-cancer normalized log2(norm_counts+1) data, version 2016-08-16) (TCGA clinicalMatrix, phenotype data, version 2016-04-27) * Click on the image enlarge it in a new window. |
 |
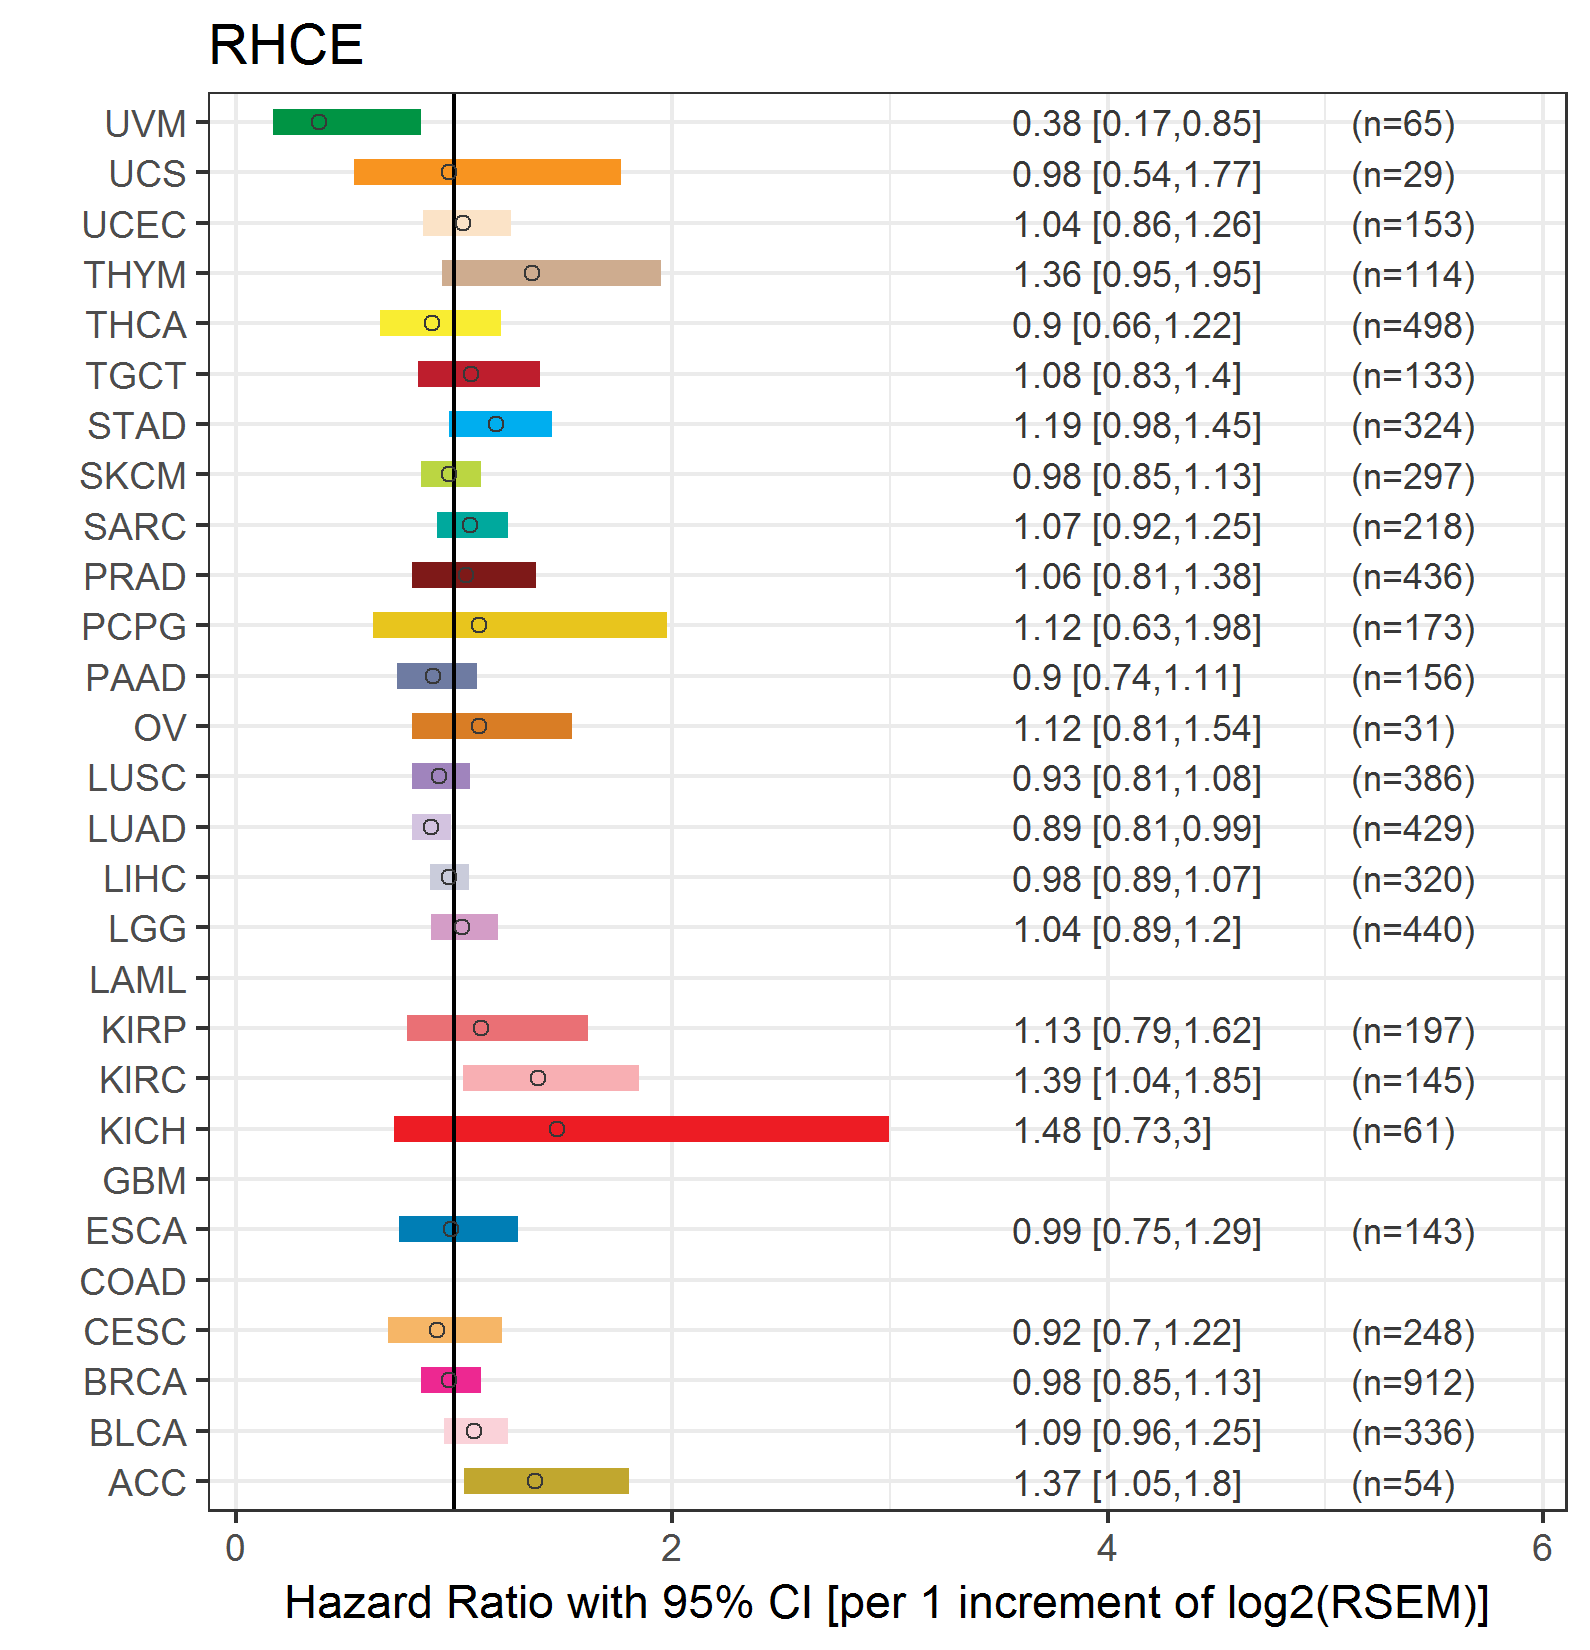
| Forest plot of Cox proportional hazard ratio (HR) and 95% CI of overall survival (OS) using 28 cancer types (TCGA IlluminaHiSeq_RNASeqV2, pan-cancer normalized log2(norm_counts+1) data, version 2016-08-16) (TCGA clinicalMatrix, phenotype data, version 2016-04-27) * Click on the image enlarge it in a new window. |
 |
| Forest plot of Cox proportional hazard ratio (HR) and 95% CI of relapse free survival (RFS) using 28 cancer types (TCGA IlluminaHiSeq_RNASeqV2, pan-cancer normalized log2(norm_counts+1) data, version 2016-08-16) (TCGA clinicalMatrix, phenotype data, version 2016-04-27) * Click on the image enlarge it in a new window. |
 |
| Top |
| TissGeneClin for RHCE |
| TissGeneDrug for RHCE |
| Drug information targeting TissGene (DrugBank Version 5.0.6, 2017-04-01) |
| DrugBank ID | Drug name | Drug activity | Drug type | Drug status |
| Top |
| TissGeneDisease for RHCE |
| Disease information associated with TissGene (DisGeNet, 2016-06-01) |
| Disease ID | Disease name | # pubmeds | Source |
| umls:C0002895 | Anemia, Sickle Cell | 4 | BeFree |
| umls:C0025202 | melanoma | 3 | BeFree |
| umls:C0007114 | Malignant neoplasm of skin | 2 | BeFree |
| umls:C0014761 | Erythroblastosis, Fetal | 2 | BeFree |
| umls:C1849452 | SKIN/HAIR/EYE PIGMENTATION, VARIATION IN, 2 (disorder) | 2 | BeFree |
| umls:C0002881 | Anemia, Hemolytic, Congenital | 1 | CTD_human |
| umls:C0005806 | Blood Group Incompatibility | 1 | GAD |
| umls:C0023891 | Liver Cirrhosis, Alcoholic | 1 | GAD |
| umls:C0024530 | Malaria | 1 | GAD |
| umls:C0035404 | Rh Isoimmunization | 1 | GAD |
| umls:C0158962 | Hemolytic disease of fetus OR newborn due to RhD isoimmunization | 1 | BeFree |
| umls:C0272052 | Rh Deficiency Syndrome | 0 | ORPHANET |
| umls:C1862196 | Rh-Null Disease, Amorph Type | 0 | CLINVAR |
|
Copyright 2016-Present - The University of Texas Health Science Center at Houston (UTHealth) Web File Viewing | How to Report, Fraud, Waste and Abuse | State of Texas | Statewide Search | Texas Homeland Security | Site Policies |