 |
| |
| |
| |
| |
| |
| |
|

| TissGeneSummary for AVPI1 |
 Gene summary Gene summary |
| Basic gene information | Gene symbol | AVPI1 |
| Gene name | arginine vasopressin-induced 1 | |
| Synonyms | PP5395|VIP32|VIT32 | |
| Cytomap | UCSC genome browser: 10q24.2 | |
| Type of gene | protein-coding | |
| RefGenes | NM_021732.2, | |
| Description | AVP-induced protein 1arginine vasopressin-induced protein 1vasopressin-induced transcript | |
| Modification date | 20141207 | |
| dbXrefs | HGNC : HGNC | |
| Ensembl : ENSG00000119986 | ||
| HPRD : 16530 | ||
| Vega : OTTHUMG00000018864 | ||
| Protein | UniProt: go to UniProt's Cross Reference DB Table | |
| Expression | CleanEX: HS_AVPI1 | |
| BioGPS: 60370 | ||
| Pathway | NCI Pathway Interaction Database: AVPI1 | |
| KEGG: AVPI1 | ||
| REACTOME: AVPI1 | ||
| Pathway Commons: AVPI1 | ||
| Context | iHOP: AVPI1 | |
| ligand binding site mutation search in PubMed: AVPI1 | ||
| UCL Cancer Institute: AVPI1 | ||
| Assigned class in TissGDB* | C | |
| Included tissue-specific gene expression resources | TiGER,GTEx | |
| Specific-tissues in normal samples (assigned by TissGDB using HPA, TiGER, and GTEx) | CervixOvary | |
| Cancer types related to the specific-tissues in cancer samples (assigned by TissGDB using TCGA) | CESCOV | |
| Reference showing the relevant tissue of AVPI1 | ||
| Description by TissGene annotations | Cancer gene TissgsLTS | |
| * Class A consists of genes with literature evidence and is part of the cTissGenes. Class B consists of only cTissGenes without additional evidence. The remaining genes belong to Class C. |
| Gene ontology having evidence of Inferred from Direct Assay (IDA) from Entrez |
| GO ID | GO term | PubMed ID |
| Top |
| TissGeneExp for AVPI1 |
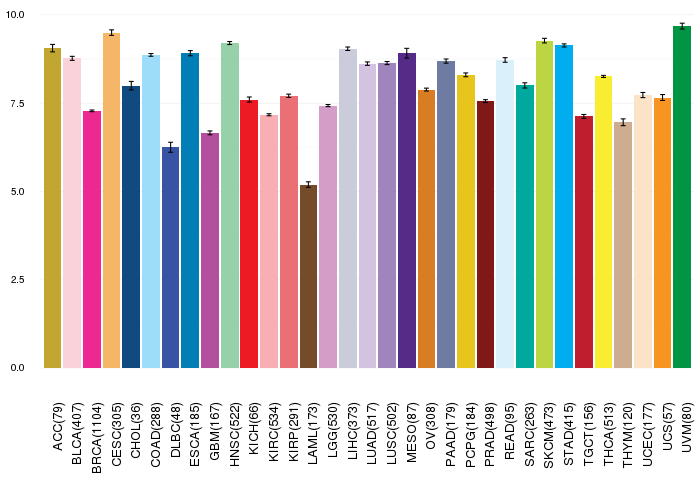
| Gene expressions across 28 cancer types (X-axis: cancer type and Y-axis: log2(norm_counts+1)) (TCGA IlluminaHiSeq_RNASeqV2, pan-cancer normalized log2(norm_counts+1) data, version 2016-08-16) |
 |
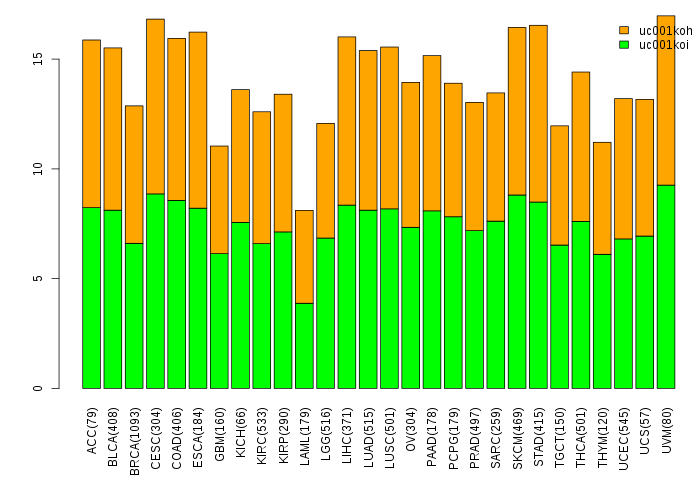
| Gene isoform expressions across 28 cancer types (X-axis: cancer type and Y-axis: log2(norm_counts+1)) (TCGA pan-cancer tcga_rsem_isoform_tpm, version 2016-09-01) |
 |
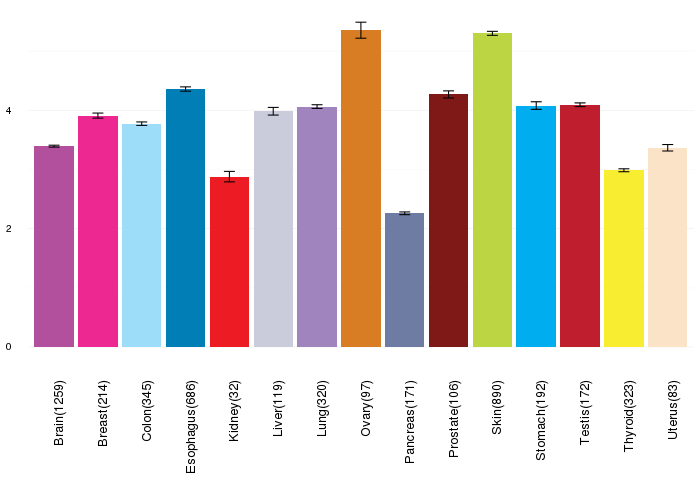
| Gene expressions across normal tissues of GTEx data (GTEx GTEx_Analysis_v6_RNA-seq_RNA-SeQCv1.1.8_gene_rpkm.gct) - Here, we shows the matched tissue types only among our 28 cancer types. |
 |
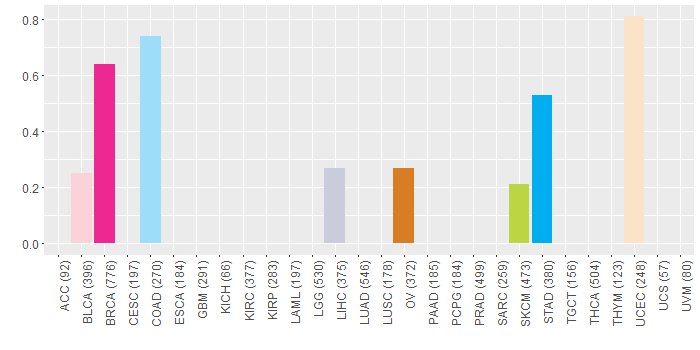
| Different expressions across 14 cancer types with more than 10 samples between matched tumors and normals (X-axis: cancer type and Y-axis: log2(norm_counts+1)) (TCGA IlluminaHiSeq_RNASeqV2, pan-cancer normalized log2(norm_counts+1) data, version 2016-08-16) |
 |
| - Significantly differentially expressed cancer types and information. (|Fold change|>1 and FDR<0.05) |
| Cancer type | Mean(exp) in tumor | Mean(exp) in matched normal | Log2FC | P-val. | FDR |
| BRCA | -0.290509957 | 0.92415671 | -1.214666667 | 9.36E-22 | 7.62E-21 |
| PRAD | -0.015760496 | 1.273147196 | -1.288907692 | 8.61E-13 | 5.08E-11 |
| KICH | 0.033837657 | 1.110841657 | -1.077004 | 3.37E-09 | 1.92E-08 |
| LIHC | 1.479319657 | 2.707047657 | -1.227728 | 1.15E-11 | 1.77E-10 |
| BLCA | 0.871280394 | 2.223769868 | -1.352489474 | 0.000351 | 0.003034295 |
| Top |
| TissGene-miRNA for AVPI1 |
| Significantly anti-correlated miRNAs of TissGene across 28 cancer types (Gene-miRNA relations from TargetScanHuman Relsease 7.1, Conserved_Site_Context_Scores.txt.zip, 06.01.2016) (TCGA IlluminaHiSeq_miRNASeq, log2(RPM+1) data, version 2016-11-21) (TCGA IlluminaHiSeq_RNASeqV2, log2(normalized_count+1) data, version 2016-08-16) (Spearman’s Rank Correlation (p-value<0.05 and coefficient<-0.25)) |
| Cancer type | miRNA id | miRNA accession | P-val. | Coeff. | # samples |
| Top |
| TissGeneMut for AVPI1 |
| TissGeneSNV for AVPI1 |
| nsSNV counts per each loci. Different colors of circles represent different cancer types. Circle size denotes number of samples. (TCGA somatic mutation (SNPs and small INDELs) data, version 2016-04-25) * Click on the image to enlarge it in a new window. |
 |
 |
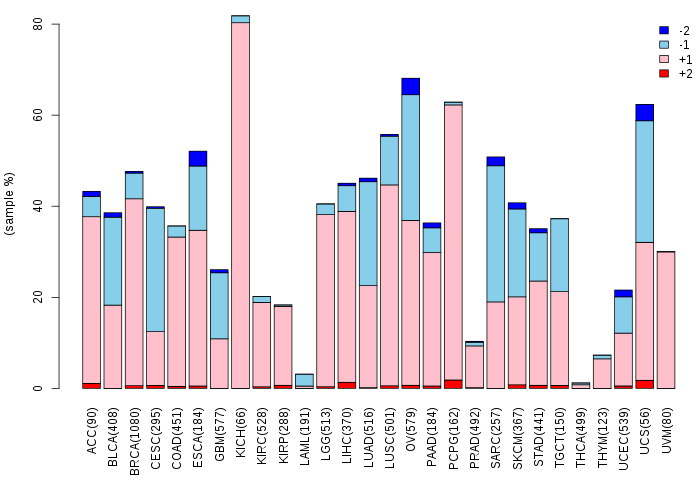
| Somatic nucleotide variants of TissGene across 28 cancer types (X-axis: cancer type and Y-axis: % of mutated samples) The numbers in parentheses are numbers of samples with mutation (nsSNVs). (TCGA somatic mutation (SNPs and small INDELs) data, version 2016-04-25) |
 |
| - nsSNVs sorted by frequency. |
| AAchange | Cancer type | # samples |
| p.A41G | BRCA | 2 |
| p.A34T | COAD | 1 |
| p.E69Q | HNSC | 1 |
| p.R130C | OV | 1 |
| p.E35K | SKCM | 1 |
| p.W14* | UCEC | 1 |
| p.R54G | STAD | 1 |
| p.W163L | BRCA | 1 |
| p.R146T | BRCA | 1 |
| p.S27L | BRCA | 1 |
| p.R75H | UCEC | 1 |
| p.A41G | COAD | 1 |
| p.Q108E | LIHC | 1 |
| p.S102F | BLCA | 1 |
| p.S126N | STAD | 1 |
| Top |
| TissGeneCNV for AVPI1 |
| Copy number variations of TissGene across 28 cancer types (X-axis: cancer type and Y-axis: % of CNV samples) (TCGA Gistic2_CopyNumber_Gistic2_all_data_by_genes, Gistic2 copy number data, version 2016-08-16) |
 |
| Top |
| TissGeneFusions for AVPI1 |
| Fusion genes including TissGene (ChimerDB 3.0, 2016-12-01 and TCGA fusion Portal 2015-12-01) |
| Database | Src | Cancer type | Sample | Fusion gene | ORF | 5'-gene BP | 3'-gene BP |
| Chimerdb3.0 | FusionScan | ESCA | TCGA-L5-A88T-01A | C10orf28-AVPI1 | 5'UTR-5'UTR | chr10:99894463 | chr10:99439672 |
| Top |
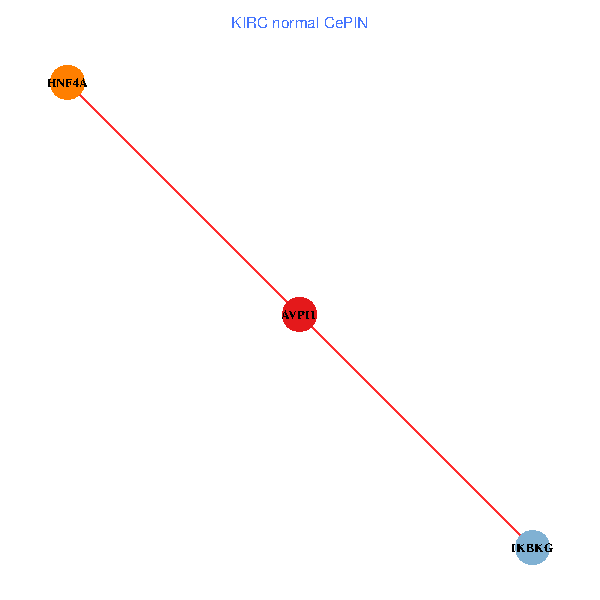
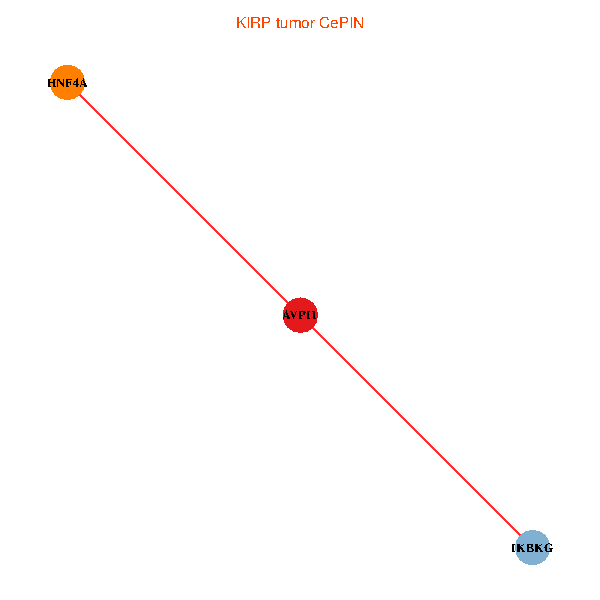
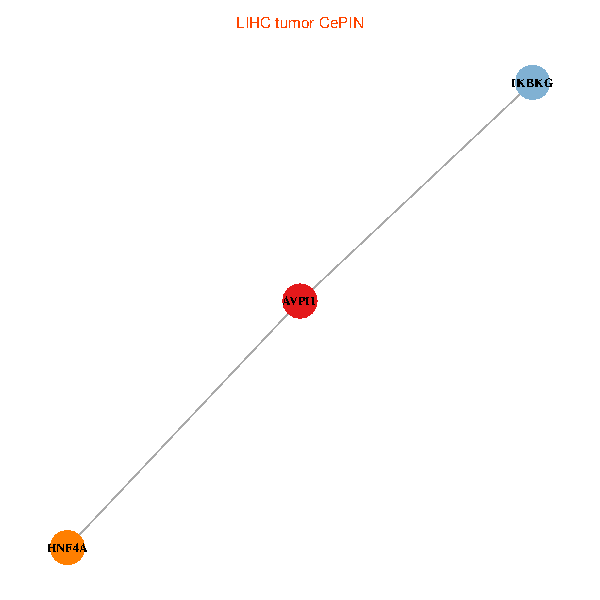
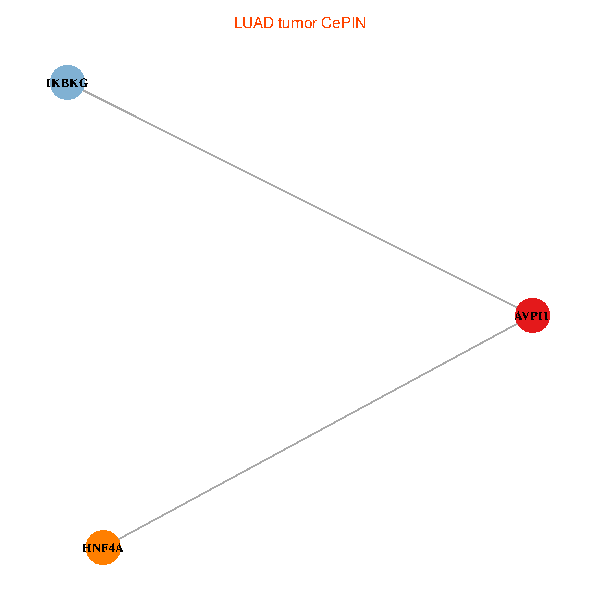
| TissGeneNet for AVPI1 |
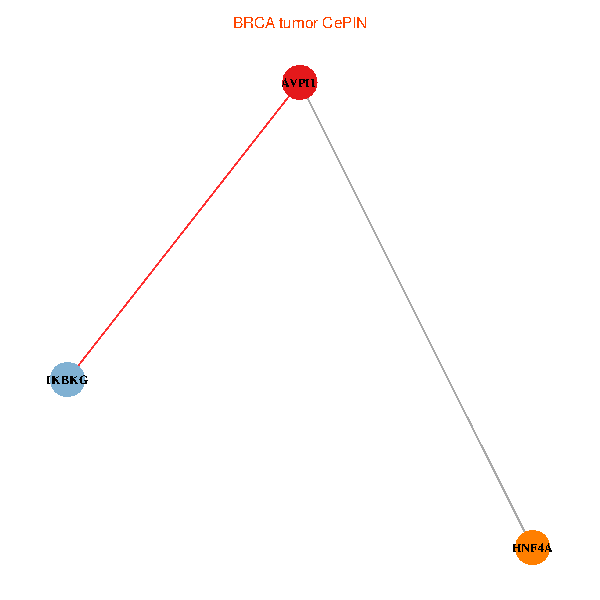
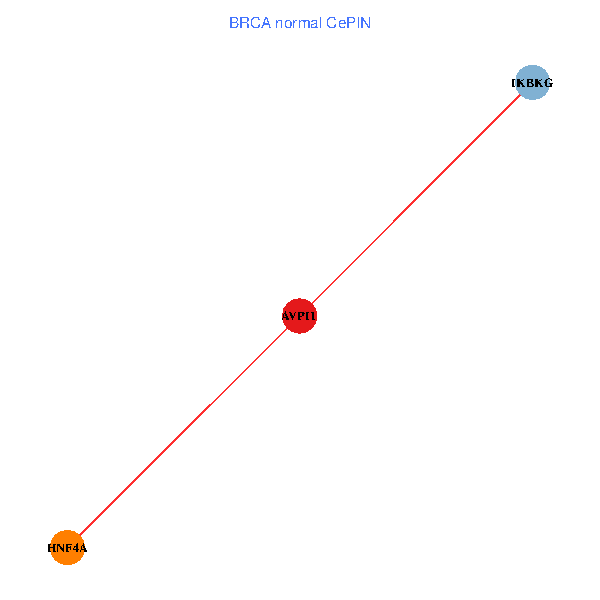
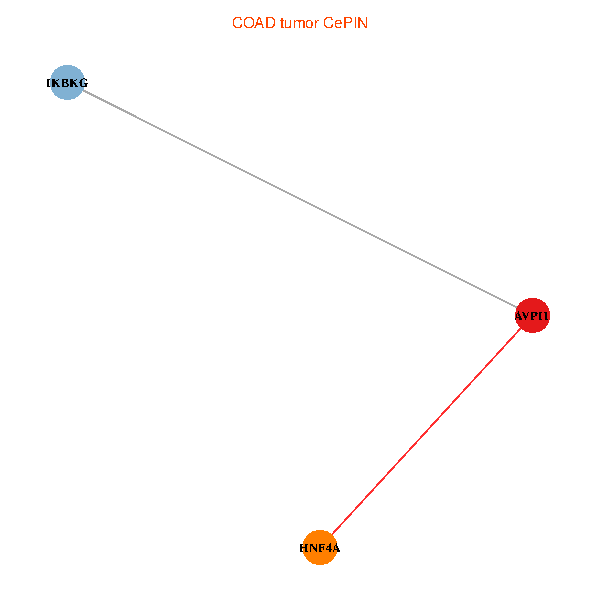
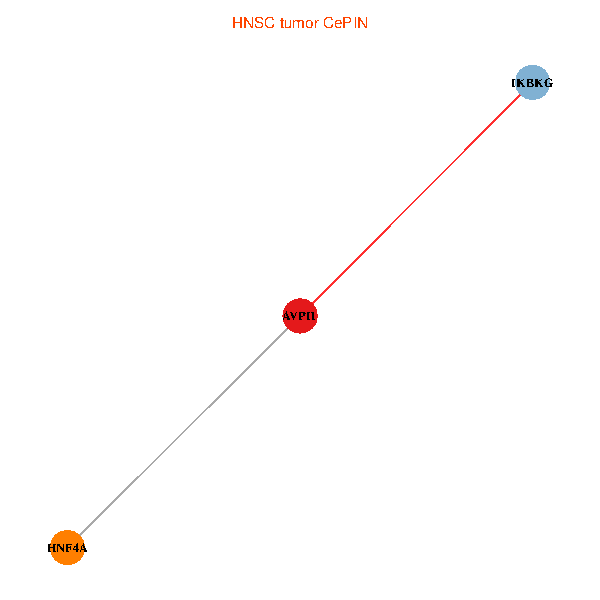
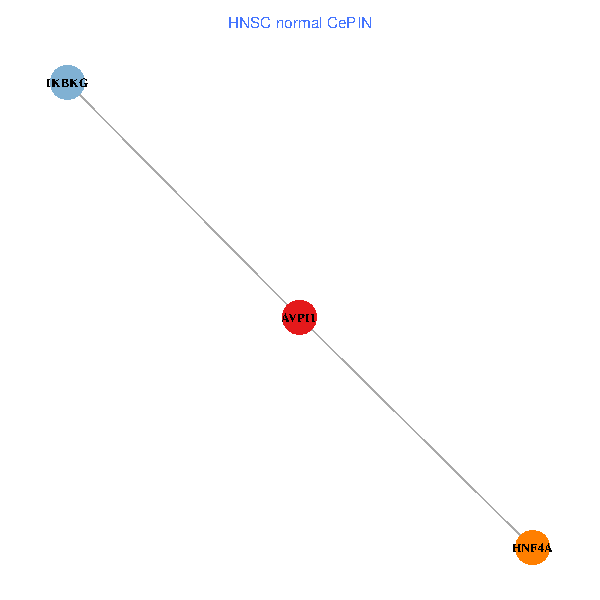
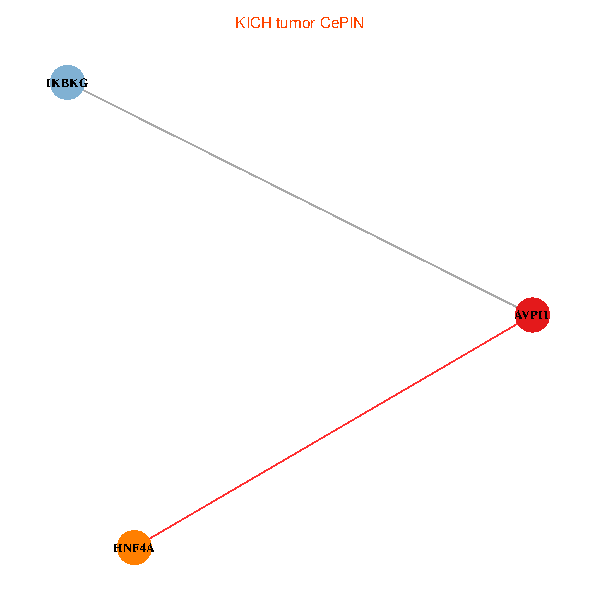
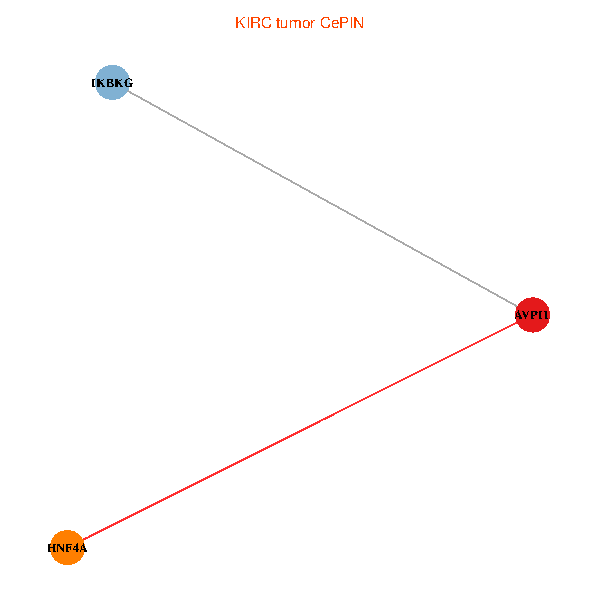
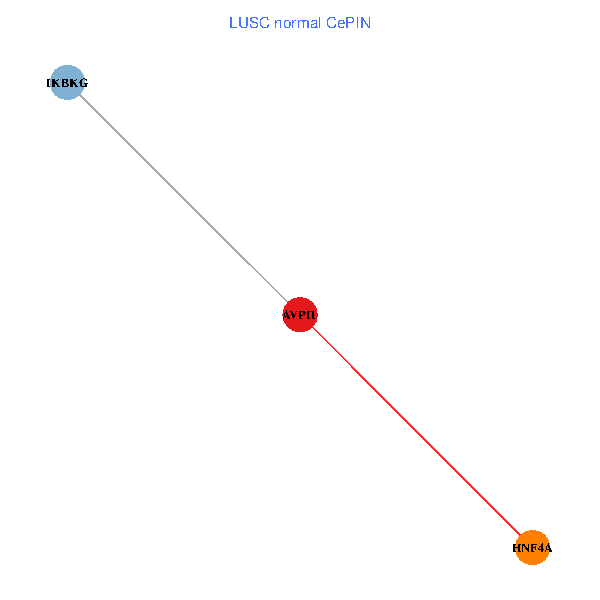
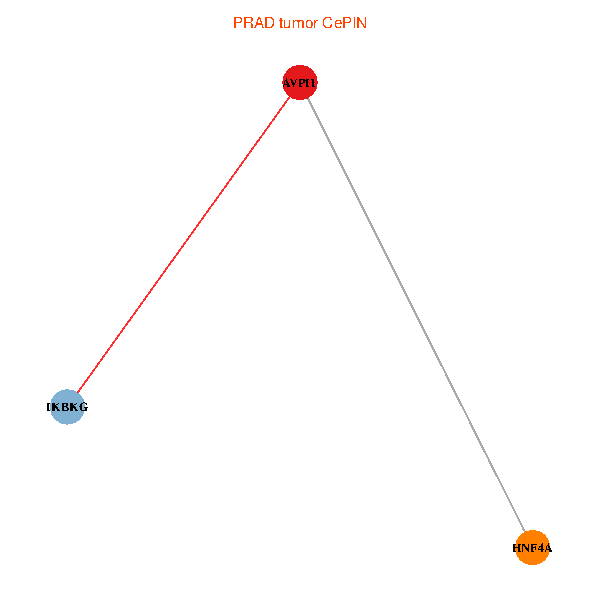
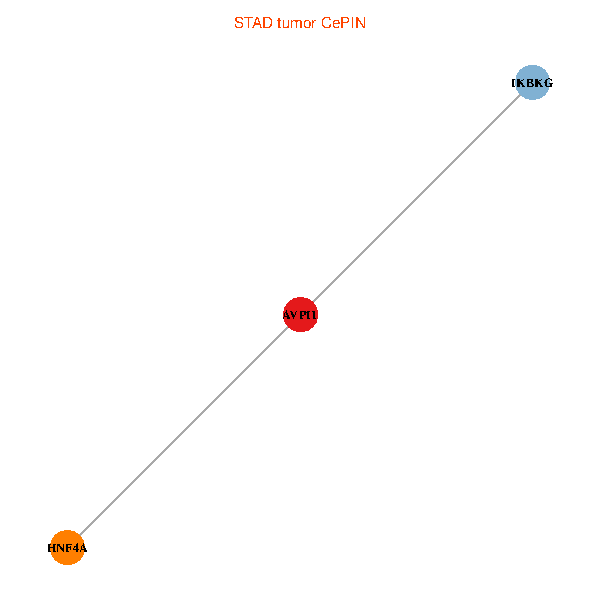
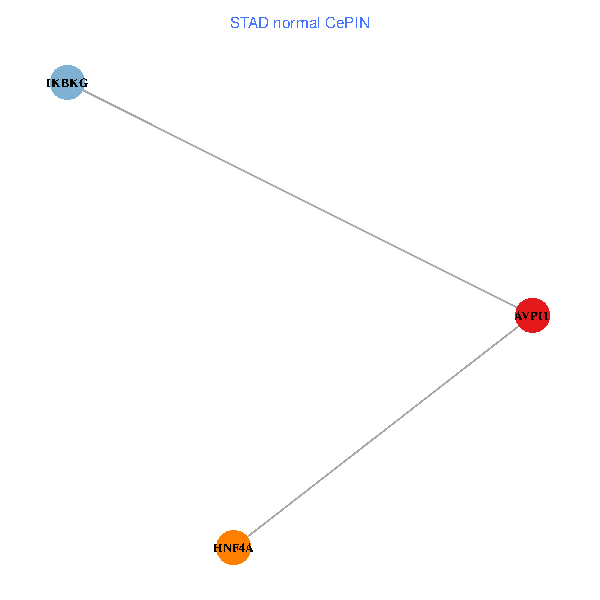
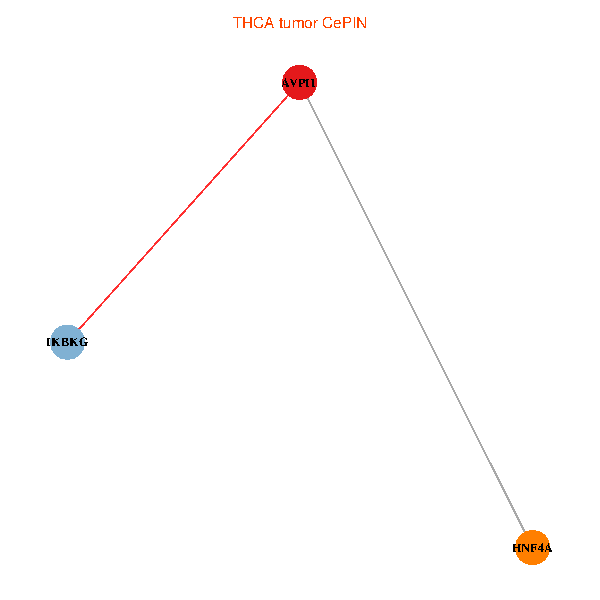
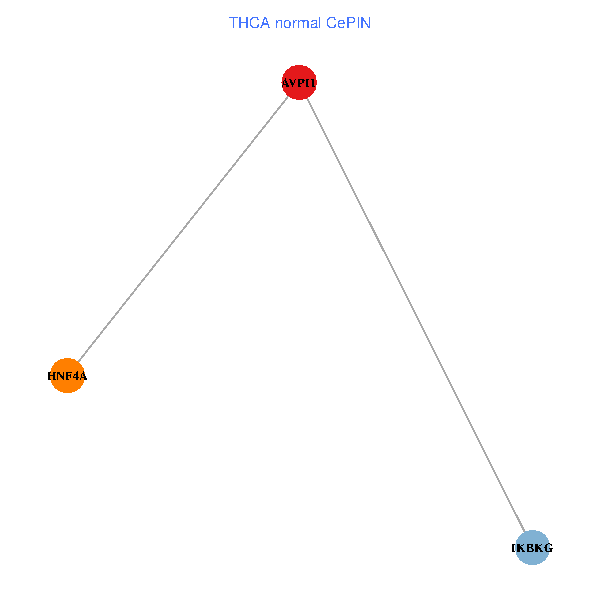
| Co-expressed gene networks based on protein-protein interaction data (CePIN) (TCGA IlluminaHiSeq_RNASeqV2, pan-cancer normalized log2(norm_counts+1) data, version 2016-08-16) (PINA2 ppi data) |
| BRCA (tumor) | BRCA (normal) |
| AVPI1, HNF4A, IKBKG (tumor) | AVPI1, HNF4A, IKBKG (normal) |
 |  |
| COAD (tumor) | COAD (normal) |
| AVPI1, HNF4A, IKBKG (tumor) | AVPI1, HNF4A, IKBKG (normal) |
 |  |
| HNSC (tumor) | HNSC (normal) |
| AVPI1, HNF4A, IKBKG (tumor) | AVPI1, HNF4A, IKBKG (normal) |
 |  |
| KICH (tumor) | KICH (normal) |
| AVPI1, HNF4A, IKBKG (tumor) | AVPI1, HNF4A, IKBKG (normal) |
 |  |
| KIRC (tumor) | KIRC (normal) |
| AVPI1, HNF4A, IKBKG (tumor) | AVPI1, HNF4A, IKBKG (normal) |
 |  |
| KIRP (tumor) | KIRP (normal) |
| AVPI1, HNF4A, IKBKG (tumor) | AVPI1, HNF4A, IKBKG (normal) |
 |  |
| LIHC (tumor) | LIHC (normal) |
| AVPI1, HNF4A, IKBKG (tumor) | AVPI1, HNF4A, IKBKG (normal) |
 |  |
| LUAD (tumor) | LUAD (normal) |
| AVPI1, HNF4A, IKBKG (tumor) | AVPI1, HNF4A, IKBKG (normal) |
 |  |
| LUSC (tumor) | LUSC (normal) |
| AVPI1, HNF4A, IKBKG (tumor) | AVPI1, HNF4A, IKBKG (normal) |
 |  |
| PRAD (tumor) | PRAD (normal) |
| AVPI1, HNF4A, IKBKG (tumor) | AVPI1, HNF4A, IKBKG (normal) |
 |  |
| STAD (tumor) | STAD (normal) |
| AVPI1, HNF4A, IKBKG (tumor) | AVPI1, HNF4A, IKBKG (normal) |
 |  |
| THCA (tumor) | THCA (normal) |
| AVPI1, HNF4A, IKBKG (tumor) | AVPI1, HNF4A, IKBKG (normal) |
 |  |
| Top |
| TissGeneProg for AVPI1 |
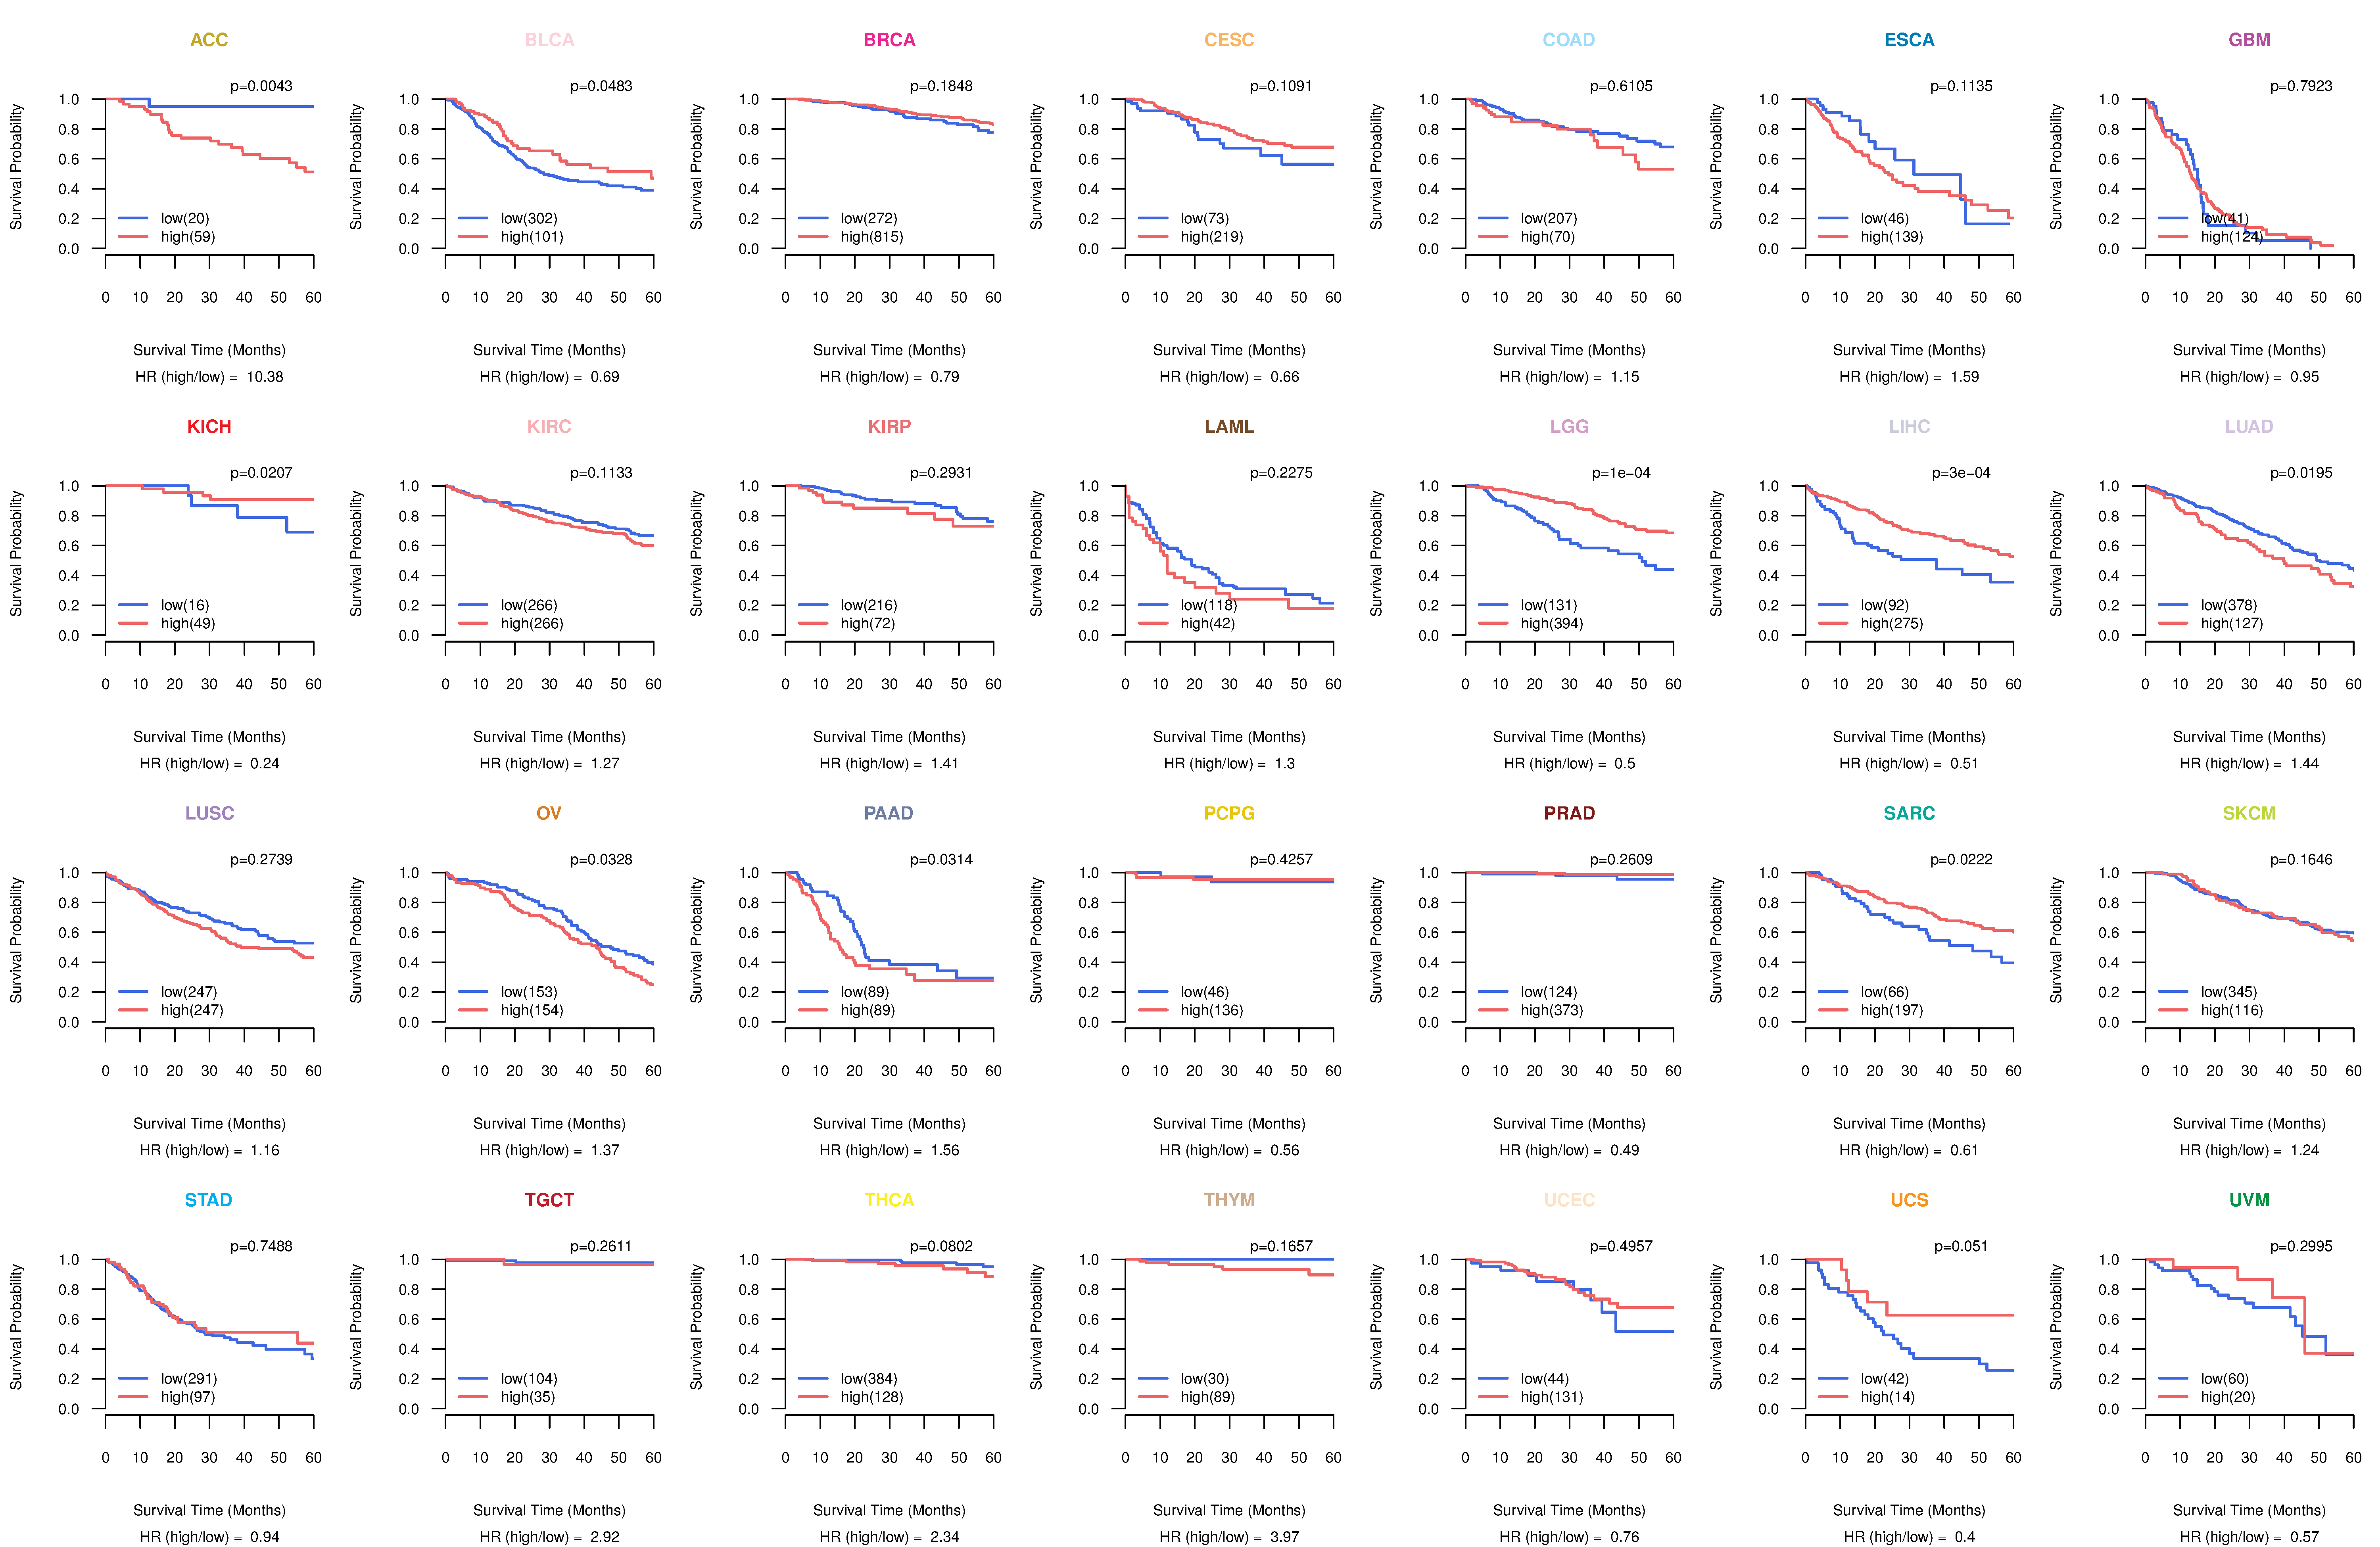
| Kaplan-Meier plots with logrank tests of overall survival (OS) using 28 cancer types (TCGA IlluminaHiSeq_RNASeqV2, pan-cancer normalized log2(norm_counts+1) data, version 2016-08-16) (TCGA clinicalMatrix, phenotype data, version 2016-04-27) * Click on the image to enlarge it in a new window. |
 |
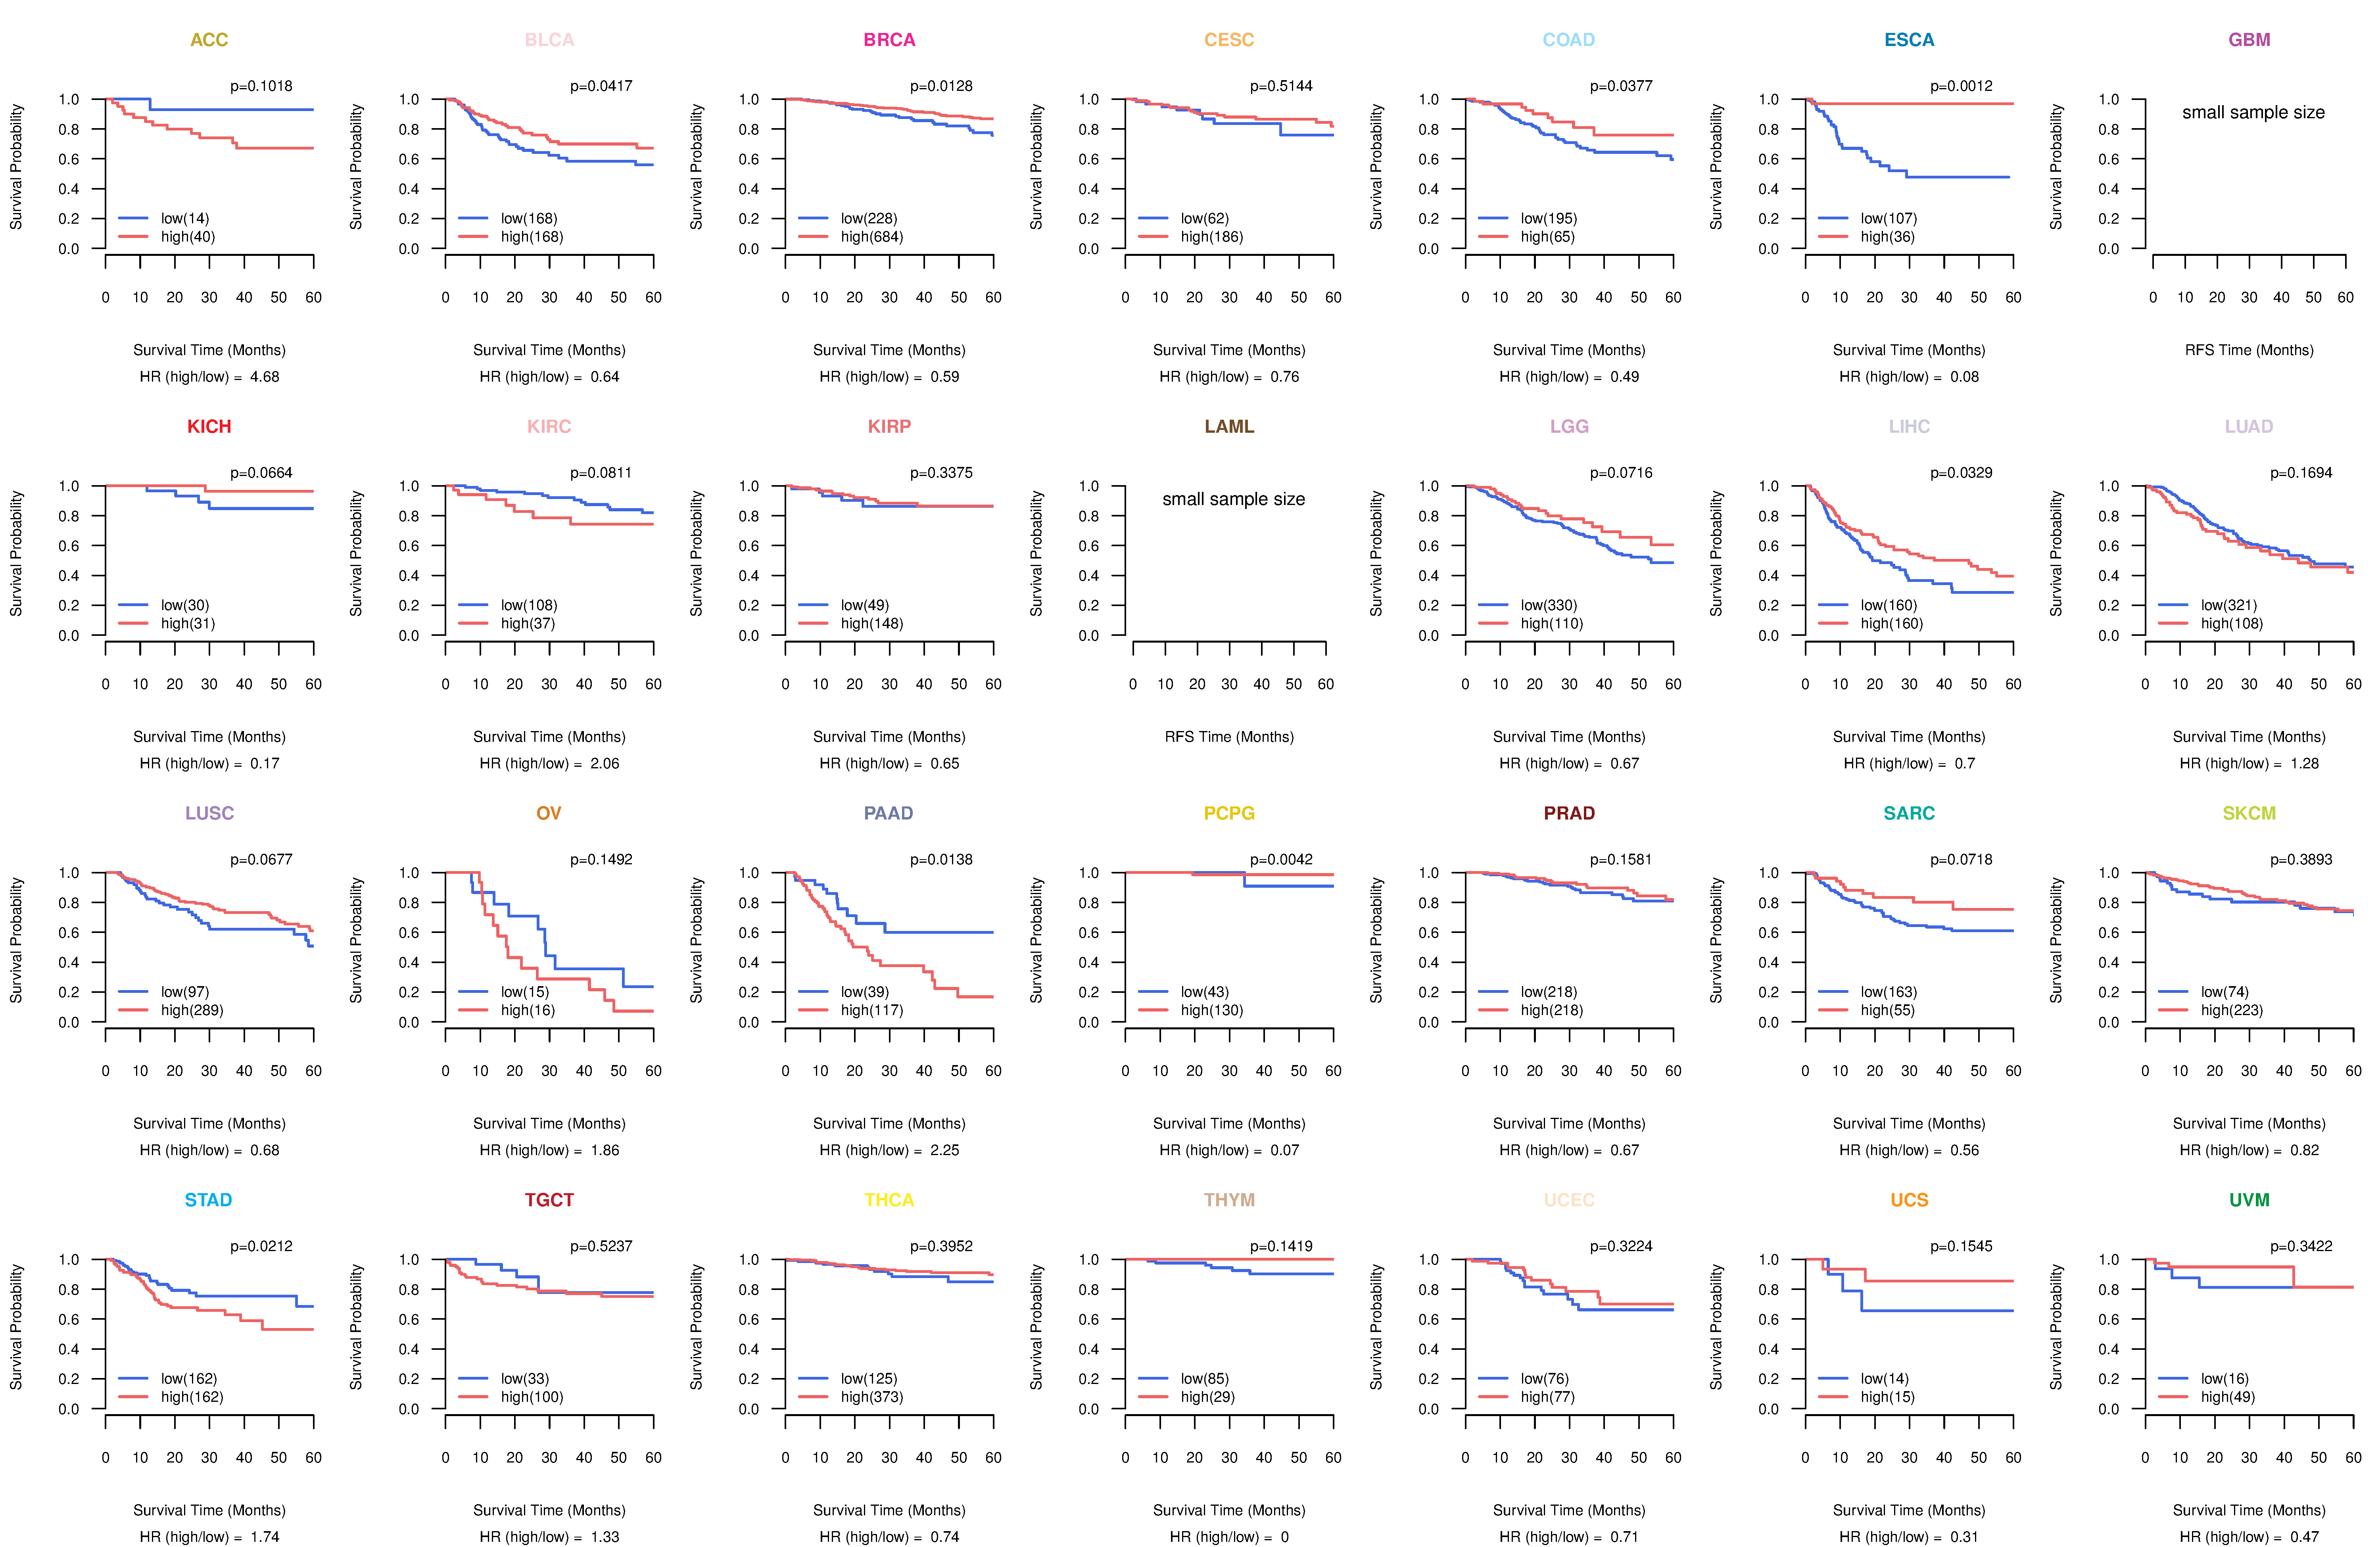
| Kaplan-Meier plots with logrank test of relapse free survival (RFS) using 28 cancer types (TCGA IlluminaHiSeq_RNASeqV2, pan-cancer normalized log2(norm_counts+1) data, version 2016-08-16) (TCGA clinicalMatrix, phenotype data, version 2016-04-27) * Click on the image enlarge it in a new window. |
 |
| Forest plot of Cox proportional hazard ratio (HR) and 95% CI of overall survival (OS) using 28 cancer types (TCGA IlluminaHiSeq_RNASeqV2, pan-cancer normalized log2(norm_counts+1) data, version 2016-08-16) (TCGA clinicalMatrix, phenotype data, version 2016-04-27) * Click on the image enlarge it in a new window. |
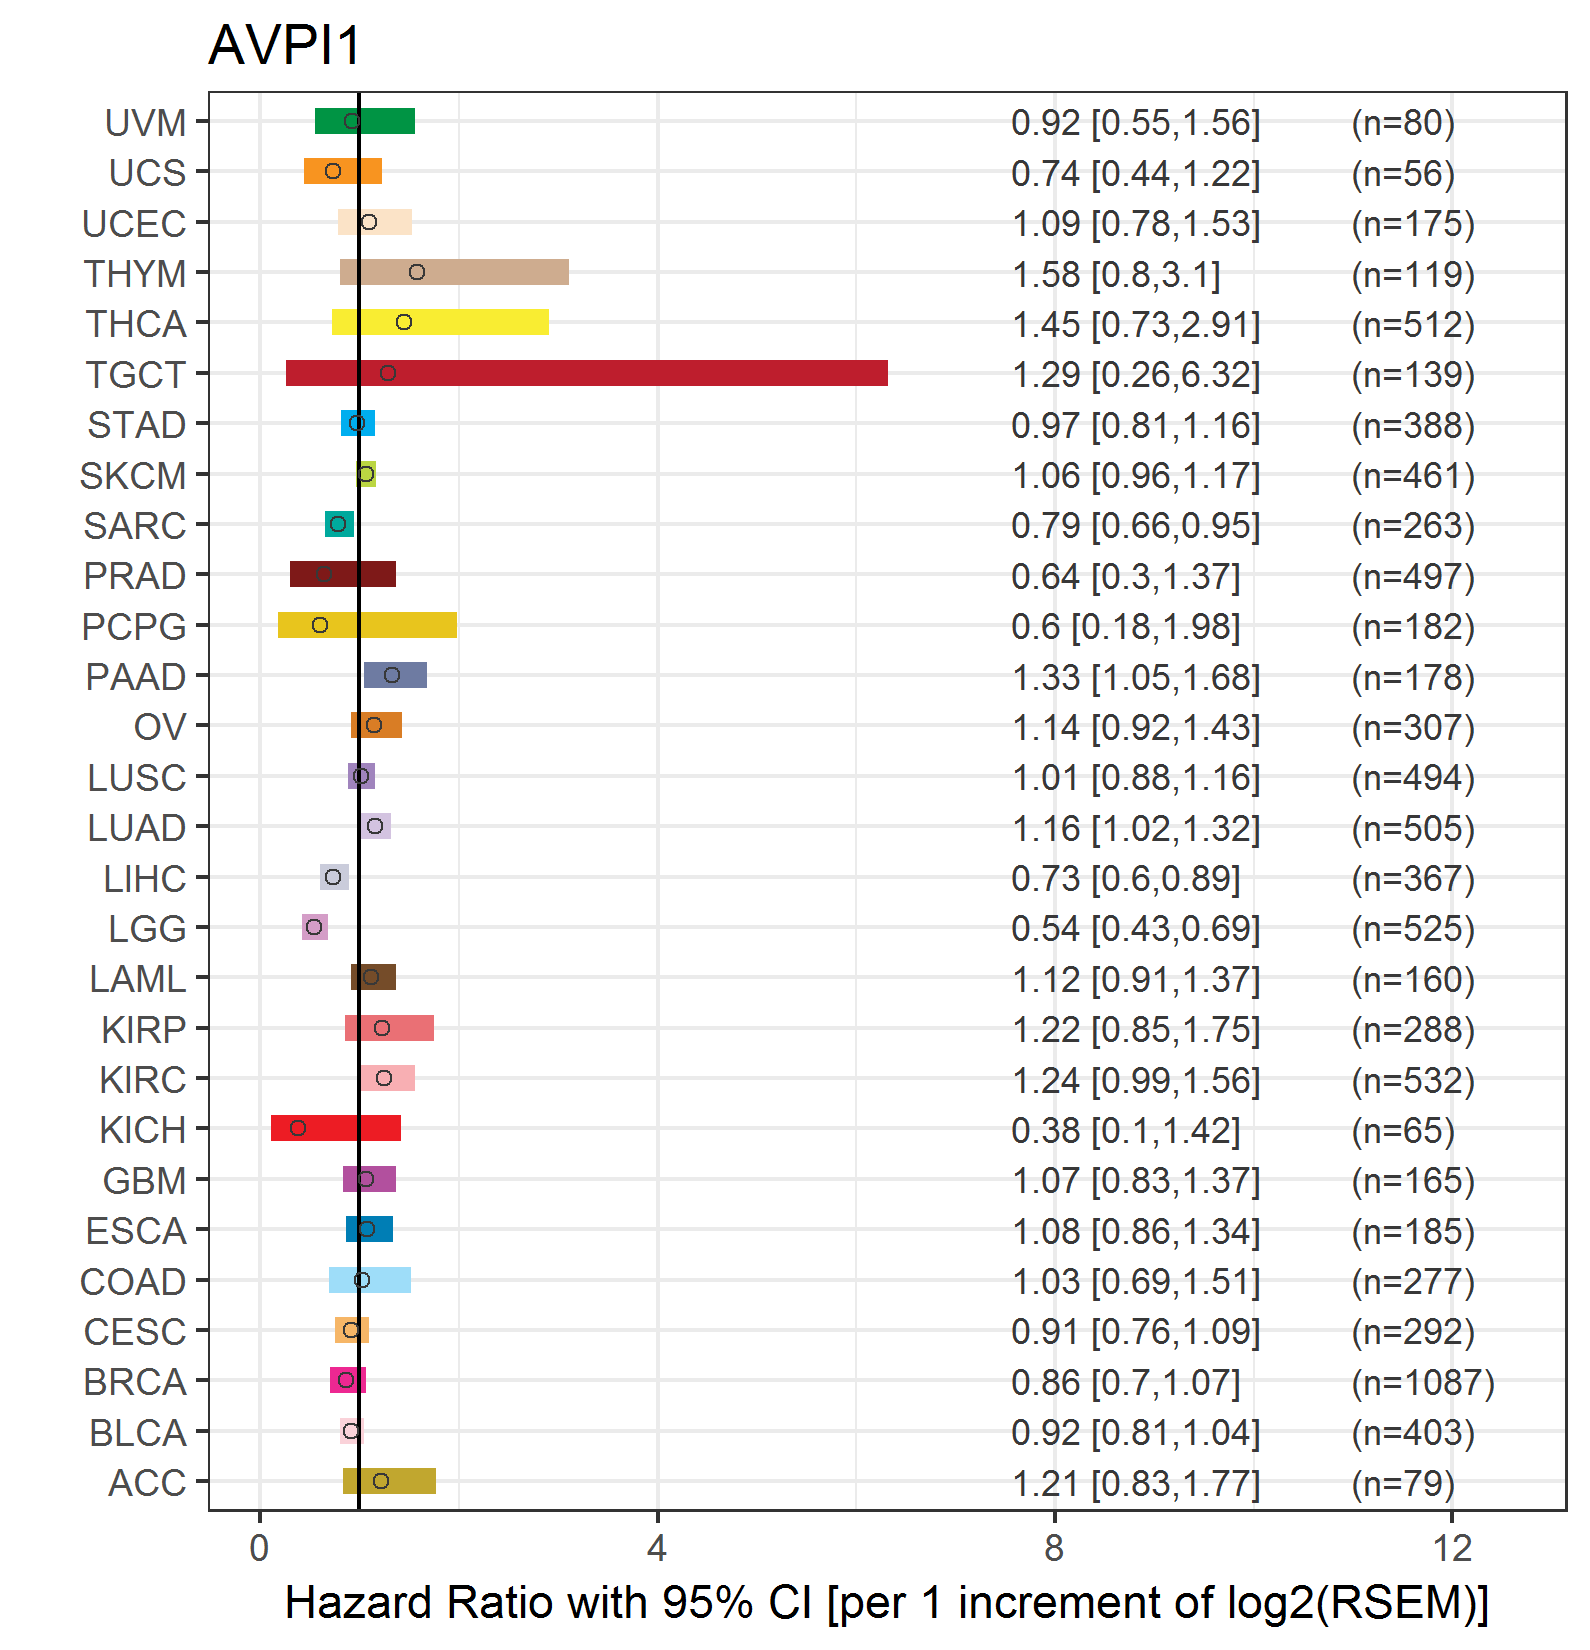 |
| Forest plot of Cox proportional hazard ratio (HR) and 95% CI of relapse free survival (RFS) using 28 cancer types (TCGA IlluminaHiSeq_RNASeqV2, pan-cancer normalized log2(norm_counts+1) data, version 2016-08-16) (TCGA clinicalMatrix, phenotype data, version 2016-04-27) * Click on the image enlarge it in a new window. |
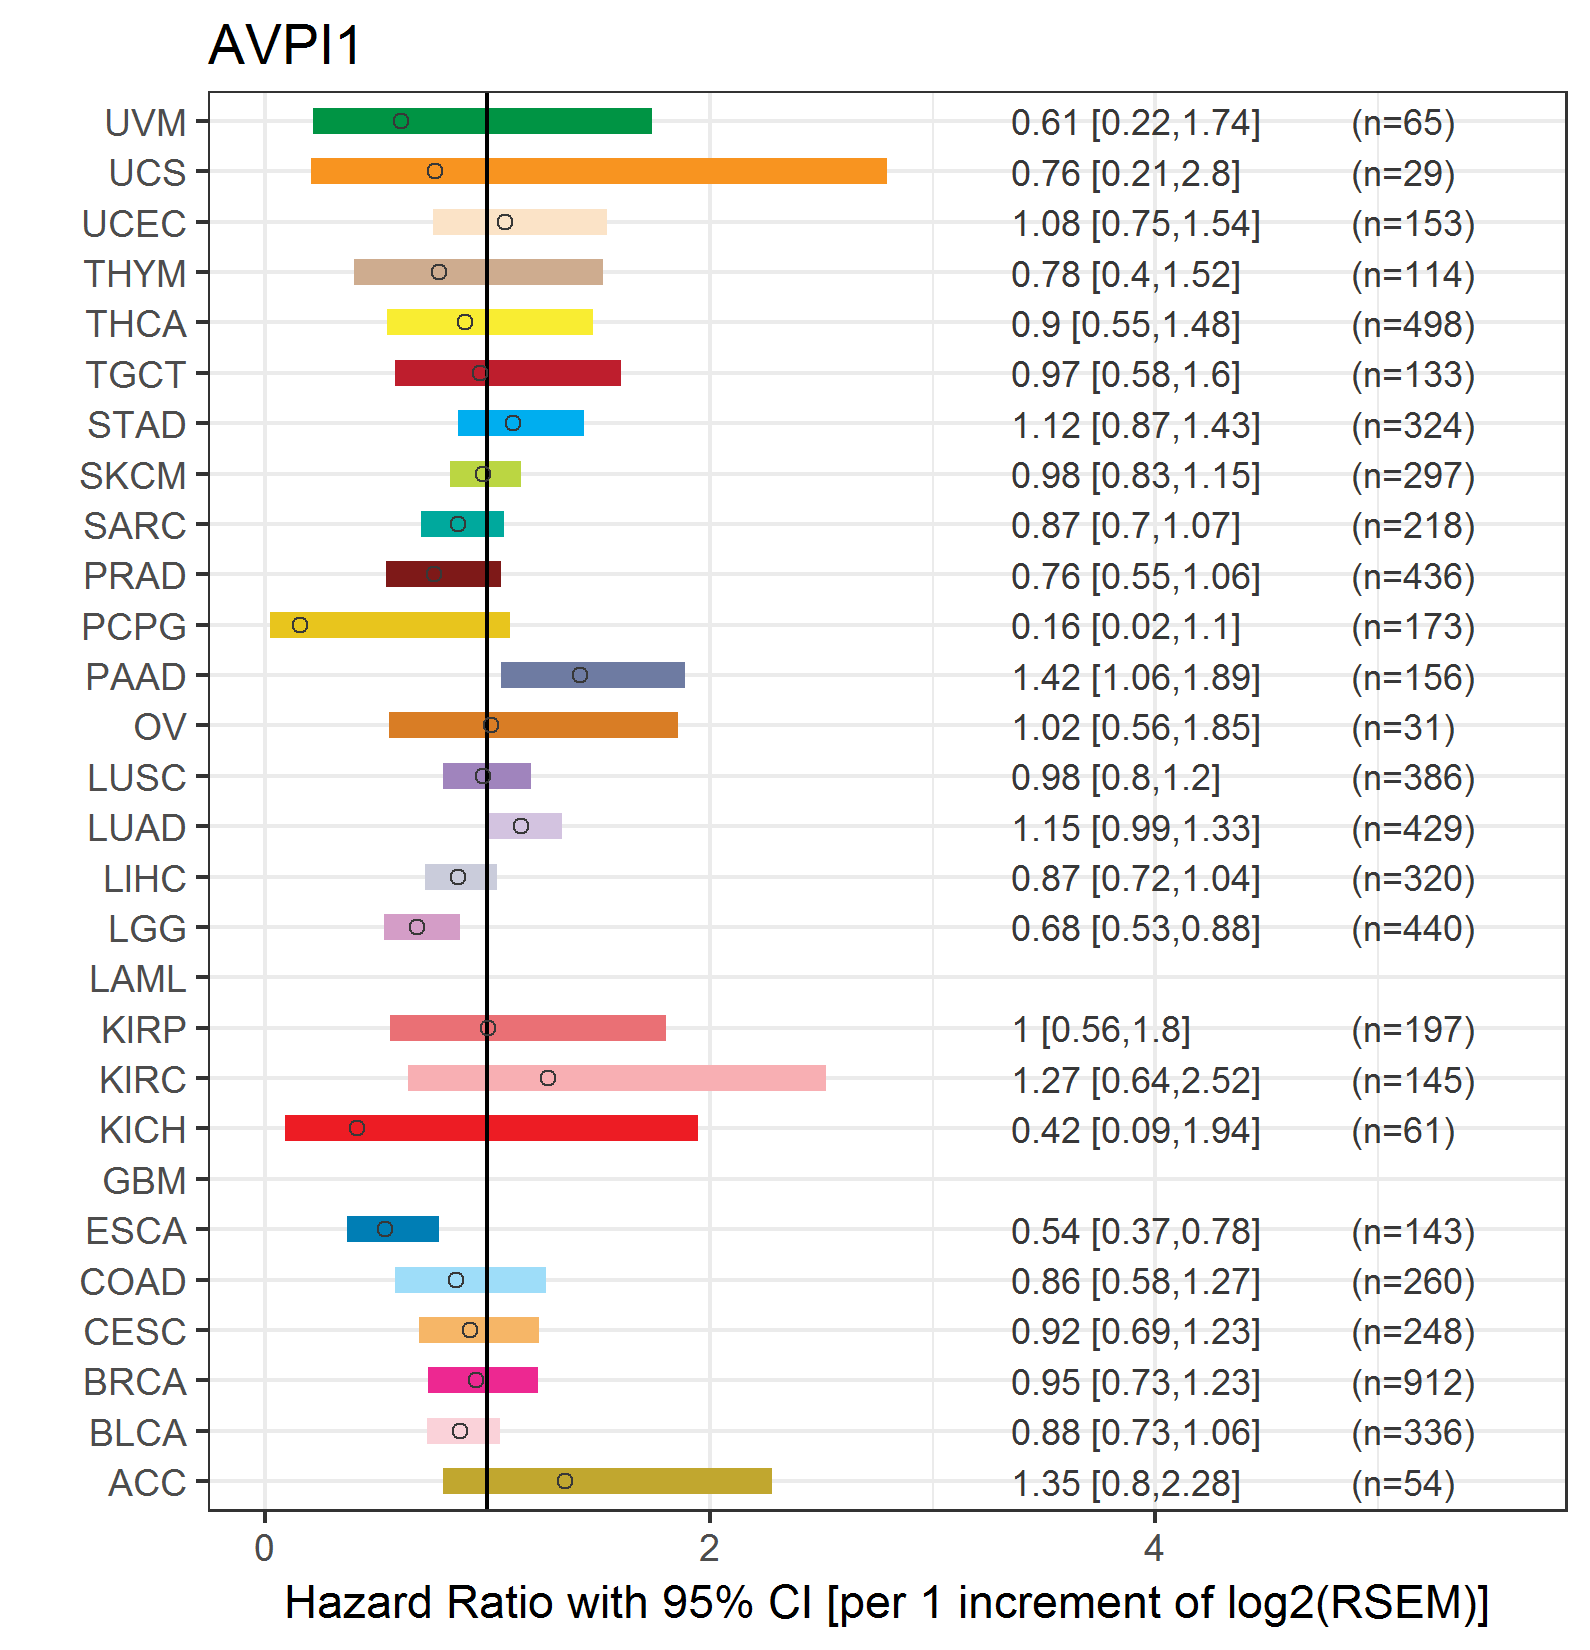 |
| Top |
| TissGeneClin for AVPI1 |
| TissGeneDrug for AVPI1 |
| Drug information targeting TissGene (DrugBank Version 5.0.6, 2017-04-01) |
| DrugBank ID | Drug name | Drug activity | Drug type | Drug status |
| Top |
| TissGeneDisease for AVPI1 |
| Disease information associated with TissGene (DisGeNet, 2016-06-01) |
| Disease ID | Disease name | # pubmeds | Source |
| umls:C1271104 | Blood pressure finding | 1 | GAD |
| umls:C1272641 | Systemic arterial pressure | 1 | GAD |
|
Copyright 2016-Present - The University of Texas Health Science Center at Houston (UTHealth) Web File Viewing | How to Report, Fraud, Waste and Abuse | State of Texas | Statewide Search | Texas Homeland Security | Site Policies |