 |
| |
| |
| |
| |
| |
| |
|

| TissGeneSummary for HAPLN2 |
 Gene summary Gene summary |
| Basic gene information | Gene symbol | HAPLN2 |
| Gene name | hyaluronan and proteoglycan link protein 2 | |
| Synonyms | BRAL1 | |
| Cytomap | UCSC genome browser: 1q23.1 | |
| Type of gene | protein-coding | |
| RefGenes | NM_021817.2, | |
| Description | brain link protein 1brain link protein-1 | |
| Modification date | 20141207 | |
| dbXrefs | HGNC : HGNC | |
| Ensembl : ENSG00000132702 | ||
| HPRD : 17088 | ||
| Vega : OTTHUMG00000033205 | ||
| Protein | UniProt: go to UniProt's Cross Reference DB Table | |
| Expression | CleanEX: HS_HAPLN2 | |
| BioGPS: 60484 | ||
| Pathway | NCI Pathway Interaction Database: HAPLN2 | |
| KEGG: HAPLN2 | ||
| REACTOME: HAPLN2 | ||
| Pathway Commons: HAPLN2 | ||
| Context | iHOP: HAPLN2 | |
| ligand binding site mutation search in PubMed: HAPLN2 | ||
| UCL Cancer Institute: HAPLN2 | ||
| Assigned class in TissGDB* | C | |
| Included tissue-specific gene expression resources | HPA,TiGER | |
| Specific-tissues in normal samples (assigned by TissGDB using HPA, TiGER, and GTEx) | Brain | |
| Cancer types related to the specific-tissues in cancer samples (assigned by TissGDB using TCGA) | GBM,LGG | |
| Reference showing the relevant tissue of HAPLN2 | ||
| Description by TissGene annotations | High usage of specific isoform TissgsKTS | |
| * Class A consists of genes with literature evidence and is part of the cTissGenes. Class B consists of only cTissGenes without additional evidence. The remaining genes belong to Class C. |
| Gene ontology having evidence of Inferred from Direct Assay (IDA) from Entrez |
| GO ID | GO term | PubMed ID |
| Top |
| TissGeneExp for HAPLN2 |
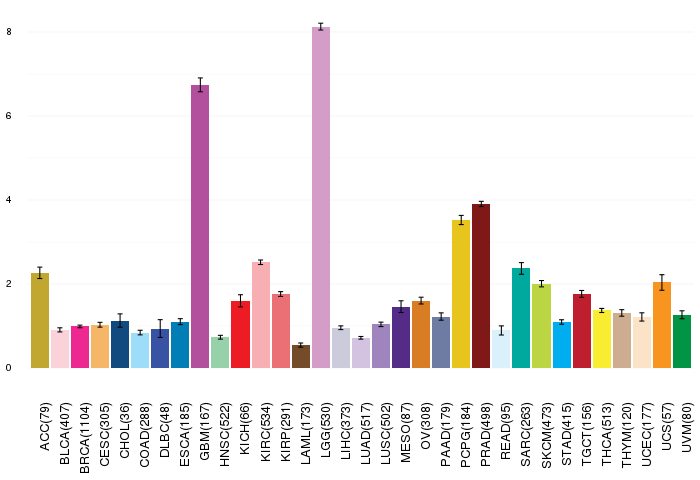
| Gene expressions across 28 cancer types (X-axis: cancer type and Y-axis: log2(norm_counts+1)) (TCGA IlluminaHiSeq_RNASeqV2, pan-cancer normalized log2(norm_counts+1) data, version 2016-08-16) |
 |
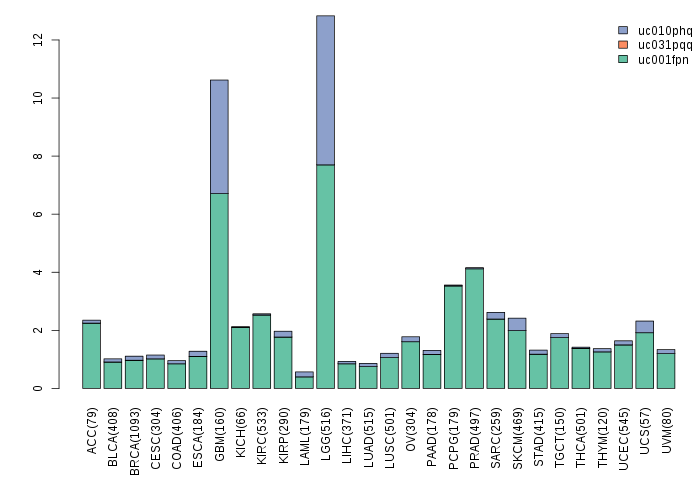
| Gene isoform expressions across 28 cancer types (X-axis: cancer type and Y-axis: log2(norm_counts+1)) (TCGA pan-cancer tcga_rsem_isoform_tpm, version 2016-09-01) |
 |
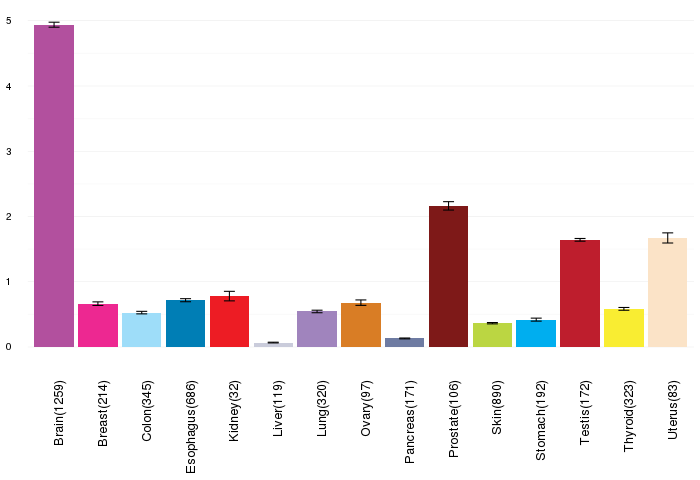
| Gene expressions across normal tissues of GTEx data (GTEx GTEx_Analysis_v6_RNA-seq_RNA-SeQCv1.1.8_gene_rpkm.gct) - Here, we shows the matched tissue types only among our 28 cancer types. |
 |
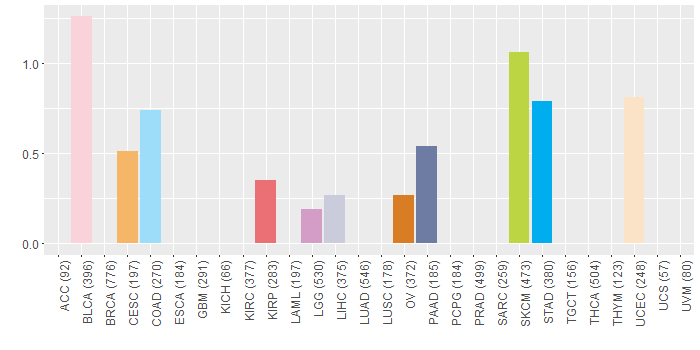
| Different expressions across 14 cancer types with more than 10 samples between matched tumors and normals (X-axis: cancer type and Y-axis: log2(norm_counts+1)) (TCGA IlluminaHiSeq_RNASeqV2, pan-cancer normalized log2(norm_counts+1) data, version 2016-08-16) |
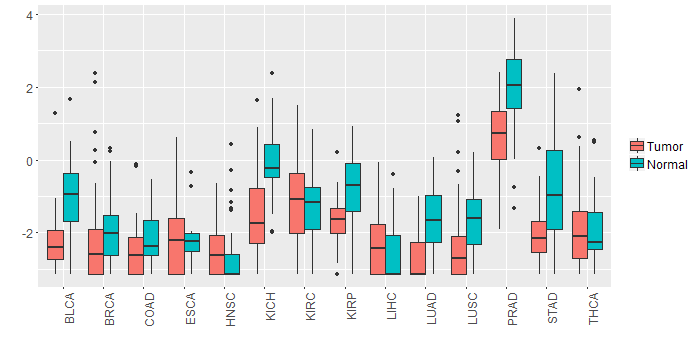 |
| - Significantly differentially expressed cancer types and information. (|Fold change|>1 and FDR<0.05) |
| Cancer type | Mean(exp) in tumor | Mean(exp) in matched normal | Log2FC | P-val. | FDR |
| PRAD | 0.60470266 | 1.995316122 | -1.390613462 | 1.14E-09 | 1.77E-08 |
| BLCA | -2.159871834 | -0.958571834 | -1.2013 | 0.00135 | 0.009209816 |
| STAD | -2.019632195 | -0.928913445 | -1.09071875 | 0.000534 | 0.003185586 |
| KICH | -1.44061057 | -0.08042657 | -1.360184 | 0.000132 | 0.000335945 |
| Top |
| TissGene-miRNA for HAPLN2 |
| Significantly anti-correlated miRNAs of TissGene across 28 cancer types (Gene-miRNA relations from TargetScanHuman Relsease 7.1, Conserved_Site_Context_Scores.txt.zip, 06.01.2016) (TCGA IlluminaHiSeq_miRNASeq, log2(RPM+1) data, version 2016-11-21) (TCGA IlluminaHiSeq_RNASeqV2, log2(normalized_count+1) data, version 2016-08-16) (Spearman’s Rank Correlation (p-value<0.05 and coefficient<-0.25)) |
| Cancer type | miRNA id | miRNA accession | P-val. | Coeff. | # samples |
| Top |
| TissGeneMut for HAPLN2 |
| TissGeneSNV for HAPLN2 |
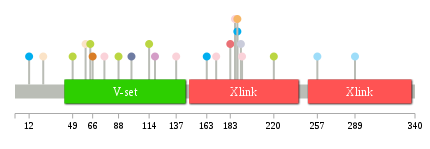
| nsSNV counts per each loci. Different colors of circles represent different cancer types. Circle size denotes number of samples. (TCGA somatic mutation (SNPs and small INDELs) data, version 2016-04-25) * Click on the image to enlarge it in a new window. |
 |
 |
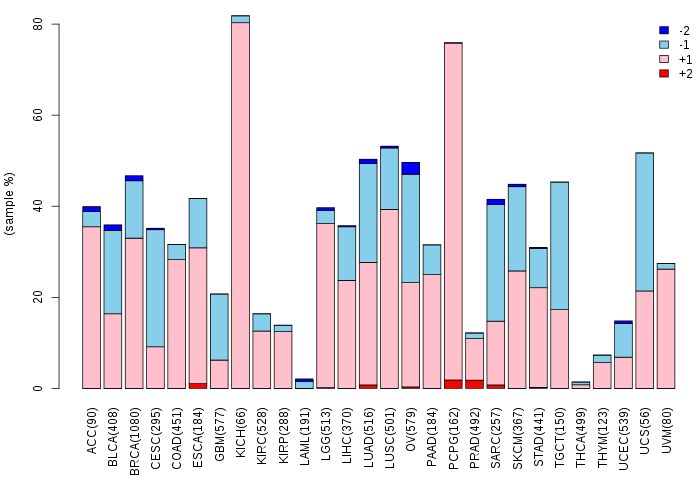
| Somatic nucleotide variants of TissGene across 28 cancer types (X-axis: cancer type and Y-axis: % of mutated samples) The numbers in parentheses are numbers of samples with mutation (nsSNVs). (TCGA somatic mutation (SNPs and small INDELs) data, version 2016-04-25) |
 |
| - nsSNVs sorted by frequency. |
| AAchange | Cancer type | # samples |
| p.G88E | SKCM | 1 |
| p.P64S | SKCM | 1 |
| p.V139L | DLBC | 1 |
| p.L183V | KIRP | 1 |
| p.T257M | COAD | 1 |
| p.Y66* | OV | 1 |
| p.R220Q | SKCM | 1 |
| p.E137K | BLCA | 1 |
| p.G60V | UCEC | 1 |
| p.V114I | SKCM | 1 |
| p.E171K | BLCA | 1 |
| p.A24T | UCEC | 1 |
| p.Q289H | COAD | 1 |
| p.G76A | BLCA | 1 |
| p.D192G | LIHC | 1 |
| p.D192H | HNSC | 1 |
| p.R49C | SKCM | 1 |
| p.R12H | STAD | 1 |
| p.W187* | BLCA | 1 |
| p.E189D | STAD | 1 |
| p.W193* | BLCA | 1 |
| p.G99W | PAAD | 1 |
| p.Y163H | STAD | 1 |
| p.E189Q | CESC | 1 |
| p.R119C | LGG | 1 |
| Top |
| TissGeneCNV for HAPLN2 |
| Copy number variations of TissGene across 28 cancer types (X-axis: cancer type and Y-axis: % of CNV samples) (TCGA Gistic2_CopyNumber_Gistic2_all_data_by_genes, Gistic2 copy number data, version 2016-08-16) |
 |
| Top |
| TissGeneFusions for HAPLN2 |
| Fusion genes including TissGene (ChimerDB 3.0, 2016-12-01 and TCGA fusion Portal 2015-12-01) |
| Database | Src | Cancer type | Sample | Fusion gene | ORF | 5'-gene BP | 3'-gene BP |
| Chimerdb3.0 | ChiTaRs | NA | BF931070 | HAPLN2-HAPLN2 | chr1:156589612 | chr1:156589705 | |
| Chimerdb3.0 | ChiTaRs | NA | DA270267 | HAPLN2-MBP | chr1:156593369 | chr18:74692405 | |
| Chimerdb3.0 | FusionScan | BRCA | TCGA-BH-A0BZ-01A | PRCC-HAPLN2 | CDS-5'UTR | chr1:156738031 | chr1:156593258 |
| TCGAfusionPortal | PRADA | BRCA | TCGA-BH-A0BZ-01A | PRCC-HAPLN2 | CDS-5UTR | Chr1:156738031 | Chr1:156593259 |
| Top |
| TissGeneNet for HAPLN2 |
| Co-expressed gene networks based on protein-protein interaction data (CePIN) (TCGA IlluminaHiSeq_RNASeqV2, pan-cancer normalized log2(norm_counts+1) data, version 2016-08-16) (PINA2 ppi data) |
| Top |
| TissGeneProg for HAPLN2 |
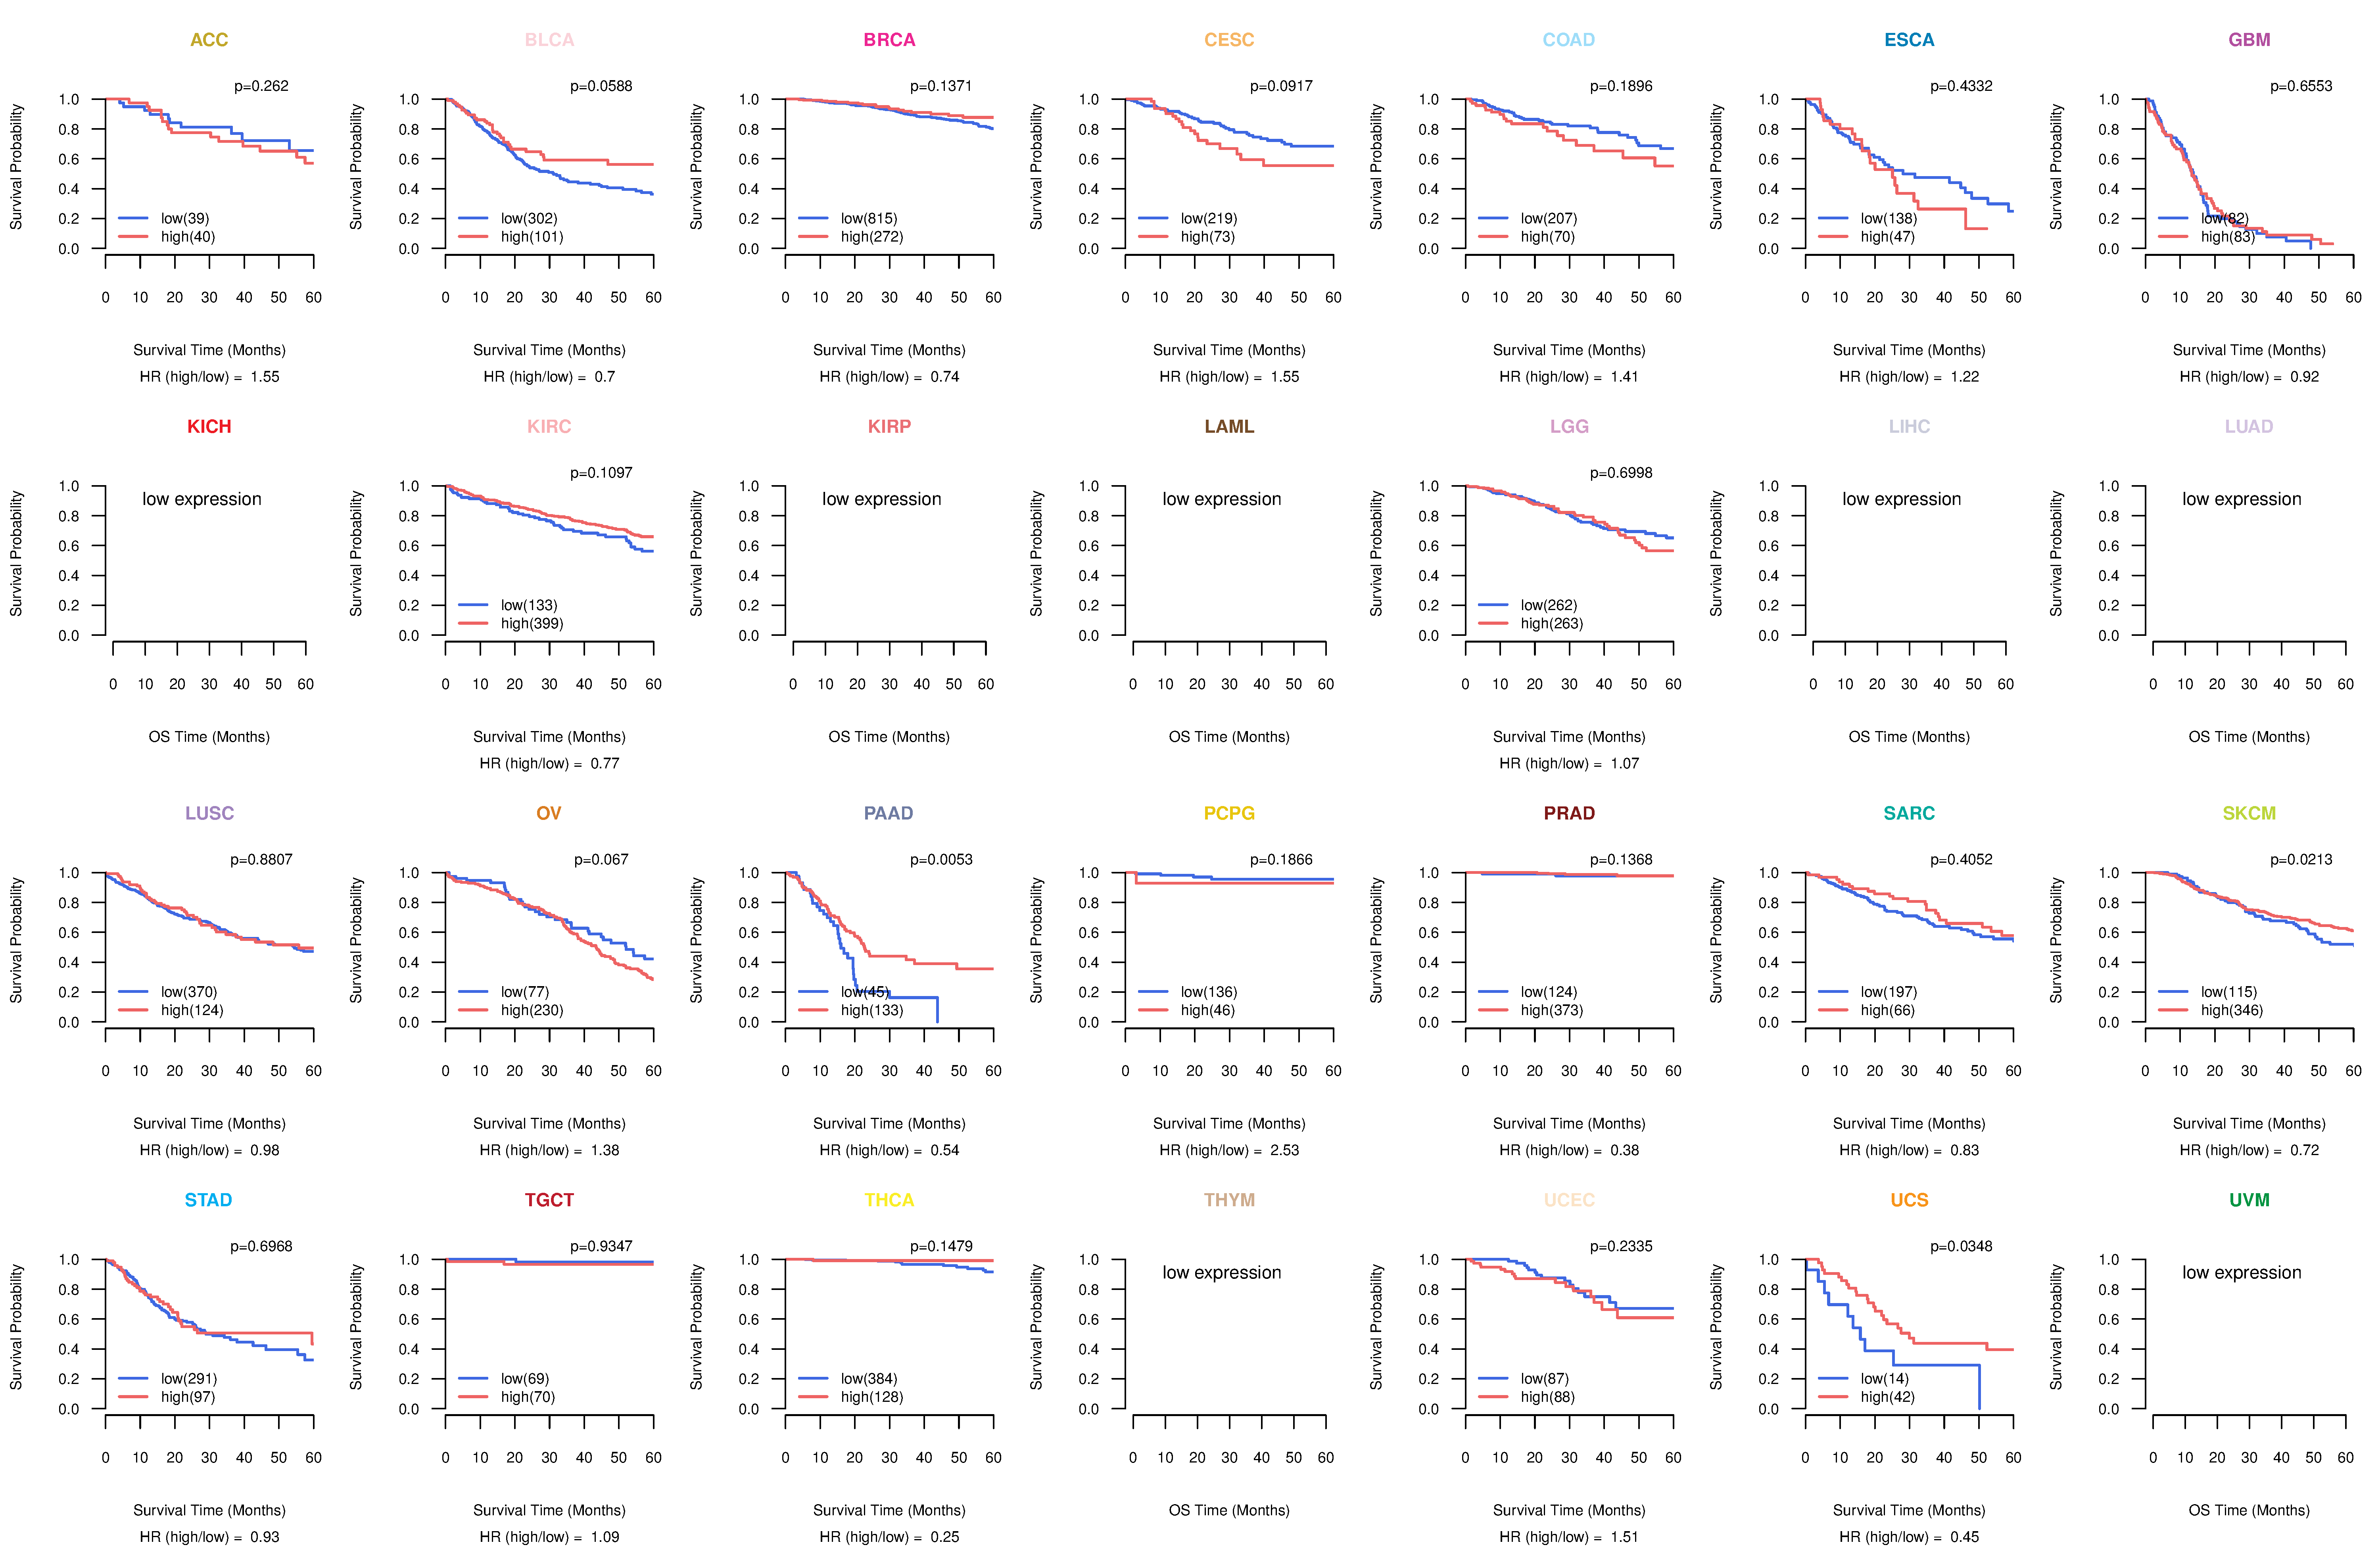
| Kaplan-Meier plots with logrank tests of overall survival (OS) using 28 cancer types (TCGA IlluminaHiSeq_RNASeqV2, pan-cancer normalized log2(norm_counts+1) data, version 2016-08-16) (TCGA clinicalMatrix, phenotype data, version 2016-04-27) * Click on the image to enlarge it in a new window. |
 |
| Kaplan-Meier plots with logrank test of relapse free survival (RFS) using 28 cancer types (TCGA IlluminaHiSeq_RNASeqV2, pan-cancer normalized log2(norm_counts+1) data, version 2016-08-16) (TCGA clinicalMatrix, phenotype data, version 2016-04-27) * Click on the image enlarge it in a new window. |
 |
| Forest plot of Cox proportional hazard ratio (HR) and 95% CI of overall survival (OS) using 28 cancer types (TCGA IlluminaHiSeq_RNASeqV2, pan-cancer normalized log2(norm_counts+1) data, version 2016-08-16) (TCGA clinicalMatrix, phenotype data, version 2016-04-27) * Click on the image enlarge it in a new window. |
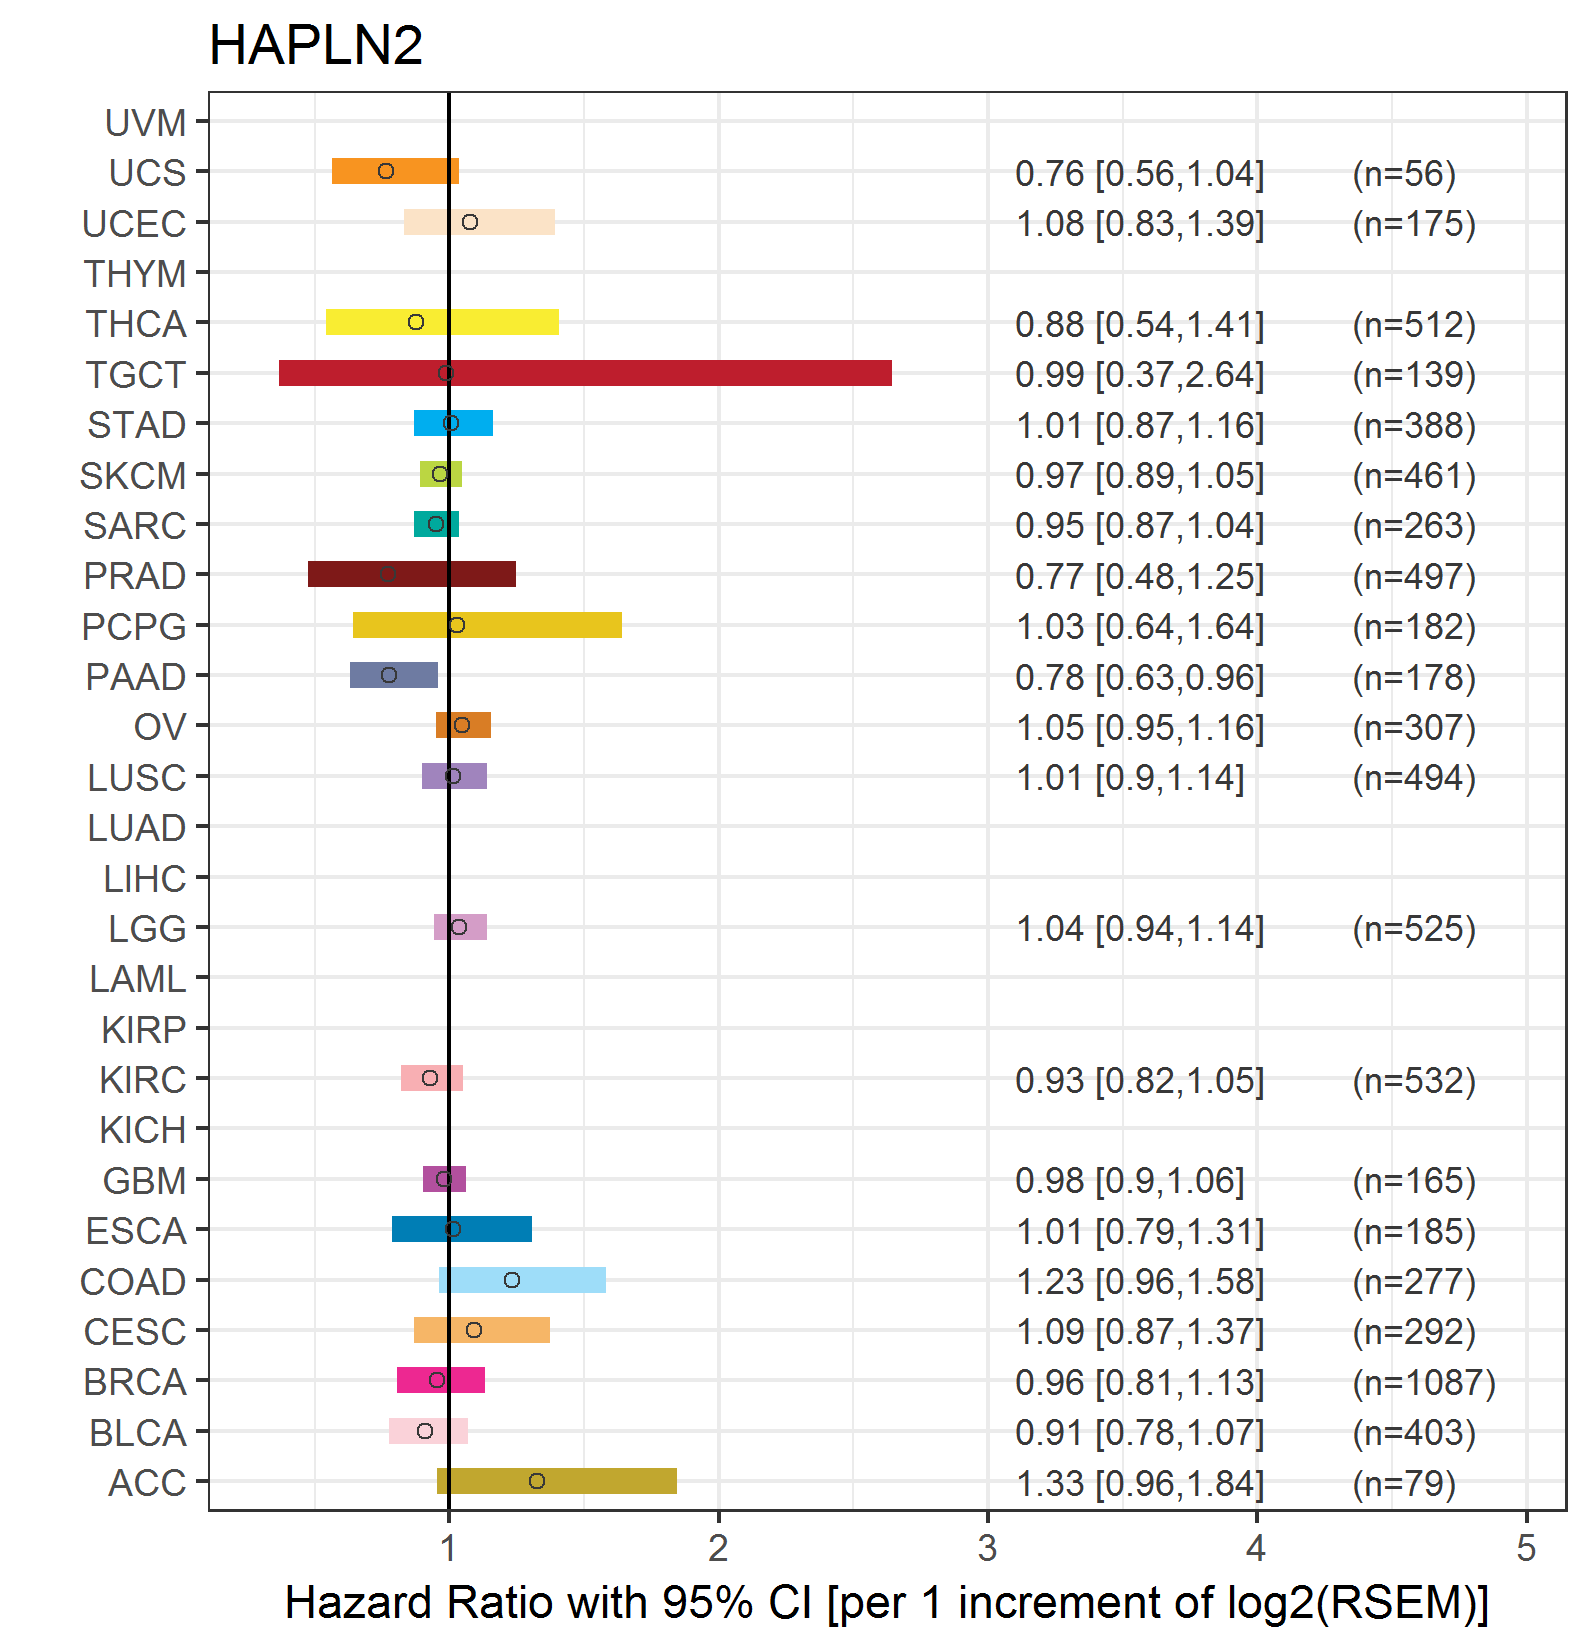 |
| Forest plot of Cox proportional hazard ratio (HR) and 95% CI of relapse free survival (RFS) using 28 cancer types (TCGA IlluminaHiSeq_RNASeqV2, pan-cancer normalized log2(norm_counts+1) data, version 2016-08-16) (TCGA clinicalMatrix, phenotype data, version 2016-04-27) * Click on the image enlarge it in a new window. |
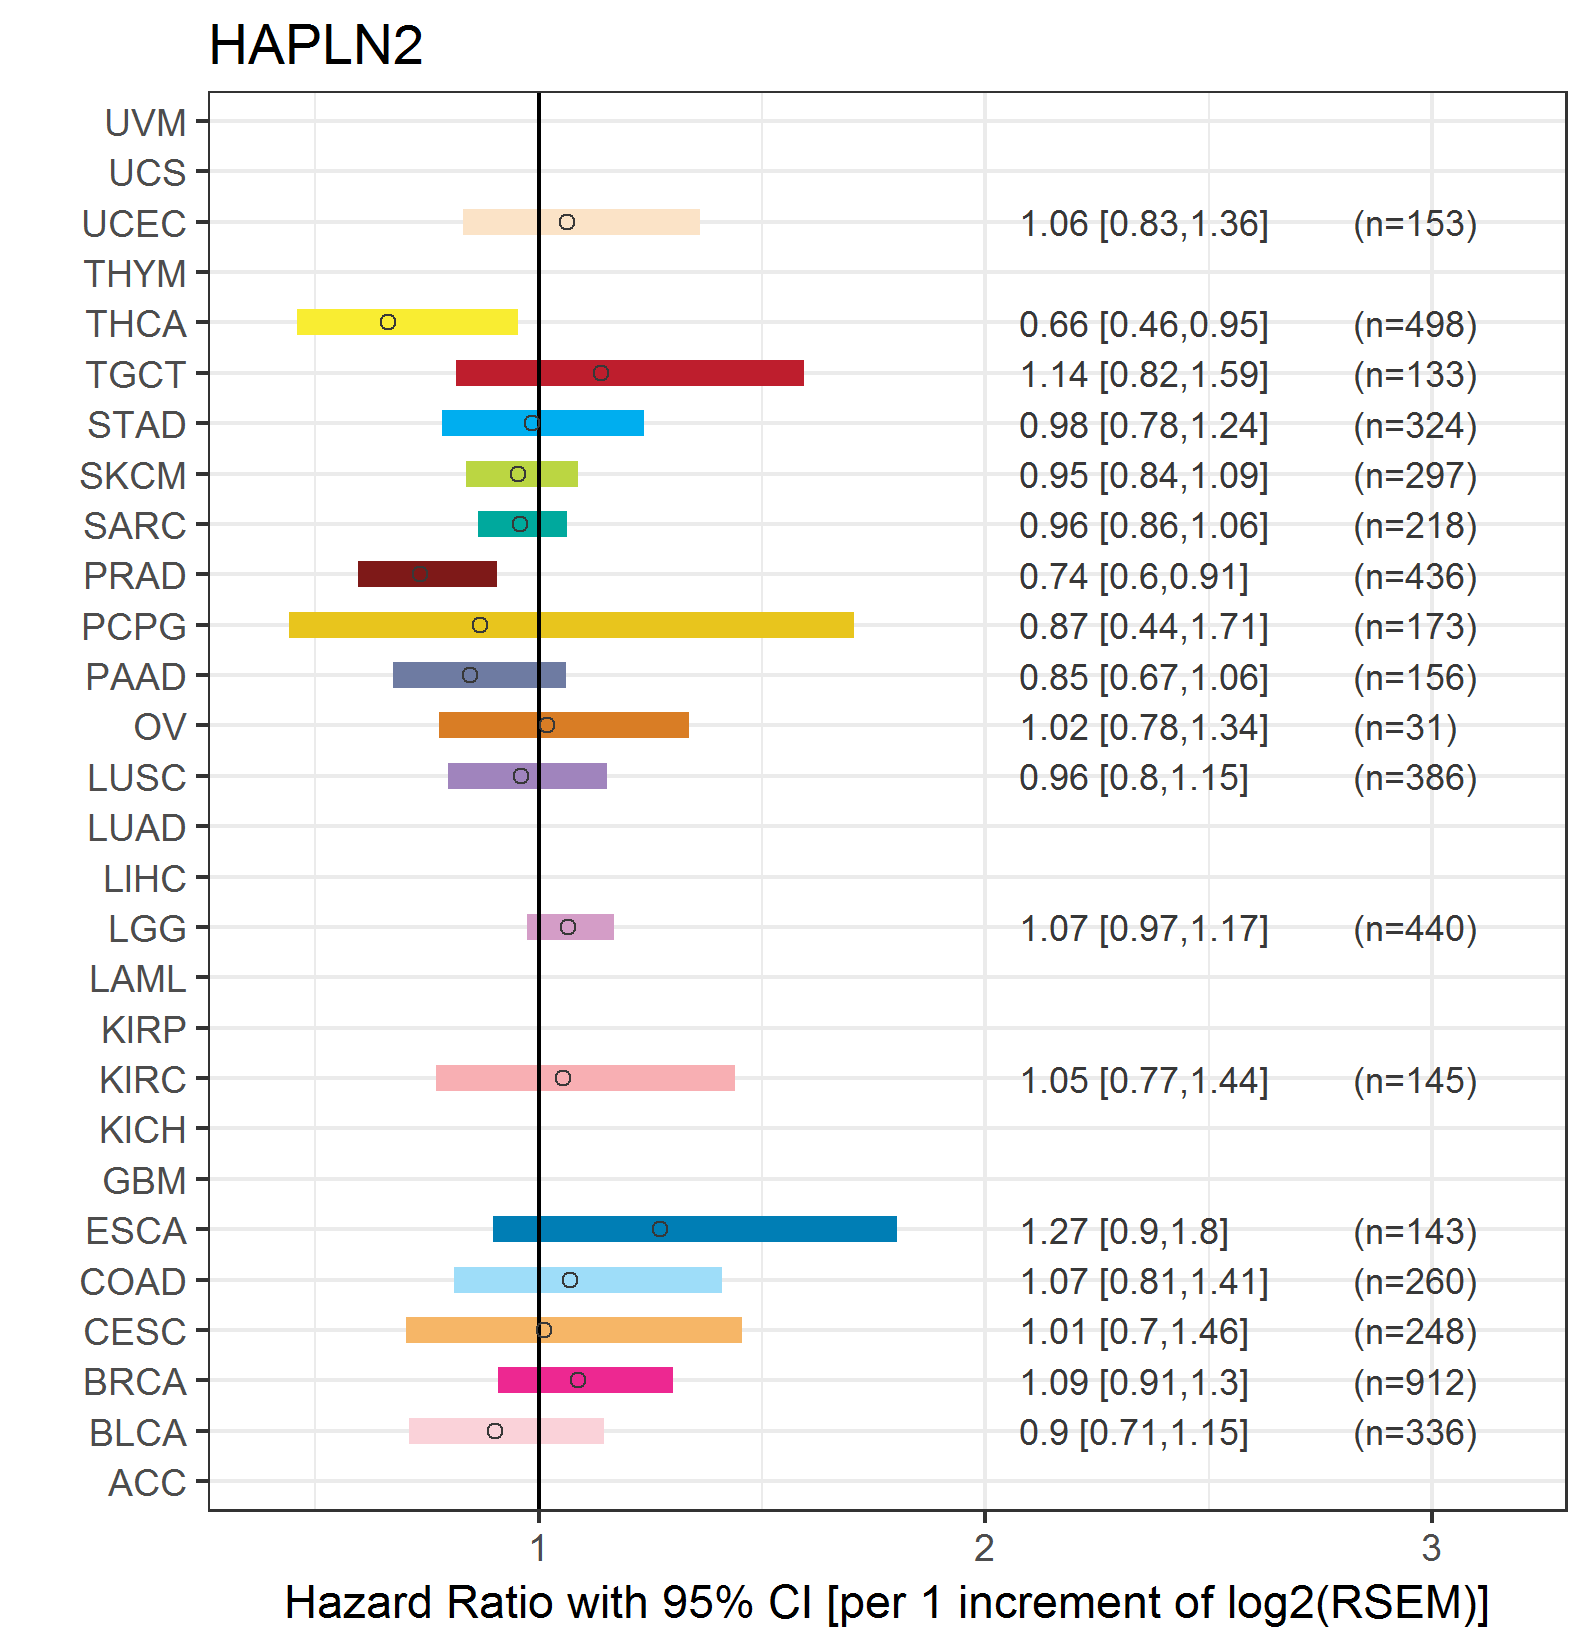 |
| Top |
| TissGeneClin for HAPLN2 |
| TissGeneDrug for HAPLN2 |
| Drug information targeting TissGene (DrugBank Version 5.0.6, 2017-04-01) |
| DrugBank ID | Drug name | Drug activity | Drug type | Drug status |
| Top |
| TissGeneDisease for HAPLN2 |
| Disease information associated with TissGene (DisGeNet, 2016-06-01) |
| Disease ID | Disease name | # pubmeds | Source |
| umls:C0036341 | Schizophrenia | 1 | LHGDN |
|
Copyright 2016-Present - The University of Texas Health Science Center at Houston (UTHealth) Web File Viewing | How to Report, Fraud, Waste and Abuse | State of Texas | Statewide Search | Texas Homeland Security | Site Policies |