 |
| |
| |
| |
| |
| |
| |
|

| TissGeneSummary for S100P |
 Gene summary Gene summary |
| Basic gene information | Gene symbol | S100P |
| Gene name | S100 calcium binding protein P | |
| Synonyms | MIG9 | |
| Cytomap | UCSC genome browser: 4p16 | |
| Type of gene | protein-coding | |
| RefGenes | NM_005980.2, | |
| Description | S100 calcium-binding protein Pmigration-inducing gene 9 proteinprotein S100-Eprotein S100-P | |
| Modification date | 20141207 | |
| dbXrefs | MIM : 600614 | |
| HGNC : HGNC | ||
| HPRD : 02792 | ||
| Protein | UniProt: go to UniProt's Cross Reference DB Table | |
| Expression | CleanEX: HS_S100P | |
| BioGPS: 6286 | ||
| Pathway | NCI Pathway Interaction Database: S100P | |
| KEGG: S100P | ||
| REACTOME: S100P | ||
| Pathway Commons: S100P | ||
| Context | iHOP: S100P | |
| ligand binding site mutation search in PubMed: S100P | ||
| UCL Cancer Institute: S100P | ||
| Assigned class in TissGDB* | C | |
| Included tissue-specific gene expression resources | ||
| Specific-tissues in normal samples (assigned by TissGDB using HPA, TiGER, and GTEx) | Stomach | |
| Cancer types related to the specific-tissues in cancer samples (assigned by TissGDB using TCGA) | STAD | |
| Reference showing the relevant tissue of S100P | ||
| Description by TissGene annotations | Cancer gene Fused withTSGene | |
| * Class A consists of genes with literature evidence and is part of the cTissGenes. Class B consists of only cTissGenes without additional evidence. The remaining genes belong to Class C. |
| Gene ontology having evidence of Inferred from Direct Assay (IDA) from Entrez |
| GO ID | GO term | PubMed ID |
| Top |
| TissGeneExp for S100P |
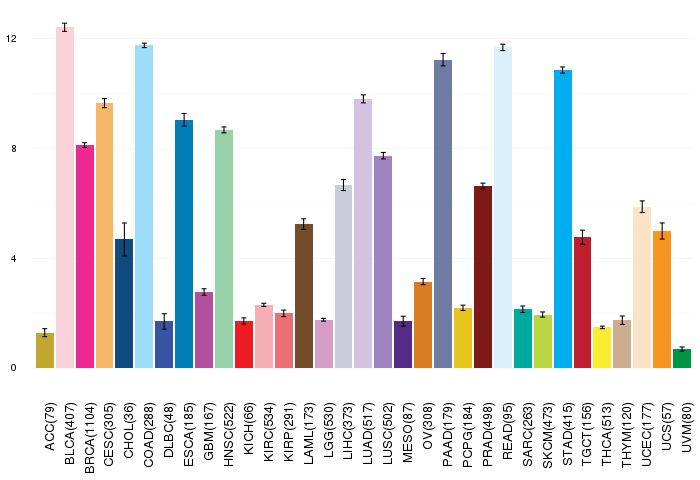
| Gene expressions across 28 cancer types (X-axis: cancer type and Y-axis: log2(norm_counts+1)) (TCGA IlluminaHiSeq_RNASeqV2, pan-cancer normalized log2(norm_counts+1) data, version 2016-08-16) |
 |
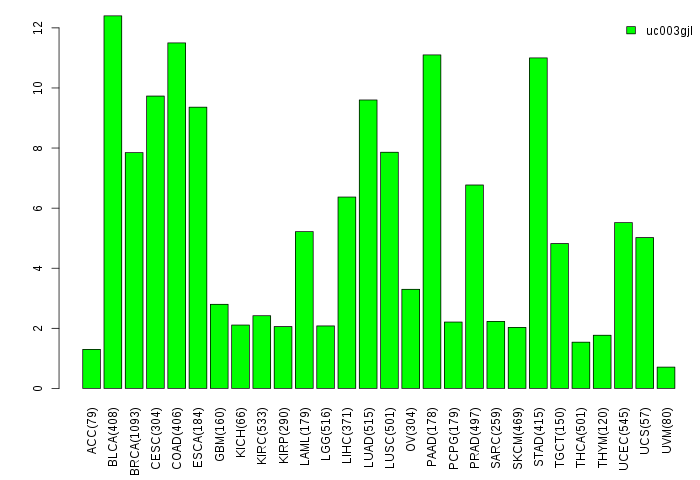
| Gene isoform expressions across 28 cancer types (X-axis: cancer type and Y-axis: log2(norm_counts+1)) (TCGA pan-cancer tcga_rsem_isoform_tpm, version 2016-09-01) |
 |
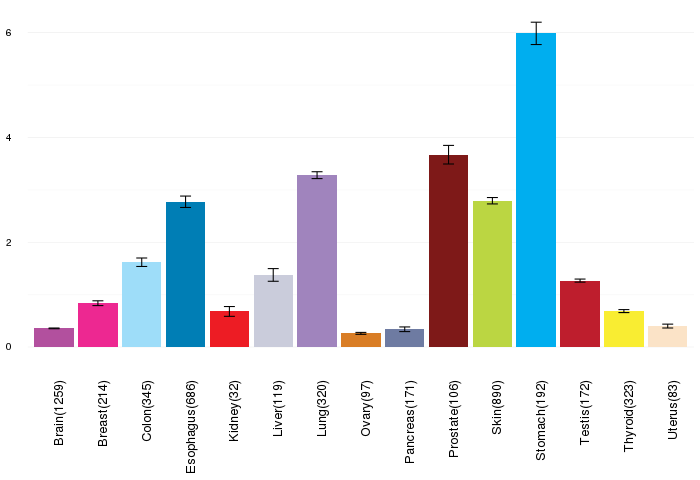
| Gene expressions across normal tissues of GTEx data (GTEx GTEx_Analysis_v6_RNA-seq_RNA-SeQCv1.1.8_gene_rpkm.gct) - Here, we shows the matched tissue types only among our 28 cancer types. |
 |
| Different expressions across 14 cancer types with more than 10 samples between matched tumors and normals (X-axis: cancer type and Y-axis: log2(norm_counts+1)) (TCGA IlluminaHiSeq_RNASeqV2, pan-cancer normalized log2(norm_counts+1) data, version 2016-08-16) |
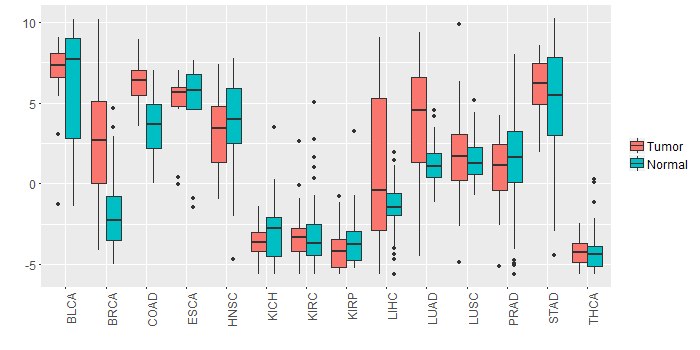 |
| - Significantly differentially expressed cancer types and information. (|Fold change|>1 and FDR<0.05) |
| Cancer type | Mean(exp) in tumor | Mean(exp) in matched normal | Log2FC | P-val. | FDR |
| LUAD | 3.954164419 | 1.167393729 | 2.78677069 | 9.47E-08 | 3.72E-07 |
| COAD | 6.223253809 | 3.724503809 | 2.49875 | 4.92E-07 | 2.98E-06 |
| BRCA | 2.489818653 | -1.902143627 | 4.391962281 | 1.13E-27 | 1.29E-26 |
| LIHC | 0.882581039 | -1.359002961 | 2.241584 | 0.00107 | 0.002908776 |
| Top |
| TissGene-miRNA for S100P |
| Significantly anti-correlated miRNAs of TissGene across 28 cancer types (Gene-miRNA relations from TargetScanHuman Relsease 7.1, Conserved_Site_Context_Scores.txt.zip, 06.01.2016) (TCGA IlluminaHiSeq_miRNASeq, log2(RPM+1) data, version 2016-11-21) (TCGA IlluminaHiSeq_RNASeqV2, log2(normalized_count+1) data, version 2016-08-16) (Spearman’s Rank Correlation (p-value<0.05 and coefficient<-0.25)) |
| Cancer type | miRNA id | miRNA accession | P-val. | Coeff. | # samples |
| Top |
| TissGeneMut for S100P |
| TissGeneSNV for S100P |
| nsSNV counts per each loci. Different colors of circles represent different cancer types. Circle size denotes number of samples. (TCGA somatic mutation (SNPs and small INDELs) data, version 2016-04-25) * Click on the image to enlarge it in a new window. |
 |
 |
| Somatic nucleotide variants of TissGene across 28 cancer types (X-axis: cancer type and Y-axis: % of mutated samples) The numbers in parentheses are numbers of samples with mutation (nsSNVs). (TCGA somatic mutation (SNPs and small INDELs) data, version 2016-04-25) |
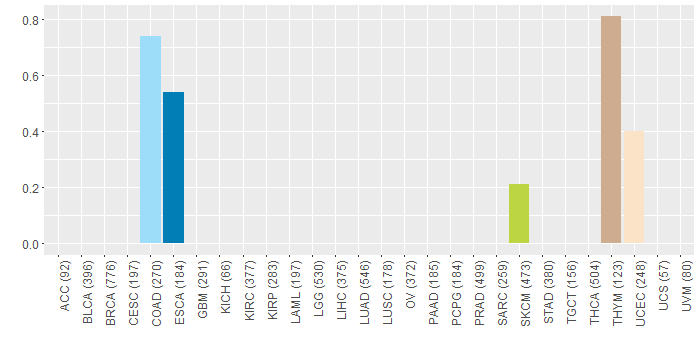 |
| - nsSNVs sorted by frequency. |
| AAchange | Cancer type | # samples |
| p.A7D | ESCA | 1 |
| p.K39T | SKCM | 1 |
| p.A63S | THYM | 1 |
| p.T82M | COAD | 1 |
| p.A7V | UCEC | 1 |
| p.V54M | COAD | 1 |
| Top |
| TissGeneCNV for S100P |
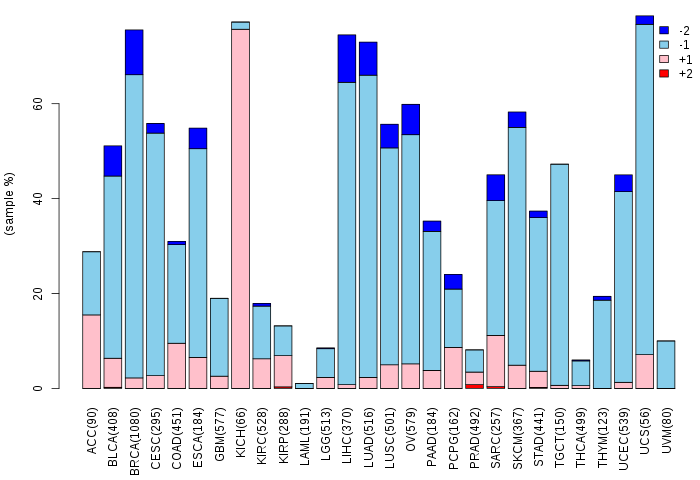
| Copy number variations of TissGene across 28 cancer types (X-axis: cancer type and Y-axis: % of CNV samples) (TCGA Gistic2_CopyNumber_Gistic2_all_data_by_genes, Gistic2 copy number data, version 2016-08-16) |
 |
| Top |
| TissGeneFusions for S100P |
| Fusion genes including TissGene (ChimerDB 3.0, 2016-12-01 and TCGA fusion Portal 2015-12-01) |
| Database | Src | Cancer type | Sample | Fusion gene | ORF | 5'-gene BP | 3'-gene BP |
| Chimerdb3.0 | FusionScan | PRAD | TCGA-EJ-8474-01A | FAM13C-S100P | In-Frame | chr10:61112029 | chr4:6698619 |
| Chimerdb3.0 | TopHat-Fusion | PRAD | TCGA-EJ-8474-01A | FAM13C-S100P | In-Frame | chr10:61112029 | chr4:6698619 |
| TCGAfusionPortal | PRADA | BRCA | TCGA-AR-A1AK-01A | S100P-CHD1 | NA | Chr4:6698896 | Chr5:98219587 |
| Top |
| TissGeneNet for S100P |
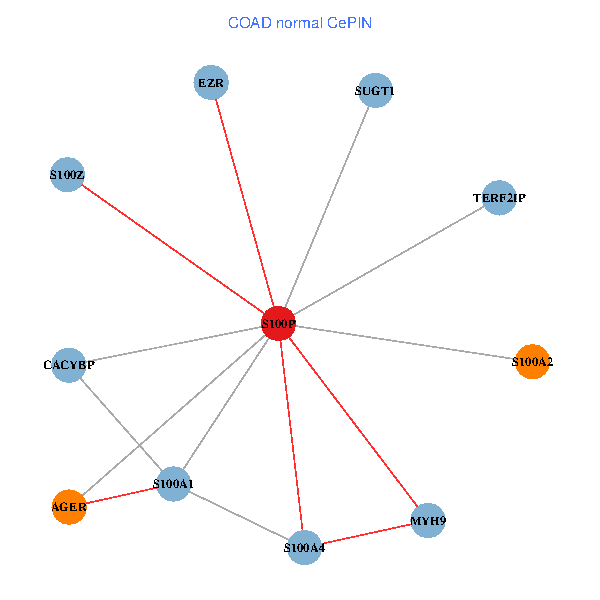
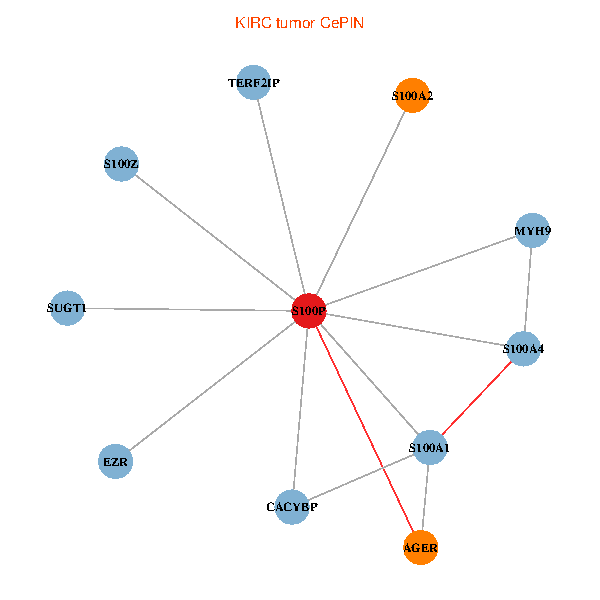
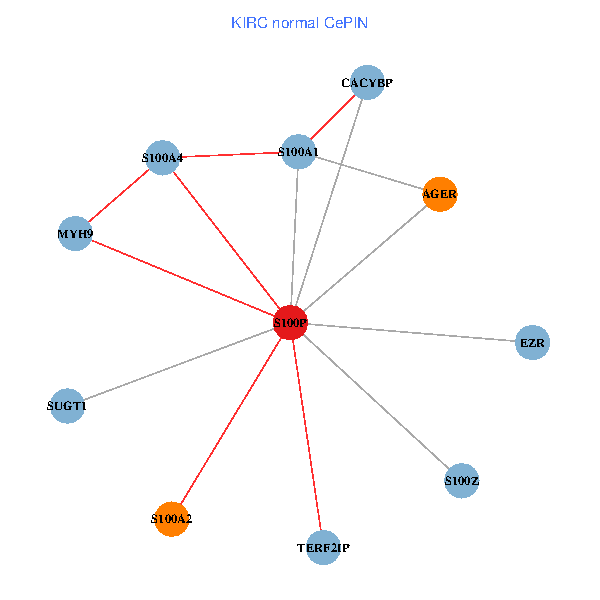
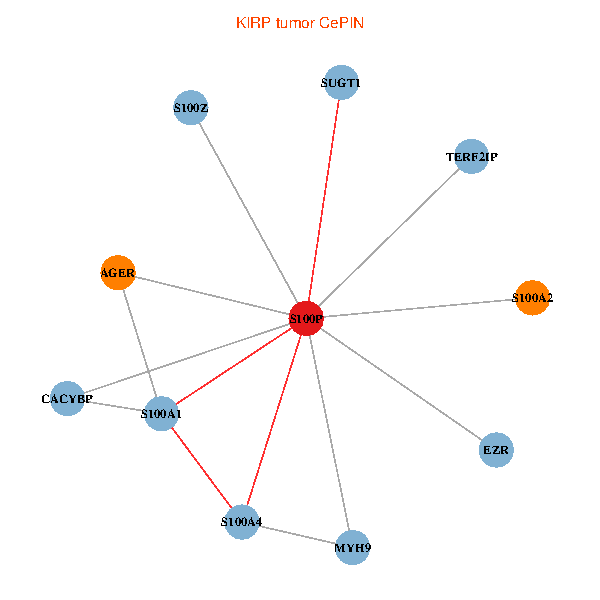
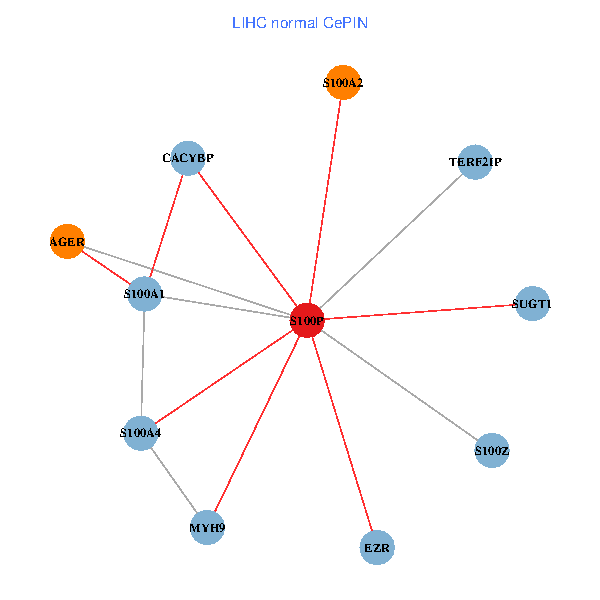
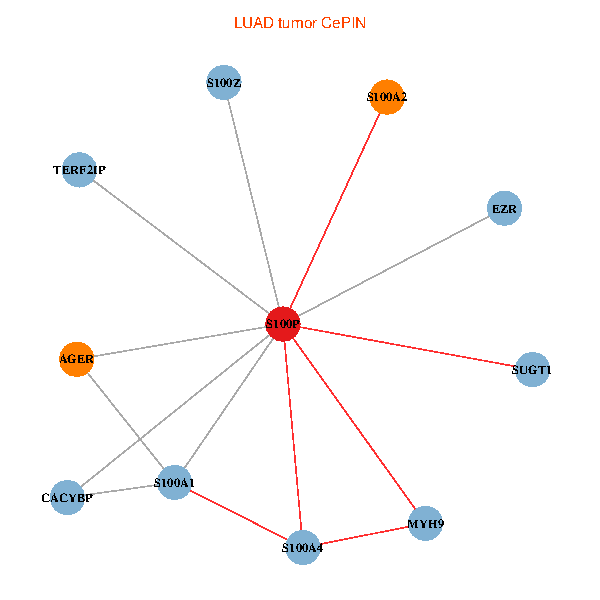
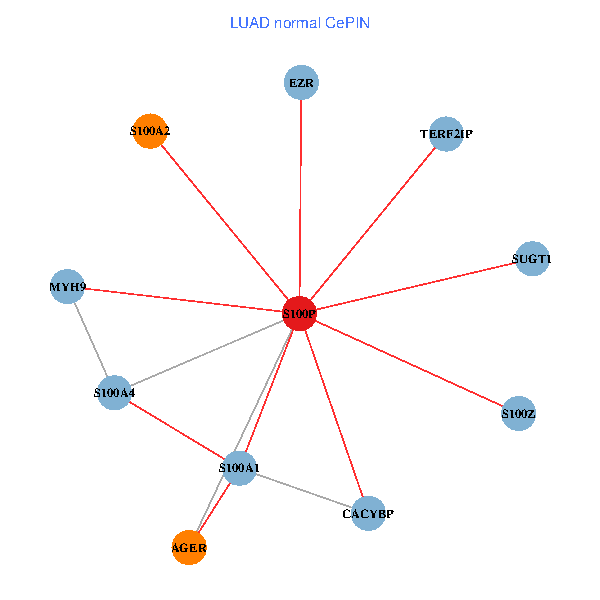
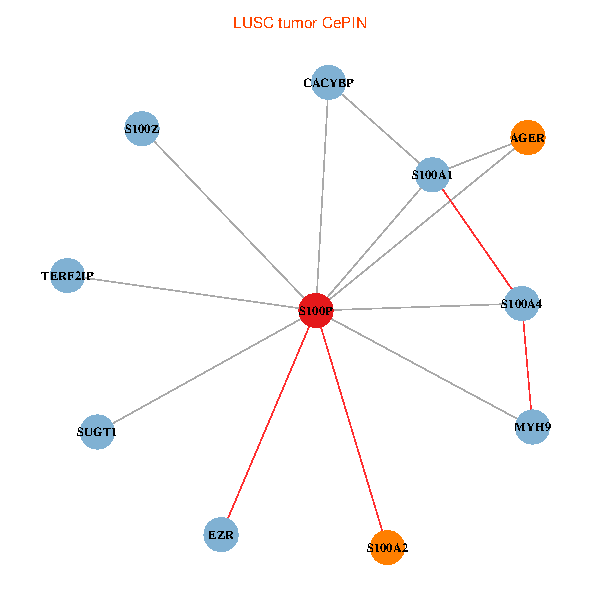
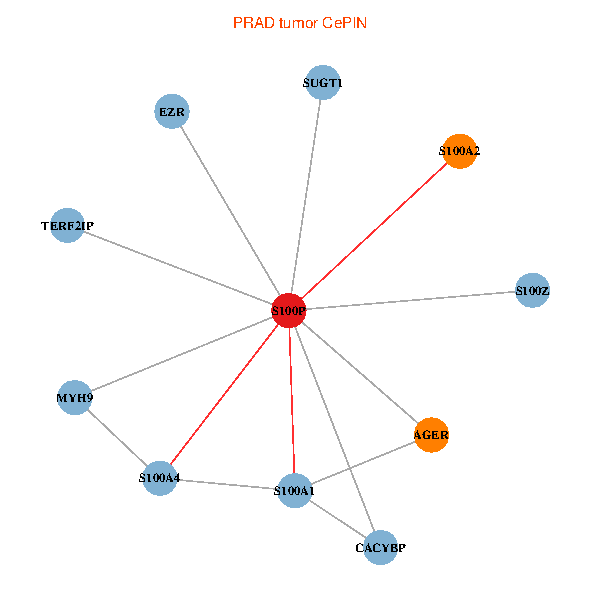
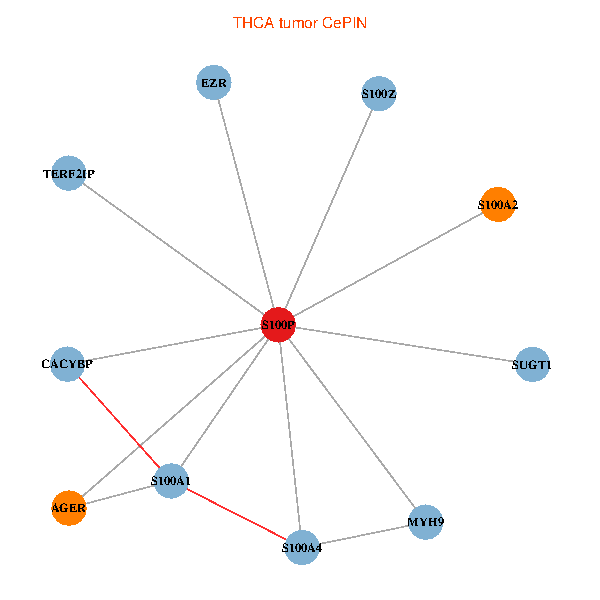
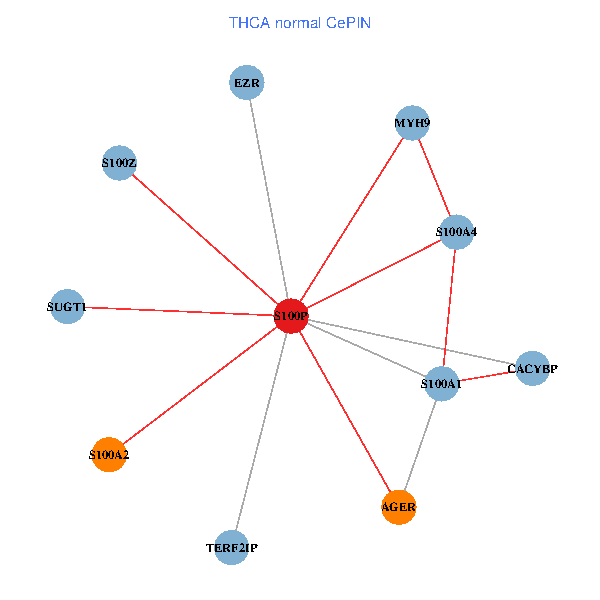
| Co-expressed gene networks based on protein-protein interaction data (CePIN) (TCGA IlluminaHiSeq_RNASeqV2, pan-cancer normalized log2(norm_counts+1) data, version 2016-08-16) (PINA2 ppi data) |
| BRCA (tumor) | BRCA (normal) |
| S100P, EZR, MYH9, TERF2IP, AGER, S100A1, CACYBP, SUGT1, S100A2, S100A4, S100Z (tumor) | S100P, EZR, MYH9, TERF2IP, AGER, S100A1, CACYBP, SUGT1, S100A2, S100A4, S100Z (normal) |
 |  |
| COAD (tumor) | COAD (normal) |
| S100P, EZR, MYH9, TERF2IP, AGER, S100A1, CACYBP, SUGT1, S100A2, S100A4, S100Z (tumor) | S100P, EZR, MYH9, TERF2IP, AGER, S100A1, CACYBP, SUGT1, S100A2, S100A4, S100Z (normal) |
 |  |
| HNSC (tumor) | HNSC (normal) |
| S100P, EZR, MYH9, TERF2IP, AGER, S100A1, CACYBP, SUGT1, S100A2, S100A4, S100Z (tumor) | S100P, EZR, MYH9, TERF2IP, AGER, S100A1, CACYBP, SUGT1, S100A2, S100A4, S100Z (normal) |
 |  |
| KICH (tumor) | KICH (normal) |
| S100P, EZR, MYH9, TERF2IP, AGER, S100A1, CACYBP, SUGT1, S100A2, S100A4, S100Z (tumor) | S100P, EZR, MYH9, TERF2IP, AGER, S100A1, CACYBP, SUGT1, S100A2, S100A4, S100Z (normal) |
 |  |
| KIRC (tumor) | KIRC (normal) |
| S100P, EZR, MYH9, TERF2IP, AGER, S100A1, CACYBP, SUGT1, S100A2, S100A4, S100Z (tumor) | S100P, EZR, MYH9, TERF2IP, AGER, S100A1, CACYBP, SUGT1, S100A2, S100A4, S100Z (normal) |
 |  |
| KIRP (tumor) | KIRP (normal) |
| S100P, EZR, MYH9, TERF2IP, AGER, S100A1, CACYBP, SUGT1, S100A2, S100A4, S100Z (tumor) | S100P, EZR, MYH9, TERF2IP, AGER, S100A1, CACYBP, SUGT1, S100A2, S100A4, S100Z (normal) |
 |  |
| LIHC (tumor) | LIHC (normal) |
| S100P, EZR, MYH9, TERF2IP, AGER, S100A1, CACYBP, SUGT1, S100A2, S100A4, S100Z (tumor) | S100P, EZR, MYH9, TERF2IP, AGER, S100A1, CACYBP, SUGT1, S100A2, S100A4, S100Z (normal) |
 |  |
| LUAD (tumor) | LUAD (normal) |
| S100P, EZR, MYH9, TERF2IP, AGER, S100A1, CACYBP, SUGT1, S100A2, S100A4, S100Z (tumor) | S100P, EZR, MYH9, TERF2IP, AGER, S100A1, CACYBP, SUGT1, S100A2, S100A4, S100Z (normal) |
 |  |
| LUSC (tumor) | LUSC (normal) |
| S100P, EZR, MYH9, TERF2IP, AGER, S100A1, CACYBP, SUGT1, S100A2, S100A4, S100Z (tumor) | S100P, EZR, MYH9, TERF2IP, AGER, S100A1, CACYBP, SUGT1, S100A2, S100A4, S100Z (normal) |
 |  |
| PRAD (tumor) | PRAD (normal) |
| S100P, EZR, MYH9, TERF2IP, AGER, S100A1, CACYBP, SUGT1, S100A2, S100A4, S100Z (tumor) | S100P, EZR, MYH9, TERF2IP, AGER, S100A1, CACYBP, SUGT1, S100A2, S100A4, S100Z (normal) |
 |  |
| STAD (tumor) | STAD (normal) |
| S100P, EZR, MYH9, TERF2IP, AGER, S100A1, CACYBP, SUGT1, S100A2, S100A4, S100Z (tumor) | S100P, EZR, MYH9, TERF2IP, AGER, S100A1, CACYBP, SUGT1, S100A2, S100A4, S100Z (normal) |
 |  |
| THCA (tumor) | THCA (normal) |
| S100P, EZR, MYH9, TERF2IP, AGER, S100A1, CACYBP, SUGT1, S100A2, S100A4, S100Z (tumor) | S100P, EZR, MYH9, TERF2IP, AGER, S100A1, CACYBP, SUGT1, S100A2, S100A4, S100Z (normal) |
 |  |
| Top |
| TissGeneProg for S100P |
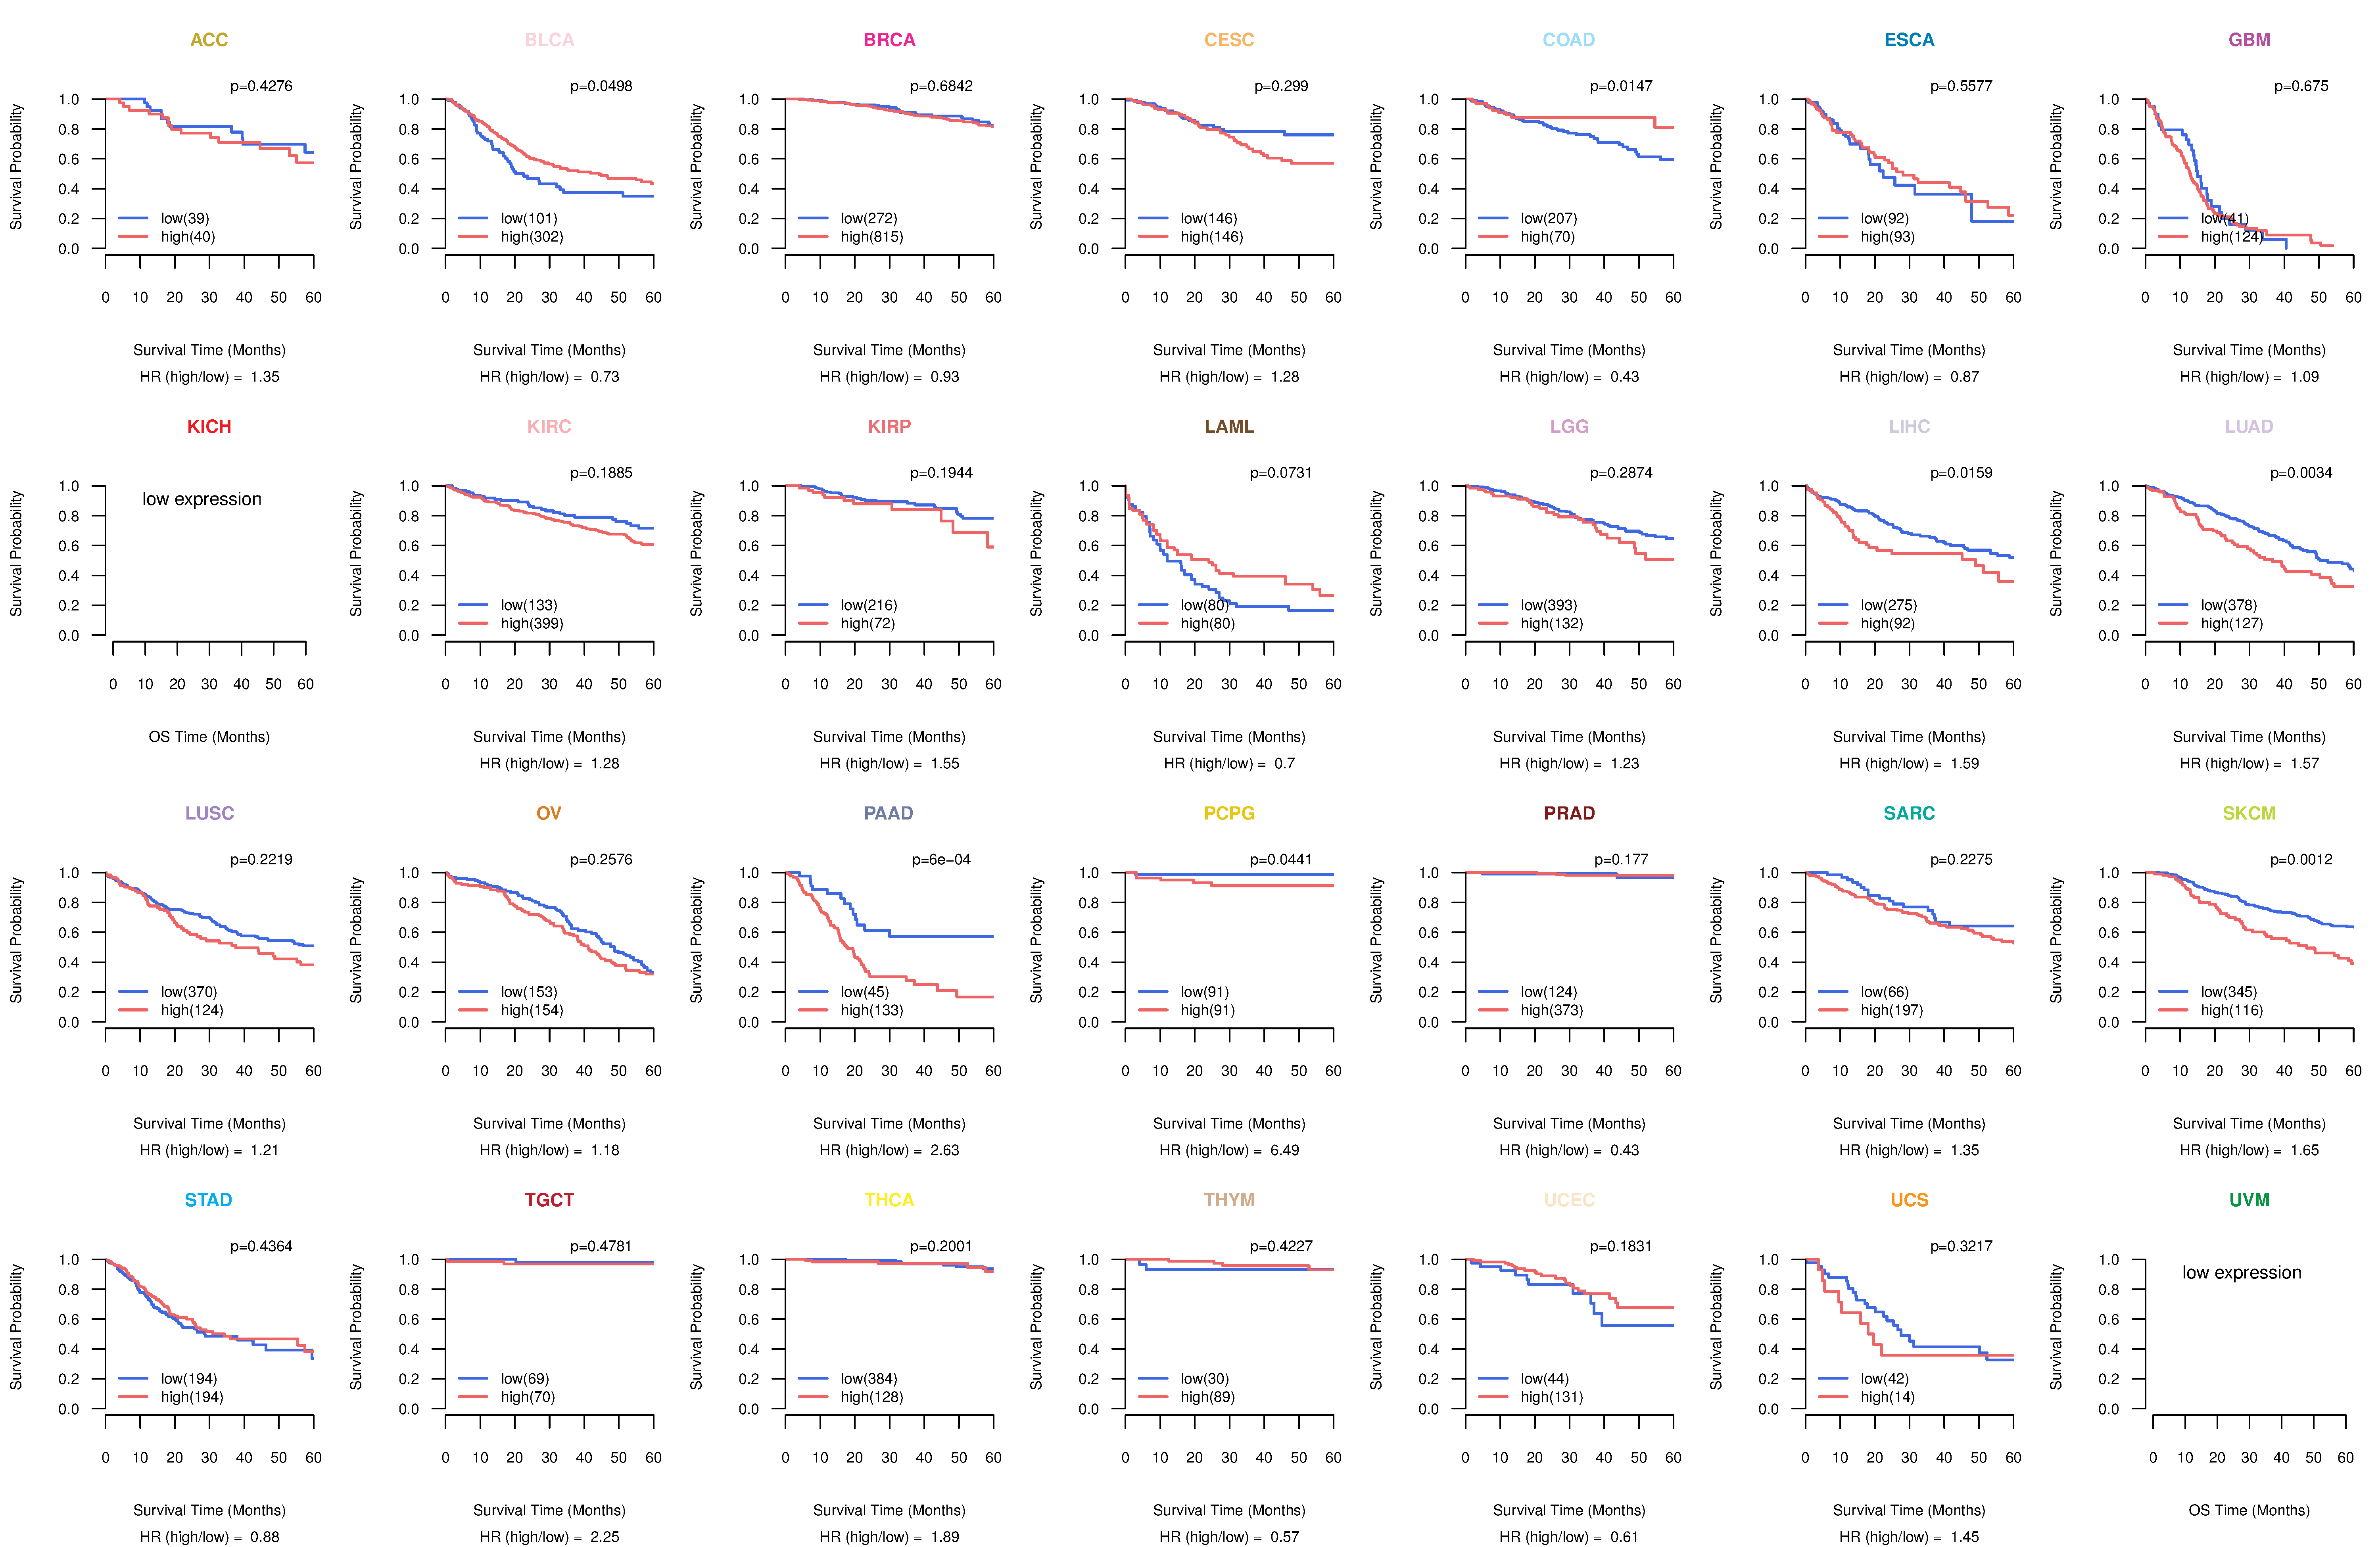
| Kaplan-Meier plots with logrank tests of overall survival (OS) using 28 cancer types (TCGA IlluminaHiSeq_RNASeqV2, pan-cancer normalized log2(norm_counts+1) data, version 2016-08-16) (TCGA clinicalMatrix, phenotype data, version 2016-04-27) * Click on the image to enlarge it in a new window. |
 |
| Kaplan-Meier plots with logrank test of relapse free survival (RFS) using 28 cancer types (TCGA IlluminaHiSeq_RNASeqV2, pan-cancer normalized log2(norm_counts+1) data, version 2016-08-16) (TCGA clinicalMatrix, phenotype data, version 2016-04-27) * Click on the image enlarge it in a new window. |
 |
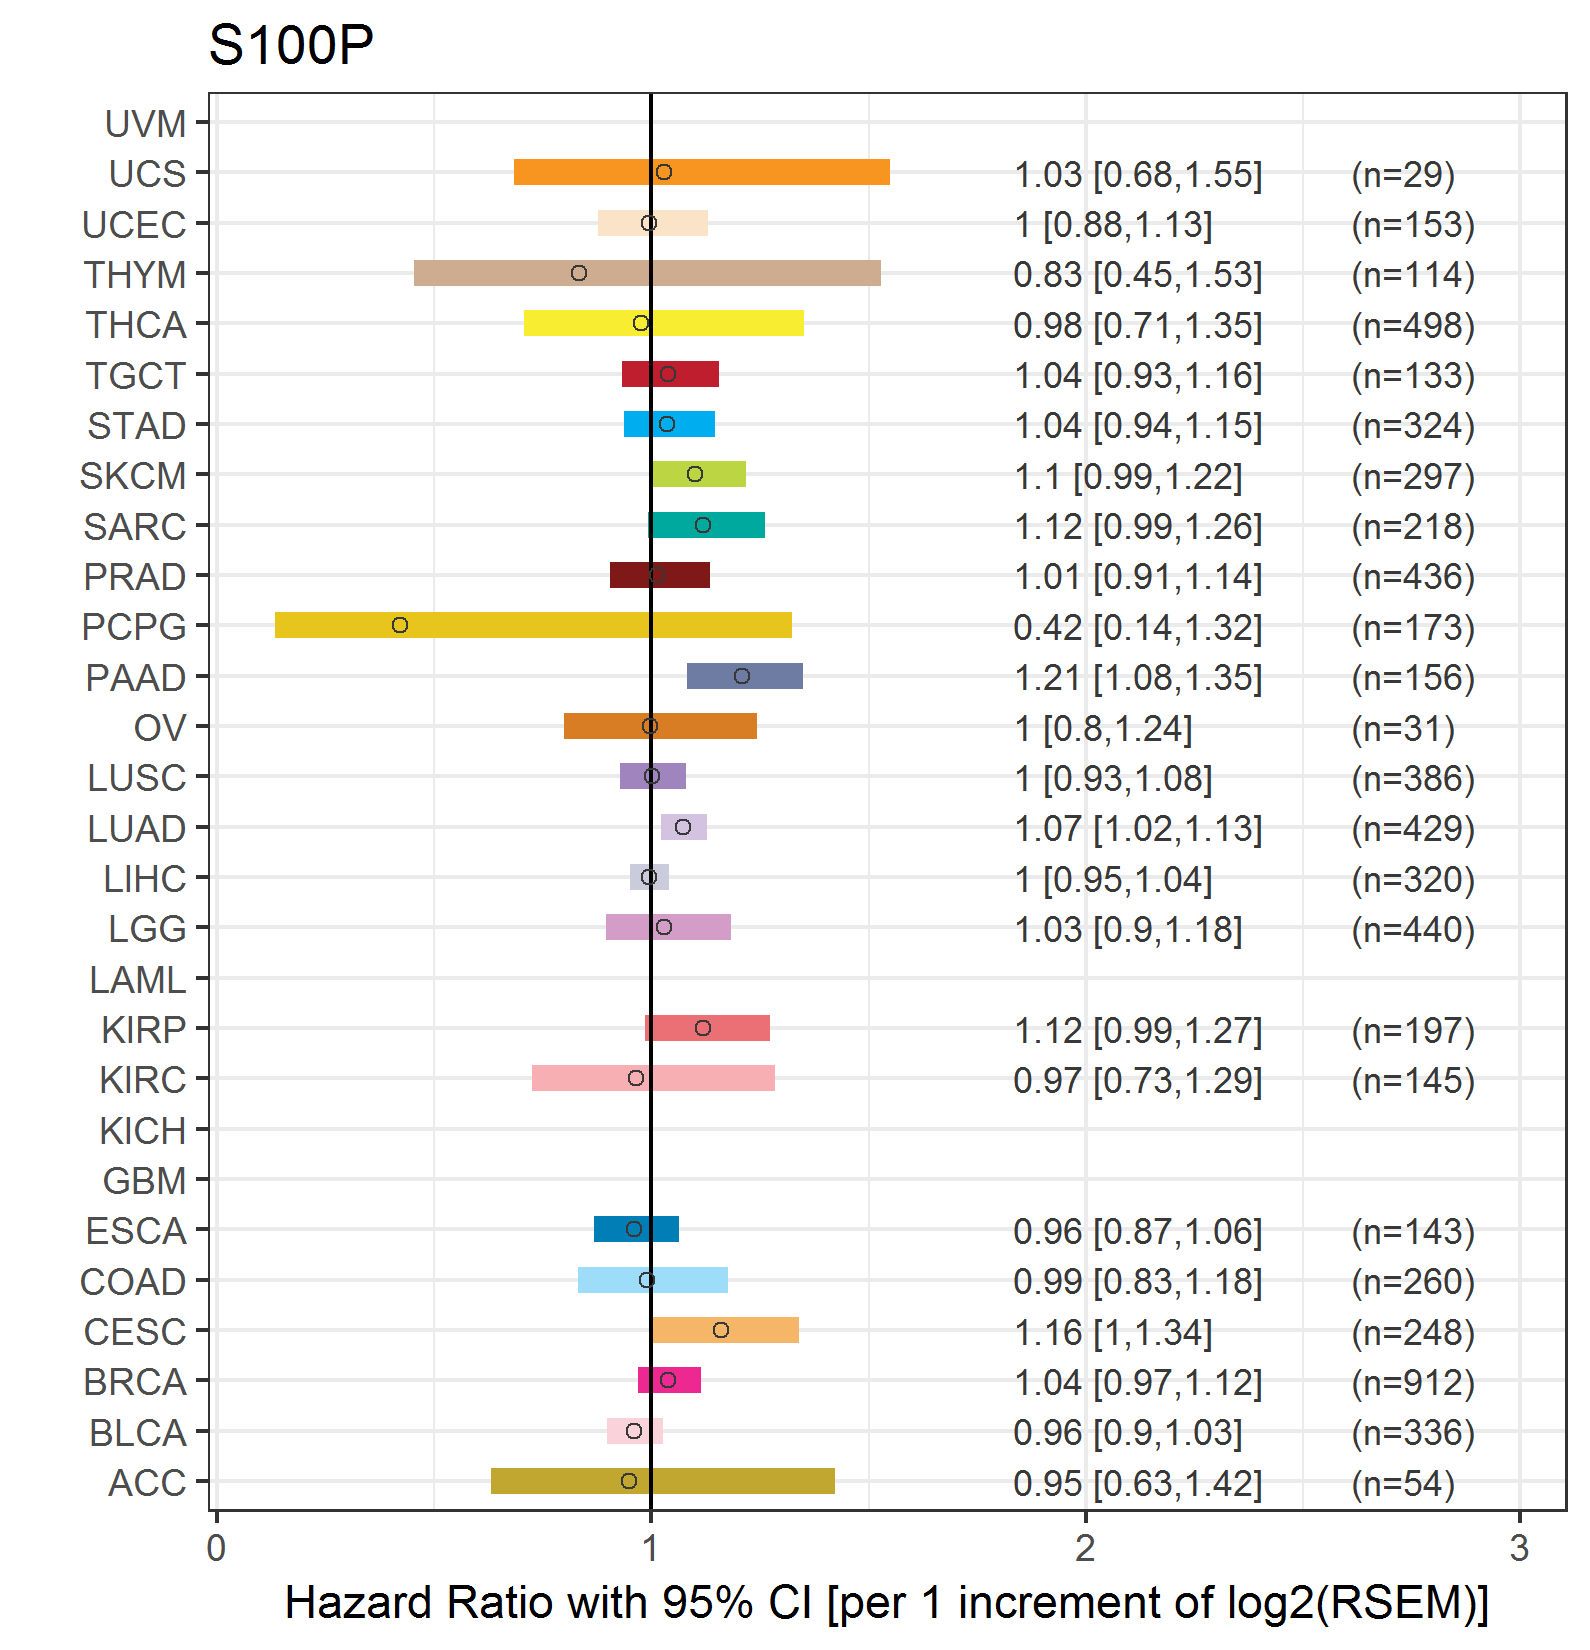
| Forest plot of Cox proportional hazard ratio (HR) and 95% CI of overall survival (OS) using 28 cancer types (TCGA IlluminaHiSeq_RNASeqV2, pan-cancer normalized log2(norm_counts+1) data, version 2016-08-16) (TCGA clinicalMatrix, phenotype data, version 2016-04-27) * Click on the image enlarge it in a new window. |
 |
| Forest plot of Cox proportional hazard ratio (HR) and 95% CI of relapse free survival (RFS) using 28 cancer types (TCGA IlluminaHiSeq_RNASeqV2, pan-cancer normalized log2(norm_counts+1) data, version 2016-08-16) (TCGA clinicalMatrix, phenotype data, version 2016-04-27) * Click on the image enlarge it in a new window. |
 |
| Top |
| TissGeneClin for S100P |
| TissGeneDrug for S100P |
| Drug information targeting TissGene (DrugBank Version 5.0.6, 2017-04-01) |
| DrugBank ID | Drug name | Drug activity | Drug type | Drug status |
| DB01003 | Cromoglicic acid | Antagonist | Small molecule | Approved |
| Top |
| TissGeneDisease for S100P |
| Disease information associated with TissGene (DisGeNet, 2016-06-01) |
| Disease ID | Disease name | # pubmeds | Source |
| umls:C0027627 | Neoplasm Metastasis | 13 | BeFree |
| umls:C0235974 | Pancreatic carcinoma | 7 | BeFree |
| umls:C0346647 | Malignant neoplasm of pancreas | 7 | BeFree |
| umls:C0001418 | Adenocarcinoma | 5 | BeFree,LHGDN |
| umls:C0024623 | Malignant neoplasm of stomach | 5 | BeFree |
| umls:C0596263 | Carcinogenesis | 5 | BeFree |
| umls:C0699791 | Stomach Carcinoma | 5 | BeFree |
| umls:C0006142 | Malignant neoplasm of breast | 4 | BeFree |
| umls:C0030297 | Pancreatic Neoplasm | 4 | LHGDN |
| umls:C0678222 | Breast Carcinoma | 4 | BeFree |
| umls:C0007102 | Malignant tumor of colon | 3 | BeFree |
| umls:C0007131 | Non-Small Cell Lung Carcinoma | 3 | BeFree |
| umls:C0009402 | Colorectal Carcinoma | 3 | BeFree |
| umls:C0376358 | Malignant neoplasm of prostate | 3 | BeFree |
| umls:C0600139 | Prostate carcinoma | 3 | BeFree |
| umls:C0699790 | Colon Carcinoma | 3 | BeFree |
| umls:C1527249 | Colorectal Cancer | 3 | BeFree |
| umls:C0007138 | Carcinoma, Transitional Cell | 2 | BeFree |
| umls:C0029925 | Ovarian Carcinoma | 2 | BeFree |
| umls:C0033578 | Prostatic Neoplasms | 2 | BeFree,LHGDN |
| umls:C0178874 | Tumor Progression | 2 | BeFree |
| umls:C0206698 | Cholangiocarcinoma | 2 | BeFree |
| umls:C0302592 | Cervix carcinoma | 2 | BeFree |
| umls:C0936223 | Metastatic Prostate Carcinoma | 2 | BeFree |
| umls:C1140680 | Malignant neoplasm of ovary | 2 | BeFree |
| umls:C1335302 | Pancreatic Ductal Adenocarcinoma | 2 | BeFree |
| umls:C2145472 | Urothelial Carcinoma | 2 | BeFree |
| umls:C2239176 | Liver carcinoma | 2 | BeFree |
| umls:C0001430 | Adenoma | 1 | BeFree |
| umls:C0004134 | Ataxia | 1 | BeFree |
| umls:C0007134 | Renal Cell Carcinoma | 1 | BeFree |
| umls:C0009324 | Ulcerative Colitis | 1 | BeFree |
| umls:C0009375 | Colonic Neoplasms | 1 | BeFree |
| umls:C0013421 | Dystonia | 1 | BeFree |
| umls:C0014175 | Endometriosis | 1 | BeFree |
| umls:C0021390 | Inflammatory Bowel Diseases | 1 | BeFree |
| umls:C0022665 | Kidney Neoplasm | 1 | BeFree |
| umls:C0026948 | Mycosis Fungoides | 1 | BeFree |
| umls:C0032460 | Polycystic Ovary Syndrome | 1 | CTD_human |
| umls:C0042065 | Genitourinary Neoplasms | 1 | BeFree |
| umls:C0153676 | Secondary malignant neoplasm of lung | 1 | BeFree |
| umls:C0279000 | Liver and Intrahepatic Biliary Tract Carcinoma | 1 | BeFree |
| umls:C0279626 | Squamous cell carcinoma of esophagus | 1 | BeFree |
| umls:C0280100 | Solid tumour | 1 | BeFree |
| umls:C0280217 | stage, non-small cell lung cancer | 1 | BeFree |
| umls:C0281361 | Adenocarcinoma of pancreas | 1 | BeFree |
| umls:C0345904 | Malignant neoplasm of liver | 1 | BeFree |
| umls:C0393593 | Dystonia Disorders | 1 | BeFree |
| umls:C0597984 | Biliary stricture | 1 | BeFree |
| umls:C0677898 | invasive cancer | 1 | BeFree |
| umls:C0878500 | Intraepithelial Neoplasia | 1 | BeFree |
| umls:C0919267 | ovarian neoplasm | 1 | LHGDN |
| umls:C1512409 | Hepatocarcinogenesis | 1 | BeFree |
| umls:C1516170 | Cancer Cell Growth | 1 | BeFree |
| umls:C1519670 | Tumor Angiogenesis | 1 | BeFree |
| umls:C3539878 | Triple Negative Breast Neoplasms | 1 | BeFree |
|
Copyright 2016-Present - The University of Texas Health Science Center at Houston (UTHealth) Web File Viewing | How to Report, Fraud, Waste and Abuse | State of Texas | Statewide Search | Texas Homeland Security | Site Policies |