 |
| |
| |
| |
| |
| |
| |
|

| TissGeneSummary for SAA2 |
 Gene summary Gene summary |
| Basic gene information | Gene symbol | SAA2 |
| Gene name | serum amyloid A2 | |
| Synonyms | - | |
| Cytomap | UCSC genome browser: 11p15.1-p14 | |
| Type of gene | protein-coding | |
| RefGenes | NM_001127380.2, NM_030754.4, | |
| Description | serum amyloid A-2 protein | |
| Modification date | 20141207 | |
| dbXrefs | MIM : 104751 | |
| HGNC : HGNC | ||
| Ensembl : ENSG00000134339 | ||
| HPRD : 00098 | ||
| Vega : OTTHUMG00000166484 | ||
| Protein | UniProt: go to UniProt's Cross Reference DB Table | |
| Expression | CleanEX: HS_SAA2 | |
| BioGPS: 6289 | ||
| Pathway | NCI Pathway Interaction Database: SAA2 | |
| KEGG: SAA2 | ||
| REACTOME: SAA2 | ||
| Pathway Commons: SAA2 | ||
| Context | iHOP: SAA2 | |
| ligand binding site mutation search in PubMed: SAA2 | ||
| UCL Cancer Institute: SAA2 | ||
| Assigned class in TissGDB* | C | |
| Included tissue-specific gene expression resources | TiGER,GTEx | |
| Specific-tissues in normal samples (assigned by TissGDB using HPA, TiGER, and GTEx) | Liver | |
| Cancer types related to the specific-tissues in cancer samples (assigned by TissGDB using TCGA) | LIHC | |
| Reference showing the relevant tissue of SAA2 | ||
| Description by TissGene annotations | ||
| * Class A consists of genes with literature evidence and is part of the cTissGenes. Class B consists of only cTissGenes without additional evidence. The remaining genes belong to Class C. |
| Gene ontology having evidence of Inferred from Direct Assay (IDA) from Entrez |
| GO ID | GO term | PubMed ID |
| Top |
| TissGeneExp for SAA2 |
| Gene expressions across 28 cancer types (X-axis: cancer type and Y-axis: log2(norm_counts+1)) (TCGA IlluminaHiSeq_RNASeqV2, pan-cancer normalized log2(norm_counts+1) data, version 2016-08-16) |
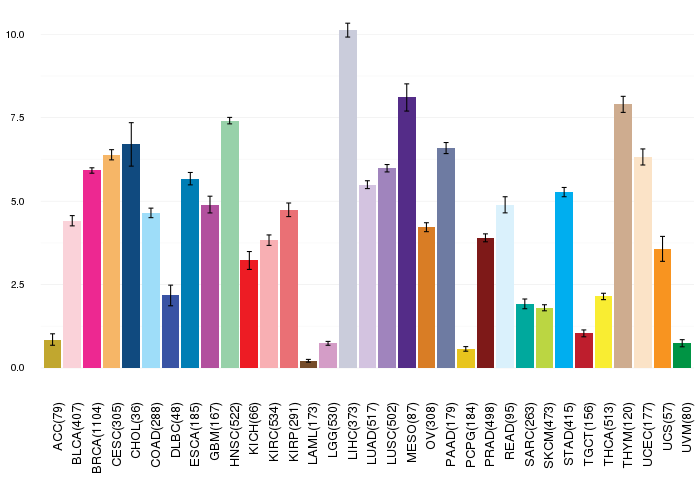 |
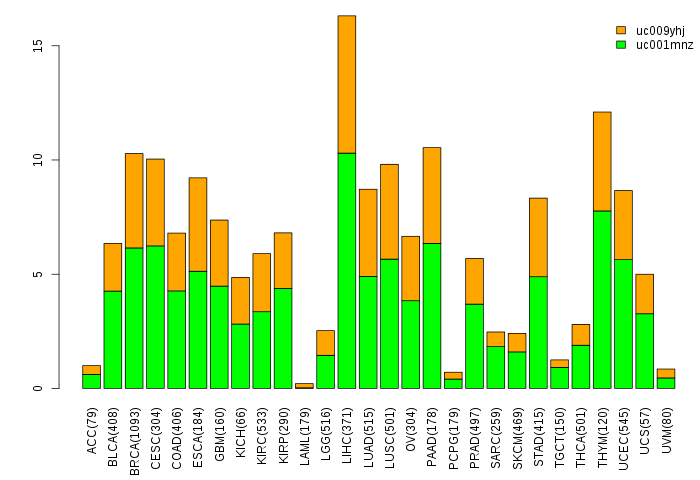
| Gene isoform expressions across 28 cancer types (X-axis: cancer type and Y-axis: log2(norm_counts+1)) (TCGA pan-cancer tcga_rsem_isoform_tpm, version 2016-09-01) |
 |
| Gene expressions across normal tissues of GTEx data (GTEx GTEx_Analysis_v6_RNA-seq_RNA-SeQCv1.1.8_gene_rpkm.gct) - Here, we shows the matched tissue types only among our 28 cancer types. |
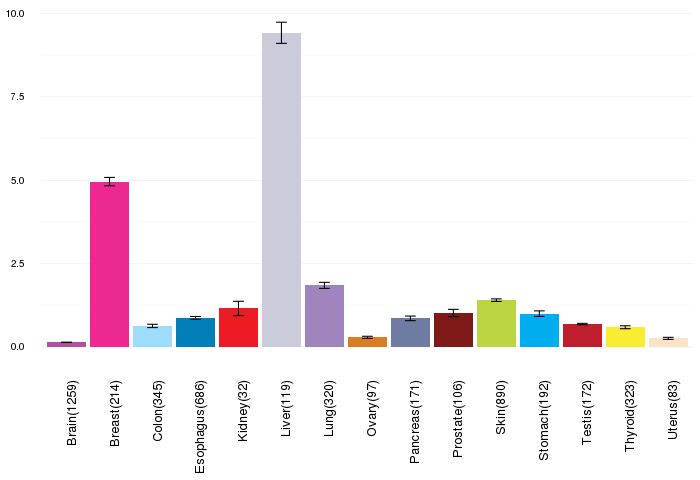 |
| Different expressions across 14 cancer types with more than 10 samples between matched tumors and normals (X-axis: cancer type and Y-axis: log2(norm_counts+1)) (TCGA IlluminaHiSeq_RNASeqV2, pan-cancer normalized log2(norm_counts+1) data, version 2016-08-16) |
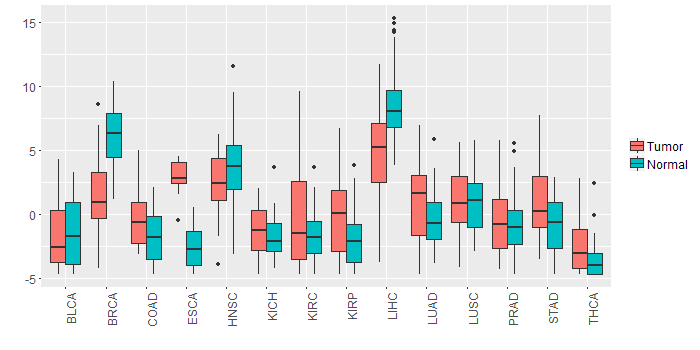 |
| - Significantly differentially expressed cancer types and information. (|Fold change|>1 and FDR<0.05) |
| Cancer type | Mean(exp) in tumor | Mean(exp) in matched normal | Log2FC | P-val. | FDR |
| BRCA | 1.295354945 | 6.08710319 | -4.791748246 | 7.70E-37 | 1.61E-35 |
| LIHC | 4.971120524 | 8.683810524 | -3.71269 | 2.53E-07 | 1.57E-06 |
| KIRP | -0.111100976 | -1.827804101 | 1.716703125 | 0.0176 | 0.036201101 |
| COAD | -0.421901938 | -1.890598092 | 1.468696154 | 0.0148 | 0.031060153 |
| KIRC | -0.409070421 | -1.714724588 | 1.305654167 | 0.00695 | 0.011971522 |
| LUAD | 0.961876179 | -0.454422097 | 1.416298276 | 0.00239 | 0.00491363 |
| THCA | -2.507640595 | -3.635723646 | 1.128083051 | 0.000715 | 0.001724412 |
| ESCA | 2.825577433 | -2.566031658 | 5.391609091 | 1.40E-07 | 0.0003058 |
| Top |
| TissGene-miRNA for SAA2 |
| Significantly anti-correlated miRNAs of TissGene across 28 cancer types (Gene-miRNA relations from TargetScanHuman Relsease 7.1, Conserved_Site_Context_Scores.txt.zip, 06.01.2016) (TCGA IlluminaHiSeq_miRNASeq, log2(RPM+1) data, version 2016-11-21) (TCGA IlluminaHiSeq_RNASeqV2, log2(normalized_count+1) data, version 2016-08-16) (Spearman’s Rank Correlation (p-value<0.05 and coefficient<-0.25)) |
| Cancer type | miRNA id | miRNA accession | P-val. | Coeff. | # samples |
| Top |
| TissGeneMut for SAA2 |
| TissGeneSNV for SAA2 |
| nsSNV counts per each loci. Different colors of circles represent different cancer types. Circle size denotes number of samples. (TCGA somatic mutation (SNPs and small INDELs) data, version 2016-04-25) * Click on the image to enlarge it in a new window. |
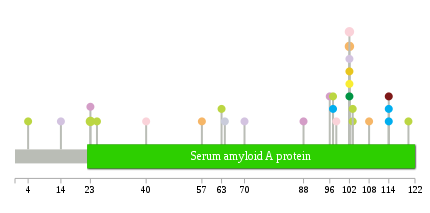 |
 |
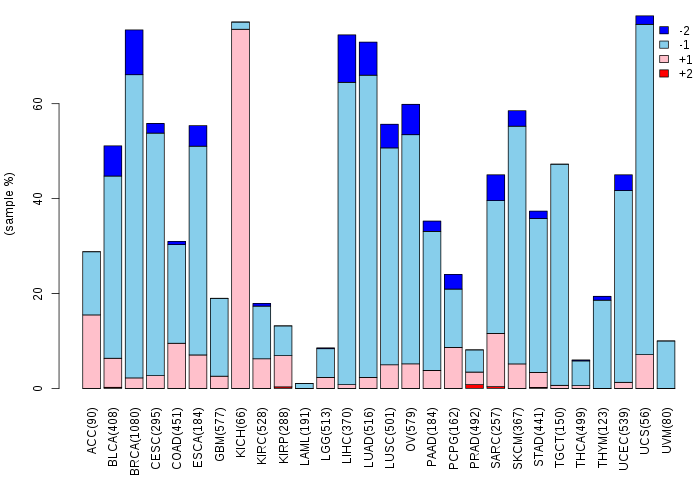
| Somatic nucleotide variants of TissGene across 28 cancer types (X-axis: cancer type and Y-axis: % of mutated samples) The numbers in parentheses are numbers of samples with mutation (nsSNVs). (TCGA somatic mutation (SNPs and small INDELs) data, version 2016-04-25) |
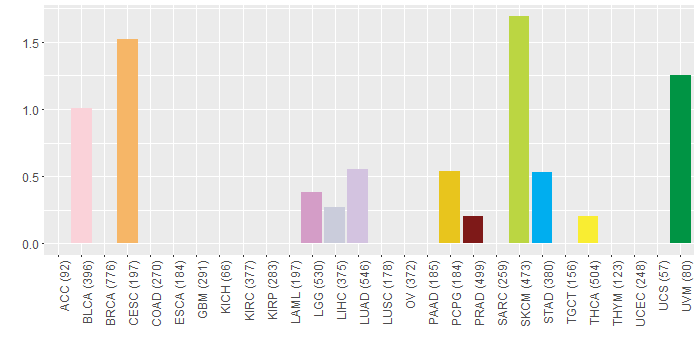 |
| - nsSNVs sorted by frequency. |
| AAchange | Cancer type | # samples |
| p.S23L | SKCM | 2 |
| p.K102E | BLCA | 2 |
| p.K102E | CESC | 2 |
| p.L4F | SKCM | 1 |
| p.R114* | STAD | 1 |
| p.Q98E | BLCA | 1 |
| p.D97N | STAD | 1 |
| p.W103* | SKCM | 1 |
| p.K64E | LIHC | 1 |
| p.S40C | BLCA | 1 |
| p.E120K | SKCM | 1 |
| p.K102E | UVM | 1 |
| p.G88C | LGG | 1 |
| p.R108K | CESC | 1 |
| p.W103X | SKCM | 1 |
| p.K102E | PCPG | 1 |
| p.S23L | LGG | 1 |
| p.R114X | STAD | 1 |
| p.D97N | SKCM | 1 |
| p.A96V | LGG | 1 |
| p.L14V | LUAD | 1 |
| p.K102E | HNSC | 1 |
| p.A70S | LUAD | 1 |
| p.K102E | THCA | 1 |
| p.R57W | CESC | 1 |
| p.L25F | SKCM | 1 |
| p.K102E | LUAD | 1 |
| p.R114Q | PRAD | 1 |
| p.A63V | SKCM | 1 |
| Top |
| TissGeneCNV for SAA2 |
| Copy number variations of TissGene across 28 cancer types (X-axis: cancer type and Y-axis: % of CNV samples) (TCGA Gistic2_CopyNumber_Gistic2_all_data_by_genes, Gistic2 copy number data, version 2016-08-16) |
 |
| Top |
| TissGeneFusions for SAA2 |
| Fusion genes including TissGene (ChimerDB 3.0, 2016-12-01 and TCGA fusion Portal 2015-12-01) |
| Database | Src | Cancer type | Sample | Fusion gene | ORF | 5'-gene BP | 3'-gene BP |
| Top |
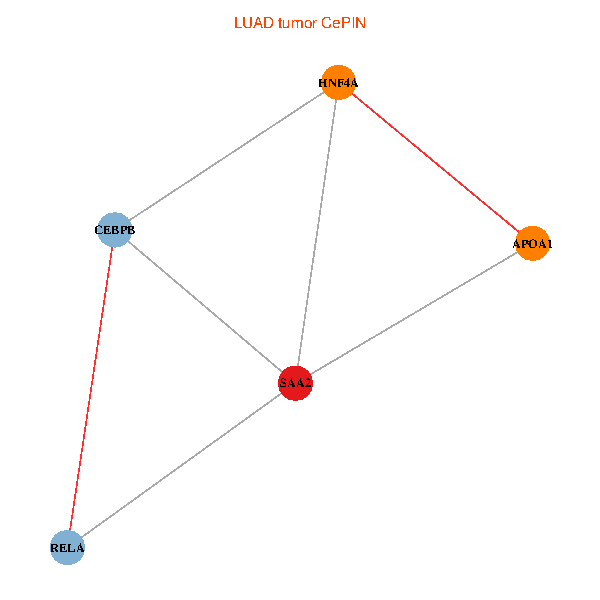
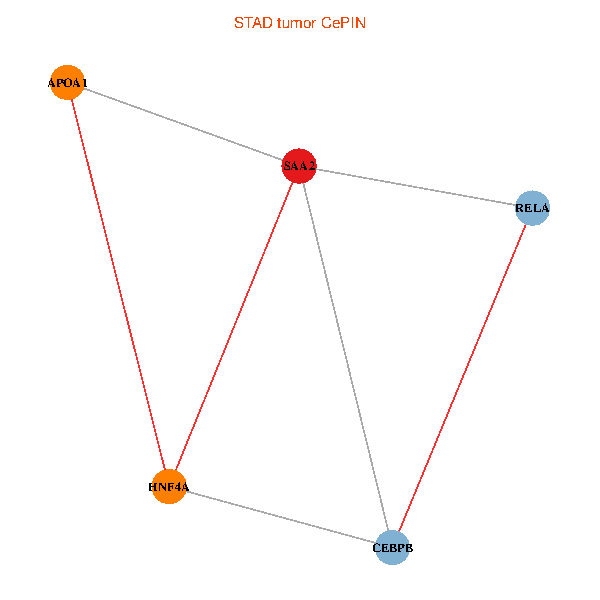
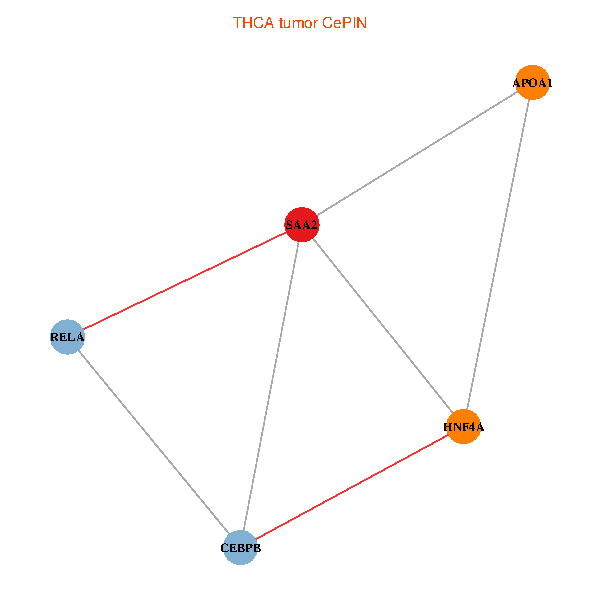
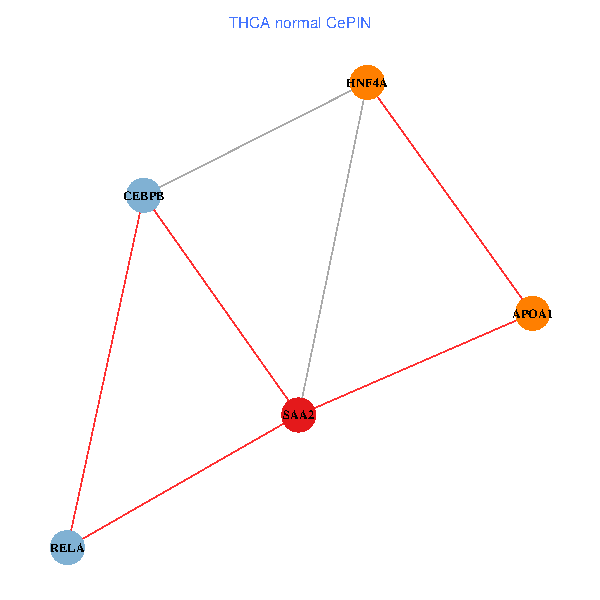
| TissGeneNet for SAA2 |
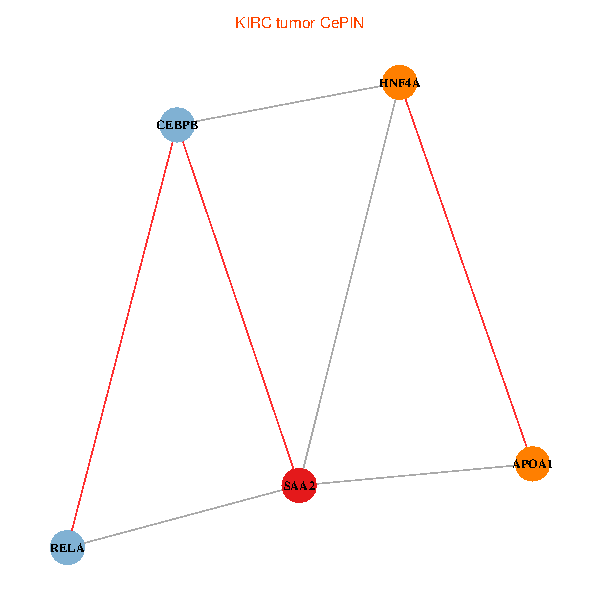
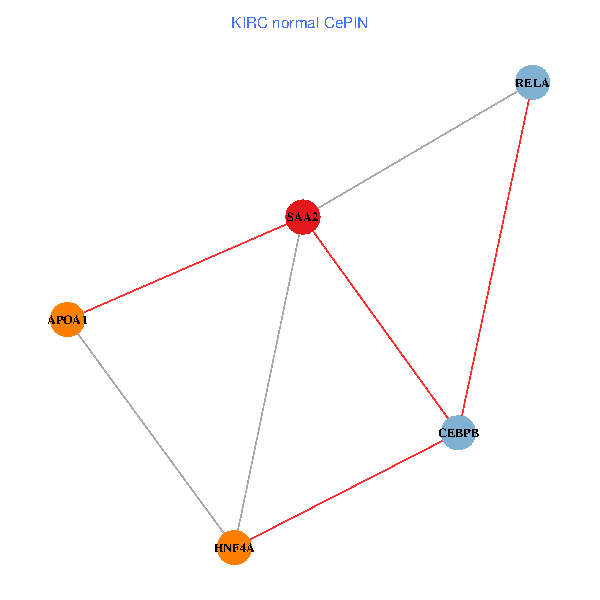
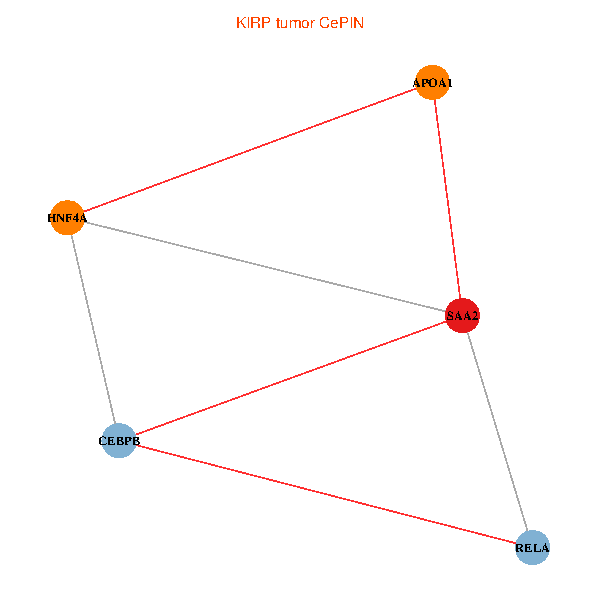
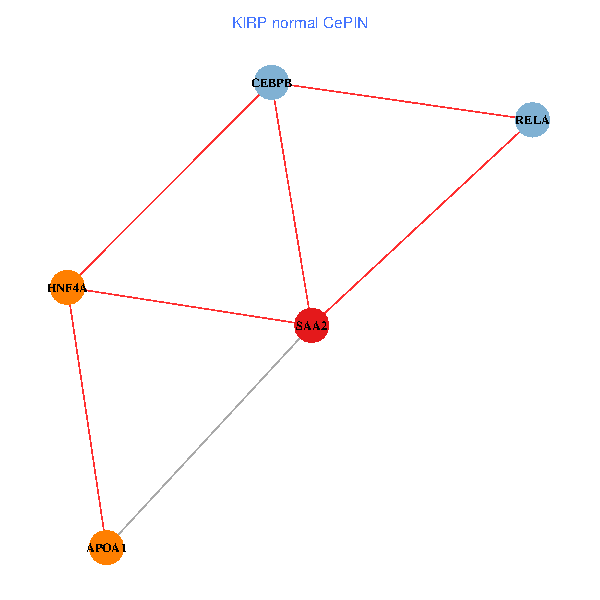
| Co-expressed gene networks based on protein-protein interaction data (CePIN) (TCGA IlluminaHiSeq_RNASeqV2, pan-cancer normalized log2(norm_counts+1) data, version 2016-08-16) (PINA2 ppi data) |
| BRCA (tumor) | BRCA (normal) |
| SAA2, HNF4A, RELA, CEBPB, APOA1 (tumor) | SAA2, HNF4A, RELA, CEBPB, APOA1 (normal) |
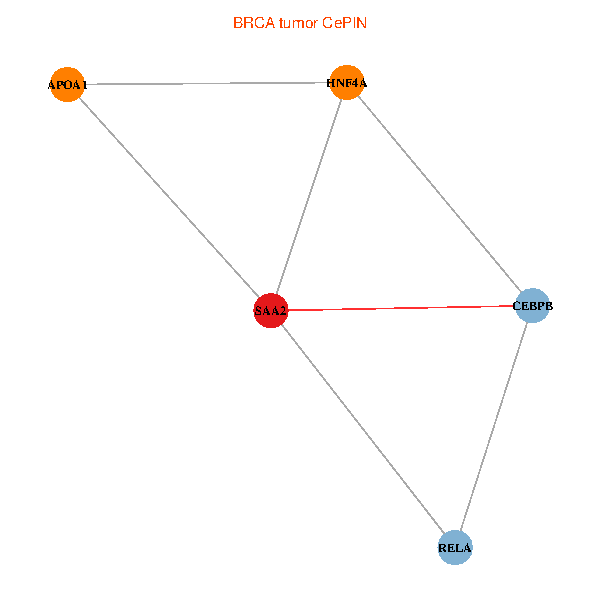 |  |
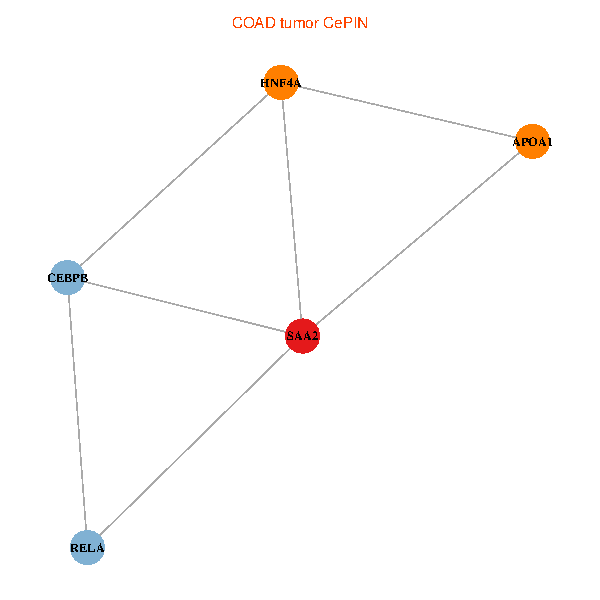
| COAD (tumor) | COAD (normal) |
| SAA2, HNF4A, RELA, CEBPB, APOA1 (tumor) | SAA2, HNF4A, RELA, CEBPB, APOA1 (normal) |
 |  |
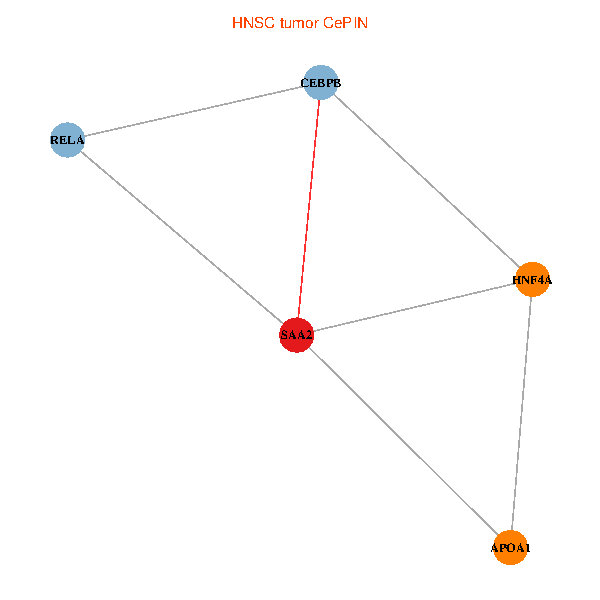
| HNSC (tumor) | HNSC (normal) |
| SAA2, HNF4A, RELA, CEBPB, APOA1 (tumor) | SAA2, HNF4A, RELA, CEBPB, APOA1 (normal) |
 |  |
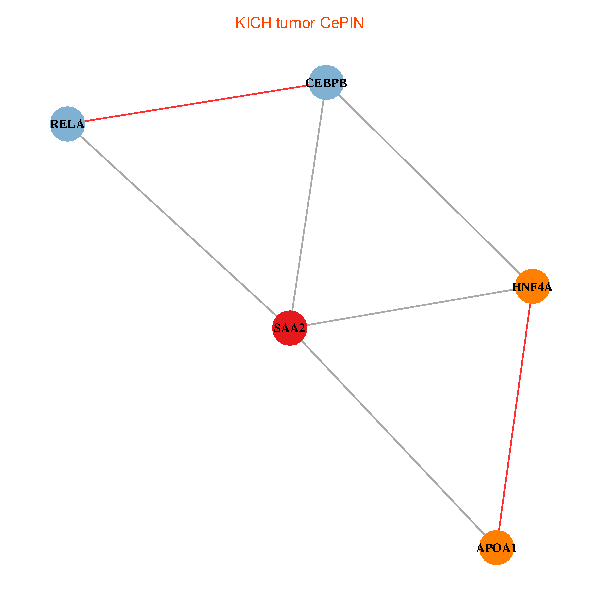
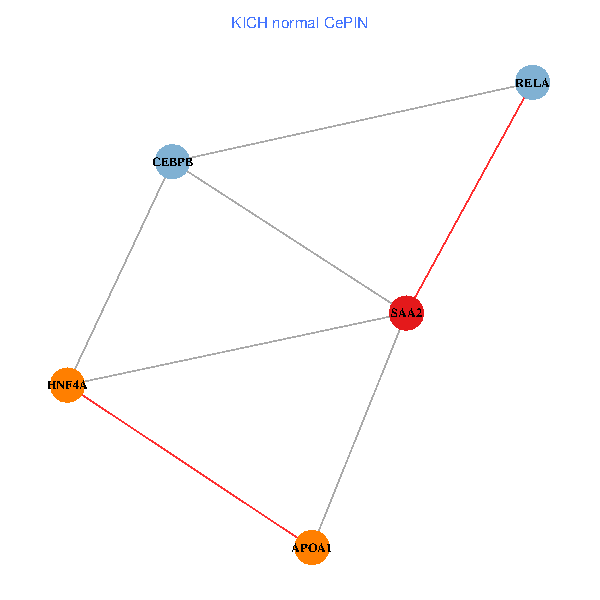
| KICH (tumor) | KICH (normal) |
| SAA2, HNF4A, RELA, CEBPB, APOA1 (tumor) | SAA2, HNF4A, RELA, CEBPB, APOA1 (normal) |
 |  |
| KIRC (tumor) | KIRC (normal) |
| SAA2, HNF4A, RELA, CEBPB, APOA1 (tumor) | SAA2, HNF4A, RELA, CEBPB, APOA1 (normal) |
 |  |
| KIRP (tumor) | KIRP (normal) |
| SAA2, HNF4A, RELA, CEBPB, APOA1 (tumor) | SAA2, HNF4A, RELA, CEBPB, APOA1 (normal) |
 |  |
| LIHC (tumor) | LIHC (normal) |
| SAA2, HNF4A, RELA, CEBPB, APOA1 (tumor) | SAA2, HNF4A, RELA, CEBPB, APOA1 (normal) |
 |  |
| LUAD (tumor) | LUAD (normal) |
| SAA2, HNF4A, RELA, CEBPB, APOA1 (tumor) | SAA2, HNF4A, RELA, CEBPB, APOA1 (normal) |
 |  |
| LUSC (tumor) | LUSC (normal) |
| SAA2, HNF4A, RELA, CEBPB, APOA1 (tumor) | SAA2, HNF4A, RELA, CEBPB, APOA1 (normal) |
 |  |
| PRAD (tumor) | PRAD (normal) |
| SAA2, HNF4A, RELA, CEBPB, APOA1 (tumor) | SAA2, HNF4A, RELA, CEBPB, APOA1 (normal) |
 |  |
| STAD (tumor) | STAD (normal) |
| SAA2, HNF4A, RELA, CEBPB, APOA1 (tumor) | SAA2, HNF4A, RELA, CEBPB, APOA1 (normal) |
 |  |
| THCA (tumor) | THCA (normal) |
| SAA2, HNF4A, RELA, CEBPB, APOA1 (tumor) | SAA2, HNF4A, RELA, CEBPB, APOA1 (normal) |
 |  |
| Top |
| TissGeneProg for SAA2 |
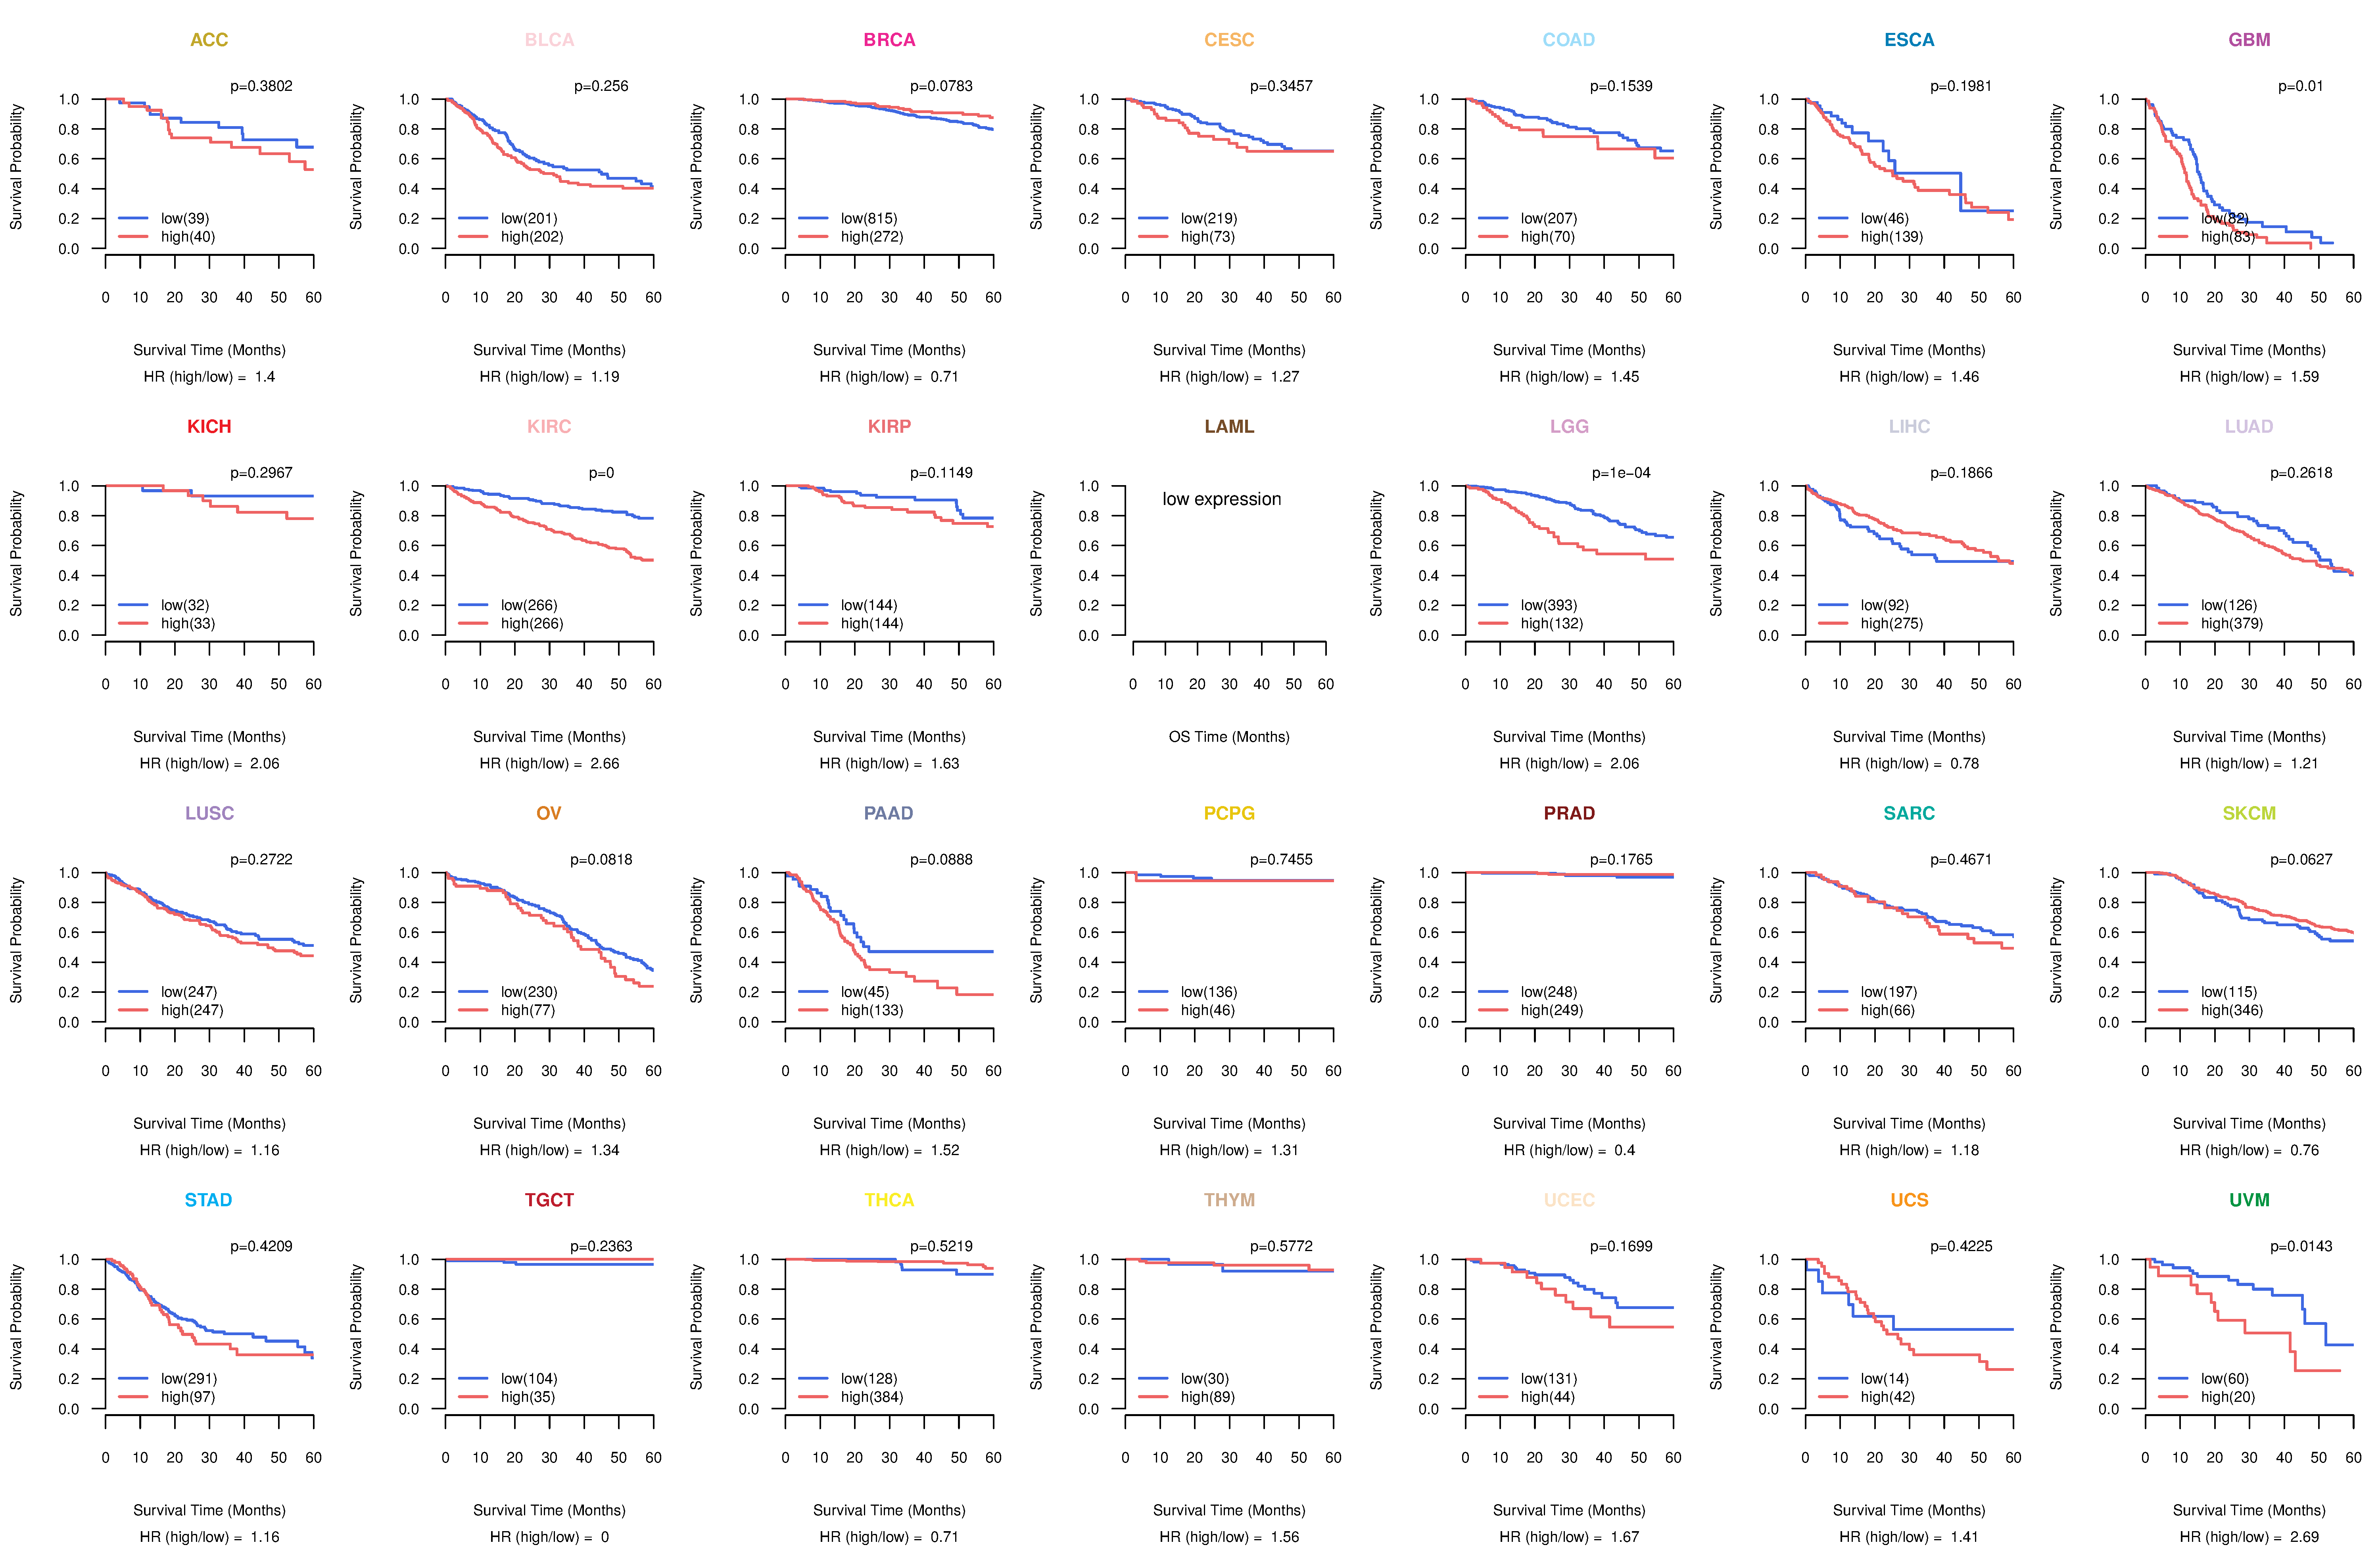
| Kaplan-Meier plots with logrank tests of overall survival (OS) using 28 cancer types (TCGA IlluminaHiSeq_RNASeqV2, pan-cancer normalized log2(norm_counts+1) data, version 2016-08-16) (TCGA clinicalMatrix, phenotype data, version 2016-04-27) * Click on the image to enlarge it in a new window. |
 |
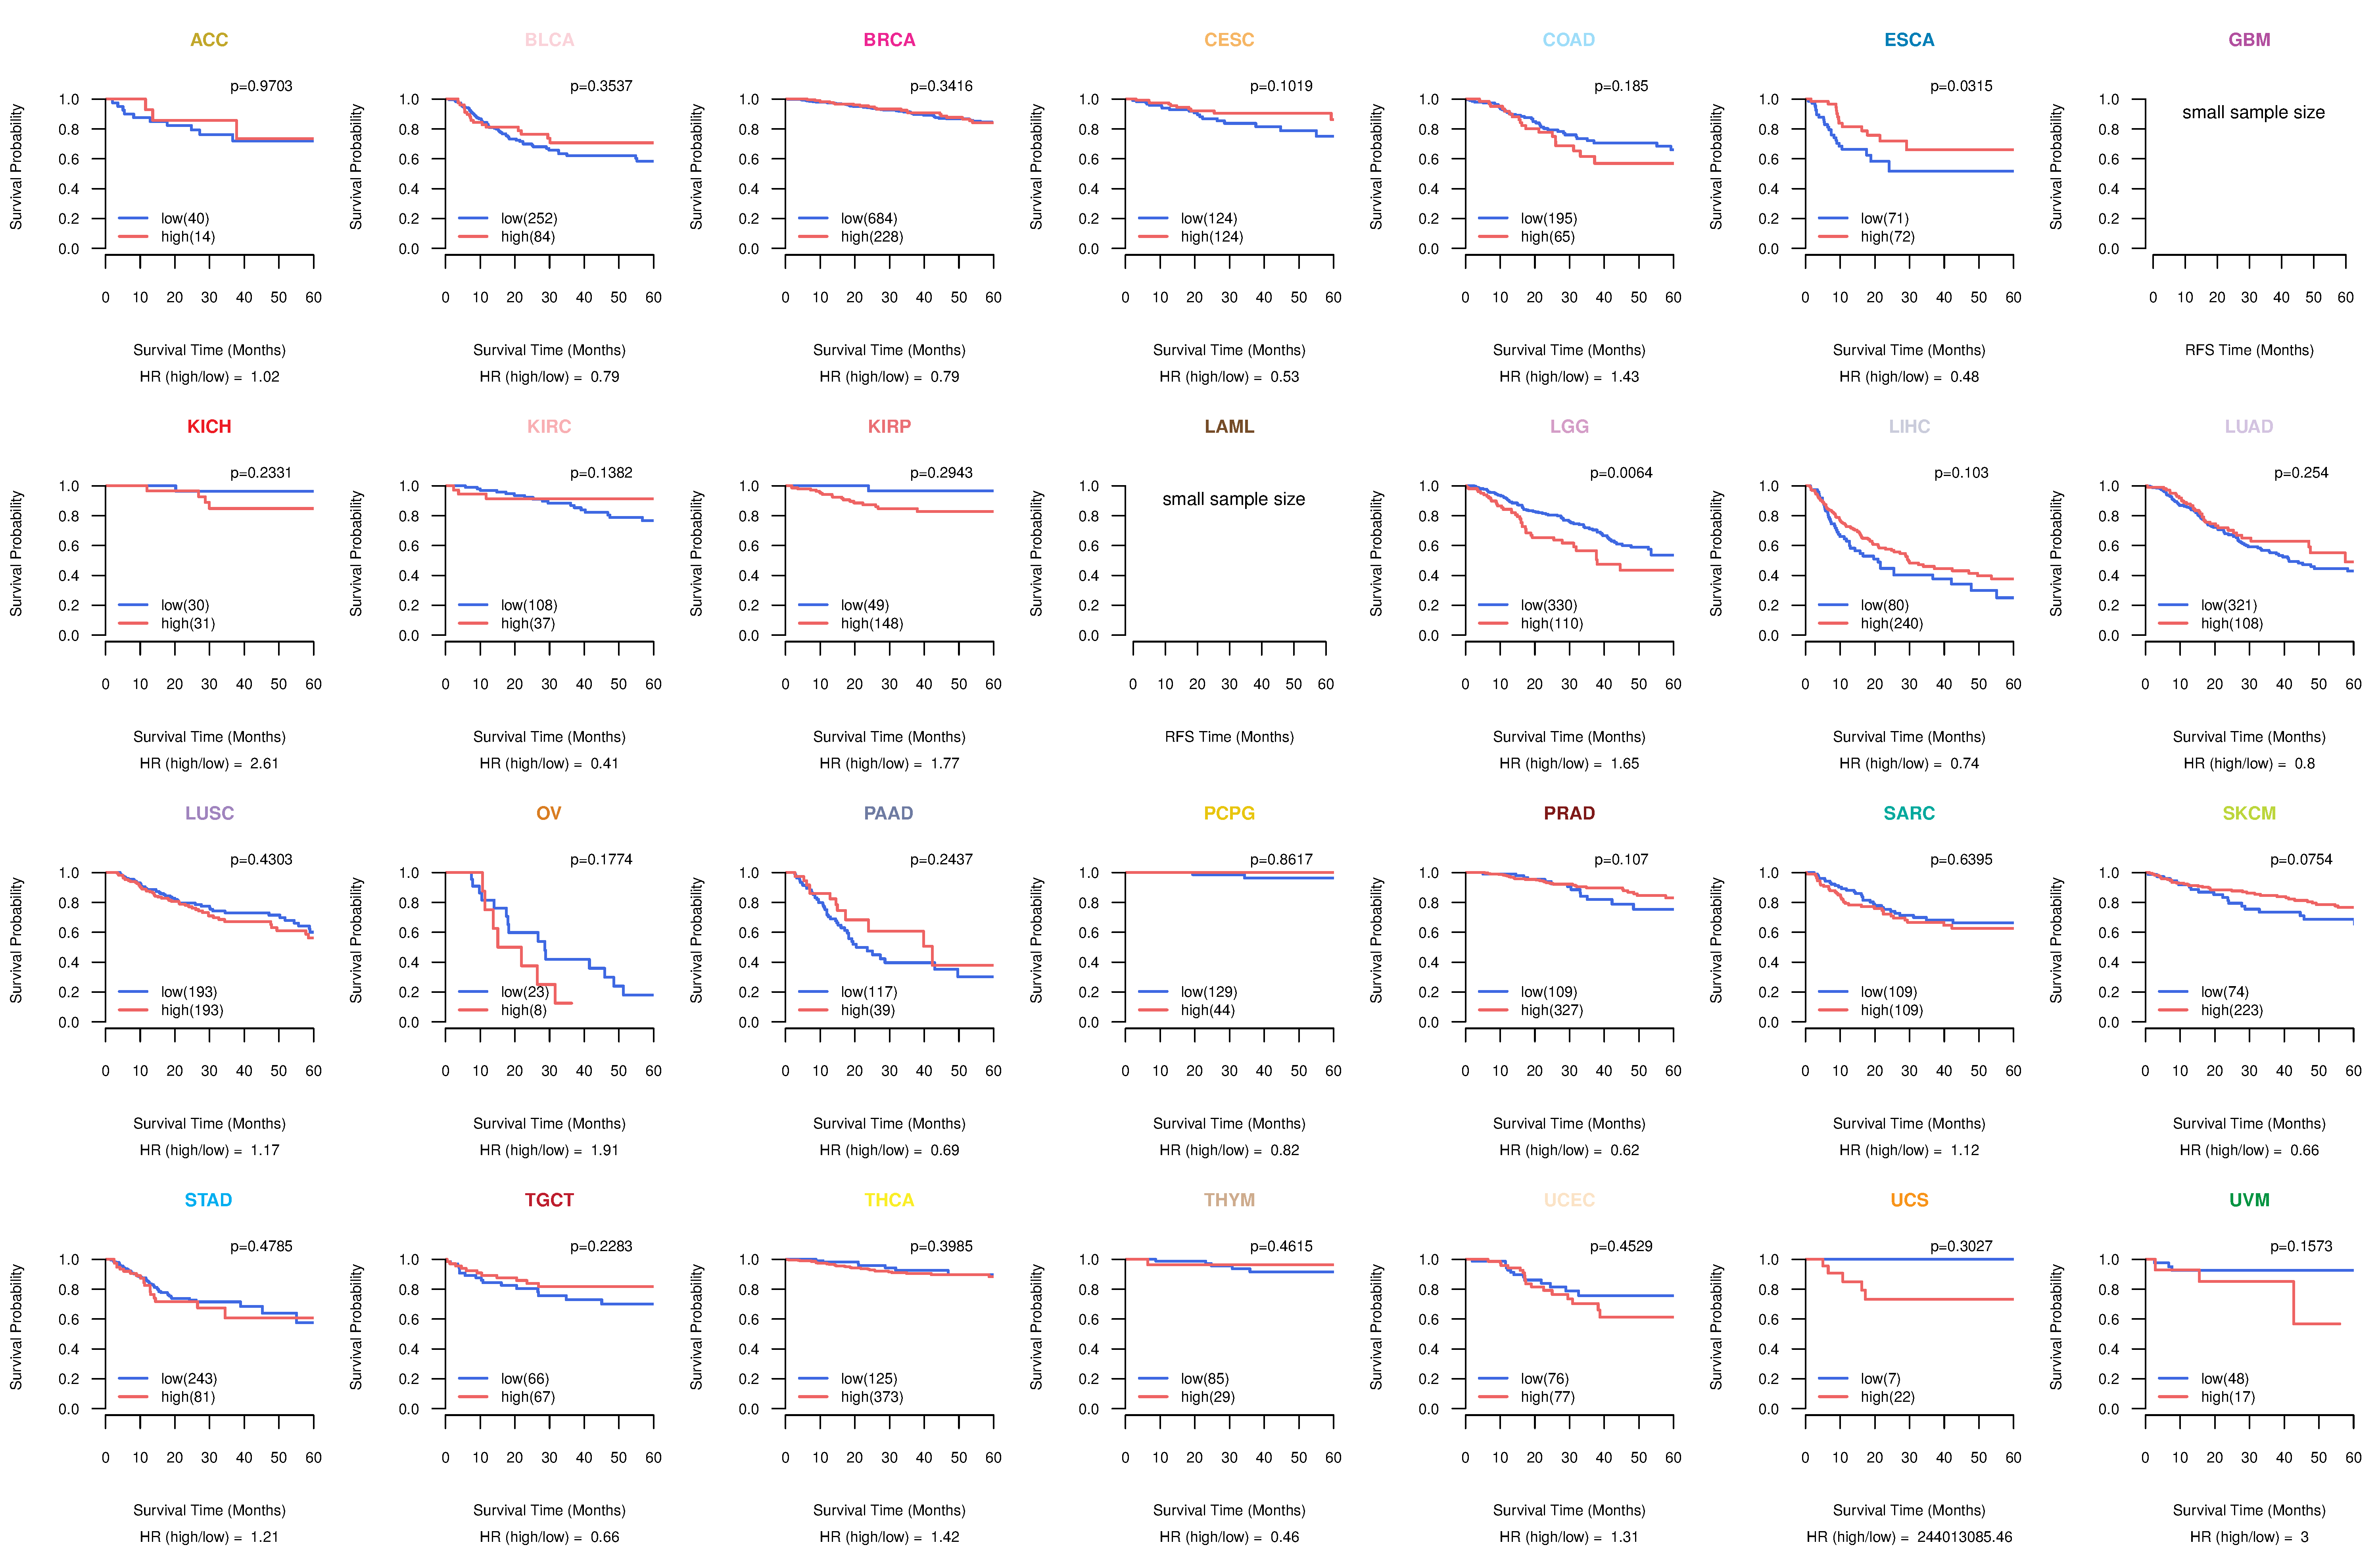
| Kaplan-Meier plots with logrank test of relapse free survival (RFS) using 28 cancer types (TCGA IlluminaHiSeq_RNASeqV2, pan-cancer normalized log2(norm_counts+1) data, version 2016-08-16) (TCGA clinicalMatrix, phenotype data, version 2016-04-27) * Click on the image enlarge it in a new window. |
 |
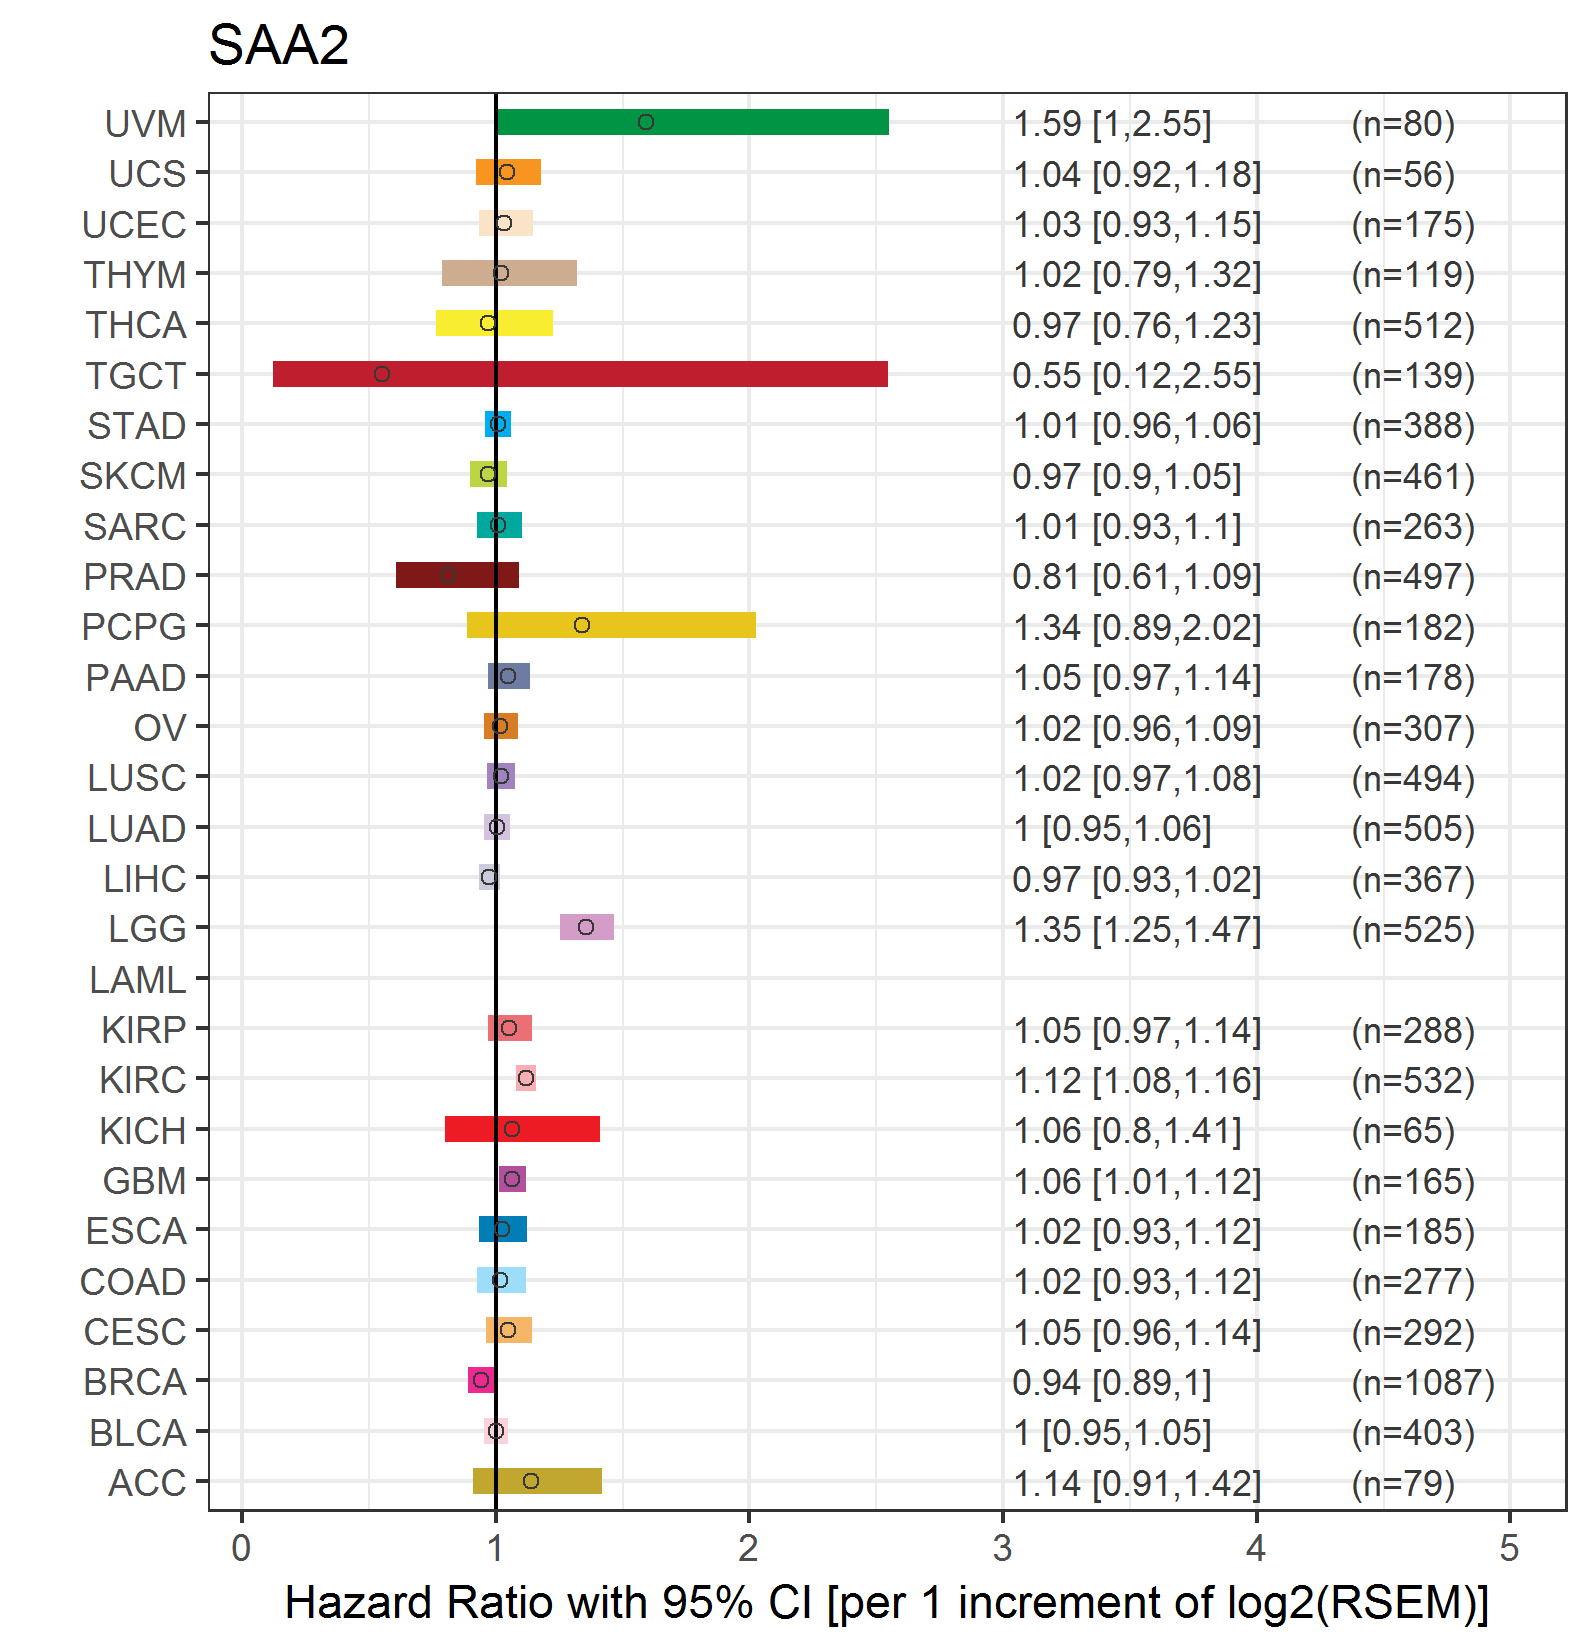
| Forest plot of Cox proportional hazard ratio (HR) and 95% CI of overall survival (OS) using 28 cancer types (TCGA IlluminaHiSeq_RNASeqV2, pan-cancer normalized log2(norm_counts+1) data, version 2016-08-16) (TCGA clinicalMatrix, phenotype data, version 2016-04-27) * Click on the image enlarge it in a new window. |
 |
| Forest plot of Cox proportional hazard ratio (HR) and 95% CI of relapse free survival (RFS) using 28 cancer types (TCGA IlluminaHiSeq_RNASeqV2, pan-cancer normalized log2(norm_counts+1) data, version 2016-08-16) (TCGA clinicalMatrix, phenotype data, version 2016-04-27) * Click on the image enlarge it in a new window. |
 |
| Top |
| TissGeneClin for SAA2 |
| TissGeneDrug for SAA2 |
| Drug information targeting TissGene (DrugBank Version 5.0.6, 2017-04-01) |
| DrugBank ID | Drug name | Drug activity | Drug type | Drug status |
| Top |
| TissGeneDisease for SAA2 |
| Disease information associated with TissGene (DisGeNet, 2016-06-01) |
| Disease ID | Disease name | # pubmeds | Source |
| umls:C0002726 | Amyloidosis | 5 | BeFree,GAD |
| umls:C0221014 | Reactive systemic amyloidosis | 3 | BeFree |
| umls:C0003873 | Rheumatoid Arthritis | 2 | BeFree |
| umls:C0031069 | Familial Mediterranean Fever | 2 | BeFree,GAD |
| umls:C0268382 | Amyloid nephropathy | 2 | BeFree |
| umls:C3536715 | AA amyloidosis | 2 | BeFree |
| umls:C0002395 | Alzheimer's Disease | 1 | GAD |
| umls:C0004936 | Mental disorders | 1 | GAD |
| umls:C0007222 | Cardiovascular Diseases | 1 | GAD |
| umls:C0017601 | Glaucoma | 1 | BeFree |
| umls:C0036983 | Septic Shock | 1 | LHGDN |
| umls:C0040336 | Tobacco Use Disorder | 1 | GAD |
| umls:C0206669 | Hepatocellular Adenoma | 1 | BeFree |
|
Copyright 2016-Present - The University of Texas Health Science Center at Houston (UTHealth) Web File Viewing | How to Report, Fraud, Waste and Abuse | State of Texas | Statewide Search | Texas Homeland Security | Site Policies |