 |
| |
| |
| |
| |
| |
| |
|

| TissGeneSummary for SEMG2 |
 Gene summary Gene summary |
| Basic gene information | Gene symbol | SEMG2 |
| Gene name | semenogelin II | |
| Synonyms | SGII | |
| Cytomap | UCSC genome browser: 20q12-q13.1 | |
| Type of gene | protein-coding | |
| RefGenes | NM_003008.2, | |
| Description | Semenogelin 2semenogelin-2 | |
| Modification date | 20141207 | |
| dbXrefs | MIM : 182141 | |
| HGNC : HGNC | ||
| Ensembl : ENSG00000124157 | ||
| HPRD : 01642 | ||
| Vega : OTTHUMG00000032566 | ||
| Protein | UniProt: go to UniProt's Cross Reference DB Table | |
| Expression | CleanEX: HS_SEMG2 | |
| BioGPS: 6407 | ||
| Pathway | NCI Pathway Interaction Database: SEMG2 | |
| KEGG: SEMG2 | ||
| REACTOME: SEMG2 | ||
| Pathway Commons: SEMG2 | ||
| Context | iHOP: SEMG2 | |
| ligand binding site mutation search in PubMed: SEMG2 | ||
| UCL Cancer Institute: SEMG2 | ||
| Assigned class in TissGDB* | C | |
| Included tissue-specific gene expression resources | TiGER,GTEx | |
| Specific-tissues in normal samples (assigned by TissGDB using HPA, TiGER, and GTEx) | Prostate | |
| Cancer types related to the specific-tissues in cancer samples (assigned by TissGDB using TCGA) | PRAD | |
| Reference showing the relevant tissue of SEMG2 | ||
| Description by TissGene annotations | Significant down-regulated DEG TissgsKTS CNV lost TissGeneKTS | |
| * Class A consists of genes with literature evidence and is part of the cTissGenes. Class B consists of only cTissGenes without additional evidence. The remaining genes belong to Class C. |
| Gene ontology having evidence of Inferred from Direct Assay (IDA) from Entrez |
| GO ID | GO term | PubMed ID |
| Top |
| TissGeneExp for SEMG2 |
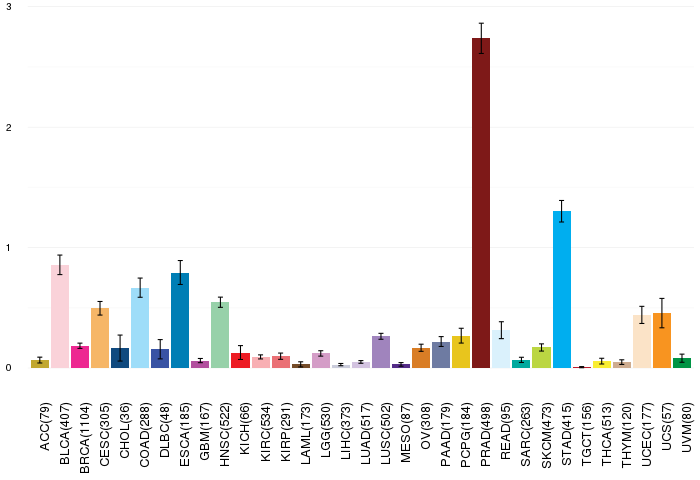
| Gene expressions across 28 cancer types (X-axis: cancer type and Y-axis: log2(norm_counts+1)) (TCGA IlluminaHiSeq_RNASeqV2, pan-cancer normalized log2(norm_counts+1) data, version 2016-08-16) |
 |
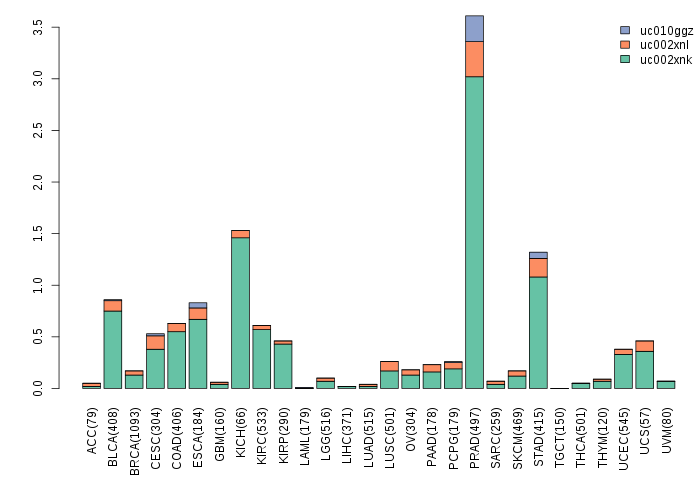
| Gene isoform expressions across 28 cancer types (X-axis: cancer type and Y-axis: log2(norm_counts+1)) (TCGA pan-cancer tcga_rsem_isoform_tpm, version 2016-09-01) |
 |
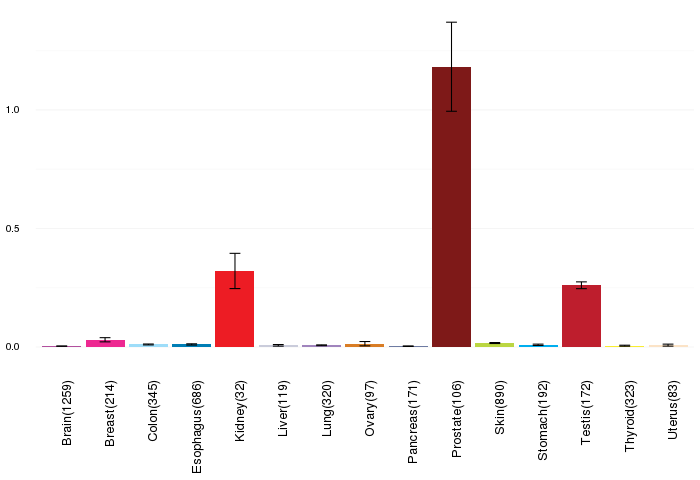
| Gene expressions across normal tissues of GTEx data (GTEx GTEx_Analysis_v6_RNA-seq_RNA-SeQCv1.1.8_gene_rpkm.gct) - Here, we shows the matched tissue types only among our 28 cancer types. |
 |
| Different expressions across 14 cancer types with more than 10 samples between matched tumors and normals (X-axis: cancer type and Y-axis: log2(norm_counts+1)) (TCGA IlluminaHiSeq_RNASeqV2, pan-cancer normalized log2(norm_counts+1) data, version 2016-08-16) |
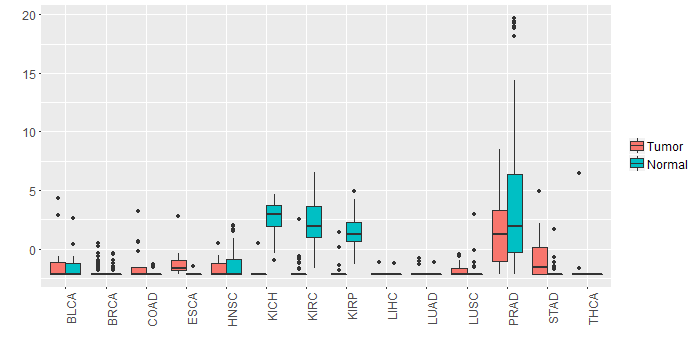 |
| - Significantly differentially expressed cancer types and information. (|Fold change|>1 and FDR<0.05) |
| Cancer type | Mean(exp) in tumor | Mean(exp) in matched normal | Log2FC | P-val. | FDR |
| KIRC | -1.9916556 | 2.1163444 | -4.108 | 6.55E-33 | 1.51E-31 |
| KICH | -2.053958878 | 2.625397122 | -4.679356 | 6.17E-15 | 1.25E-13 |
| KIRP | -1.917383378 | 1.426182247 | -3.343565625 | 4.18E-15 | 1.12E-13 |
| PRAD | 1.455506045 | 4.559138738 | -3.103632692 | 0.0031 | 0.008629938 |
| Top |
| TissGene-miRNA for SEMG2 |
| Significantly anti-correlated miRNAs of TissGene across 28 cancer types (Gene-miRNA relations from TargetScanHuman Relsease 7.1, Conserved_Site_Context_Scores.txt.zip, 06.01.2016) (TCGA IlluminaHiSeq_miRNASeq, log2(RPM+1) data, version 2016-11-21) (TCGA IlluminaHiSeq_RNASeqV2, log2(normalized_count+1) data, version 2016-08-16) (Spearman’s Rank Correlation (p-value<0.05 and coefficient<-0.25)) |
| Cancer type | miRNA id | miRNA accession | P-val. | Coeff. | # samples |
| Top |
| TissGeneMut for SEMG2 |
| TissGeneSNV for SEMG2 |
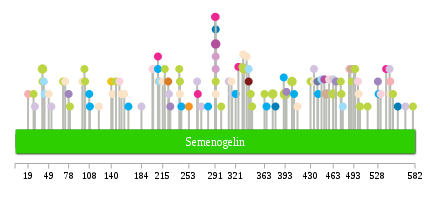
| nsSNV counts per each loci. Different colors of circles represent different cancer types. Circle size denotes number of samples. (TCGA somatic mutation (SNPs and small INDELs) data, version 2016-04-25) * Click on the image to enlarge it in a new window. |
 |
 |
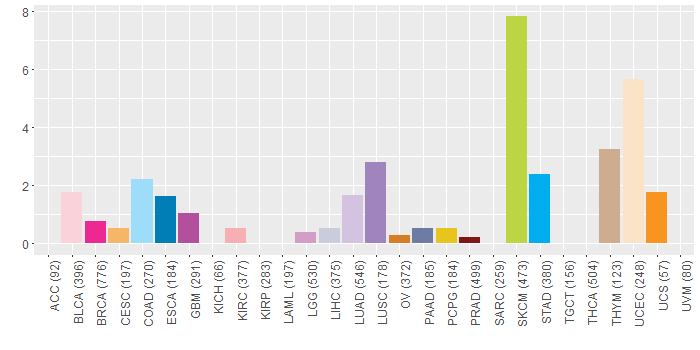
| Somatic nucleotide variants of TissGene across 28 cancer types (X-axis: cancer type and Y-axis: % of mutated samples) The numbers in parentheses are numbers of samples with mutation (nsSNVs). (TCGA somatic mutation (SNPs and small INDELs) data, version 2016-04-25) |
 |
| - nsSNVs sorted by frequency. |
| AAchange | Cancer type | # samples |
| p.P393S | SKCM | 4 |
| p.P453H | THYM | 2 |
| p.H333Y | SKCM | 2 |
| p.E463K | SKCM | 2 |
| p.S375L | SKCM | 2 |
| p.E403K | SKCM | 2 |
| p.R292C | GBM | 2 |
| p.P40S | SKCM | 2 |
| p.S550F | SKCM | 1 |
| p.S493I | THYM | 1 |
| p.E379K | ESCA | 1 |
| p.H242Q | STAD | 1 |
| p.K363T | SKCM | 1 |
| p.R292H | LGG | 1 |
| p.R292H | ESCA | 1 |
| p.S411L | UCEC | 1 |
| p.H70Y | SKCM | 1 |
| p.Q215* | UCEC | 1 |
| p.I73V | UCEC | 1 |
| p.H122Y | UCEC | 1 |
| p.L155I | UCEC | 1 |
| p.R391T | STAD | 1 |
| p.H568D | LUAD | 1 |
| p.Q140K | PCPG | 1 |
| p.R208C | STAD | 1 |
| p.A19V | KIRC | 1 |
| p.Q98E | UCEC | 1 |
| p.S315Y | UCEC | 1 |
| p.G340D | COAD | 1 |
| p.N266I | BRCA | 1 |
| p.Q457E | BLCA | 1 |
| p.R292H | SKCM | 1 |
| p.Q529H | STAD | 1 |
| p.G147E | SKCM | 1 |
| p.S490F | SKCM | 1 |
| p.I406M | STAD | 1 |
| p.P579Q | SKCM | 1 |
| p.R208H | BRCA | 1 |
| p.Q366K | STAD | 1 |
| p.Q486H | BLCA | 1 |
| p.R80Q | SKCM | 1 |
| p.E440D | PAAD | 1 |
| p.P240S | SKCM | 1 |
| p.R292L | UCEC | 1 |
| p.H300Y | SKCM | 1 |
| p.R165K | STAD | 1 |
| p.K311Q | LUAD | 1 |
| p.R292C | LGG | 1 |
| p.D532N | BLCA | 1 |
| p.D488Y | THYM | 1 |
| p.Y109N | STAD | 1 |
| p.K29T | LUAD | 1 |
| p.E200Q | BLCA | 1 |
| p.E475K | SKCM | 1 |
| p.R281Q | STAD | 1 |
| p.K325Q | BRCA | 1 |
| p.G152E | BLCA | 1 |
| p.S435Y | UCEC | 1 |
| p.S495F | SKCM | 1 |
| p.K321N | STAD | 1 |
| p.G218R | SKCM | 1 |
| p.V450I | GBM | 1 |
| p.V502A | SKCM | 1 |
| p.S435C | LUAD | 1 |
| p.P513S | SKCM | 1 |
| p.F49V | UCEC | 1 |
| p.S446T | COAD | 1 |
| p.Y546X | KIRC | 1 |
| p.Q337* | UCEC | 1 |
| p.W78* | LUSC | 1 |
| p.Q395E | LUSC | 1 |
| p.I332T | UCEC | 1 |
| p.T331A | SKCM | 1 |
| p.V226M | LUSC | 1 |
| p.K265E | LUAD | 1 |
| p.R477X | READ | 1 |
| p.H540D | BRCA | 1 |
| p.S430F | SKCM | 1 |
| p.G102E | SKCM | 1 |
| p.E209K | CESC | 1 |
| p.P240H | UCEC | 1 |
| p.R292H | BRCA | 1 |
| p.P142H | UCEC | 1 |
| p.S467* | LUSC | 1 |
| p.E474K | SKCM | 1 |
| p.G42R | COAD | 1 |
| p.R477X | COAD | 1 |
| p.G340D | PRAD | 1 |
| p.S172R | MESO | 1 |
| p.G184C | LUAD | 1 |
| p.I316F | LIHC | 1 |
| p.Q43K | COAD | 1 |
| p.D53G | LUAD | 1 |
| p.K271E | LUAD | 1 |
| p.K441Q | STAD | 1 |
| p.G170E | HNSC | 1 |
| p.K500R | UCEC | 1 |
| p.G528V | LUSC | 1 |
| p.N108H | STAD | 1 |
| p.R545I | LUAD | 1 |
| p.T210S | COAD | 1 |
| p.E499K | BLCA | 1 |
| p.G101S | SKCM | 1 |
| p.E440Q | HNSC | 1 |
| p.V557L | ESCA | 1 |
| p.Y546C | UCEC | 1 |
| p.S291P | BRCA | 1 |
| p.I253M | UCS | 1 |
| p.H239Y | SKCM | 1 |
| p.L201P | BLCA | 1 |
| p.G27E | SKCM | 1 |
| p.R292H | READ | 1 |
| p.K345T | SKCM | 1 |
| p.E463V | LIHC | 1 |
| p.L87F | HNSC | 1 |
| p.V224A | LUAD | 1 |
| p.V223L | OV | 1 |
| p.P40L | SKCM | 1 |
| p.C159Y | UCEC | 1 |
| p.E343K | SKCM | 1 |
| p.G170R | HNSC | 1 |
| Top |
| TissGeneCNV for SEMG2 |
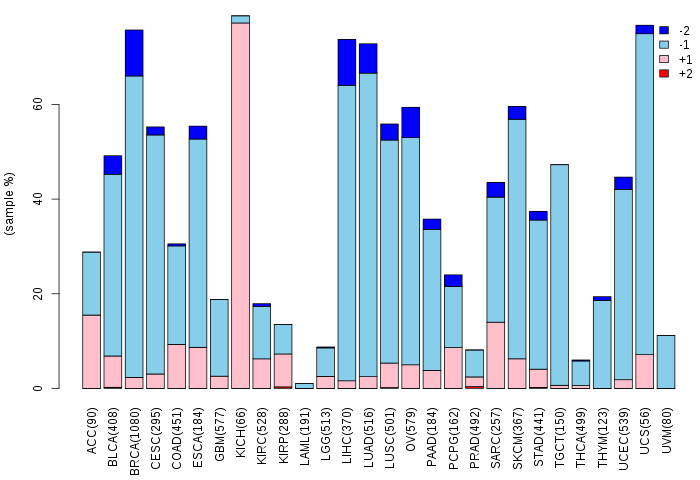
| Copy number variations of TissGene across 28 cancer types (X-axis: cancer type and Y-axis: % of CNV samples) (TCGA Gistic2_CopyNumber_Gistic2_all_data_by_genes, Gistic2 copy number data, version 2016-08-16) |
 |
| Top |
| TissGeneFusions for SEMG2 |
| Fusion genes including TissGene (ChimerDB 3.0, 2016-12-01 and TCGA fusion Portal 2015-12-01) |
| Database | Src | Cancer type | Sample | Fusion gene | ORF | 5'-gene BP | 3'-gene BP |
| Top |
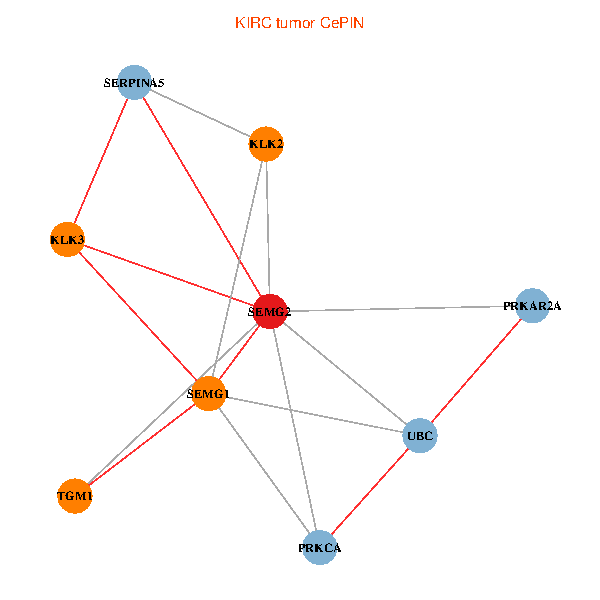
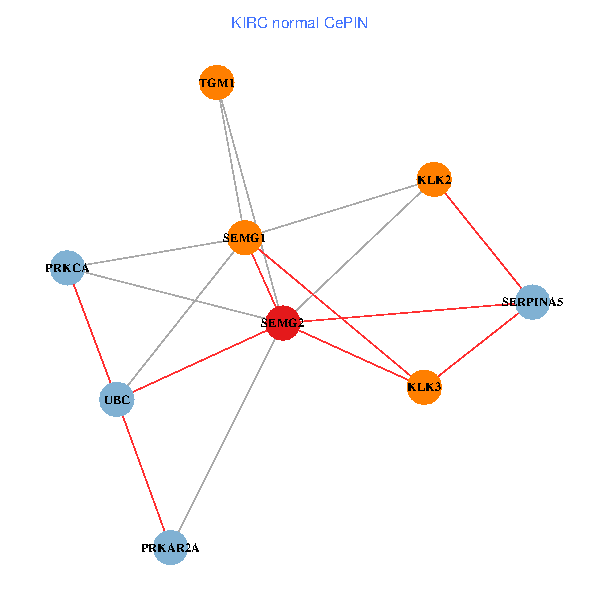
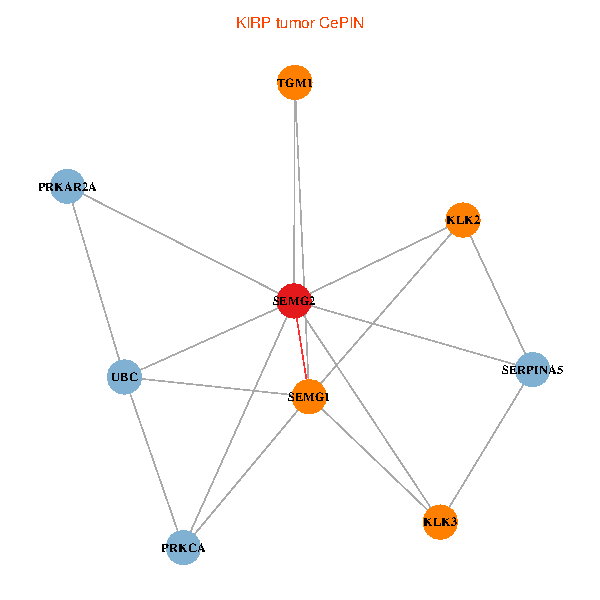
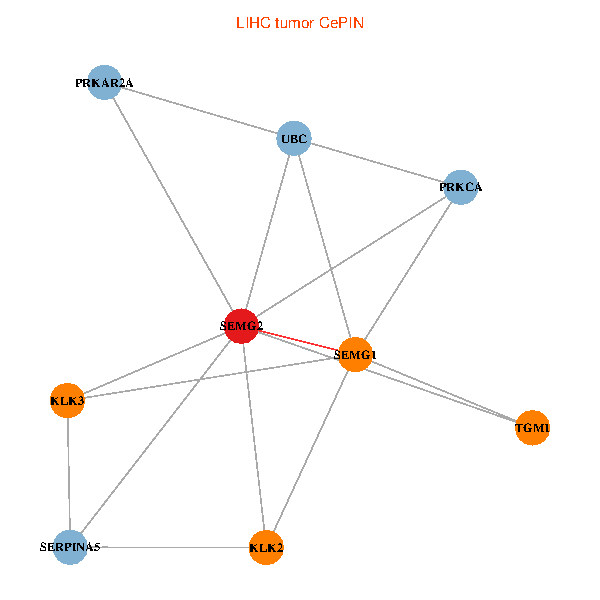
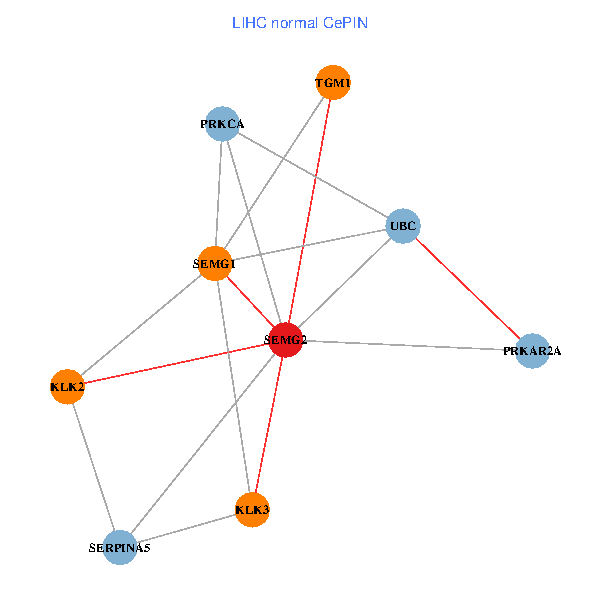
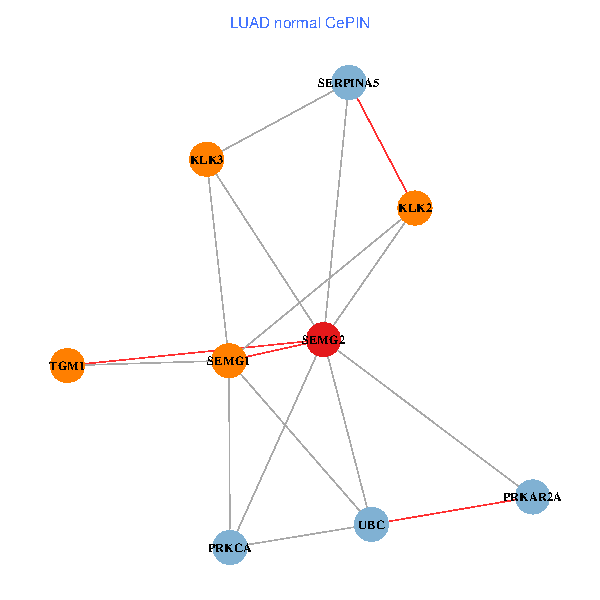
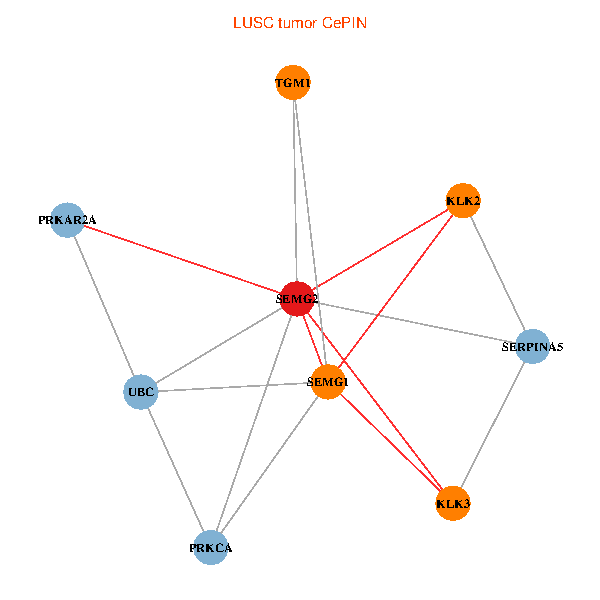
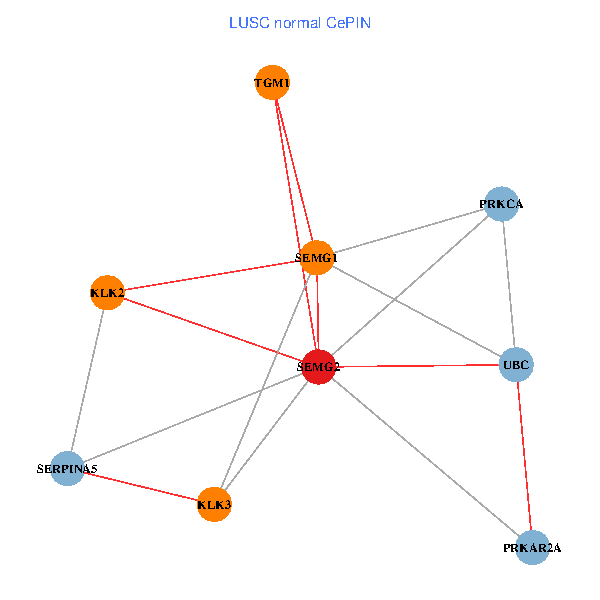
| TissGeneNet for SEMG2 |
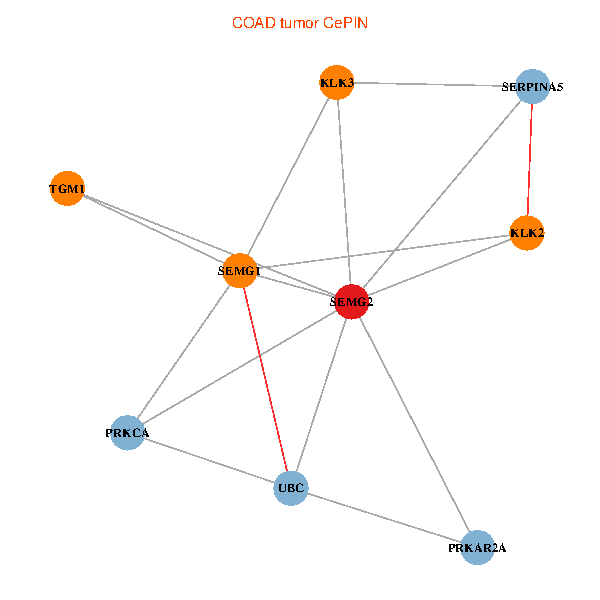
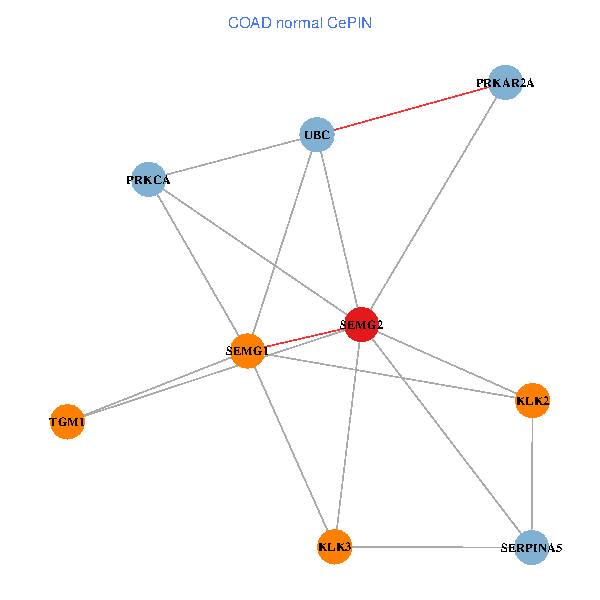
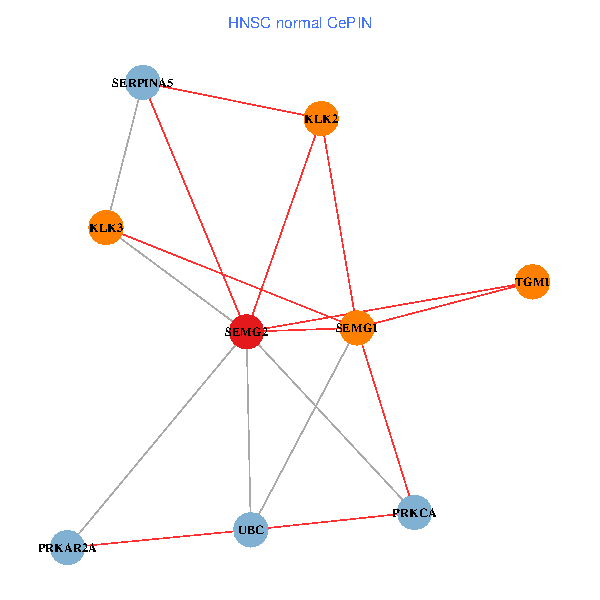
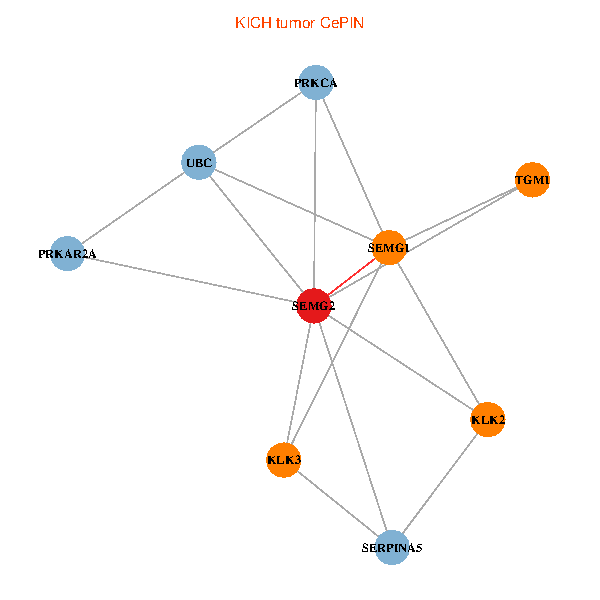
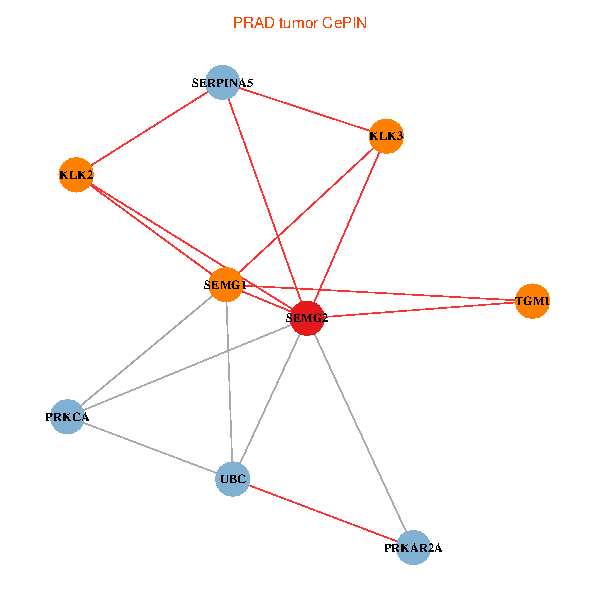
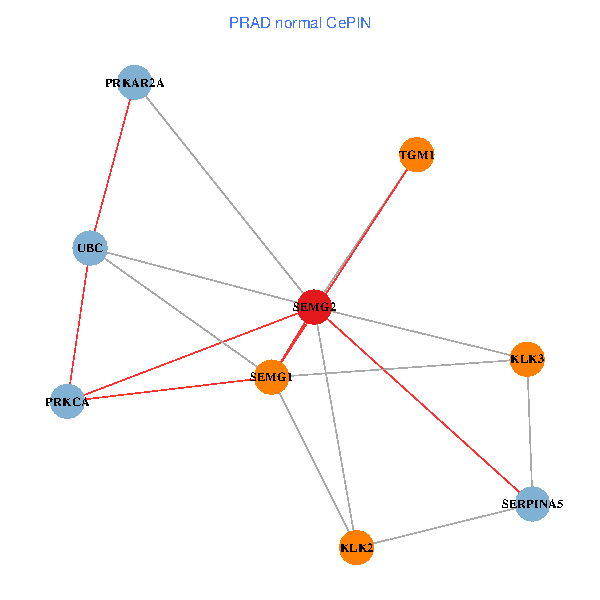
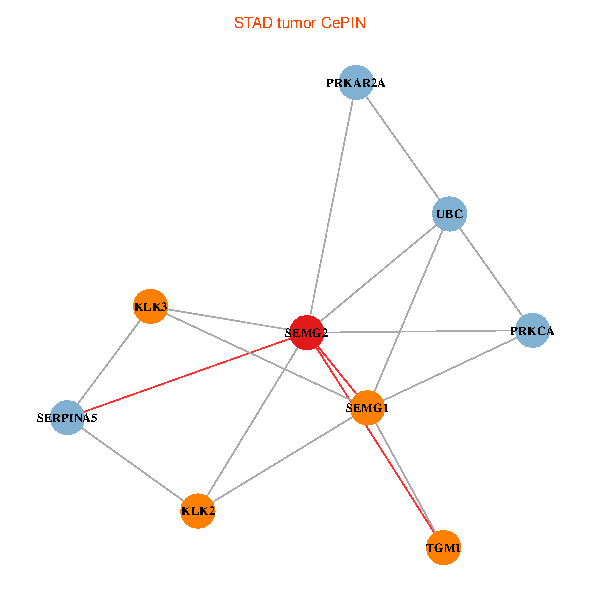
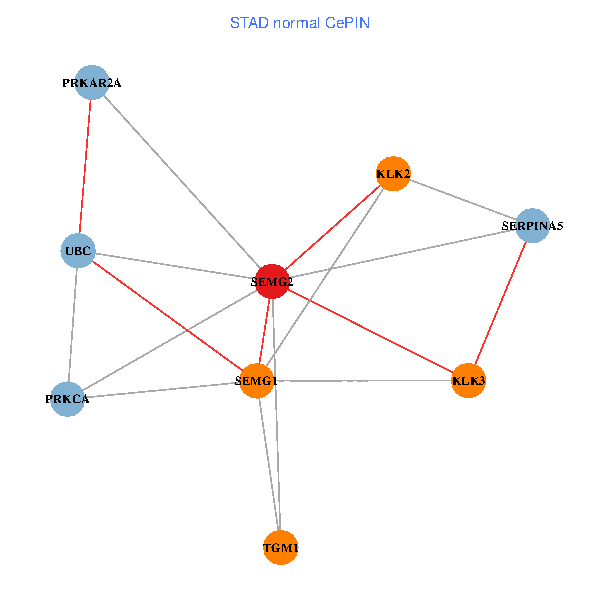
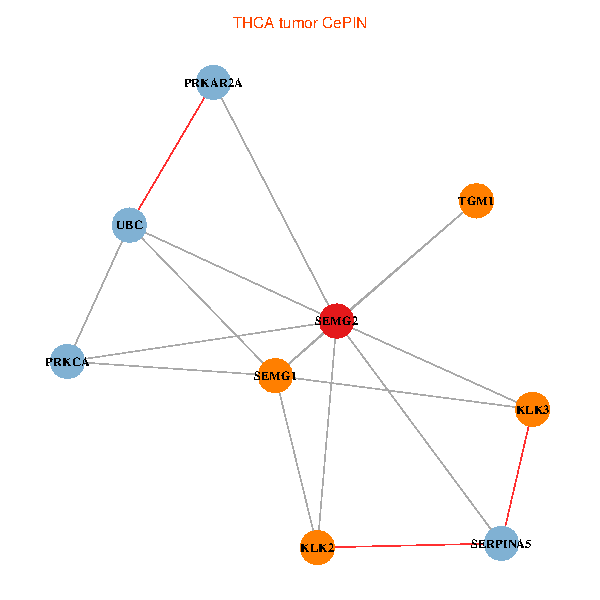
| Co-expressed gene networks based on protein-protein interaction data (CePIN) (TCGA IlluminaHiSeq_RNASeqV2, pan-cancer normalized log2(norm_counts+1) data, version 2016-08-16) (PINA2 ppi data) |
| BRCA (tumor) | BRCA (normal) |
| SEMG2, UBC, PRKCA, SERPINA5, KLK3, PRKAR2A, SEMG1, KLK2, TGM1 (tumor) | SEMG2, UBC, PRKCA, SERPINA5, KLK3, PRKAR2A, SEMG1, KLK2, TGM1 (normal) |
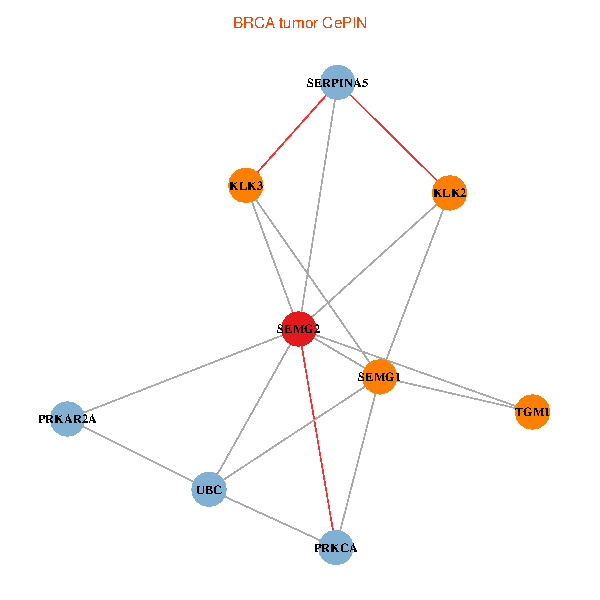 |  |
| COAD (tumor) | COAD (normal) |
| SEMG2, UBC, PRKCA, SERPINA5, KLK3, PRKAR2A, SEMG1, KLK2, TGM1 (tumor) | SEMG2, UBC, PRKCA, SERPINA5, KLK3, PRKAR2A, SEMG1, KLK2, TGM1 (normal) |
 |  |
| HNSC (tumor) | HNSC (normal) |
| SEMG2, UBC, PRKCA, SERPINA5, KLK3, PRKAR2A, SEMG1, KLK2, TGM1 (tumor) | SEMG2, UBC, PRKCA, SERPINA5, KLK3, PRKAR2A, SEMG1, KLK2, TGM1 (normal) |
 |  |
| KICH (tumor) | KICH (normal) |
| SEMG2, UBC, PRKCA, SERPINA5, KLK3, PRKAR2A, SEMG1, KLK2, TGM1 (tumor) | SEMG2, UBC, PRKCA, SERPINA5, KLK3, PRKAR2A, SEMG1, KLK2, TGM1 (normal) |
 |  |
| KIRC (tumor) | KIRC (normal) |
| SEMG2, UBC, PRKCA, SERPINA5, KLK3, PRKAR2A, SEMG1, KLK2, TGM1 (tumor) | SEMG2, UBC, PRKCA, SERPINA5, KLK3, PRKAR2A, SEMG1, KLK2, TGM1 (normal) |
 |  |
| KIRP (tumor) | KIRP (normal) |
| SEMG2, UBC, PRKCA, SERPINA5, KLK3, PRKAR2A, SEMG1, KLK2, TGM1 (tumor) | SEMG2, UBC, PRKCA, SERPINA5, KLK3, PRKAR2A, SEMG1, KLK2, TGM1 (normal) |
 |  |
| LIHC (tumor) | LIHC (normal) |
| SEMG2, UBC, PRKCA, SERPINA5, KLK3, PRKAR2A, SEMG1, KLK2, TGM1 (tumor) | SEMG2, UBC, PRKCA, SERPINA5, KLK3, PRKAR2A, SEMG1, KLK2, TGM1 (normal) |
 |  |
| LUAD (tumor) | LUAD (normal) |
| SEMG2, UBC, PRKCA, SERPINA5, KLK3, PRKAR2A, SEMG1, KLK2, TGM1 (tumor) | SEMG2, UBC, PRKCA, SERPINA5, KLK3, PRKAR2A, SEMG1, KLK2, TGM1 (normal) |
 |  |
| LUSC (tumor) | LUSC (normal) |
| SEMG2, UBC, PRKCA, SERPINA5, KLK3, PRKAR2A, SEMG1, KLK2, TGM1 (tumor) | SEMG2, UBC, PRKCA, SERPINA5, KLK3, PRKAR2A, SEMG1, KLK2, TGM1 (normal) |
 |  |
| PRAD (tumor) | PRAD (normal) |
| SEMG2, UBC, PRKCA, SERPINA5, KLK3, PRKAR2A, SEMG1, KLK2, TGM1 (tumor) | SEMG2, UBC, PRKCA, SERPINA5, KLK3, PRKAR2A, SEMG1, KLK2, TGM1 (normal) |
 |  |
| STAD (tumor) | STAD (normal) |
| SEMG2, UBC, PRKCA, SERPINA5, KLK3, PRKAR2A, SEMG1, KLK2, TGM1 (tumor) | SEMG2, UBC, PRKCA, SERPINA5, KLK3, PRKAR2A, SEMG1, KLK2, TGM1 (normal) |
 |  |
| THCA (tumor) | THCA (normal) |
| SEMG2, UBC, PRKCA, SERPINA5, KLK3, PRKAR2A, SEMG1, KLK2, TGM1 (tumor) | SEMG2, UBC, PRKCA, SERPINA5, KLK3, PRKAR2A, SEMG1, KLK2, TGM1 (normal) |
 |  |
| Top |
| TissGeneProg for SEMG2 |
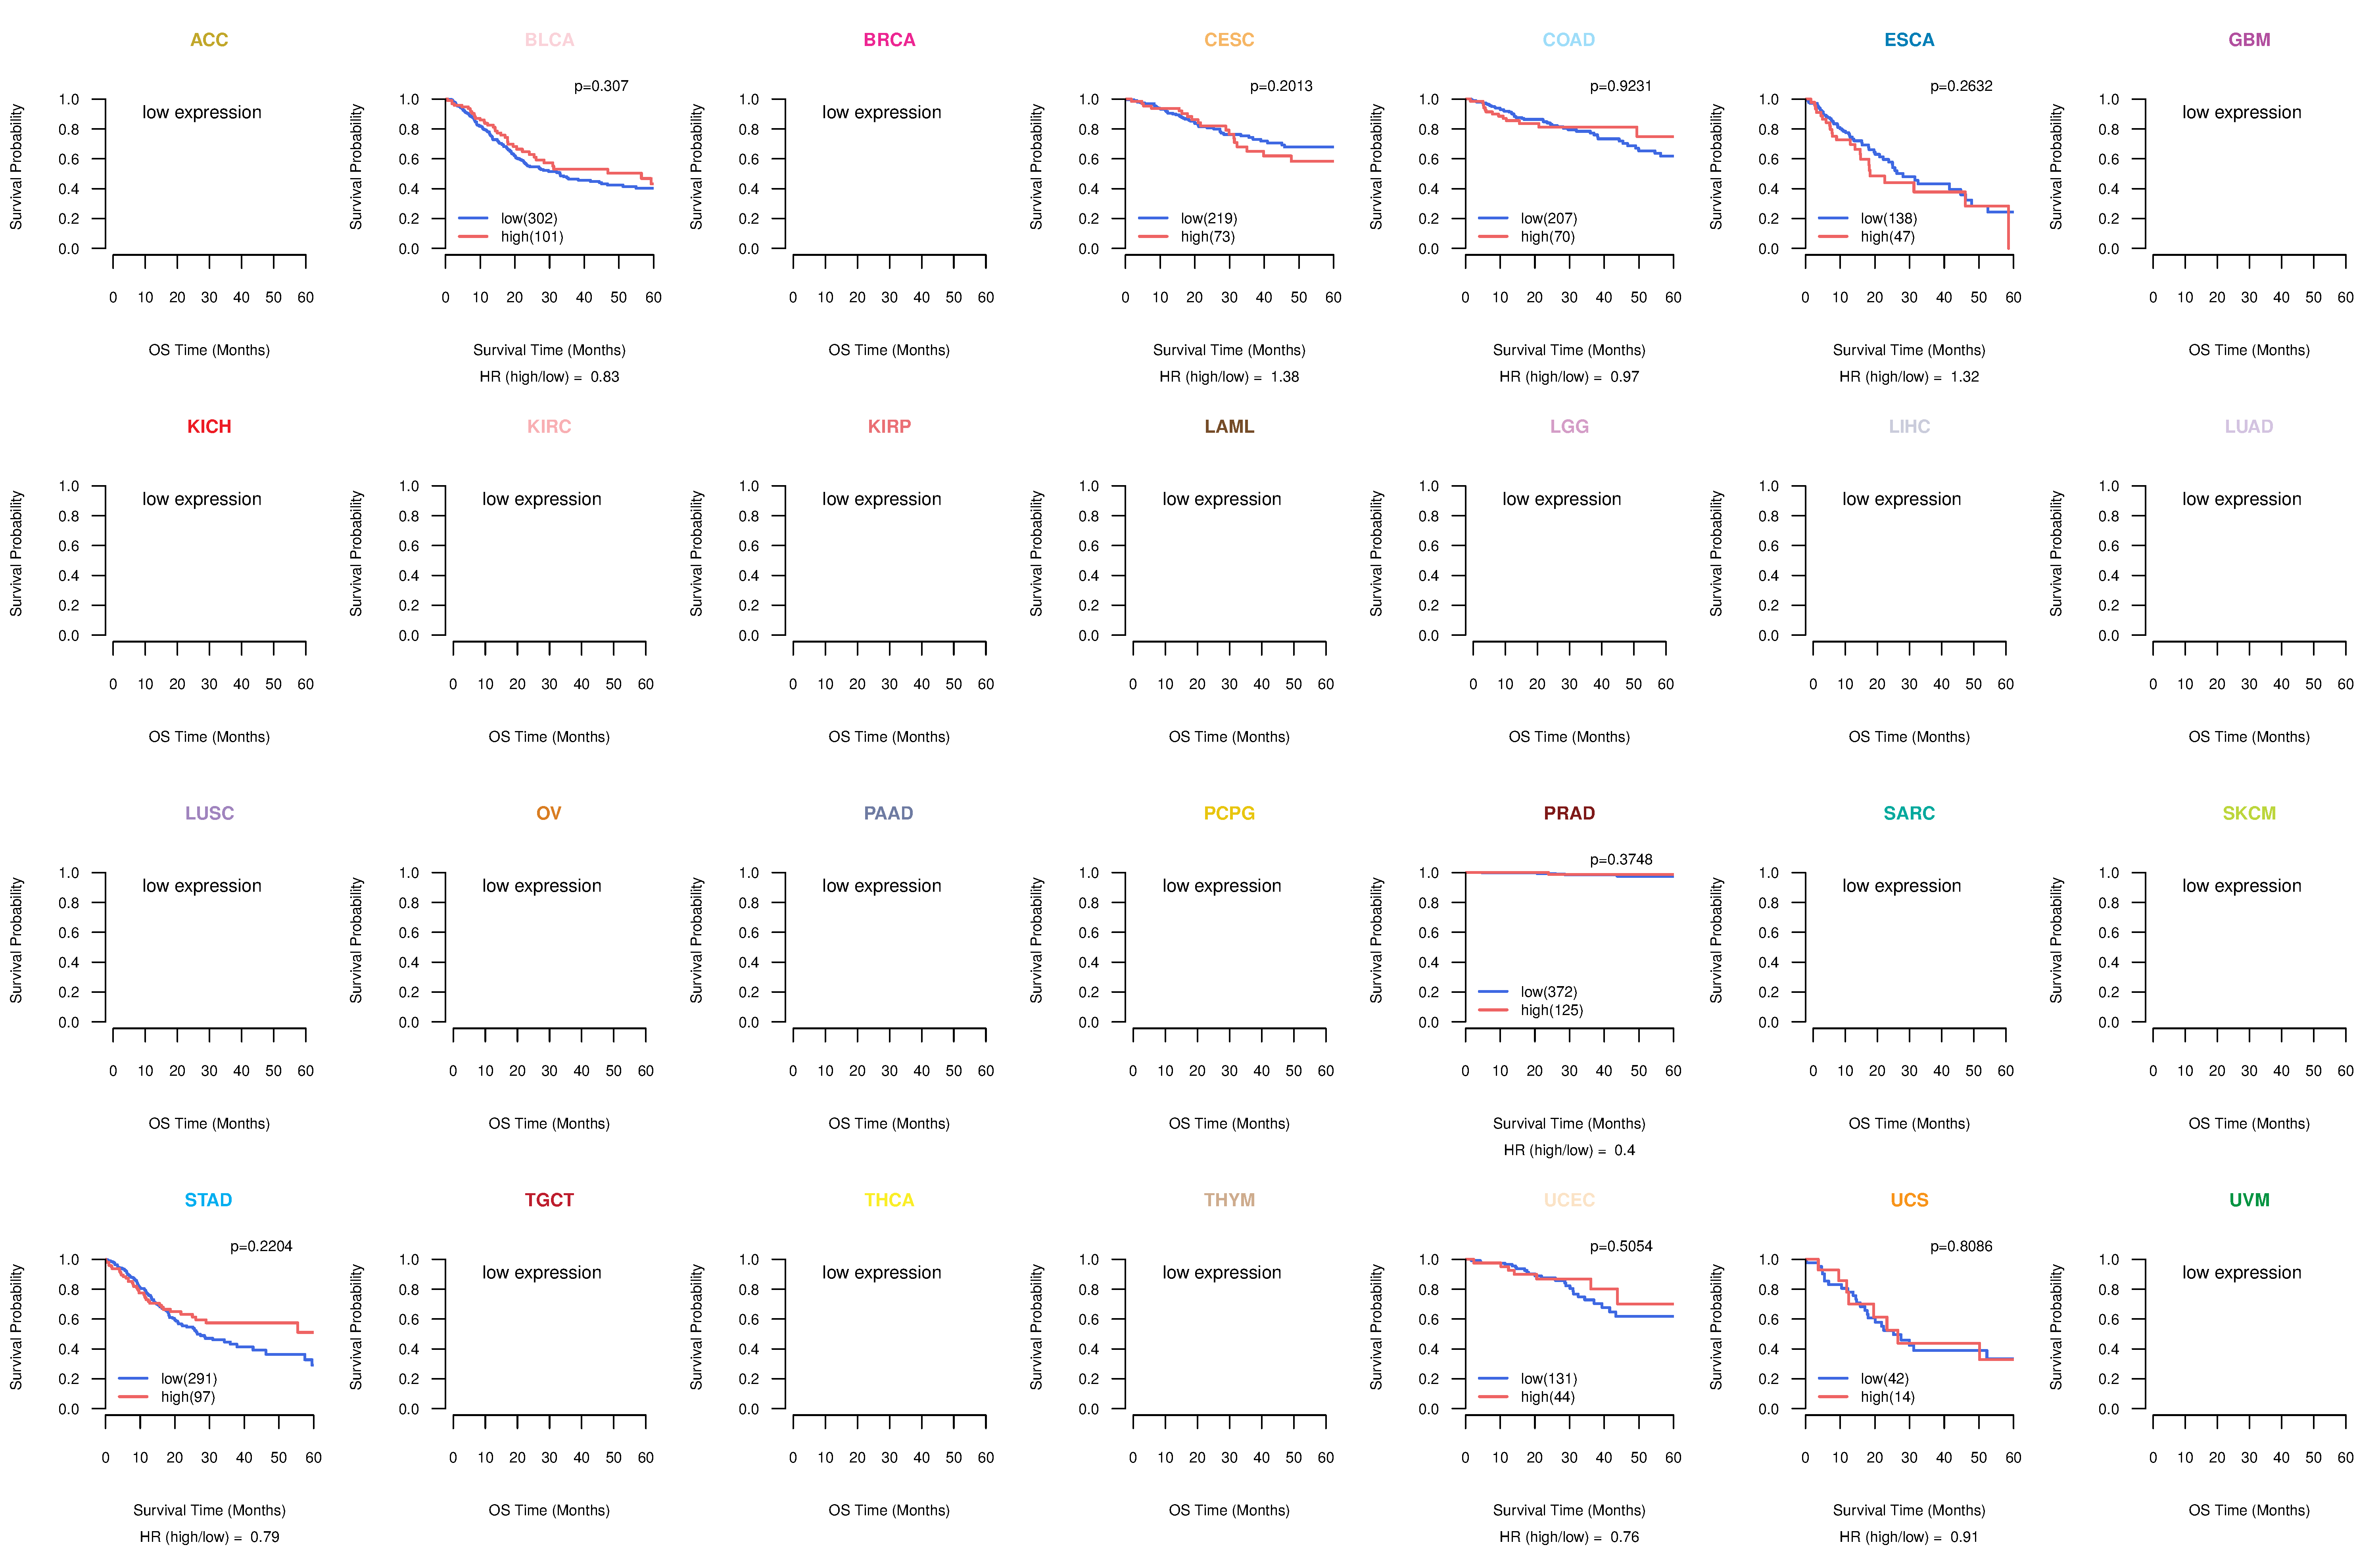
| Kaplan-Meier plots with logrank tests of overall survival (OS) using 28 cancer types (TCGA IlluminaHiSeq_RNASeqV2, pan-cancer normalized log2(norm_counts+1) data, version 2016-08-16) (TCGA clinicalMatrix, phenotype data, version 2016-04-27) * Click on the image to enlarge it in a new window. |
 |
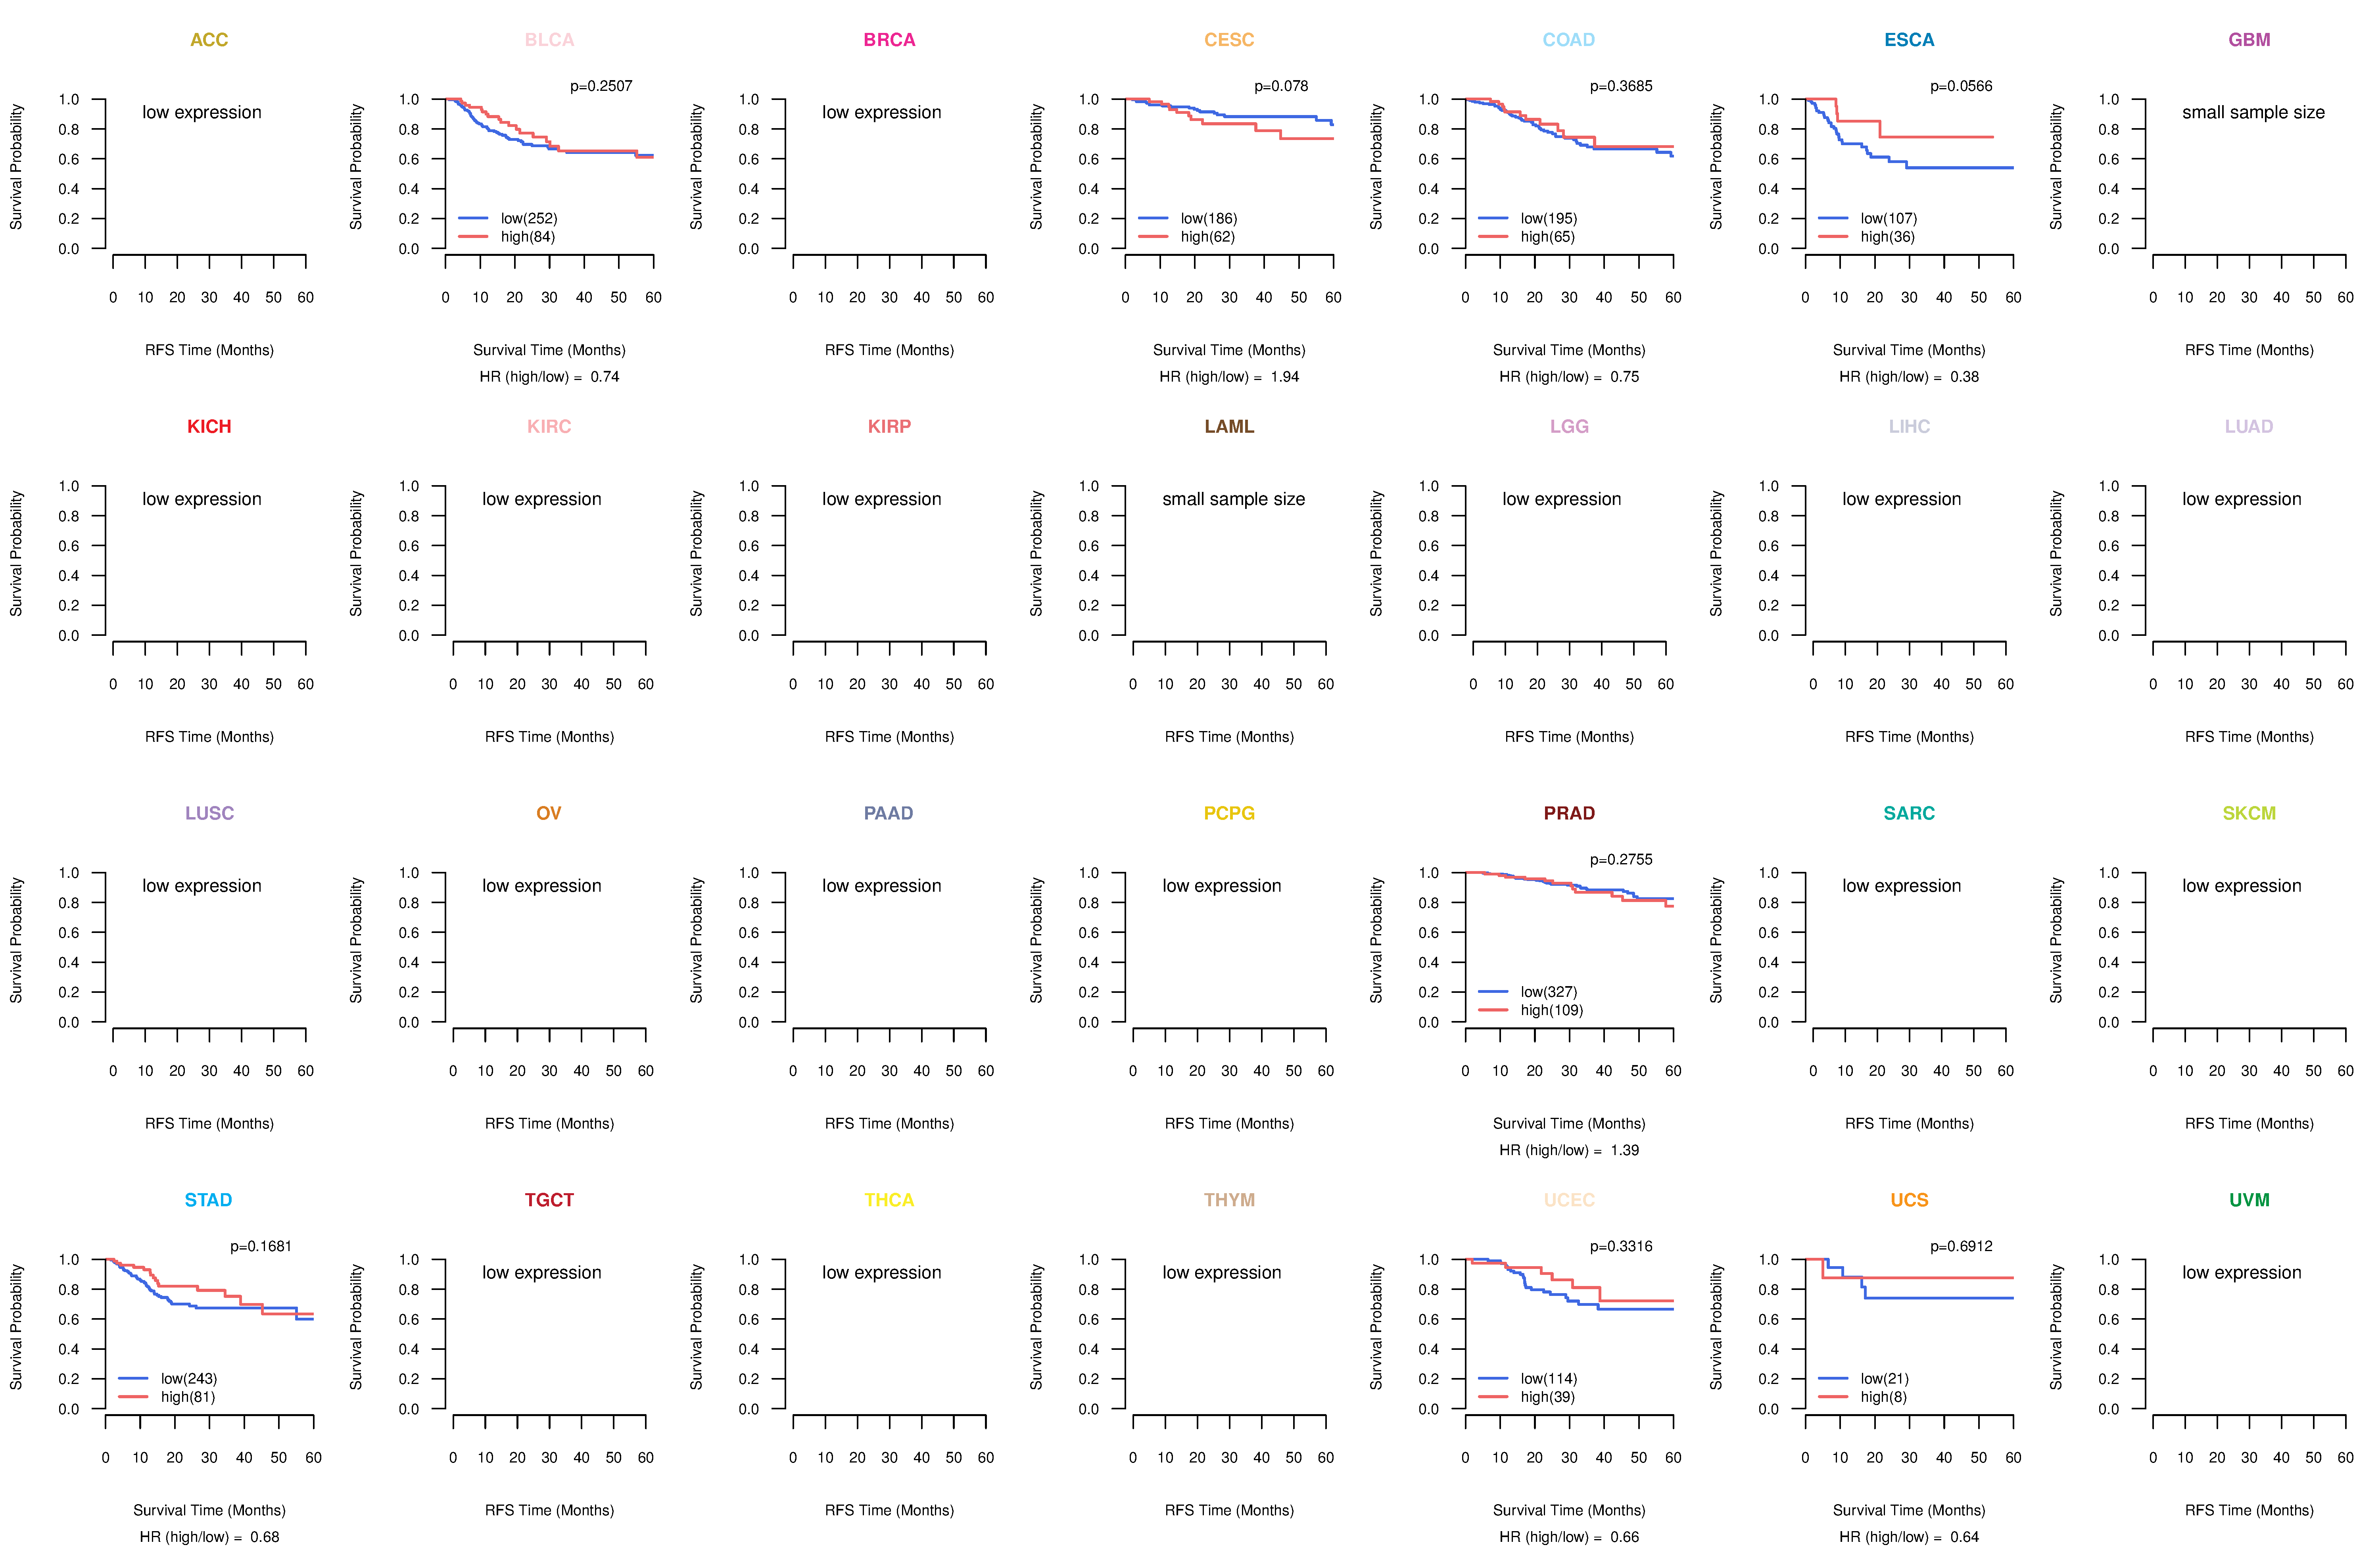
| Kaplan-Meier plots with logrank test of relapse free survival (RFS) using 28 cancer types (TCGA IlluminaHiSeq_RNASeqV2, pan-cancer normalized log2(norm_counts+1) data, version 2016-08-16) (TCGA clinicalMatrix, phenotype data, version 2016-04-27) * Click on the image enlarge it in a new window. |
 |
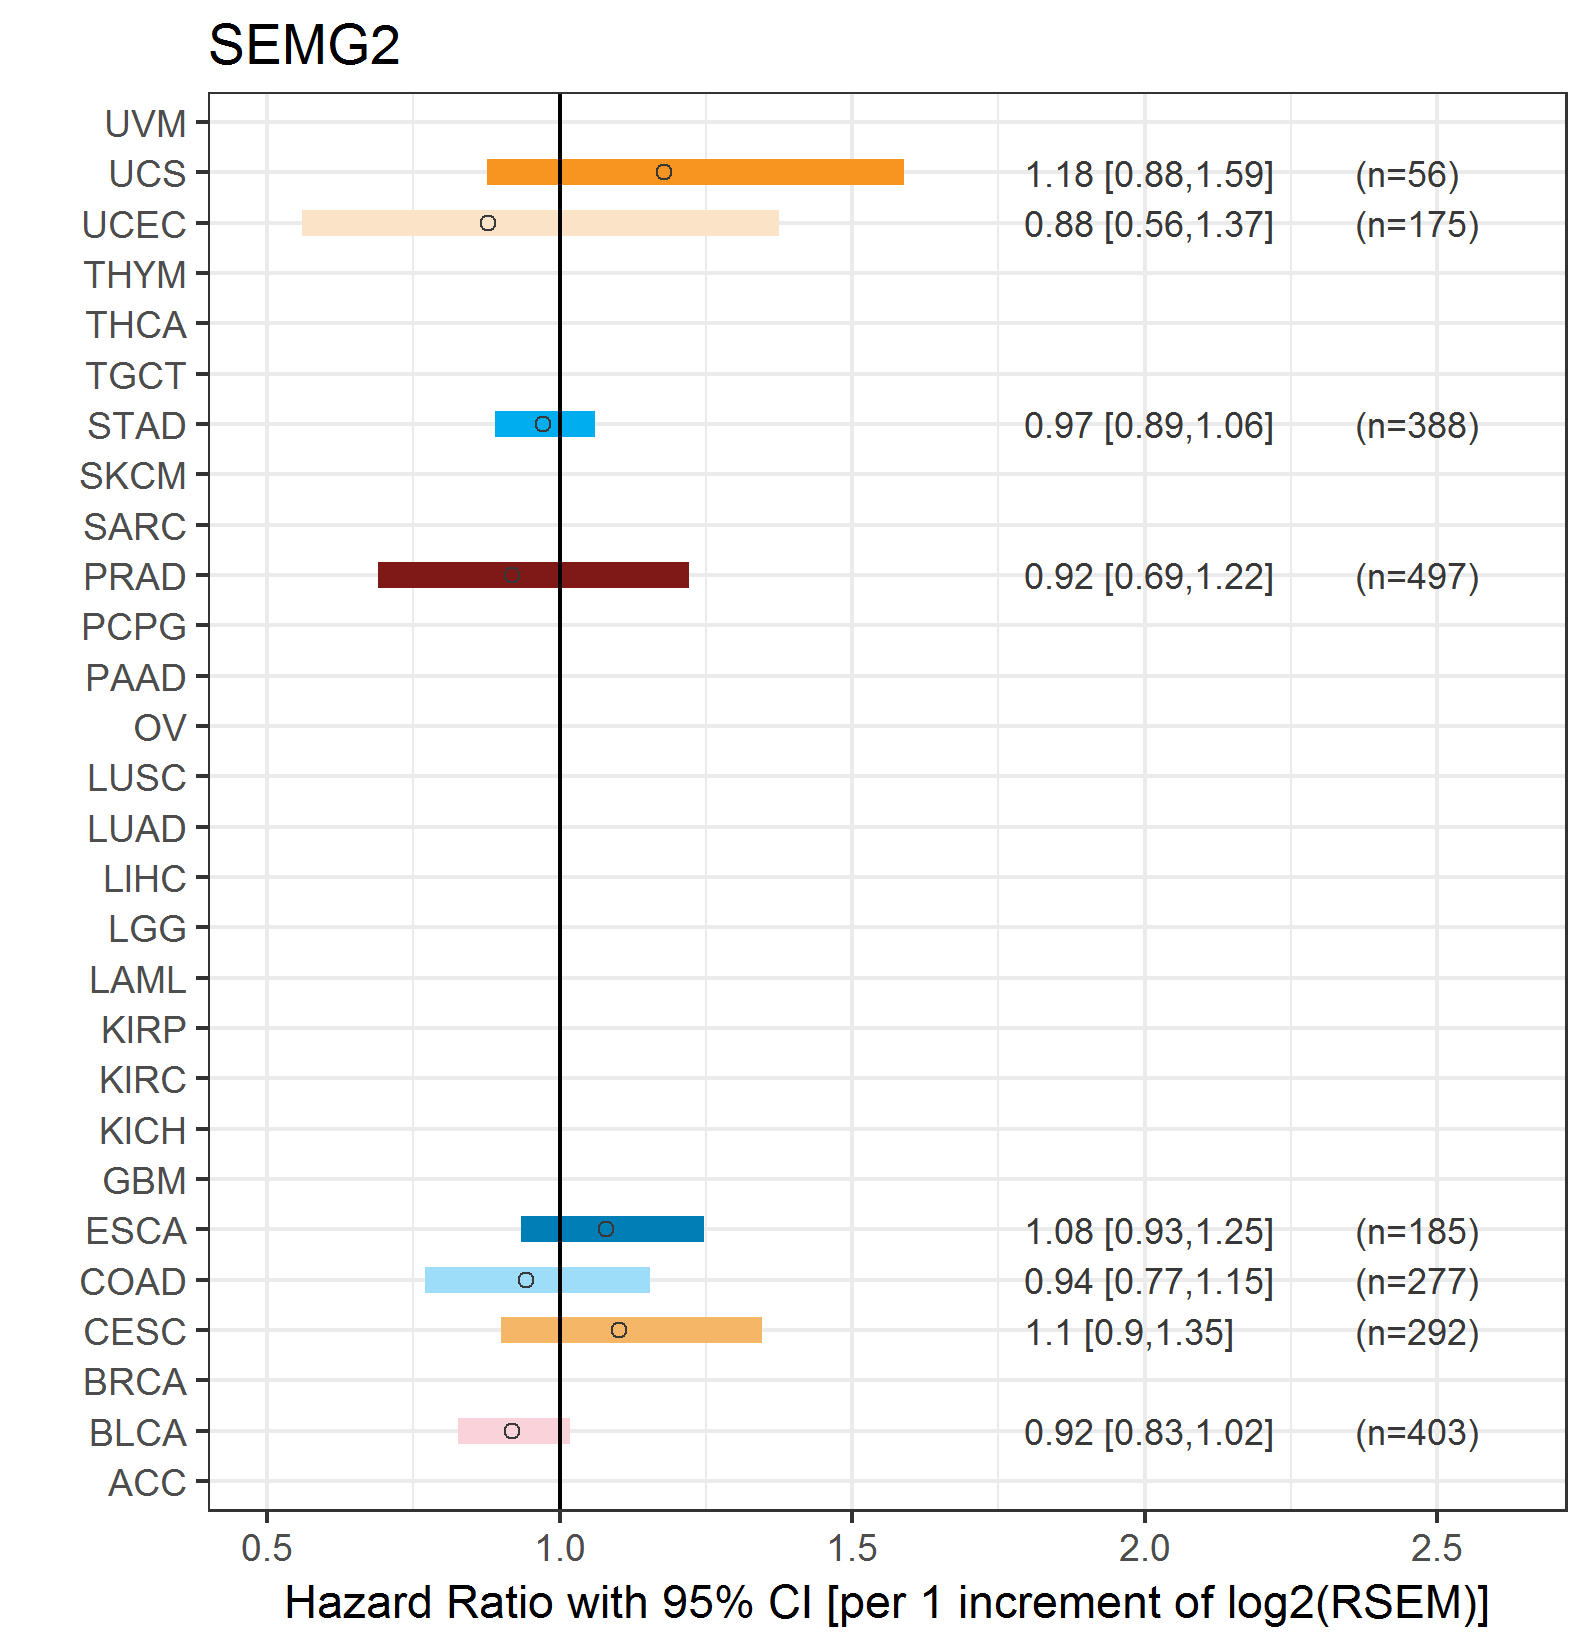
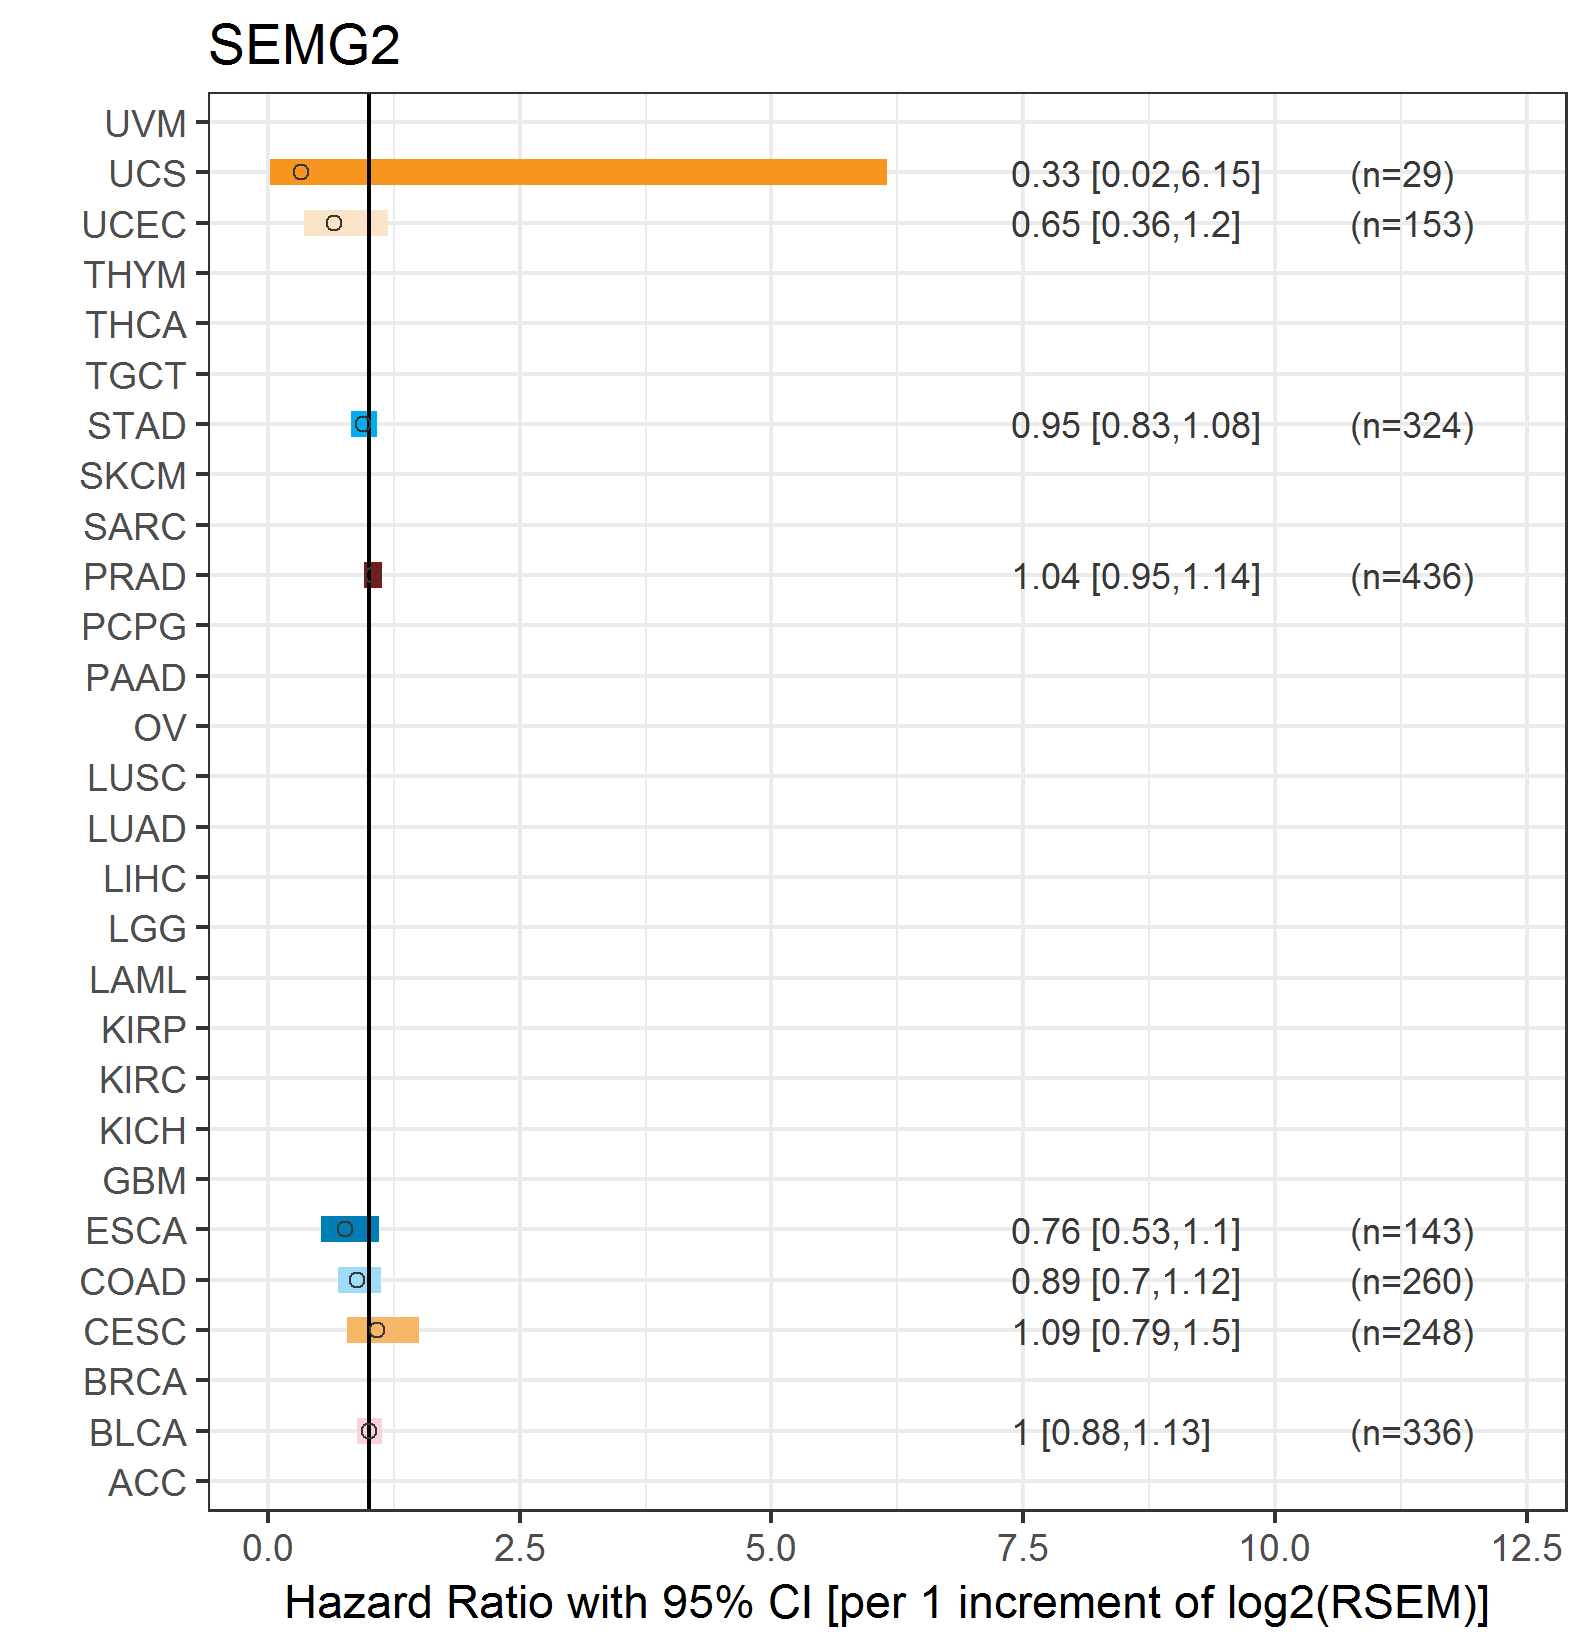
| Forest plot of Cox proportional hazard ratio (HR) and 95% CI of overall survival (OS) using 28 cancer types (TCGA IlluminaHiSeq_RNASeqV2, pan-cancer normalized log2(norm_counts+1) data, version 2016-08-16) (TCGA clinicalMatrix, phenotype data, version 2016-04-27) * Click on the image enlarge it in a new window. |
 |
| Forest plot of Cox proportional hazard ratio (HR) and 95% CI of relapse free survival (RFS) using 28 cancer types (TCGA IlluminaHiSeq_RNASeqV2, pan-cancer normalized log2(norm_counts+1) data, version 2016-08-16) (TCGA clinicalMatrix, phenotype data, version 2016-04-27) * Click on the image enlarge it in a new window. |
 |
| Top |
| TissGeneClin for SEMG2 |
| TissGeneDrug for SEMG2 |
| Drug information targeting TissGene (DrugBank Version 5.0.6, 2017-04-01) |
| DrugBank ID | Drug name | Drug activity | Drug type | Drug status |
| Top |
| TissGeneDisease for SEMG2 |
| Disease information associated with TissGene (DisGeNet, 2016-06-01) |
| Disease ID | Disease name | # pubmeds | Source |
| umls:C0086692 | Benign Neoplasm | 1 | BeFree |
|
Copyright 2016-Present - The University of Texas Health Science Center at Houston (UTHealth) Web File Viewing | How to Report, Fraud, Waste and Abuse | State of Texas | Statewide Search | Texas Homeland Security | Site Policies |