 |
| |
| |
| |
| |
| |
| |
|

| TissGeneSummary for PBLD |
 Gene summary Gene summary |
| Basic gene information | Gene symbol | PBLD |
| Gene name | phenazine biosynthesis-like protein domain containing | |
| Synonyms | MAWBP|MAWDBP | |
| Cytomap | UCSC genome browser: 10q21.3 | |
| Type of gene | protein-coding | |
| RefGenes | NM_001033083.1, NM_022129.3, | |
| Description | MAWD-binding proteinphenazine biosynthesis-like domain-containing protein | |
| Modification date | 20141207 | |
| dbXrefs | MIM : 612189 | |
| HGNC : HGNC | ||
| Ensembl : ENSG00000108187 | ||
| HPRD : 14366 | ||
| Vega : OTTHUMG00000073949 | ||
| Protein | UniProt: go to UniProt's Cross Reference DB Table | |
| Expression | CleanEX: HS_PBLD | |
| BioGPS: 64081 | ||
| Pathway | NCI Pathway Interaction Database: PBLD | |
| KEGG: PBLD | ||
| REACTOME: PBLD | ||
| Pathway Commons: PBLD | ||
| Context | iHOP: PBLD | |
| ligand binding site mutation search in PubMed: PBLD | ||
| UCL Cancer Institute: PBLD | ||
| Assigned class in TissGDB* | C | |
| Included tissue-specific gene expression resources | TiGER,GTEx | |
| Specific-tissues in normal samples (assigned by TissGDB using HPA, TiGER, and GTEx) | KidneyLiver | |
| Cancer types related to the specific-tissues in cancer samples (assigned by TissGDB using TCGA) | KIRC,KIRP,KICHLIHC | |
| Reference showing the relevant tissue of PBLD | ||
| Description by TissGene annotations | Protective TissGene in OS | |
| * Class A consists of genes with literature evidence and is part of the cTissGenes. Class B consists of only cTissGenes without additional evidence. The remaining genes belong to Class C. |
| Gene ontology having evidence of Inferred from Direct Assay (IDA) from Entrez |
| GO ID | GO term | PubMed ID |
| Top |
| TissGeneExp for PBLD |
| Gene expressions across 28 cancer types (X-axis: cancer type and Y-axis: log2(norm_counts+1)) (TCGA IlluminaHiSeq_RNASeqV2, pan-cancer normalized log2(norm_counts+1) data, version 2016-08-16) |
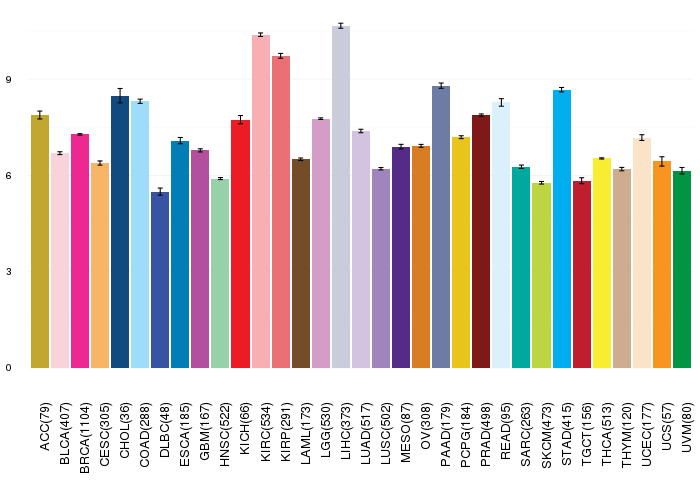 |
| Gene isoform expressions across 28 cancer types (X-axis: cancer type and Y-axis: log2(norm_counts+1)) (TCGA pan-cancer tcga_rsem_isoform_tpm, version 2016-09-01) |
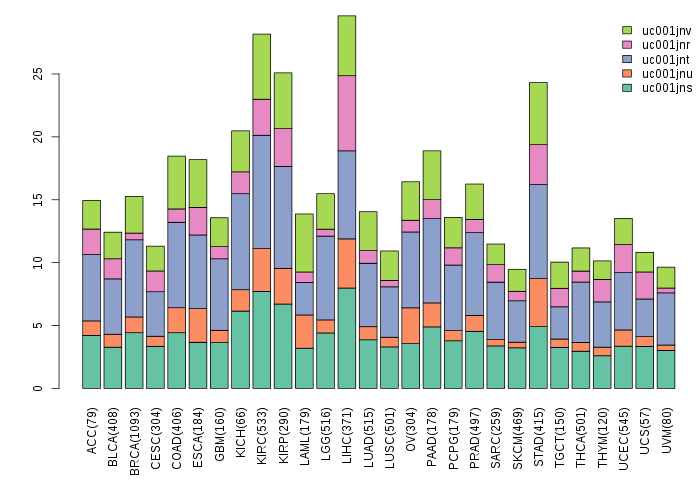 |
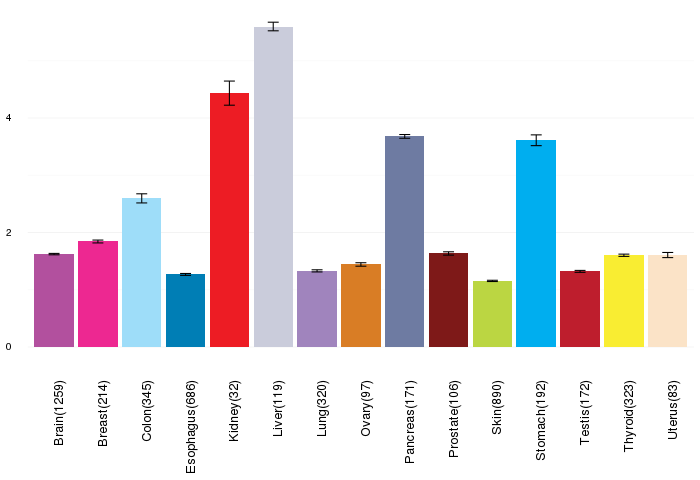
| Gene expressions across normal tissues of GTEx data (GTEx GTEx_Analysis_v6_RNA-seq_RNA-SeQCv1.1.8_gene_rpkm.gct) - Here, we shows the matched tissue types only among our 28 cancer types. |
 |
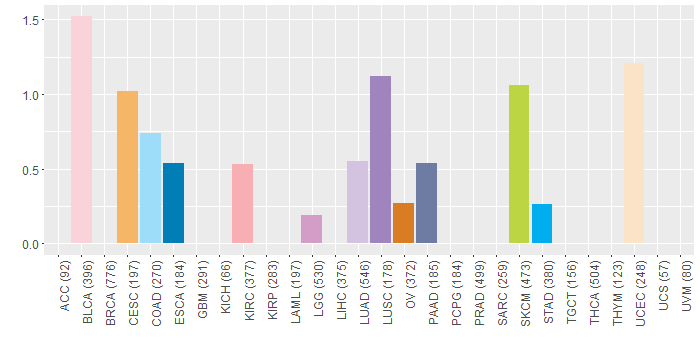
| Different expressions across 14 cancer types with more than 10 samples between matched tumors and normals (X-axis: cancer type and Y-axis: log2(norm_counts+1)) (TCGA IlluminaHiSeq_RNASeqV2, pan-cancer normalized log2(norm_counts+1) data, version 2016-08-16) |
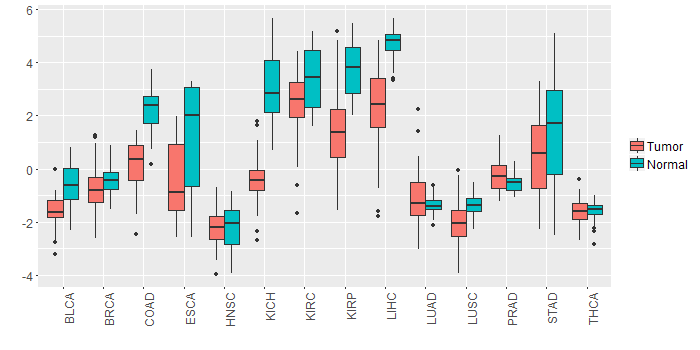 |
| - Significantly differentially expressed cancer types and information. (|Fold change|>1 and FDR<0.05) |
| Cancer type | Mean(exp) in tumor | Mean(exp) in matched normal | Log2FC | P-val. | FDR |
| KIRC | 2.448037525 | 3.486559747 | -1.038522222 | 2.65E-07 | 7.11E-07 |
| LIHC | 2.266966858 | 4.721494858 | -2.454528 | 1.38E-15 | 4.57E-14 |
| COAD | 0.120820858 | 2.330951628 | -2.210130769 | 2.62E-11 | 4.45E-10 |
| KICH | -0.418555142 | 3.122128858 | -3.540684 | 2.31E-14 | 3.80E-13 |
| KIRP | 1.483427108 | 3.758152108 | -2.274725 | 2.66E-09 | 2.27E-08 |
| BLCA | -1.603263352 | -0.560937036 | -1.042326316 | 0.000337 | 0.002974159 |
| Top |
| TissGene-miRNA for PBLD |
| Significantly anti-correlated miRNAs of TissGene across 28 cancer types (Gene-miRNA relations from TargetScanHuman Relsease 7.1, Conserved_Site_Context_Scores.txt.zip, 06.01.2016) (TCGA IlluminaHiSeq_miRNASeq, log2(RPM+1) data, version 2016-11-21) (TCGA IlluminaHiSeq_RNASeqV2, log2(normalized_count+1) data, version 2016-08-16) (Spearman’s Rank Correlation (p-value<0.05 and coefficient<-0.25)) |
| Cancer type | miRNA id | miRNA accession | P-val. | Coeff. | # samples |
| Top |
| TissGeneMut for PBLD |
| TissGeneSNV for PBLD |
| nsSNV counts per each loci. Different colors of circles represent different cancer types. Circle size denotes number of samples. (TCGA somatic mutation (SNPs and small INDELs) data, version 2016-04-25) * Click on the image to enlarge it in a new window. |
 |
 |
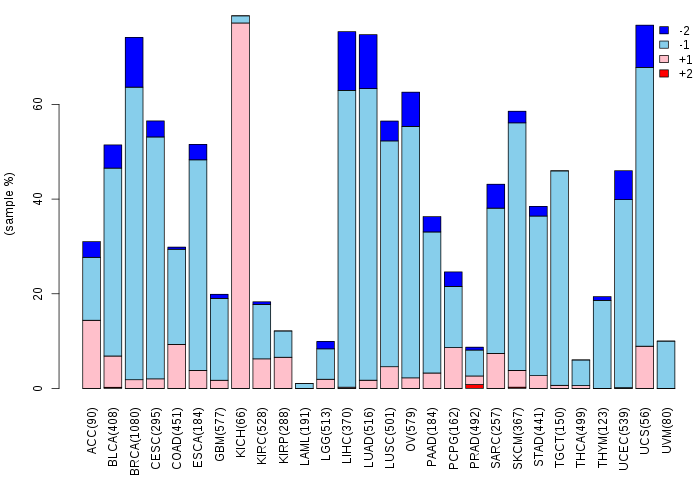
| Somatic nucleotide variants of TissGene across 28 cancer types (X-axis: cancer type and Y-axis: % of mutated samples) The numbers in parentheses are numbers of samples with mutation (nsSNVs). (TCGA somatic mutation (SNPs and small INDELs) data, version 2016-04-25) |
 |
| - nsSNVs sorted by frequency. |
| AAchange | Cancer type | # samples |
| p.L198V | BLCA | 1 |
| p.R216T | BLCA | 1 |
| p.E249D | KIRC | 1 |
| p.Q254* | BLCA | 1 |
| p.P72L | SKCM | 1 |
| p.A210E | COAD | 1 |
| p.P268T | LUSC | 1 |
| p.M42I | LUAD | 1 |
| p.Q159E | LUSC | 1 |
| p.S266L | HNSC | 1 |
| p.S215L | BLCA | 1 |
| p.R17C | DLBC | 1 |
| p.D57Y | LGG | 1 |
| p.S266L | UCEC | 1 |
| p.G263E | SKCM | 1 |
| p.V89G | KIRC | 1 |
| p.I5V | BLCA | 1 |
| p.G270R | ESCA | 1 |
| p.A82V | PAAD | 1 |
| p.E182D | BLCA | 1 |
| p.A112D | OV | 1 |
| p.R258G | HNSC | 1 |
| p.P20L | CESC | 1 |
| p.G270R | COAD | 1 |
| p.H244L | HNSC | 1 |
| p.G202R | SKCM | 1 |
| p.R171_splice | UCEC | 1 |
| p.P268S | SKCM | 1 |
| p.F65I | SKCM | 1 |
| p.T100M | STAD | 1 |
| p.V272I | UCEC | 1 |
| p.E203K | CESC | 1 |
| p.W221L | LUAD | 1 |
| p.R275K | LUAD | 1 |
| Top |
| TissGeneCNV for PBLD |
| Copy number variations of TissGene across 28 cancer types (X-axis: cancer type and Y-axis: % of CNV samples) (TCGA Gistic2_CopyNumber_Gistic2_all_data_by_genes, Gistic2 copy number data, version 2016-08-16) |
 |
| Top |
| TissGeneFusions for PBLD |
| Fusion genes including TissGene (ChimerDB 3.0, 2016-12-01 and TCGA fusion Portal 2015-12-01) |
| Database | Src | Cancer type | Sample | Fusion gene | ORF | 5'-gene BP | 3'-gene BP |
| Chimerdb3.0 | ChiTaRs | NA | L32610 | PBLD-PBLD | chr10:70091927 | chr10:70091940 | |
| Chimerdb3.0 | FusionScan | BRCA | TCGA-AO-A03P-01A | PBLD-LRRC28 | CDS-5'UTR | chr10:70048239 | chr15:99796102 |
| Top |
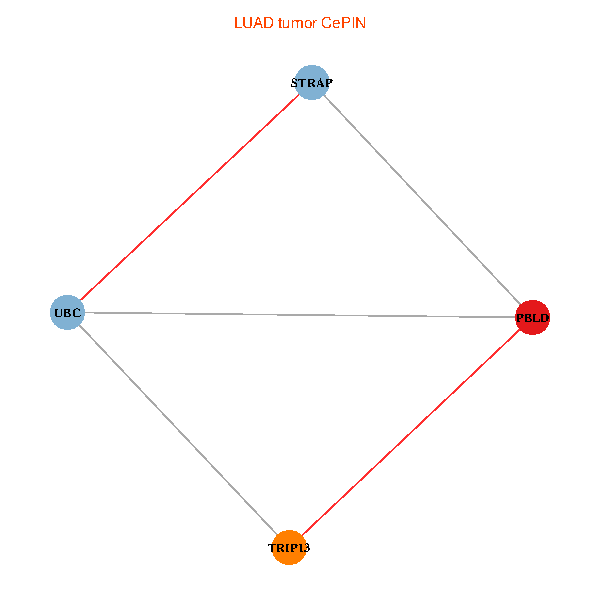
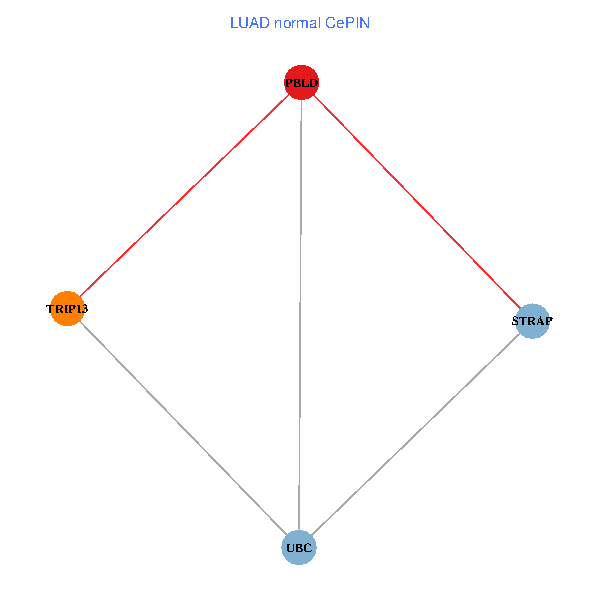
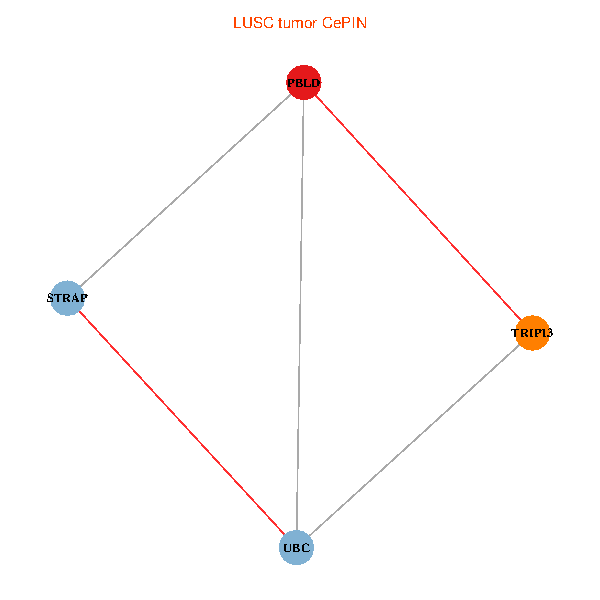
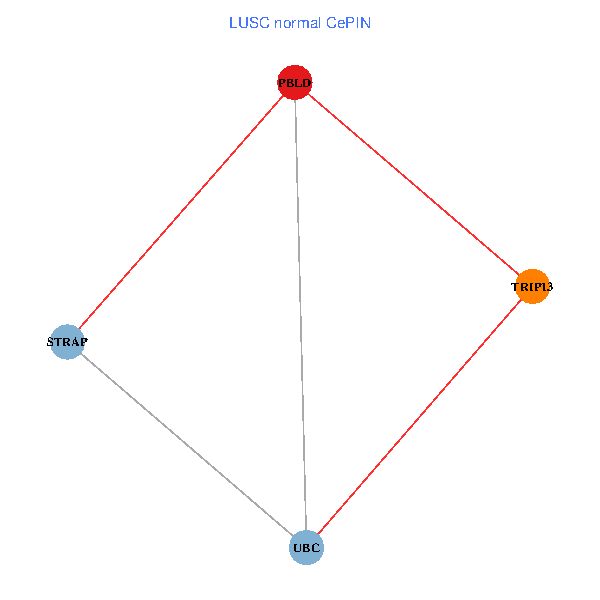
| TissGeneNet for PBLD |
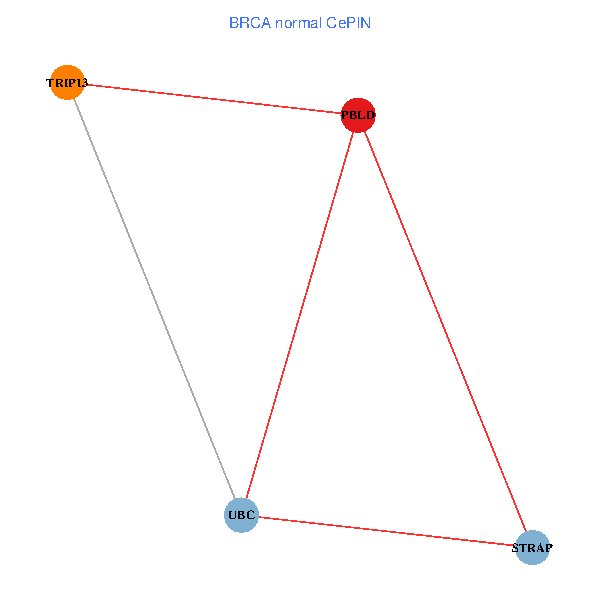
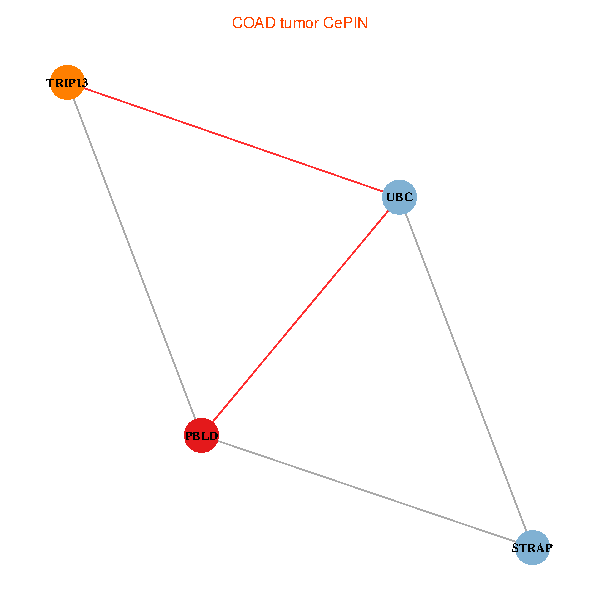
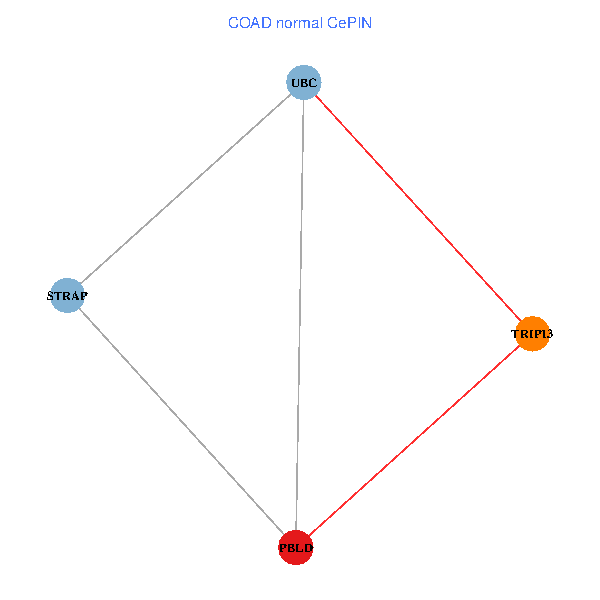
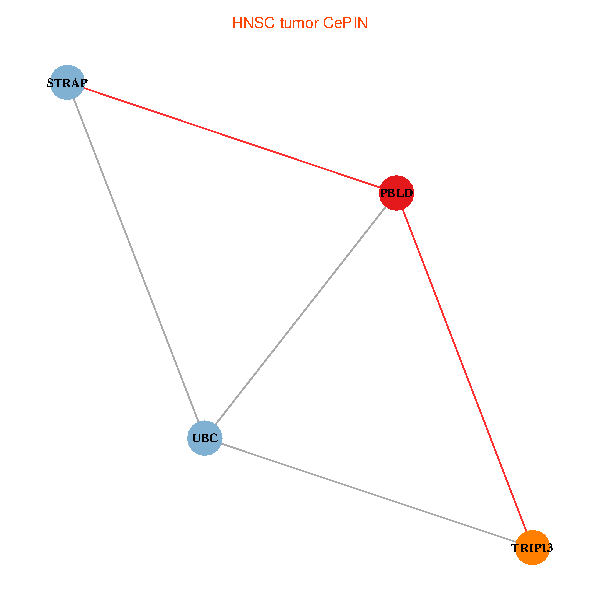
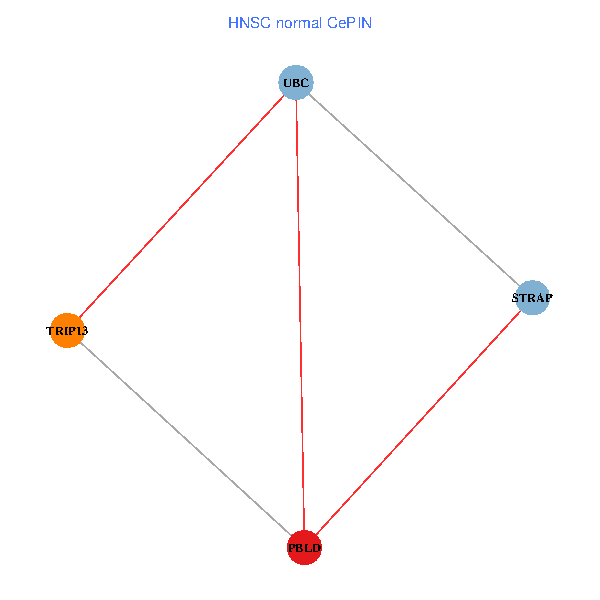
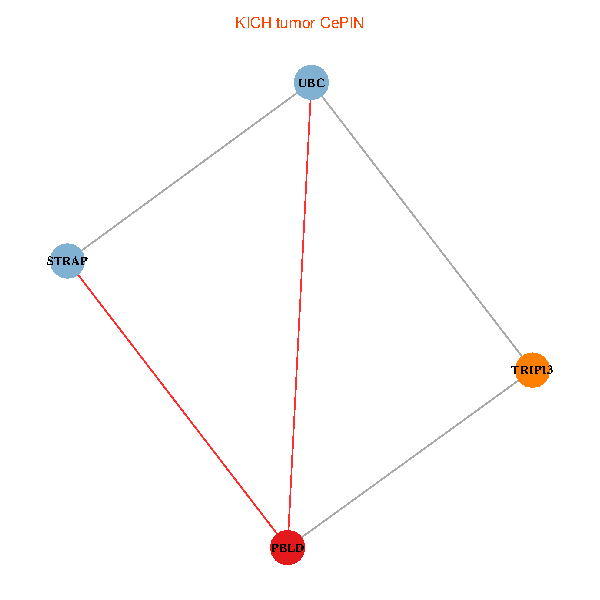
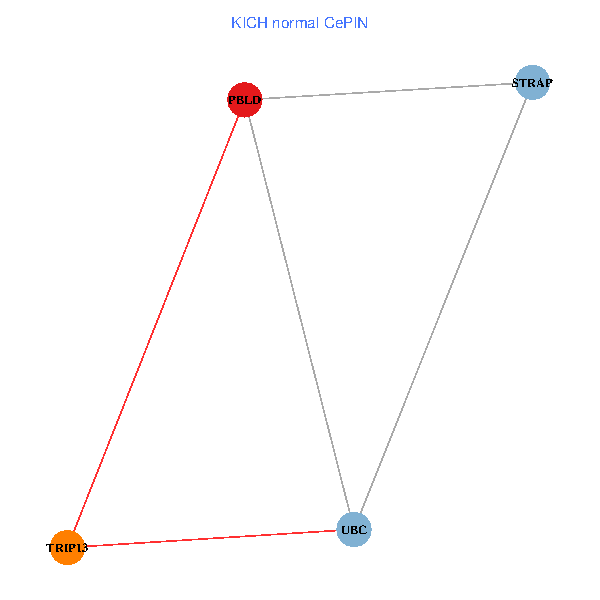
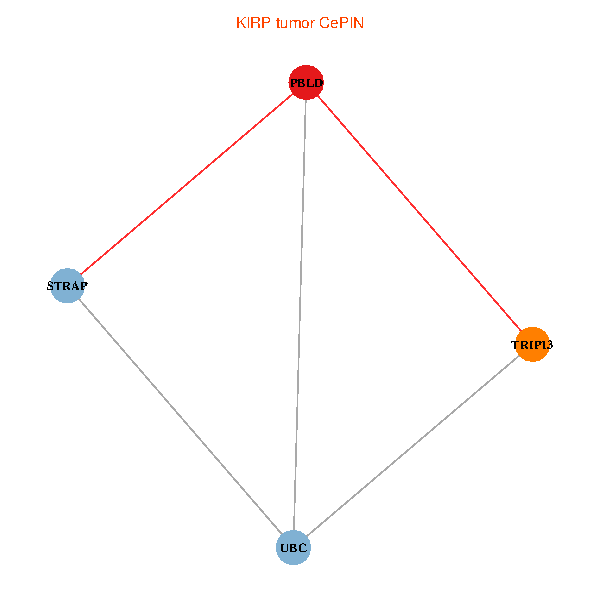
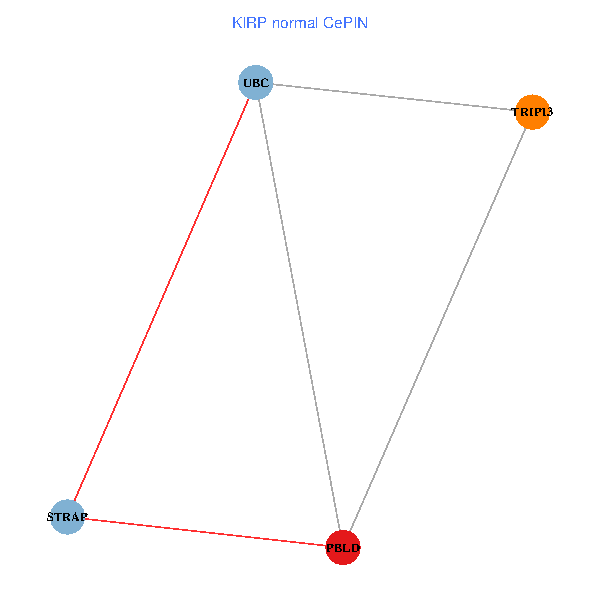
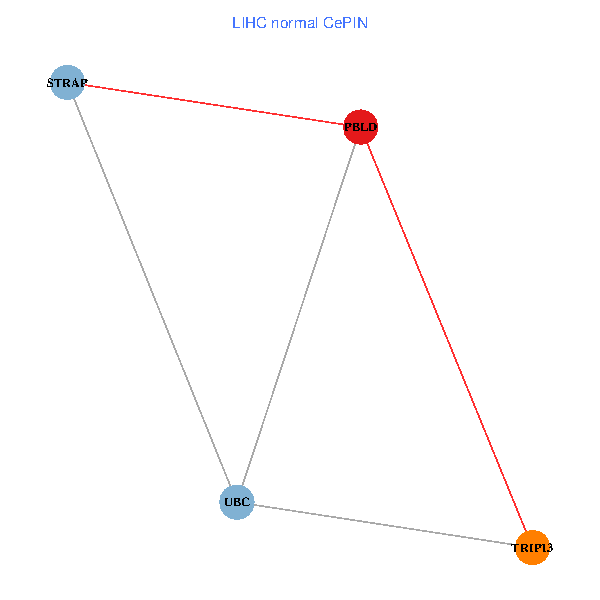
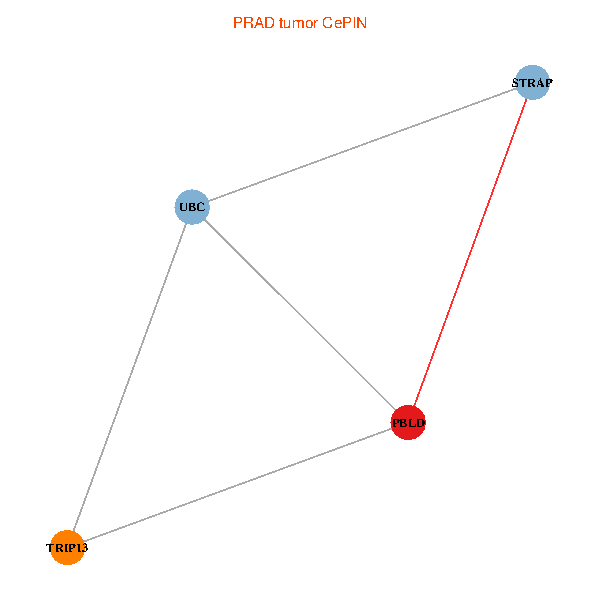
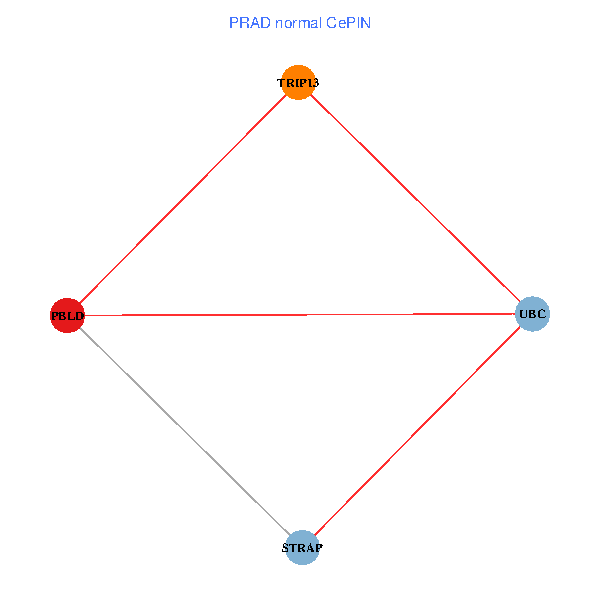
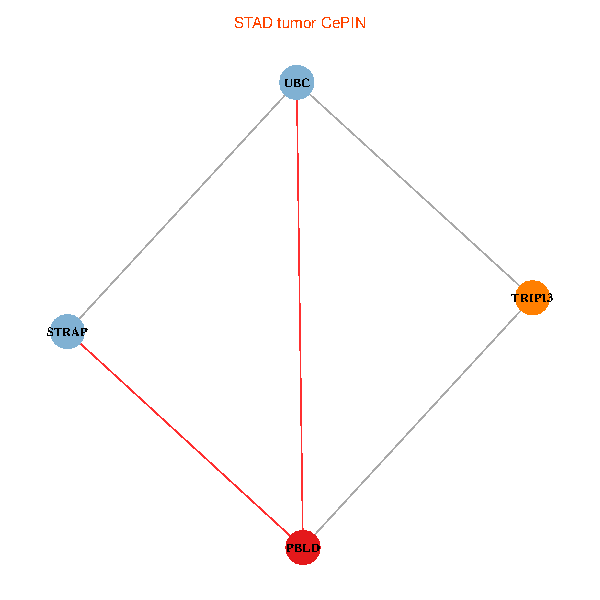
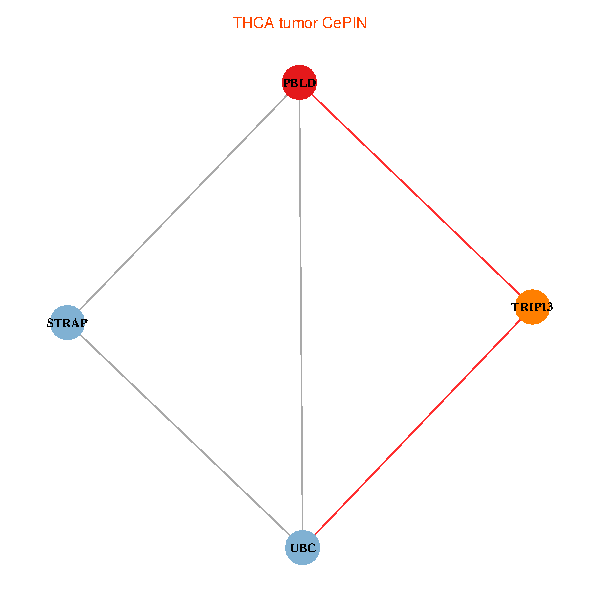
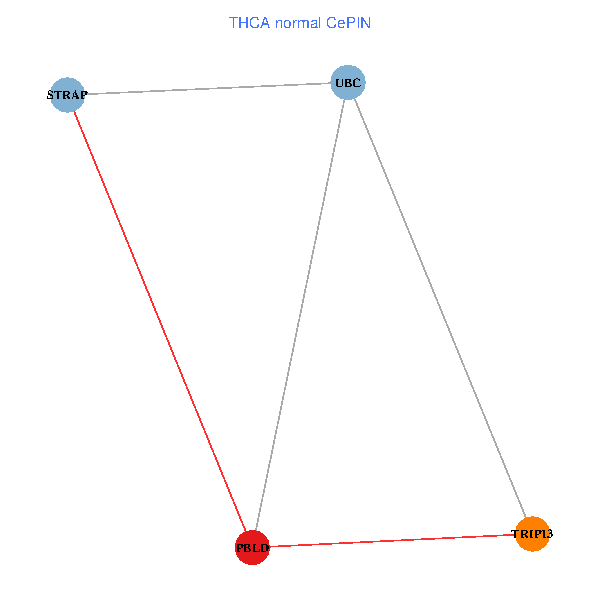
| Co-expressed gene networks based on protein-protein interaction data (CePIN) (TCGA IlluminaHiSeq_RNASeqV2, pan-cancer normalized log2(norm_counts+1) data, version 2016-08-16) (PINA2 ppi data) |
| BRCA (tumor) | BRCA (normal) |
| PBLD, UBC, TRIP13, STRAP (tumor) | PBLD, UBC, TRIP13, STRAP (normal) |
 |  |
| COAD (tumor) | COAD (normal) |
| PBLD, UBC, TRIP13, STRAP (tumor) | PBLD, UBC, TRIP13, STRAP (normal) |
 |  |
| HNSC (tumor) | HNSC (normal) |
| PBLD, UBC, TRIP13, STRAP (tumor) | PBLD, UBC, TRIP13, STRAP (normal) |
 |  |
| KICH (tumor) | KICH (normal) |
| PBLD, UBC, TRIP13, STRAP (tumor) | PBLD, UBC, TRIP13, STRAP (normal) |
 |  |
| KIRC (tumor) | KIRC (normal) |
| PBLD, UBC, TRIP13, STRAP (tumor) | PBLD, UBC, TRIP13, STRAP (normal) |
 |  |
| KIRP (tumor) | KIRP (normal) |
| PBLD, UBC, TRIP13, STRAP (tumor) | PBLD, UBC, TRIP13, STRAP (normal) |
 |  |
| LIHC (tumor) | LIHC (normal) |
| PBLD, UBC, TRIP13, STRAP (tumor) | PBLD, UBC, TRIP13, STRAP (normal) |
 |  |
| LUAD (tumor) | LUAD (normal) |
| PBLD, UBC, TRIP13, STRAP (tumor) | PBLD, UBC, TRIP13, STRAP (normal) |
 |  |
| LUSC (tumor) | LUSC (normal) |
| PBLD, UBC, TRIP13, STRAP (tumor) | PBLD, UBC, TRIP13, STRAP (normal) |
 |  |
| PRAD (tumor) | PRAD (normal) |
| PBLD, UBC, TRIP13, STRAP (tumor) | PBLD, UBC, TRIP13, STRAP (normal) |
 |  |
| STAD (tumor) | STAD (normal) |
| PBLD, UBC, TRIP13, STRAP (tumor) | PBLD, UBC, TRIP13, STRAP (normal) |
 |  |
| THCA (tumor) | THCA (normal) |
| PBLD, UBC, TRIP13, STRAP (tumor) | PBLD, UBC, TRIP13, STRAP (normal) |
 |  |
| Top |
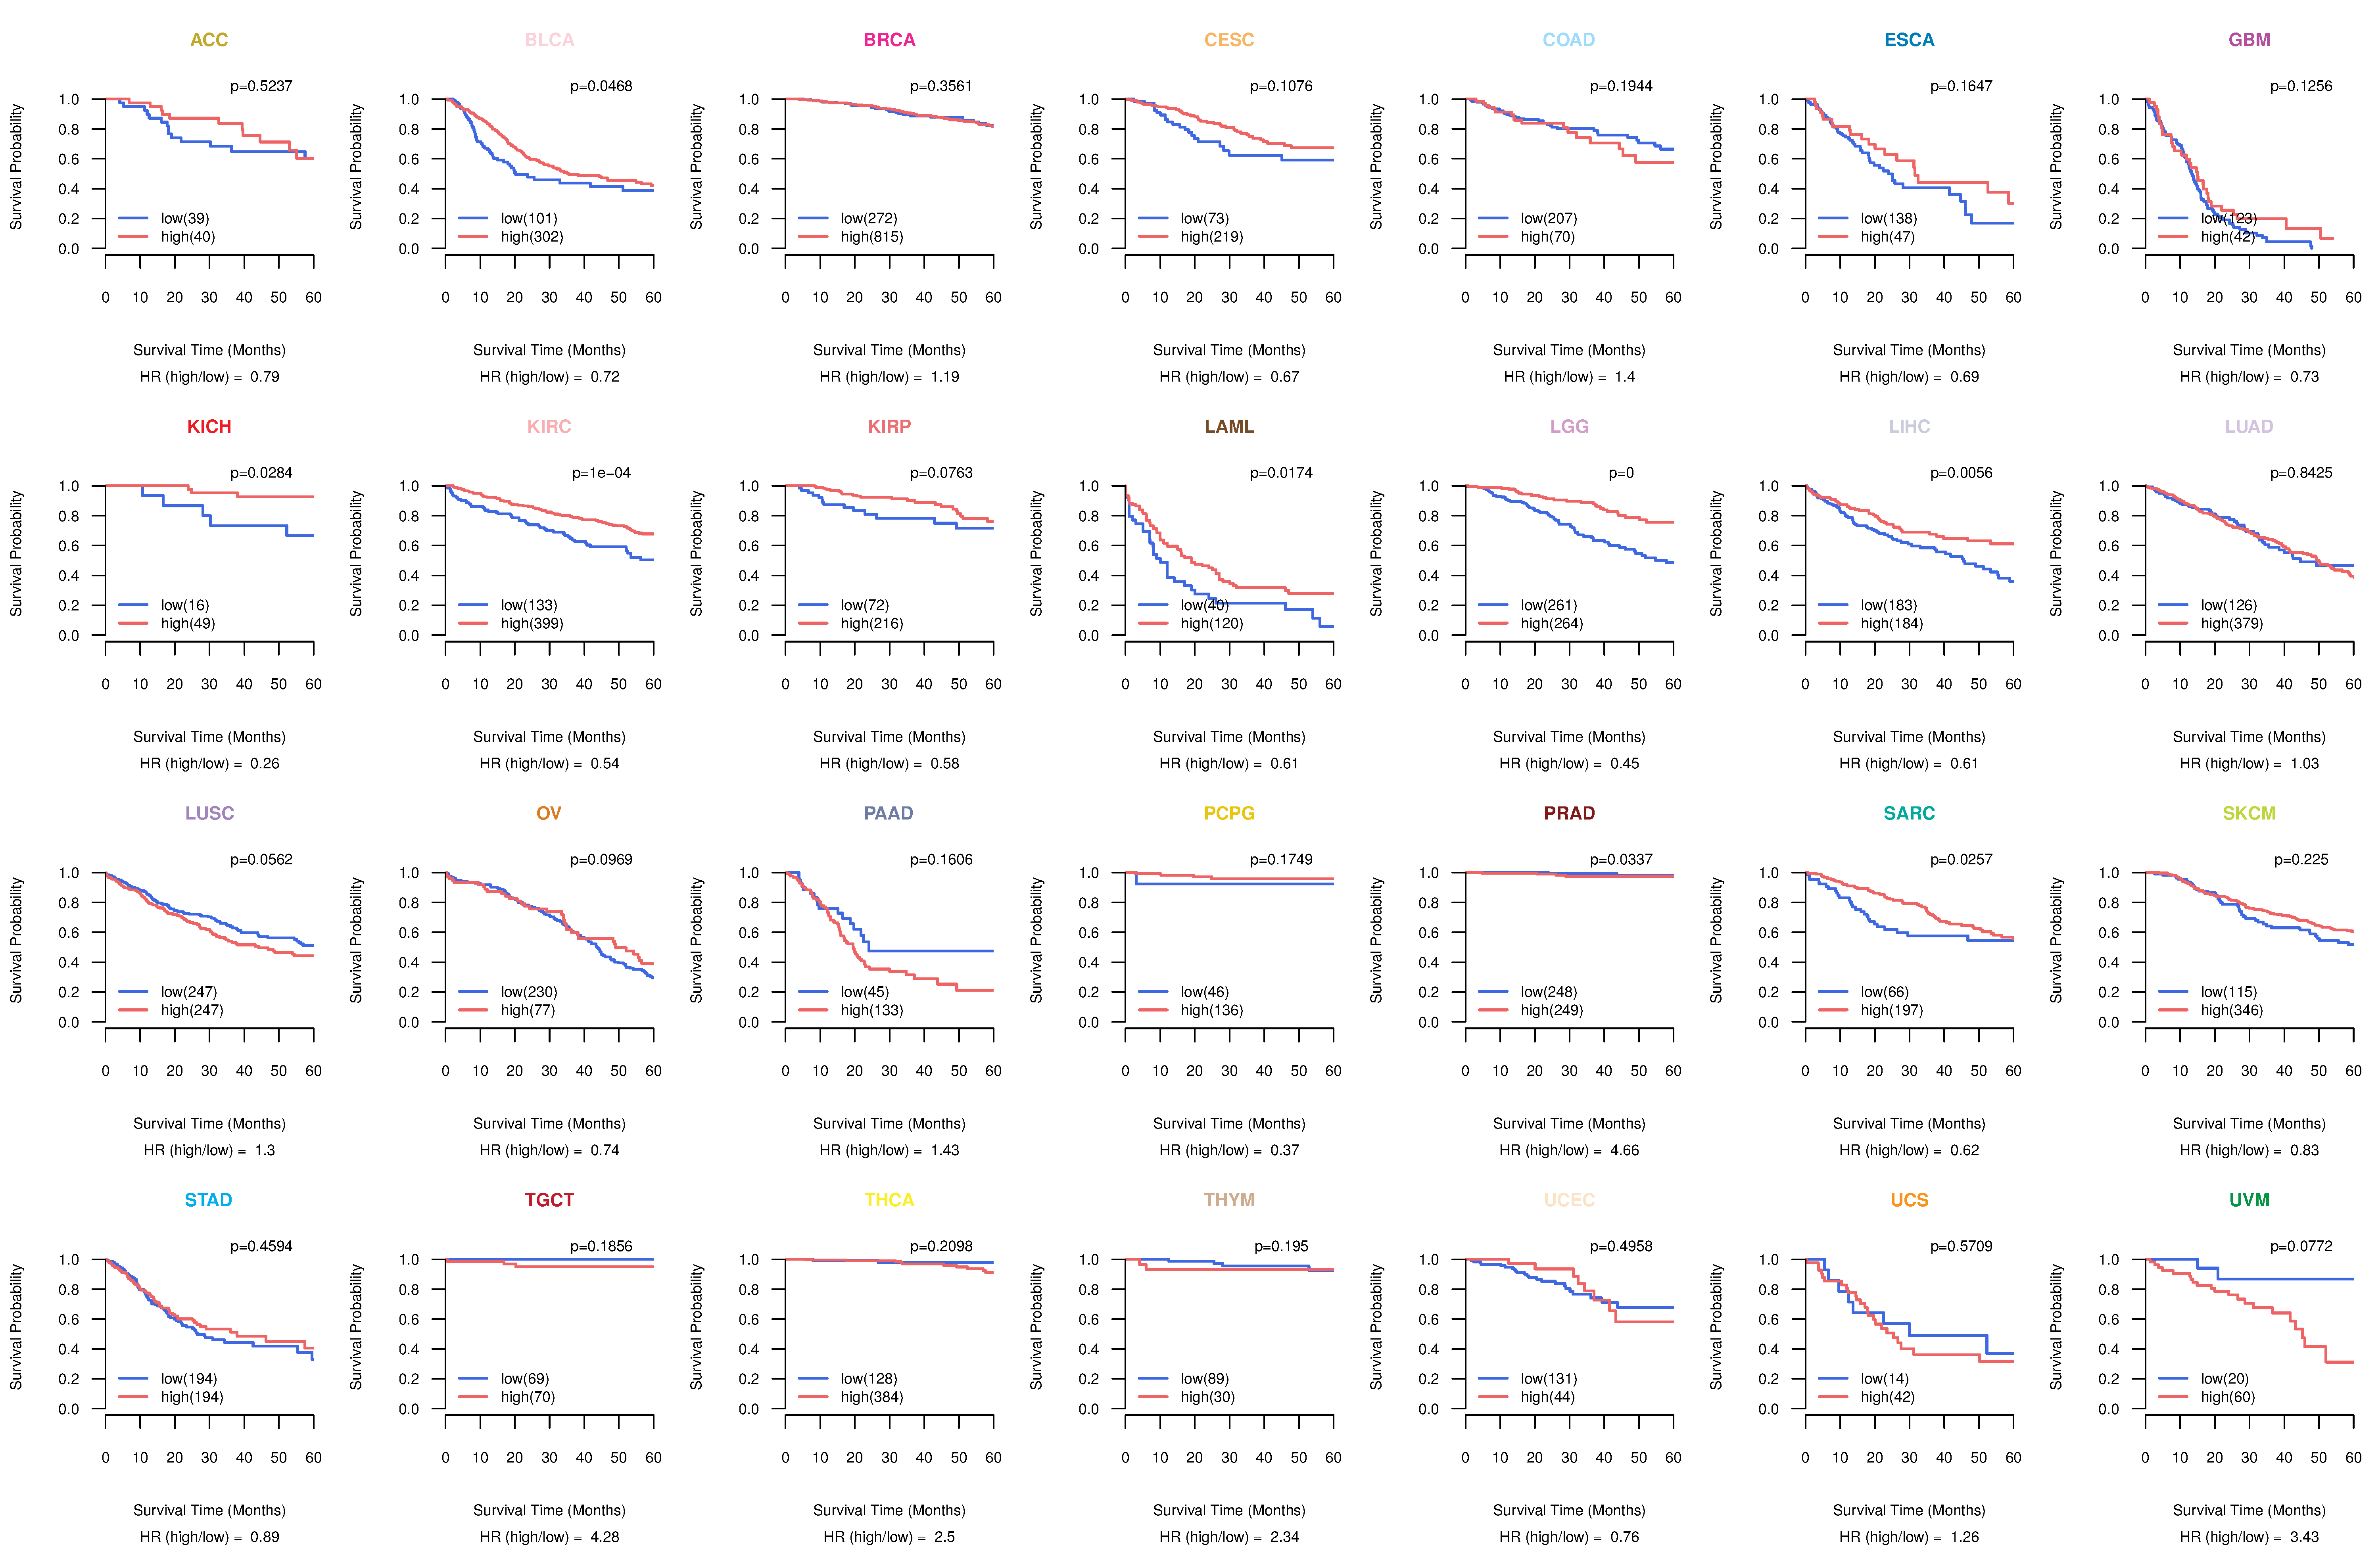
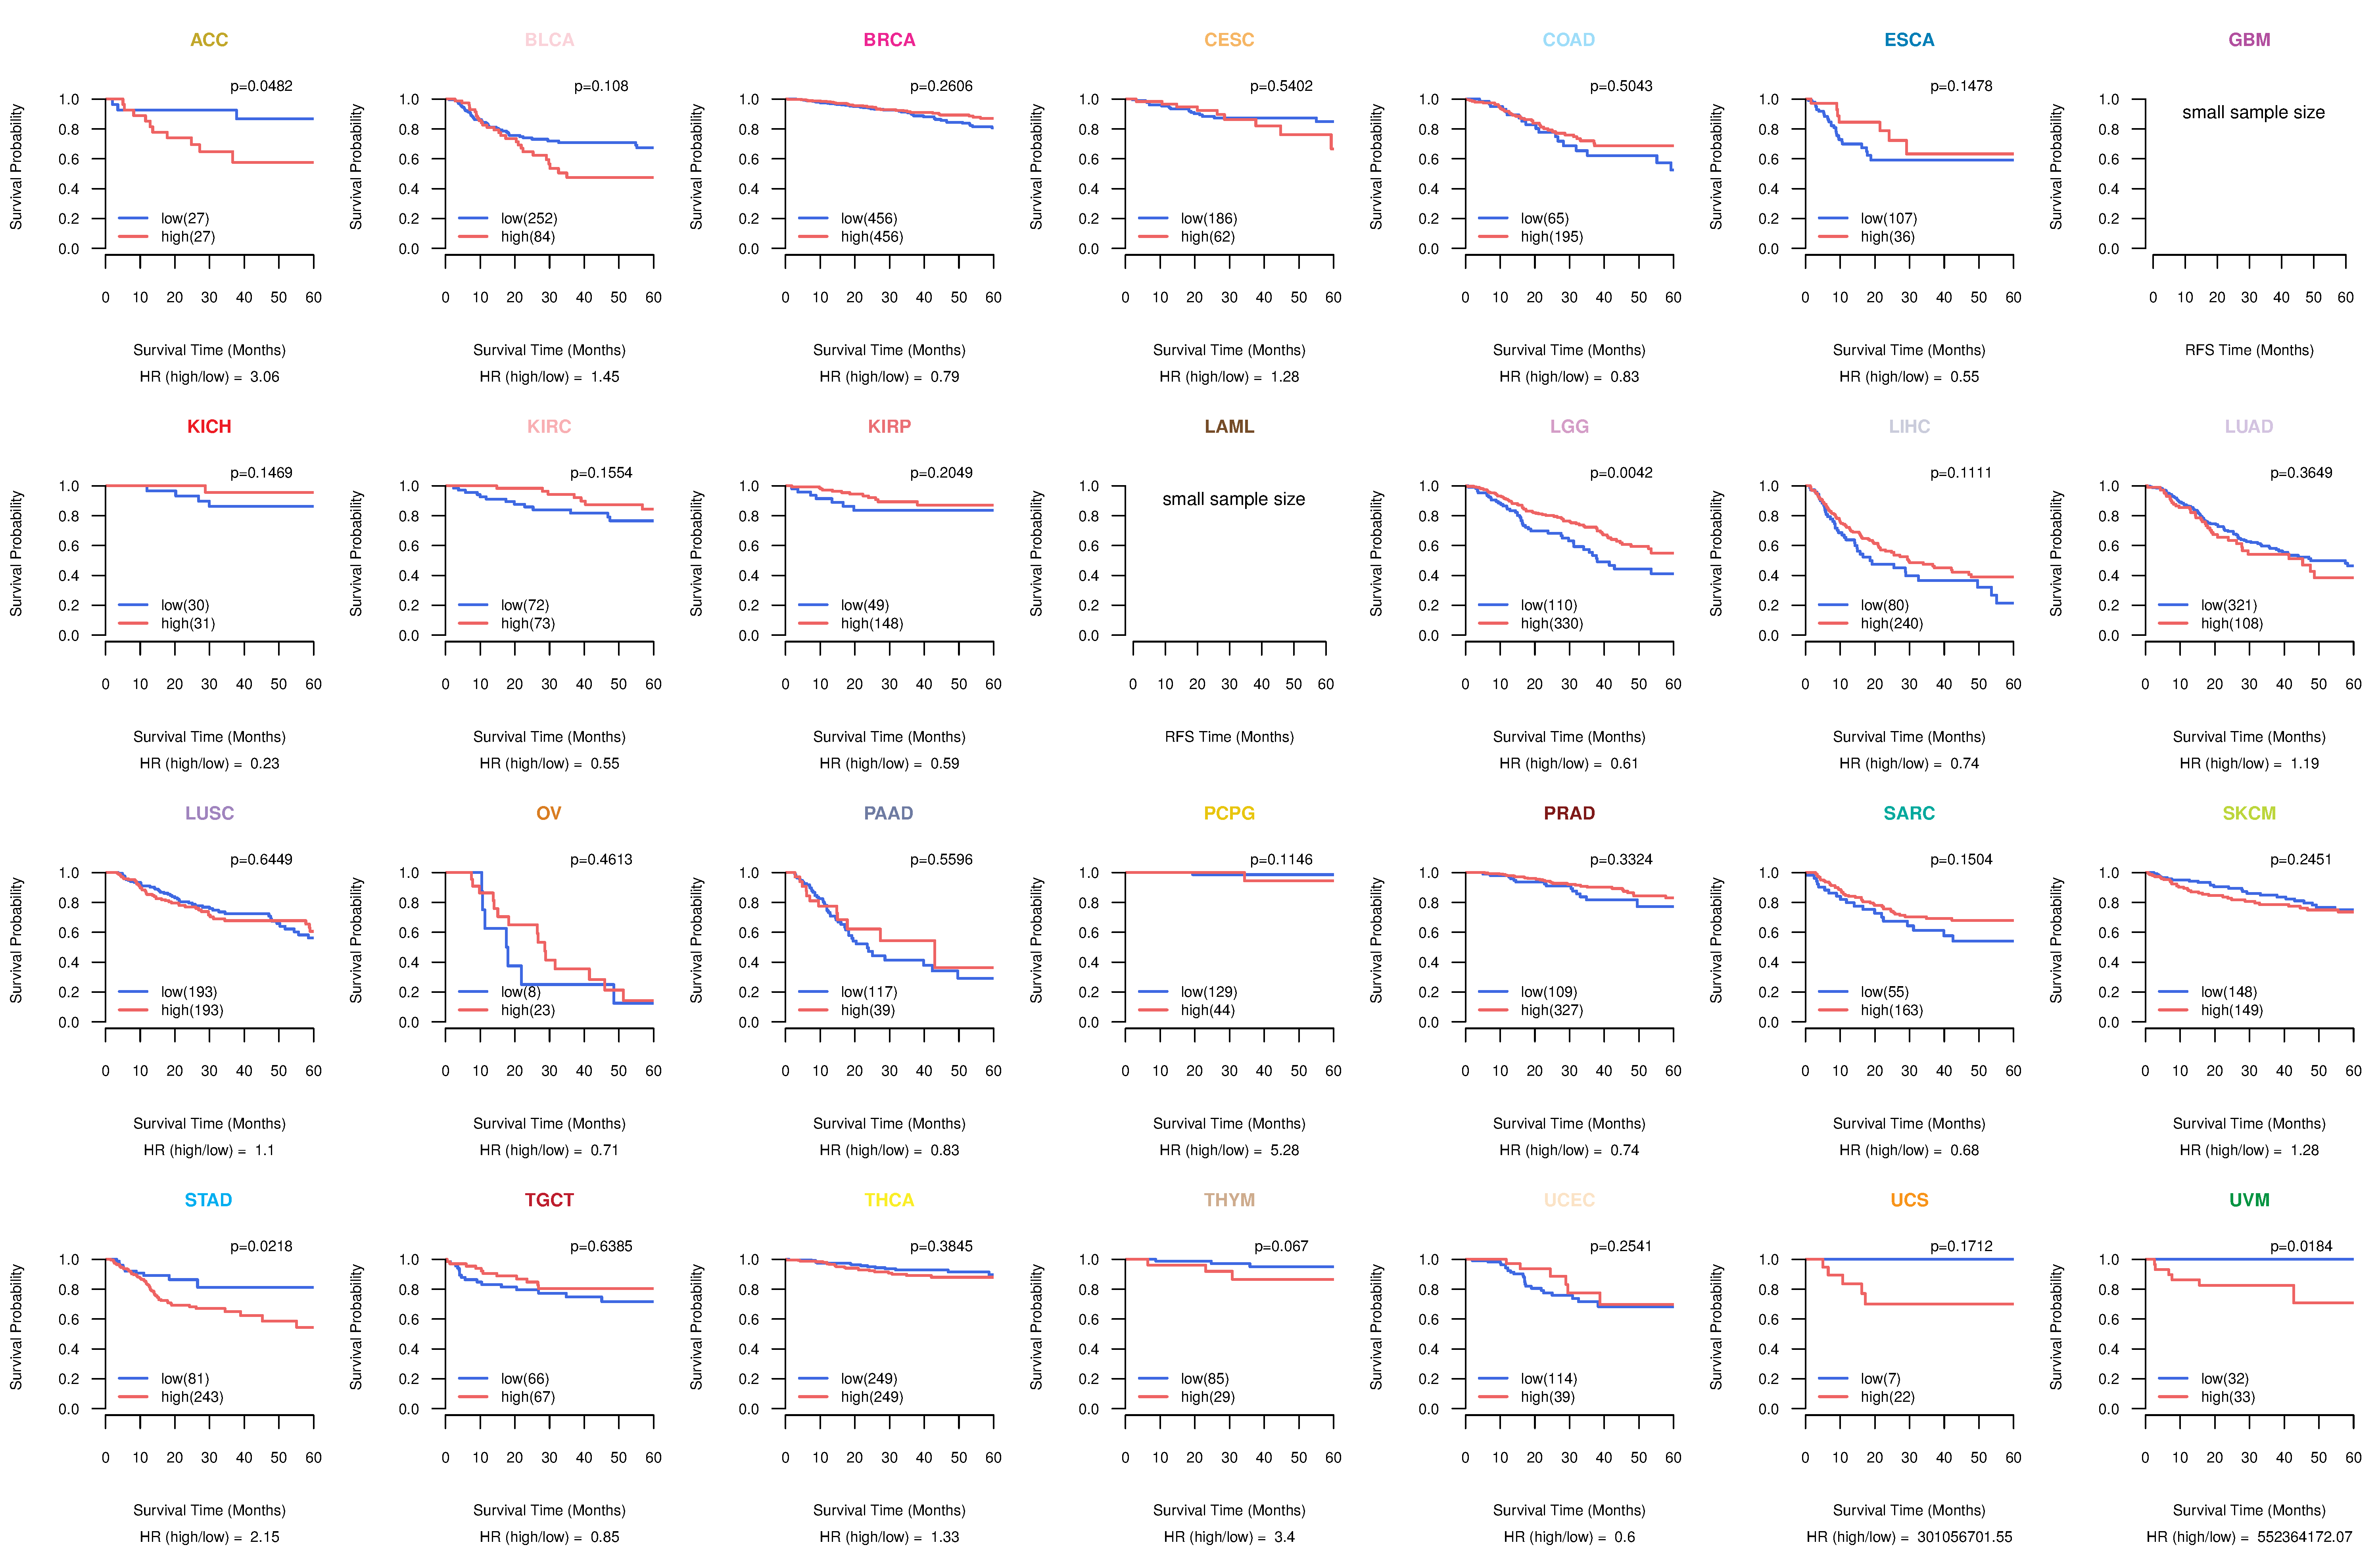
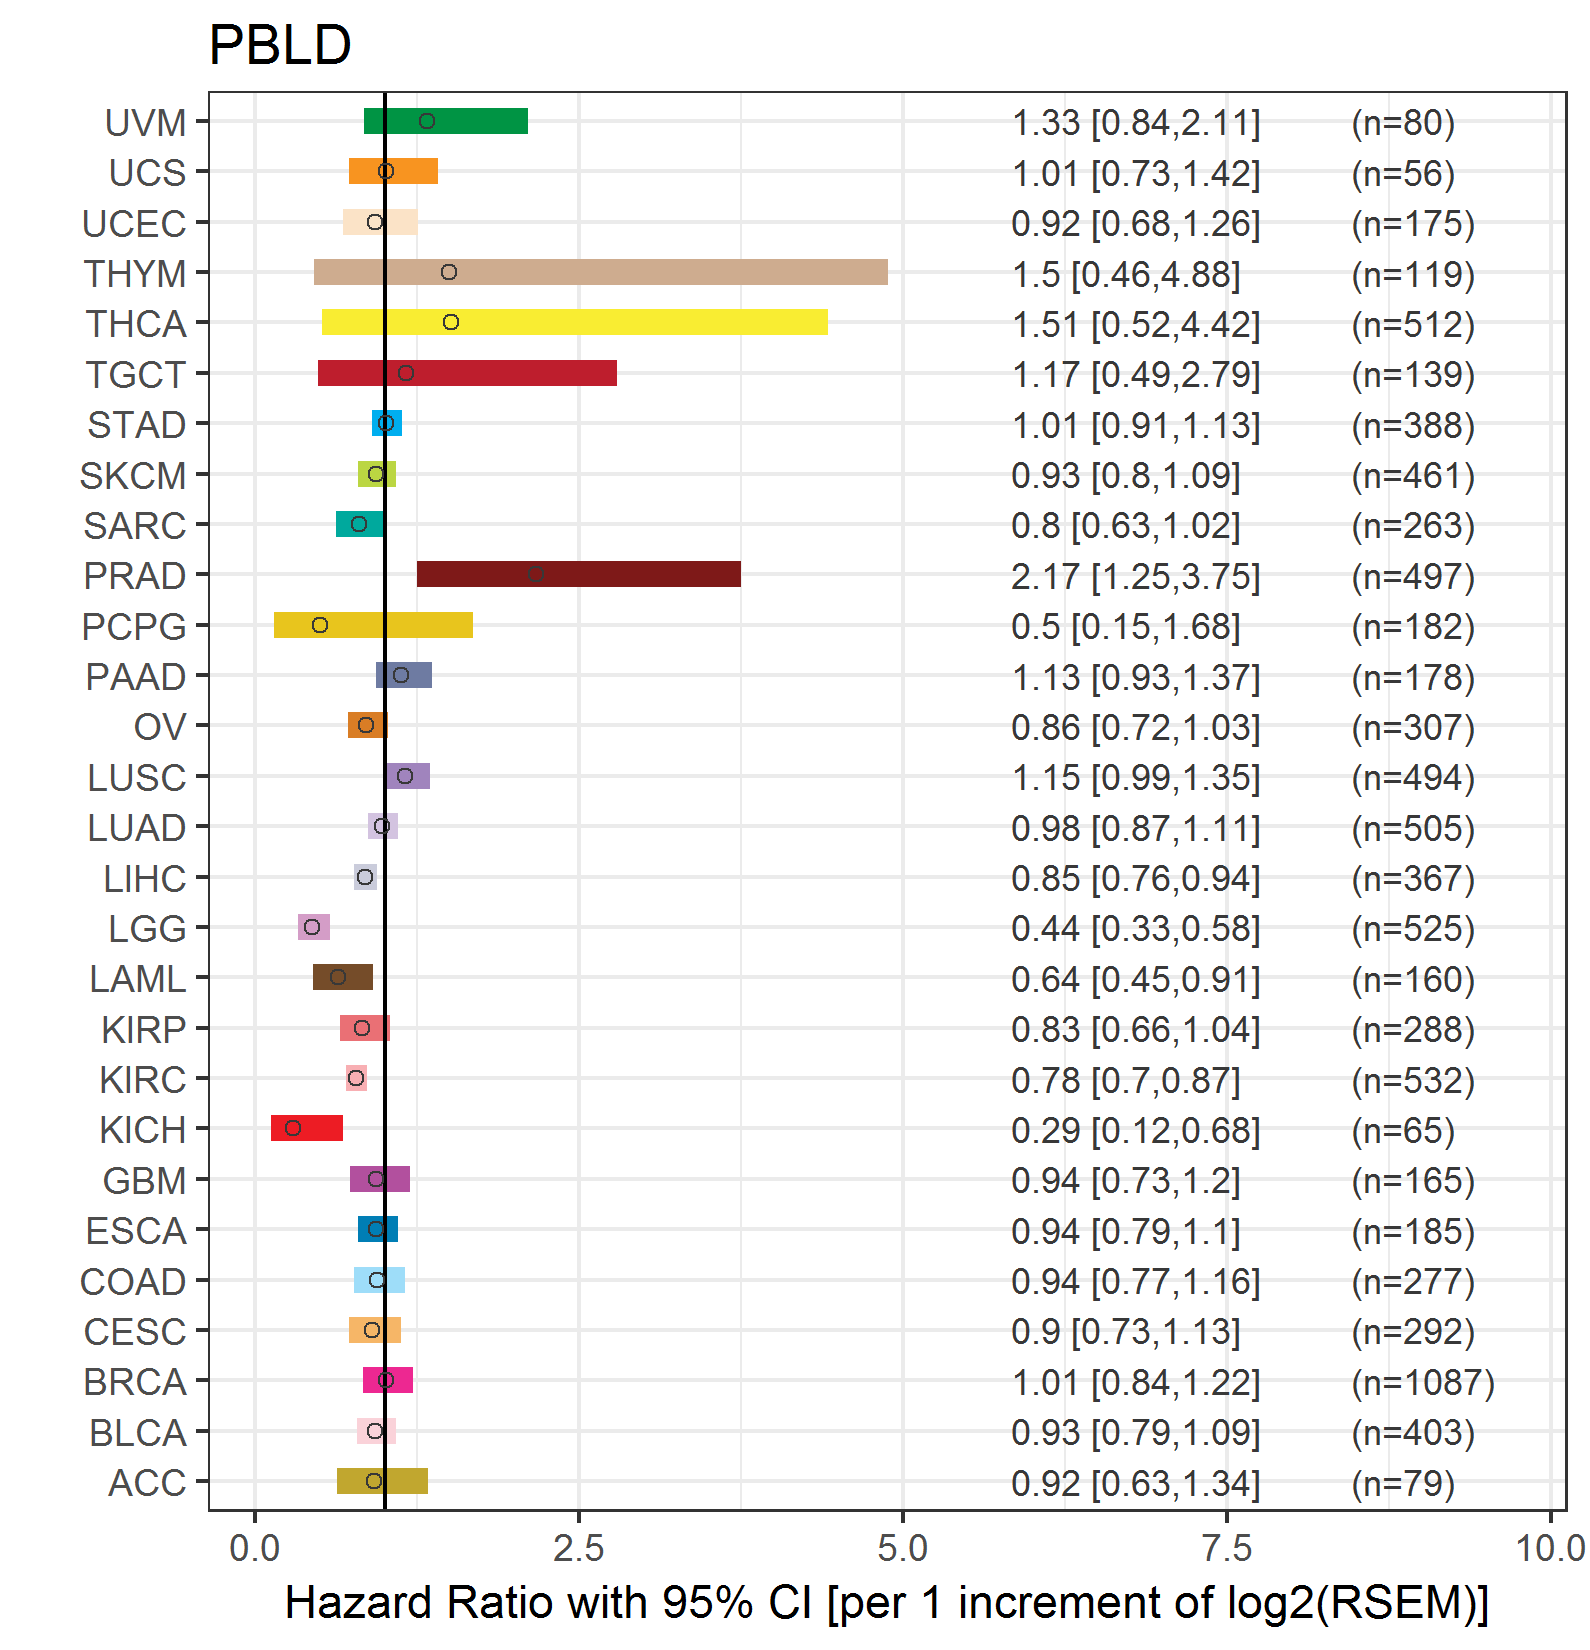
| TissGeneProg for PBLD |
| Kaplan-Meier plots with logrank tests of overall survival (OS) using 28 cancer types (TCGA IlluminaHiSeq_RNASeqV2, pan-cancer normalized log2(norm_counts+1) data, version 2016-08-16) (TCGA clinicalMatrix, phenotype data, version 2016-04-27) * Click on the image to enlarge it in a new window. |
 |
| Kaplan-Meier plots with logrank test of relapse free survival (RFS) using 28 cancer types (TCGA IlluminaHiSeq_RNASeqV2, pan-cancer normalized log2(norm_counts+1) data, version 2016-08-16) (TCGA clinicalMatrix, phenotype data, version 2016-04-27) * Click on the image enlarge it in a new window. |
 |
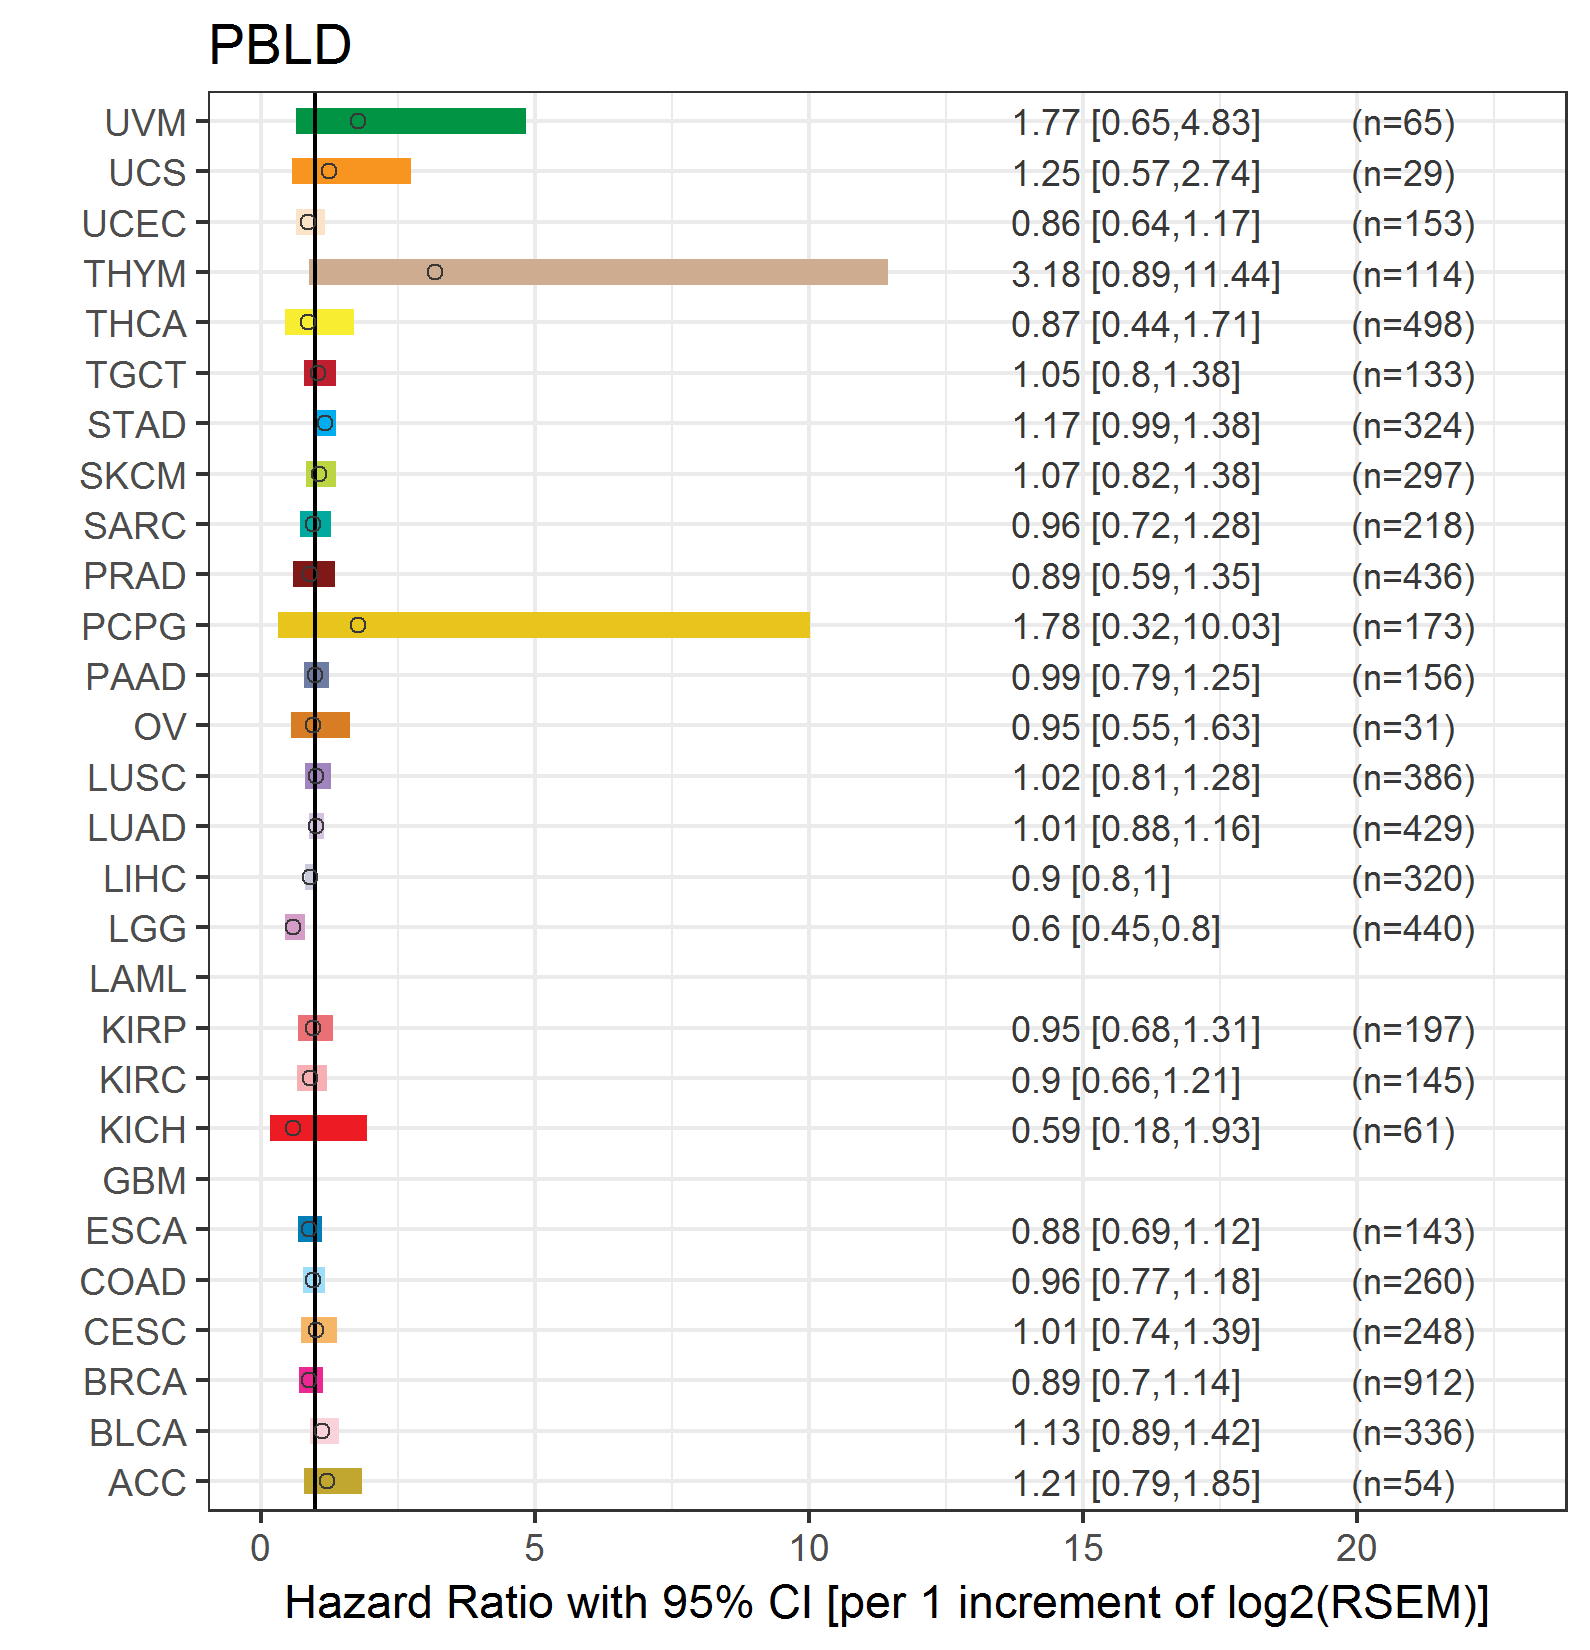
| Forest plot of Cox proportional hazard ratio (HR) and 95% CI of overall survival (OS) using 28 cancer types (TCGA IlluminaHiSeq_RNASeqV2, pan-cancer normalized log2(norm_counts+1) data, version 2016-08-16) (TCGA clinicalMatrix, phenotype data, version 2016-04-27) * Click on the image enlarge it in a new window. |
 |
| Forest plot of Cox proportional hazard ratio (HR) and 95% CI of relapse free survival (RFS) using 28 cancer types (TCGA IlluminaHiSeq_RNASeqV2, pan-cancer normalized log2(norm_counts+1) data, version 2016-08-16) (TCGA clinicalMatrix, phenotype data, version 2016-04-27) * Click on the image enlarge it in a new window. |
 |
| Top |
| TissGeneClin for PBLD |
| TissGeneDrug for PBLD |
| Drug information targeting TissGene (DrugBank Version 5.0.6, 2017-04-01) |
| DrugBank ID | Drug name | Drug activity | Drug type | Drug status |
| Top |
| TissGeneDisease for PBLD |
| Disease information associated with TissGene (DisGeNet, 2016-06-01) |
| Disease ID | Disease name | # pubmeds | Source |
| umls:C0014518 | Toxic Epidermal Necrolysis | 1 | BeFree |
| umls:C0032927 | Precancerous Conditions | 1 | CTD_human |
| umls:C0038325 | Stevens-Johnson Syndrome | 1 | BeFree |
|
Copyright 2016-Present - The University of Texas Health Science Center at Houston (UTHealth) Web File Viewing | How to Report, Fraud, Waste and Abuse | State of Texas | Statewide Search | Texas Homeland Security | Site Policies |