 |
| |
| |
| |
| |
| |
| |
|

| TissGeneSummary for CENPK |
 Gene summary Gene summary |
| Basic gene information | Gene symbol | CENPK |
| Gene name | centromere protein K | |
| Synonyms | AF5alpha|CENP-K|P33|Solt | |
| Cytomap | UCSC genome browser: 5q12.3 | |
| Type of gene | protein-coding | |
| RefGenes | NM_001267038.1, NM_022145.4, | |
| Description | SoxLZ/Sox6-binding protein Soltinterphase centromere complex protein 37leucine zipper protein FKSG14protein AF-5alpha | |
| Modification date | 20141207 | |
| dbXrefs | MIM : 611502 | |
| HGNC : HGNC | ||
| Ensembl : ENSG00000123219 | ||
| HPRD : 13323 | ||
| Vega : OTTHUMG00000131227 | ||
| Protein | UniProt: go to UniProt's Cross Reference DB Table | |
| Expression | CleanEX: HS_CENPK | |
| BioGPS: 64105 | ||
| Pathway | NCI Pathway Interaction Database: CENPK | |
| KEGG: CENPK | ||
| REACTOME: CENPK | ||
| Pathway Commons: CENPK | ||
| Context | iHOP: CENPK | |
| ligand binding site mutation search in PubMed: CENPK | ||
| UCL Cancer Institute: CENPK | ||
| Assigned class in TissGDB* | C | |
| Included tissue-specific gene expression resources | TiGER,GTEx | |
| Specific-tissues in normal samples (assigned by TissGDB using HPA, TiGER, and GTEx) | BladderBone marrowTestis | |
| Cancer types related to the specific-tissues in cancer samples (assigned by TissGDB using TCGA) | BLCALAMLTGCT | |
| Reference showing the relevant tissue of CENPK | ||
| Description by TissGene annotations | ||
| * Class A consists of genes with literature evidence and is part of the cTissGenes. Class B consists of only cTissGenes without additional evidence. The remaining genes belong to Class C. |
| Gene ontology having evidence of Inferred from Direct Assay (IDA) from Entrez |
| GO ID | GO term | PubMed ID |
| Top |
| TissGeneExp for CENPK |
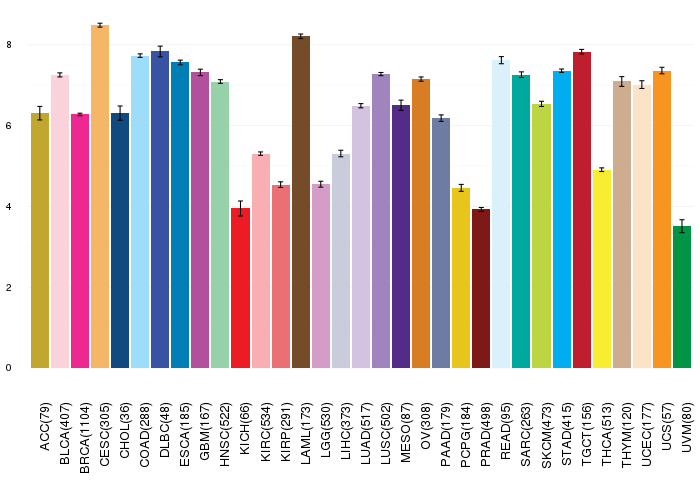
| Gene expressions across 28 cancer types (X-axis: cancer type and Y-axis: log2(norm_counts+1)) (TCGA IlluminaHiSeq_RNASeqV2, pan-cancer normalized log2(norm_counts+1) data, version 2016-08-16) |
 |
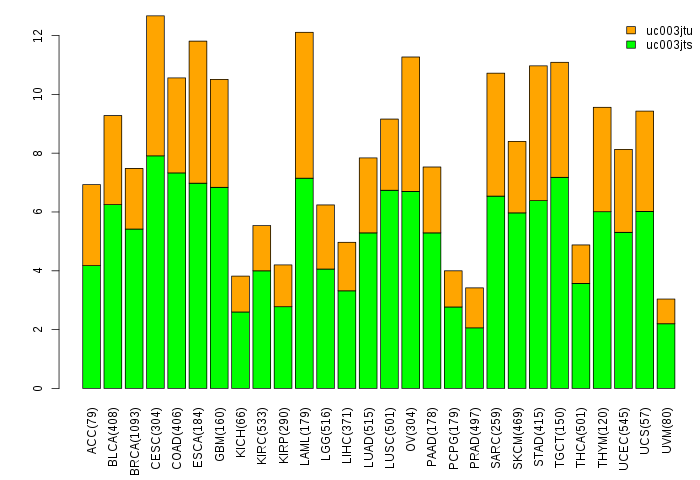
| Gene isoform expressions across 28 cancer types (X-axis: cancer type and Y-axis: log2(norm_counts+1)) (TCGA pan-cancer tcga_rsem_isoform_tpm, version 2016-09-01) |
 |
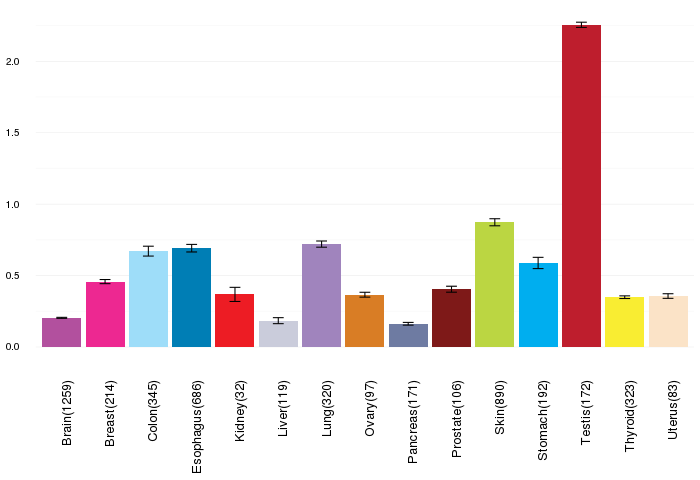
| Gene expressions across normal tissues of GTEx data (GTEx GTEx_Analysis_v6_RNA-seq_RNA-SeQCv1.1.8_gene_rpkm.gct) - Here, we shows the matched tissue types only among our 28 cancer types. |
 |
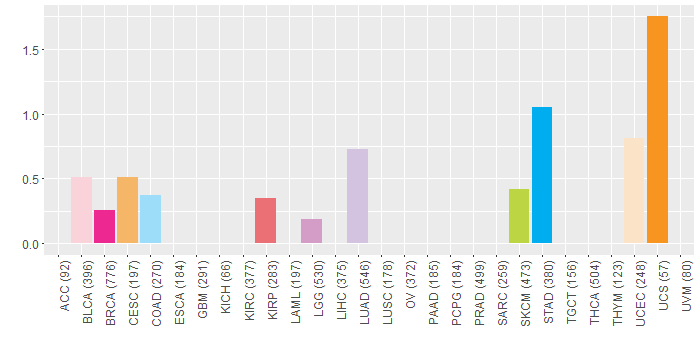
| Different expressions across 14 cancer types with more than 10 samples between matched tumors and normals (X-axis: cancer type and Y-axis: log2(norm_counts+1)) (TCGA IlluminaHiSeq_RNASeqV2, pan-cancer normalized log2(norm_counts+1) data, version 2016-08-16) |
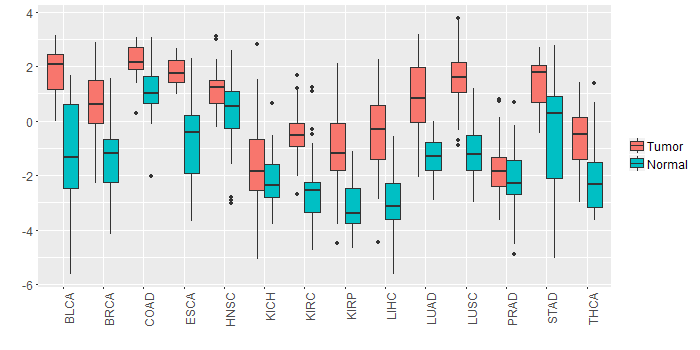 |
| - Significantly differentially expressed cancer types and information. (|Fold change|>1 and FDR<0.05) |
| Cancer type | Mean(exp) in tumor | Mean(exp) in matched normal | Log2FC | P-val. | FDR |
| KIRP | -1.042311406 | -3.114523906 | 2.0722125 | 7.22E-09 | 5.64E-08 |
| THCA | -0.644055262 | -2.158948482 | 1.51489322 | 7.98E-11 | 5.40E-10 |
| KIRC | -0.465610017 | -2.560201683 | 2.094591667 | 3.60E-27 | 5.24E-26 |
| LUSC | 1.52246531 | -1.14418567 | 2.66665098 | 2.17E-25 | 5.04E-24 |
| LIHC | -0.505355906 | -3.050851906 | 2.545496 | 1.42E-15 | 4.64E-14 |
| BRCA | 0.644998024 | -1.388987941 | 2.033985965 | 1.19E-32 | 1.82E-31 |
| LUAD | 0.835751956 | -1.299358388 | 2.135110345 | 6.61E-19 | 1.08E-17 |
| ESCA | 1.819444276 | -0.747901178 | 2.567345455 | 0.000378 | 0.0080064 |
| STAD | 1.395835469 | -0.412830156 | 1.808665625 | 2.94E-05 | 0.000276655 |
| COAD | 2.156645325 | 1.108599171 | 1.048046154 | 4.24E-05 | 0.00016799 |
| BLCA | 1.780294515 | -1.122689695 | 2.902984211 | 5.84E-06 | 0.000126099 |
| Top |
| TissGene-miRNA for CENPK |
| Significantly anti-correlated miRNAs of TissGene across 28 cancer types (Gene-miRNA relations from TargetScanHuman Relsease 7.1, Conserved_Site_Context_Scores.txt.zip, 06.01.2016) (TCGA IlluminaHiSeq_miRNASeq, log2(RPM+1) data, version 2016-11-21) (TCGA IlluminaHiSeq_RNASeqV2, log2(normalized_count+1) data, version 2016-08-16) (Spearman’s Rank Correlation (p-value<0.05 and coefficient<-0.25)) |
| Cancer type | miRNA id | miRNA accession | P-val. | Coeff. | # samples |
| UVM | hsa-miR-186-5p | MIMAT0000456 | 0.022 | -0.26 | 80 |
| Top |
| TissGeneMut for CENPK |
| TissGeneSNV for CENPK |
| nsSNV counts per each loci. Different colors of circles represent different cancer types. Circle size denotes number of samples. (TCGA somatic mutation (SNPs and small INDELs) data, version 2016-04-25) * Click on the image to enlarge it in a new window. |
 |
 |
| Somatic nucleotide variants of TissGene across 28 cancer types (X-axis: cancer type and Y-axis: % of mutated samples) The numbers in parentheses are numbers of samples with mutation (nsSNVs). (TCGA somatic mutation (SNPs and small INDELs) data, version 2016-04-25) |
 |
| - nsSNVs sorted by frequency. |
| AAchange | Cancer type | # samples |
| p.K196R | LUAD | 1 |
| p.S237C | SKCM | 1 |
| p.E244K | BLCA | 1 |
| p.K233N | UCS | 1 |
| p.E27K | UCEC | 1 |
| p.E174* | LUAD | 1 |
| p.V141A | COAD | 1 |
| p.T81P | READ | 1 |
| p.L180S | STAD | 1 |
| p.P227S | BLCA | 1 |
| p.T179I | STAD | 1 |
| p.L146F | UCEC | 1 |
| p.P83S | SKCM | 1 |
| p.R248L | LUAD | 1 |
| p.R248H | CESC | 1 |
| p.D9Y | LUAD | 1 |
| p.D5G | STAD | 1 |
| p.L264S | STAD | 1 |
| p.M166L | BRCA | 1 |
| p.I218F | BRCA | 1 |
| p.R248H | LGG | 1 |
| p.E70K | KIRP | 1 |
| Top |
| TissGeneCNV for CENPK |
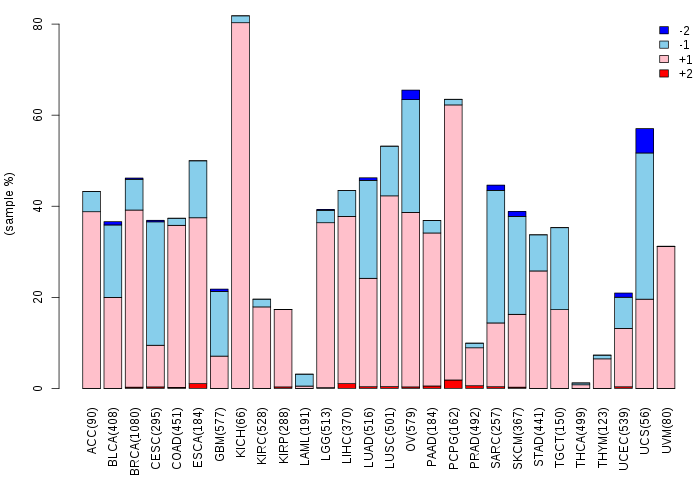
| Copy number variations of TissGene across 28 cancer types (X-axis: cancer type and Y-axis: % of CNV samples) (TCGA Gistic2_CopyNumber_Gistic2_all_data_by_genes, Gistic2 copy number data, version 2016-08-16) |
 |
| Top |
| TissGeneFusions for CENPK |
| Fusion genes including TissGene (ChimerDB 3.0, 2016-12-01 and TCGA fusion Portal 2015-12-01) |
| Database | Src | Cancer type | Sample | Fusion gene | ORF | 5'-gene BP | 3'-gene BP |
| Chimerdb3.0 | ChiTaRs | NA | BC005400 | CENPK-CCSER1 | chr5:64858985 | chr4:91495403 |
| Top |
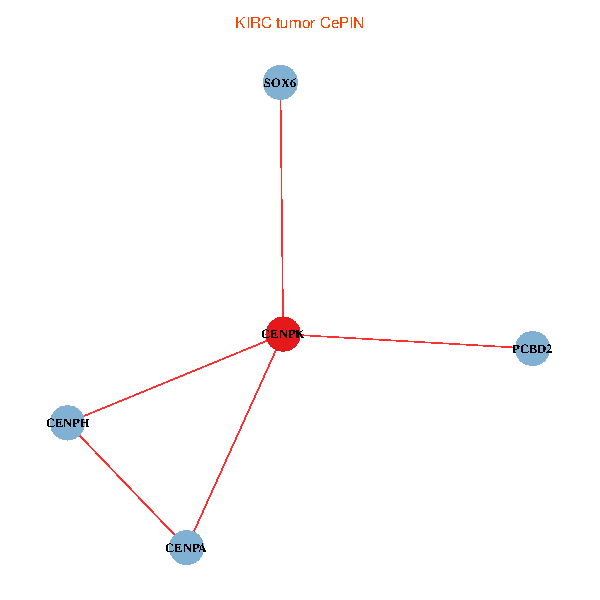
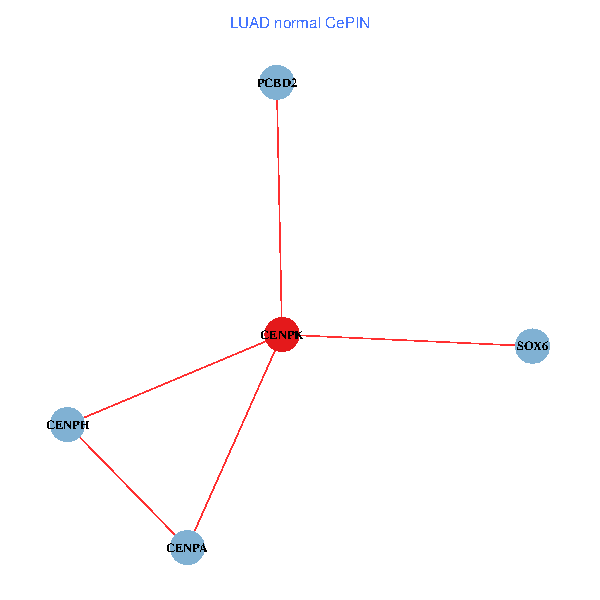
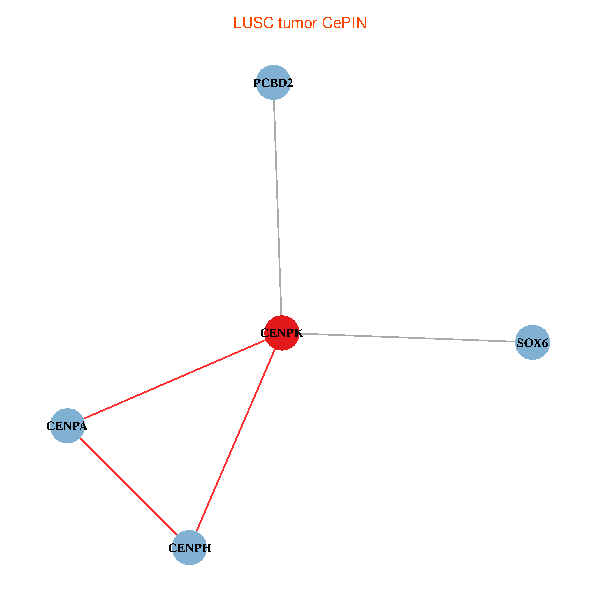
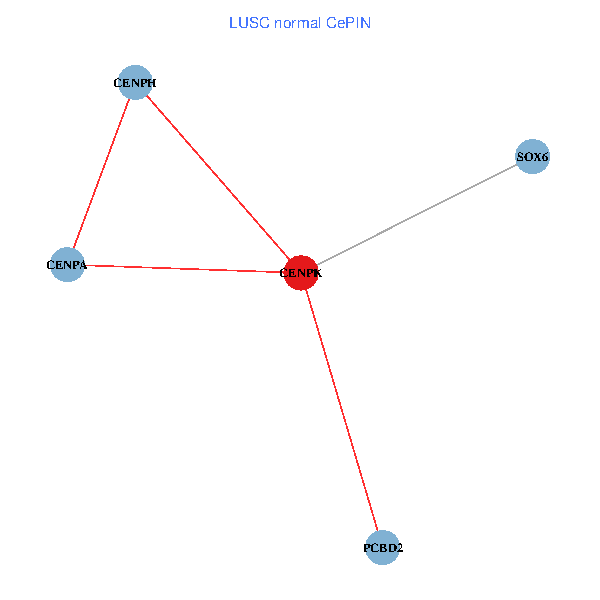
| TissGeneNet for CENPK |
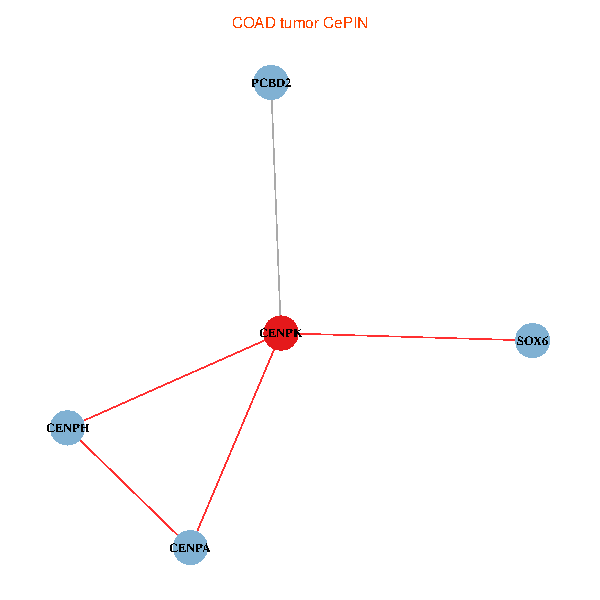
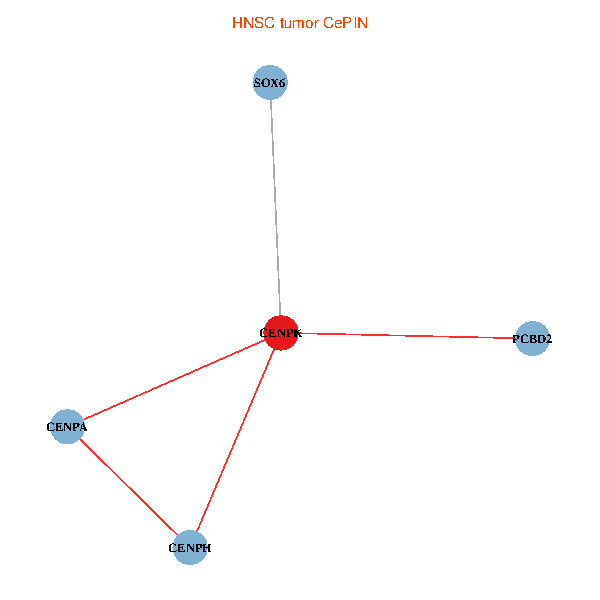
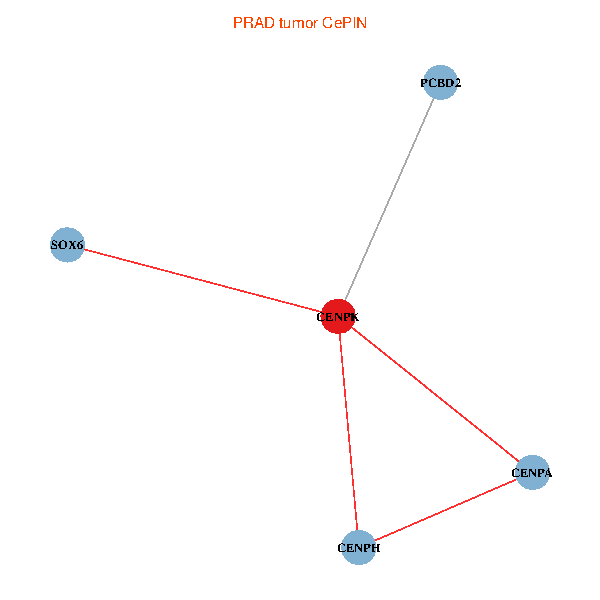
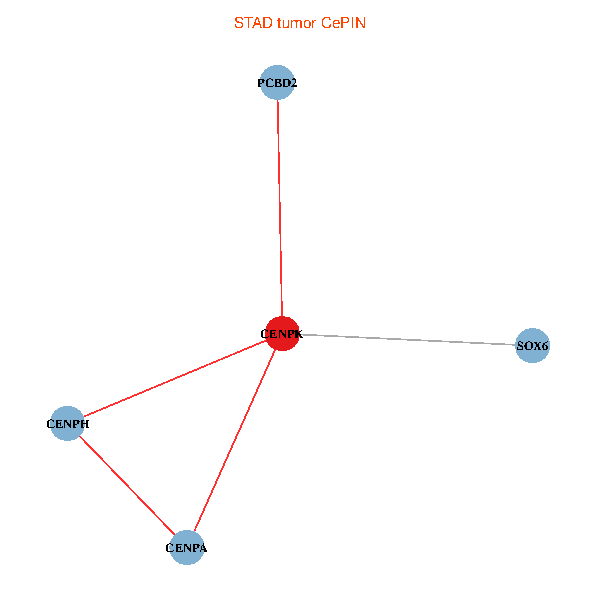
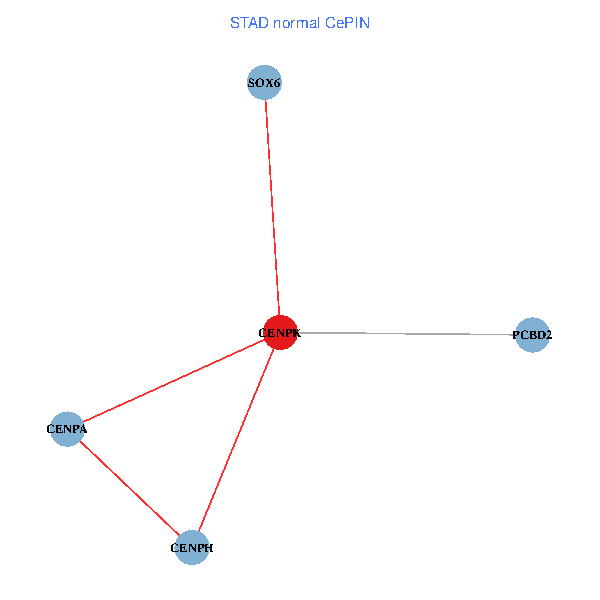
| Co-expressed gene networks based on protein-protein interaction data (CePIN) (TCGA IlluminaHiSeq_RNASeqV2, pan-cancer normalized log2(norm_counts+1) data, version 2016-08-16) (PINA2 ppi data) |
| BRCA (tumor) | BRCA (normal) |
| CENPK, CENPA, CENPH, PCBD2, SOX6 (tumor) | CENPK, CENPA, CENPH, PCBD2, SOX6 (normal) |
 |  |
| COAD (tumor) | COAD (normal) |
| CENPK, CENPA, CENPH, PCBD2, SOX6 (tumor) | CENPK, CENPA, CENPH, PCBD2, SOX6 (normal) |
 |  |
| HNSC (tumor) | HNSC (normal) |
| CENPK, CENPA, CENPH, PCBD2, SOX6 (tumor) | CENPK, CENPA, CENPH, PCBD2, SOX6 (normal) |
 |  |
| KICH (tumor) | KICH (normal) |
| CENPK, CENPA, CENPH, PCBD2, SOX6 (tumor) | CENPK, CENPA, CENPH, PCBD2, SOX6 (normal) |
 |  |
| KIRC (tumor) | KIRC (normal) |
| CENPK, CENPA, CENPH, PCBD2, SOX6 (tumor) | CENPK, CENPA, CENPH, PCBD2, SOX6 (normal) |
 |  |
| KIRP (tumor) | KIRP (normal) |
| CENPK, CENPA, CENPH, PCBD2, SOX6 (tumor) | CENPK, CENPA, CENPH, PCBD2, SOX6 (normal) |
 |  |
| LIHC (tumor) | LIHC (normal) |
| CENPK, CENPA, CENPH, PCBD2, SOX6 (tumor) | CENPK, CENPA, CENPH, PCBD2, SOX6 (normal) |
 |  |
| LUAD (tumor) | LUAD (normal) |
| CENPK, CENPA, CENPH, PCBD2, SOX6 (tumor) | CENPK, CENPA, CENPH, PCBD2, SOX6 (normal) |
 |  |
| LUSC (tumor) | LUSC (normal) |
| CENPK, CENPA, CENPH, PCBD2, SOX6 (tumor) | CENPK, CENPA, CENPH, PCBD2, SOX6 (normal) |
 |  |
| PRAD (tumor) | PRAD (normal) |
| CENPK, CENPA, CENPH, PCBD2, SOX6 (tumor) | CENPK, CENPA, CENPH, PCBD2, SOX6 (normal) |
 |  |
| STAD (tumor) | STAD (normal) |
| CENPK, CENPA, CENPH, PCBD2, SOX6 (tumor) | CENPK, CENPA, CENPH, PCBD2, SOX6 (normal) |
 |  |
| THCA (tumor) | THCA (normal) |
| CENPK, CENPA, CENPH, PCBD2, SOX6 (tumor) | CENPK, CENPA, CENPH, PCBD2, SOX6 (normal) |
 |  |
| Top |
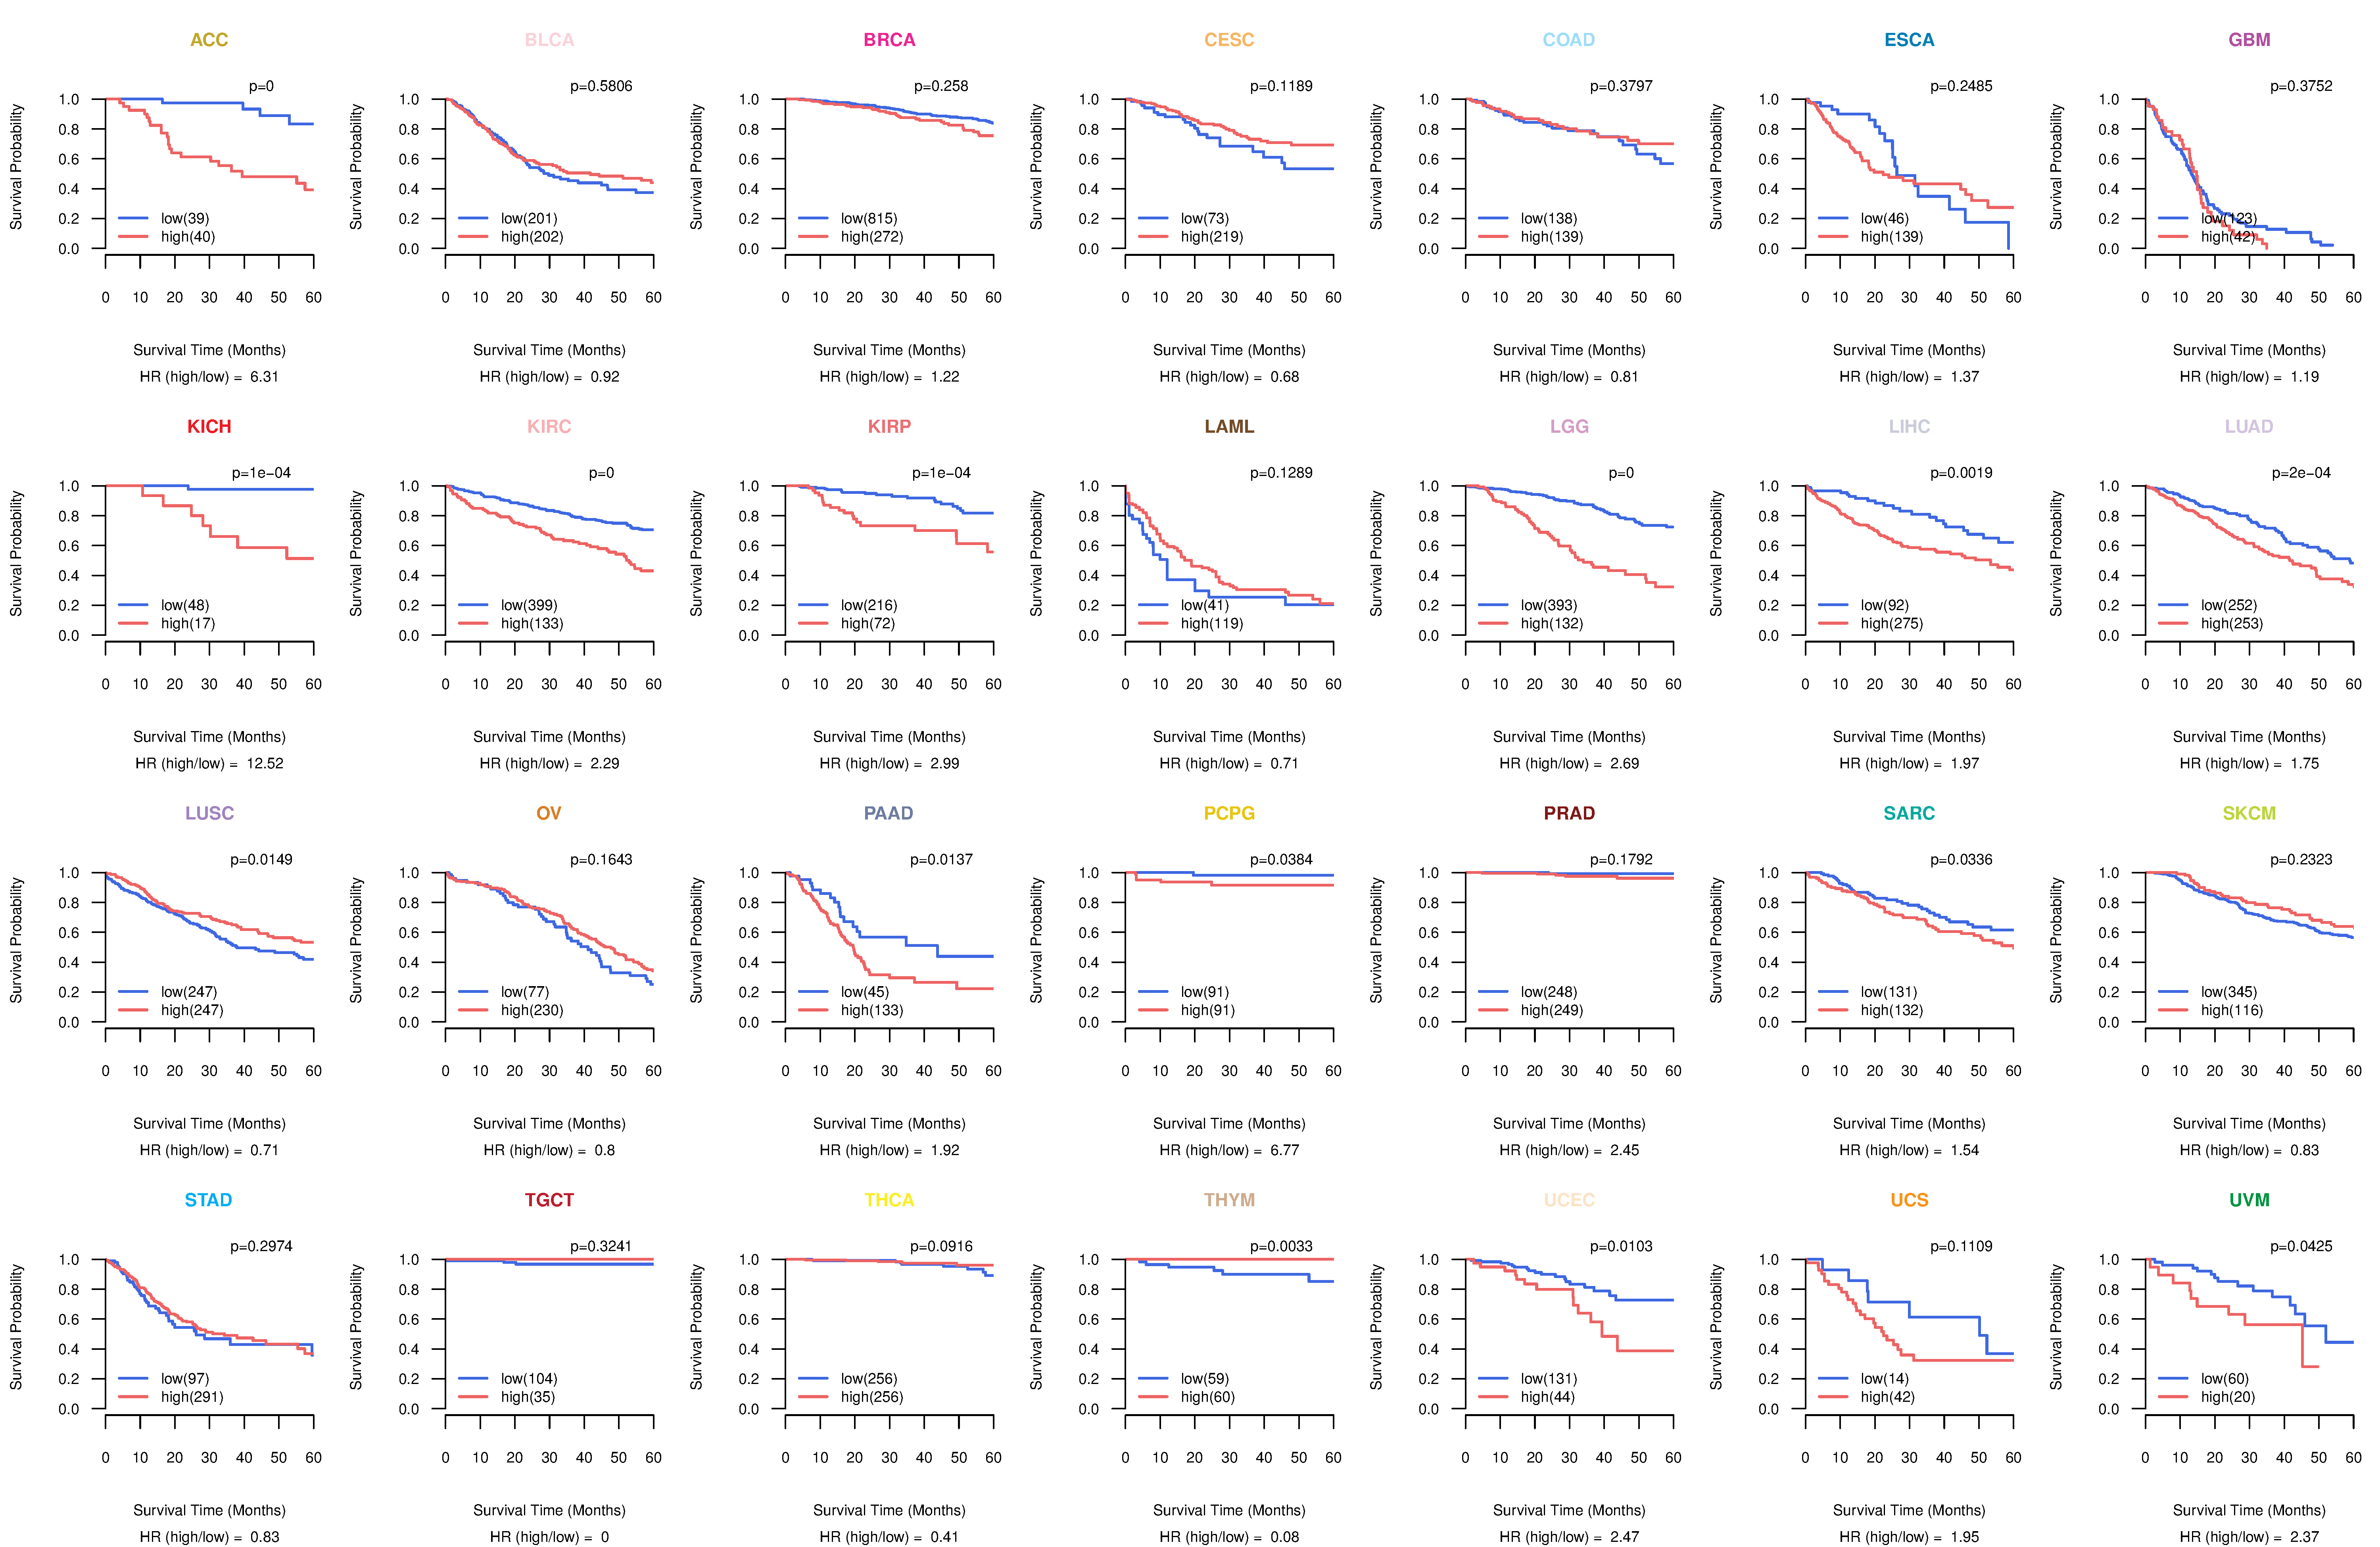
| TissGeneProg for CENPK |
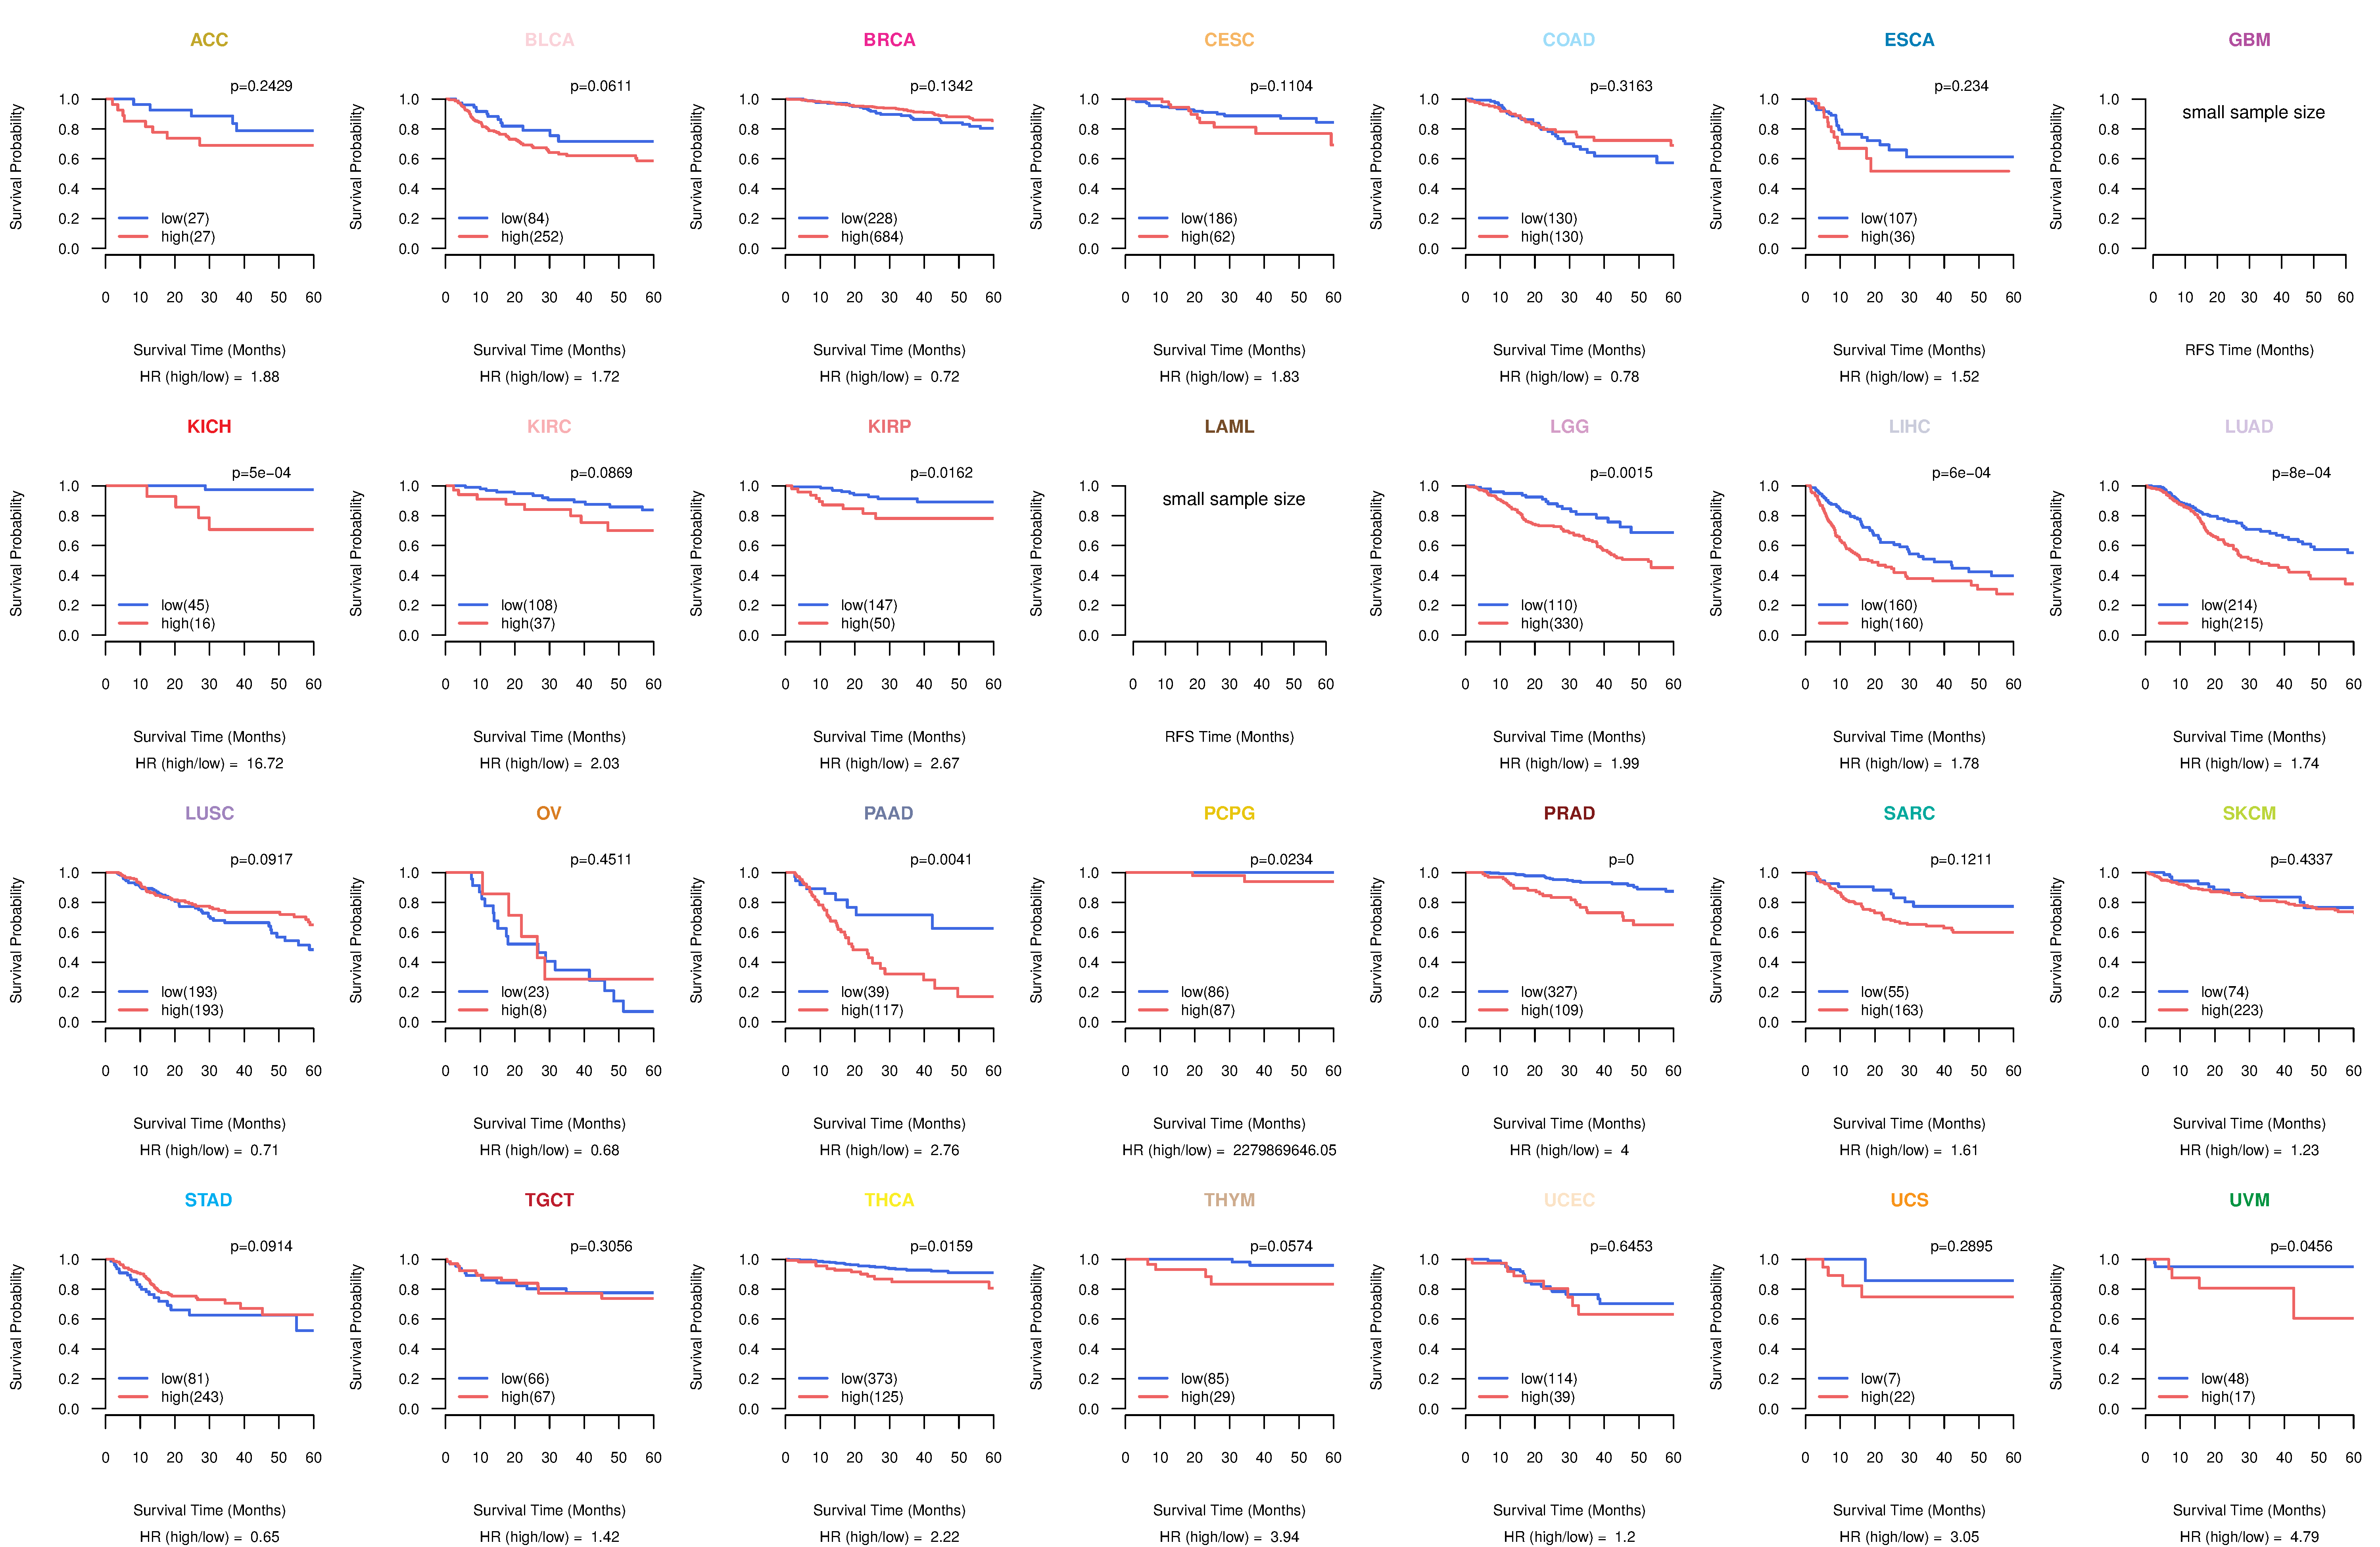
| Kaplan-Meier plots with logrank tests of overall survival (OS) using 28 cancer types (TCGA IlluminaHiSeq_RNASeqV2, pan-cancer normalized log2(norm_counts+1) data, version 2016-08-16) (TCGA clinicalMatrix, phenotype data, version 2016-04-27) * Click on the image to enlarge it in a new window. |
 |
| Kaplan-Meier plots with logrank test of relapse free survival (RFS) using 28 cancer types (TCGA IlluminaHiSeq_RNASeqV2, pan-cancer normalized log2(norm_counts+1) data, version 2016-08-16) (TCGA clinicalMatrix, phenotype data, version 2016-04-27) * Click on the image enlarge it in a new window. |
 |
| Forest plot of Cox proportional hazard ratio (HR) and 95% CI of overall survival (OS) using 28 cancer types (TCGA IlluminaHiSeq_RNASeqV2, pan-cancer normalized log2(norm_counts+1) data, version 2016-08-16) (TCGA clinicalMatrix, phenotype data, version 2016-04-27) * Click on the image enlarge it in a new window. |
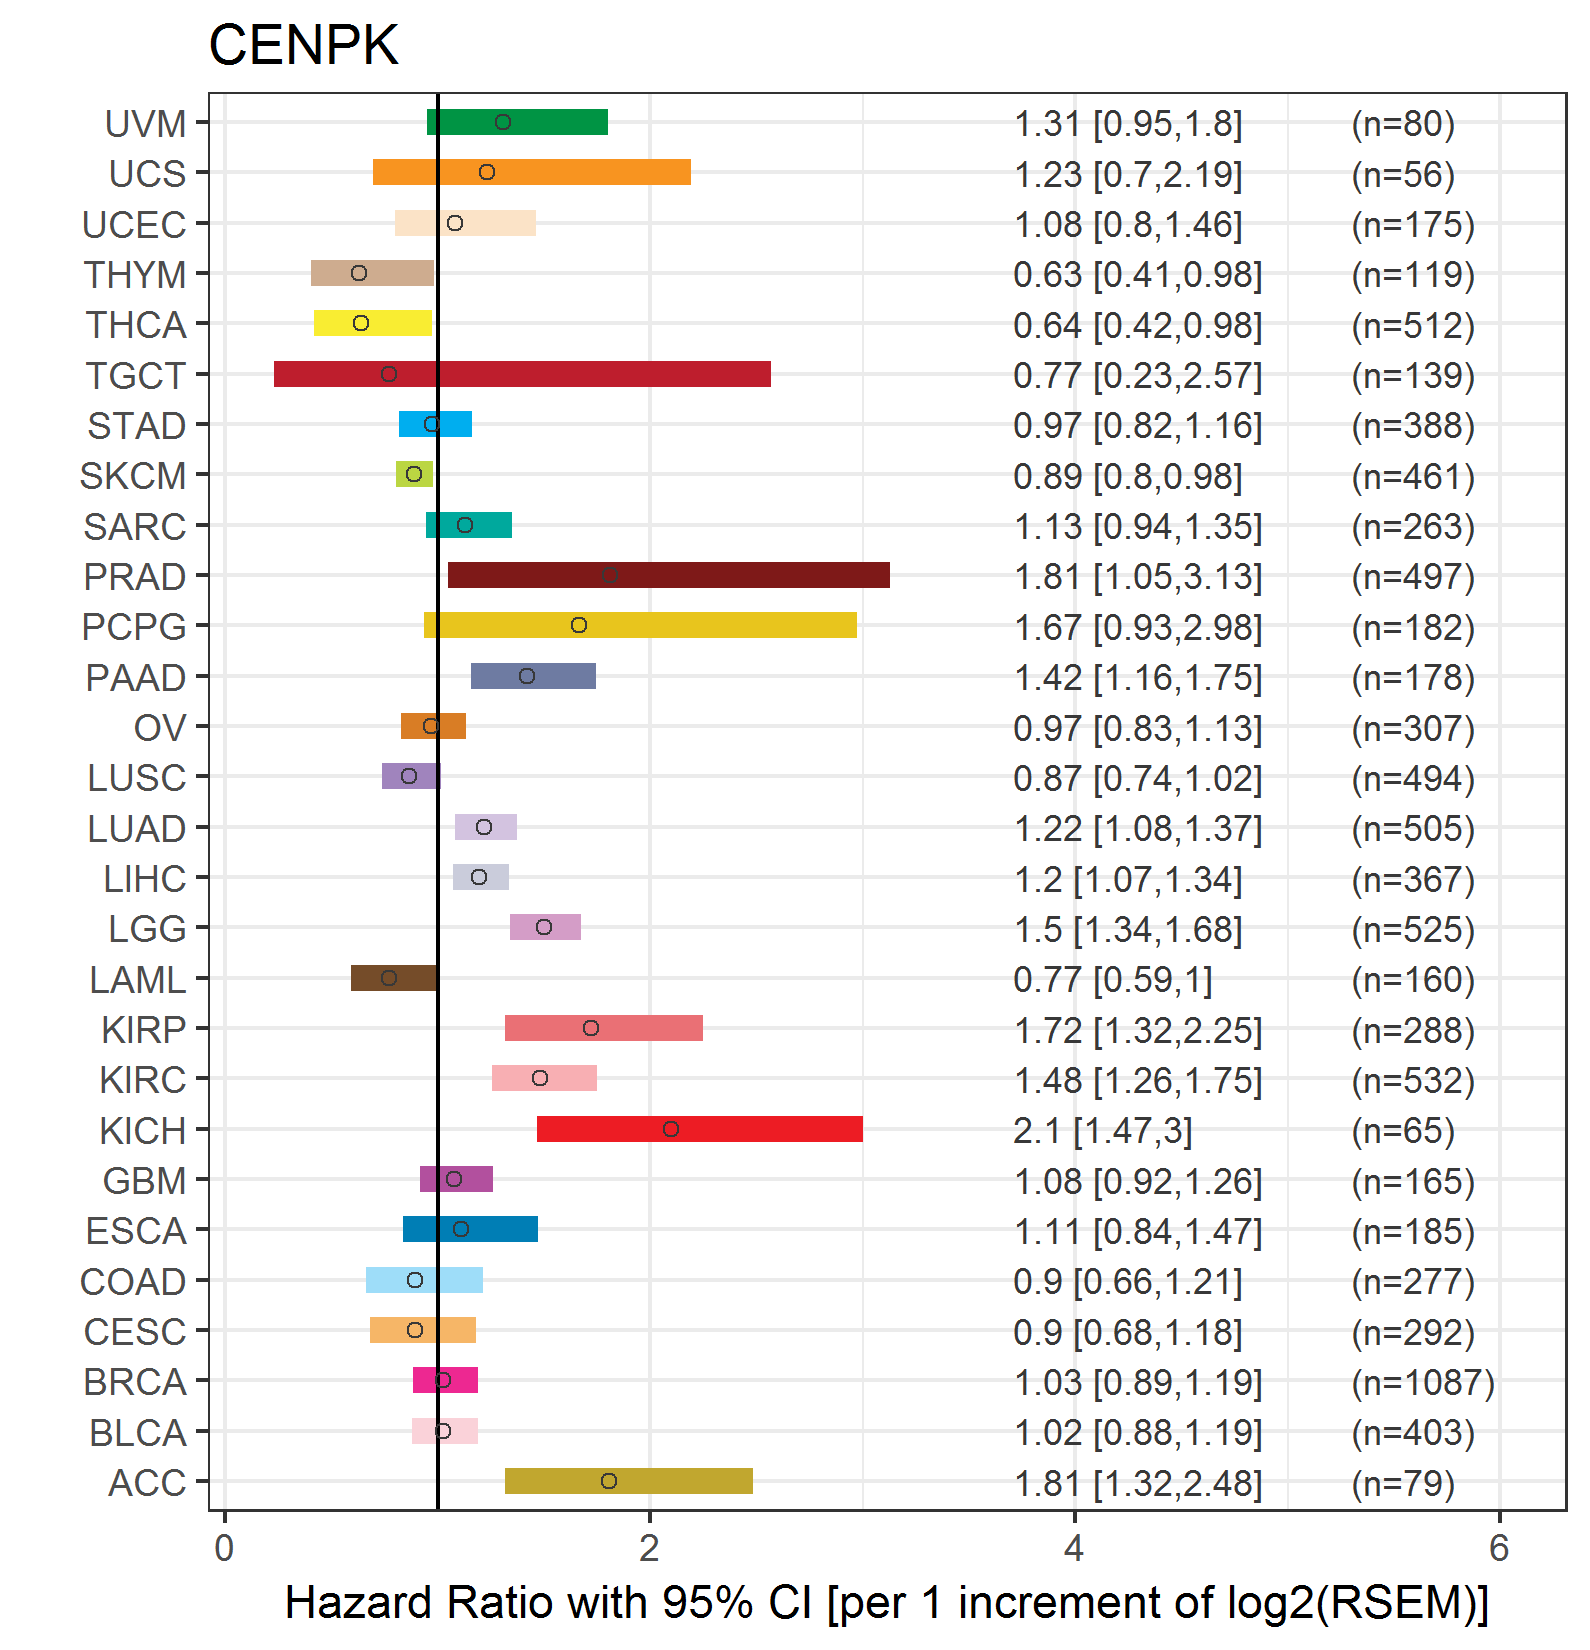 |
| Forest plot of Cox proportional hazard ratio (HR) and 95% CI of relapse free survival (RFS) using 28 cancer types (TCGA IlluminaHiSeq_RNASeqV2, pan-cancer normalized log2(norm_counts+1) data, version 2016-08-16) (TCGA clinicalMatrix, phenotype data, version 2016-04-27) * Click on the image enlarge it in a new window. |
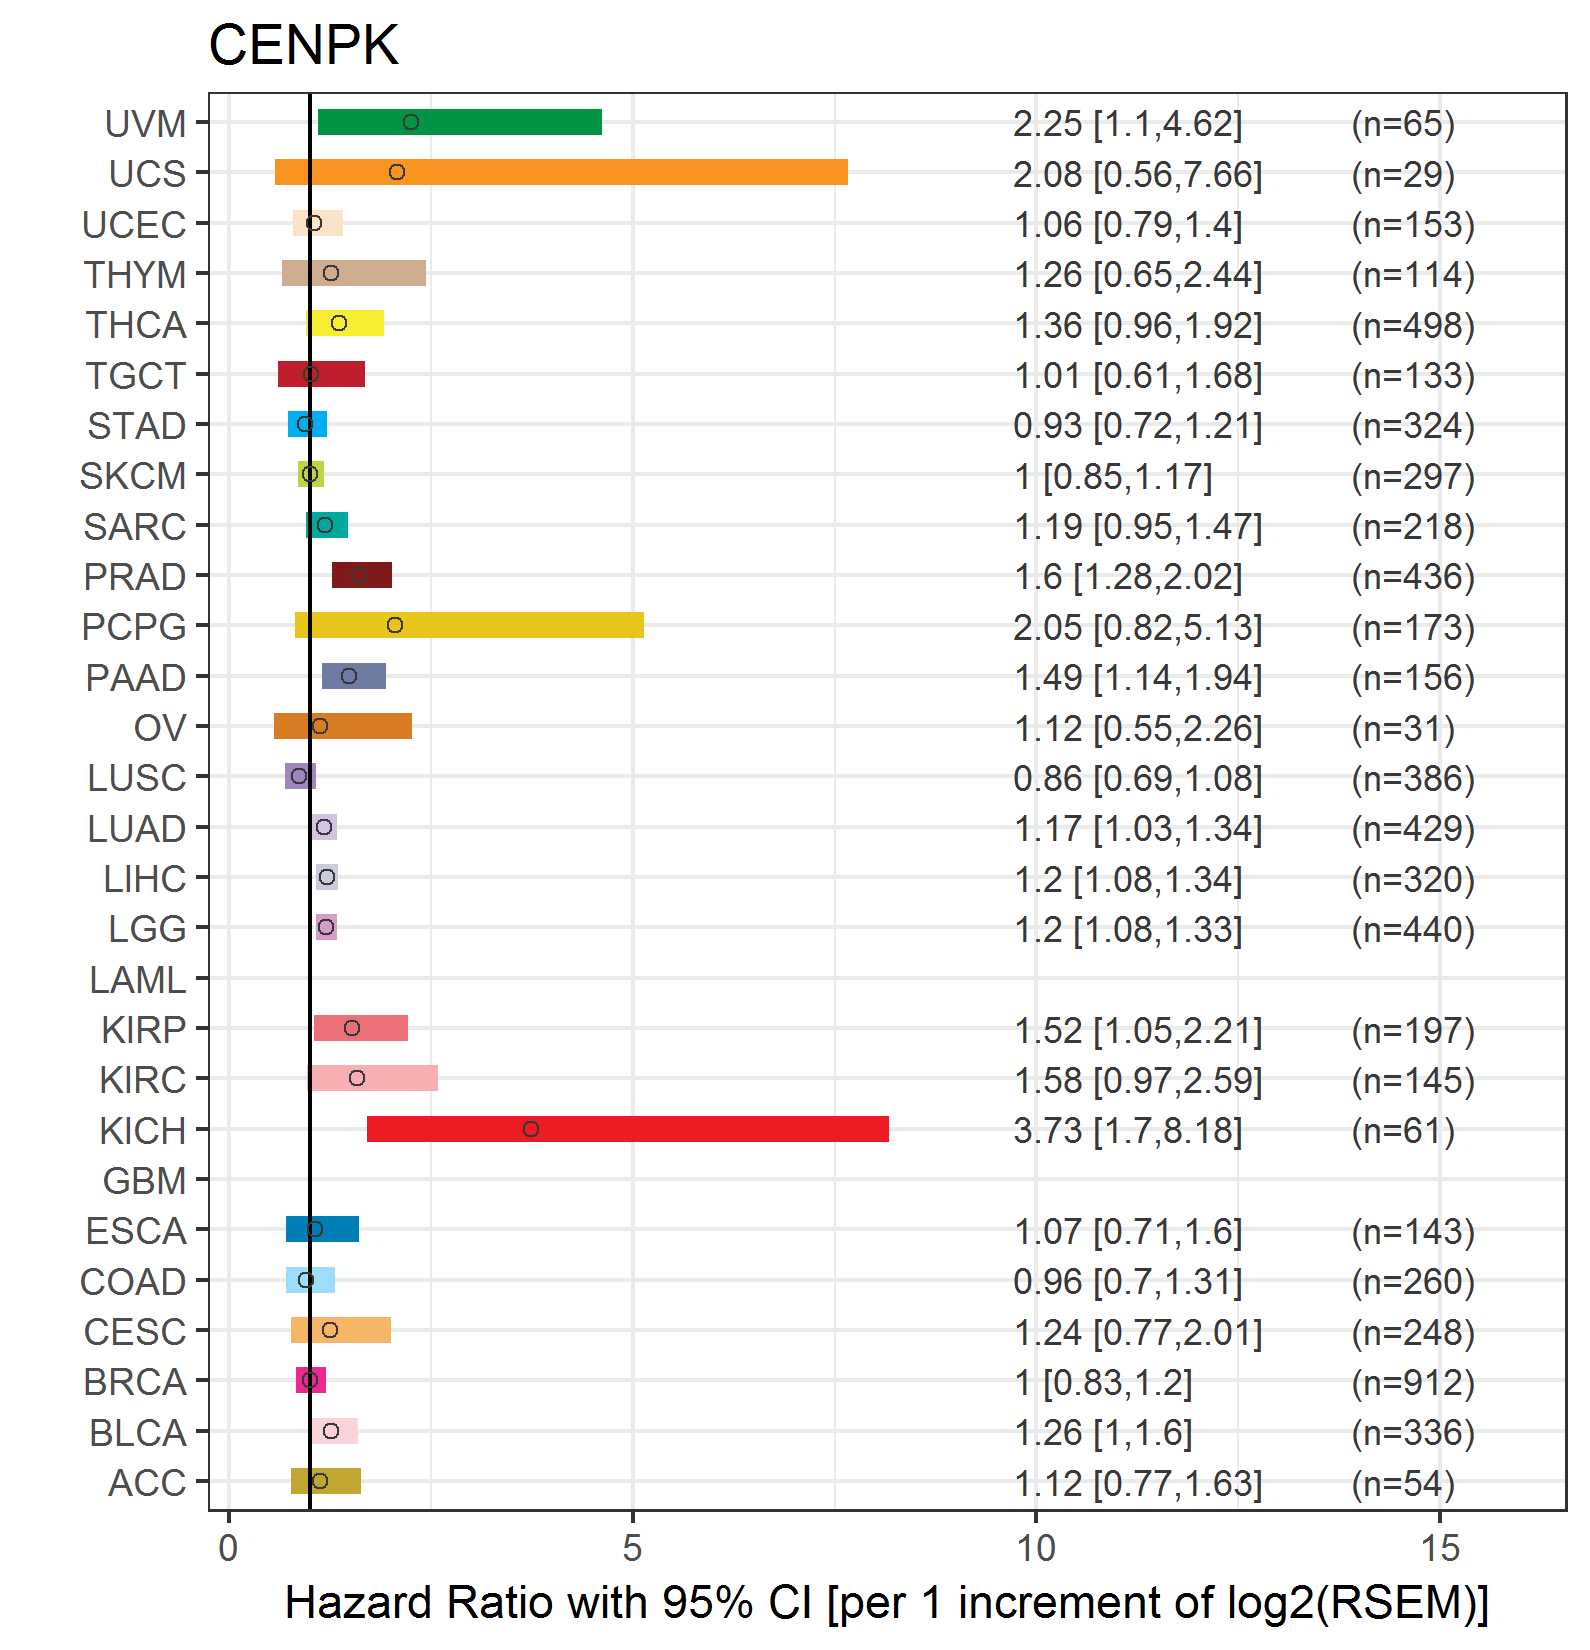 |
| Top |
| TissGeneClin for CENPK |
| TissGeneDrug for CENPK |
| Drug information targeting TissGene (DrugBank Version 5.0.6, 2017-04-01) |
| DrugBank ID | Drug name | Drug activity | Drug type | Drug status |
| Top |
| TissGeneDisease for CENPK |
| Disease information associated with TissGene (DisGeNet, 2016-06-01) |
| Disease ID | Disease name | # pubmeds | Source |
| umls:C3539878 | Triple Negative Breast Neoplasms | 1 | BeFree |
|
Copyright 2016-Present - The University of Texas Health Science Center at Houston (UTHealth) Web File Viewing | How to Report, Fraud, Waste and Abuse | State of Texas | Statewide Search | Texas Homeland Security | Site Policies |