 |
| |
| |
| |
| |
| |
| |
|

| TissGeneSummary for NCAPG |
 Gene summary Gene summary |
| Basic gene information | Gene symbol | NCAPG |
| Gene name | non-SMC condensin I complex, subunit G | |
| Synonyms | CAPG|CHCG|NY-MEL-3|YCG1 | |
| Cytomap | UCSC genome browser: 4p15.33 | |
| Type of gene | protein-coding | |
| RefGenes | NM_022346.4, NR_073124.1, | |
| Description | XCAP-G homologchromosome condensation protein Gchromosome-associated protein Gcondensin complex subunit 3condensin subunit CAP-Gmelanoma antigen NY-MEL-3 | |
| Modification date | 20141207 | |
| dbXrefs | MIM : 606280 | |
| HGNC : HGNC | ||
| Ensembl : ENSG00000109805 | ||
| HPRD : 12097 | ||
| Vega : OTTHUMG00000128539 | ||
| Protein | UniProt: go to UniProt's Cross Reference DB Table | |
| Expression | CleanEX: HS_NCAPG | |
| BioGPS: 64151 | ||
| Pathway | NCI Pathway Interaction Database: NCAPG | |
| KEGG: NCAPG | ||
| REACTOME: NCAPG | ||
| Pathway Commons: NCAPG | ||
| Context | iHOP: NCAPG | |
| ligand binding site mutation search in PubMed: NCAPG | ||
| UCL Cancer Institute: NCAPG | ||
| Assigned class in TissGDB* | C | |
| Included tissue-specific gene expression resources | TiGER,GTEx | |
| Specific-tissues in normal samples (assigned by TissGDB using HPA, TiGER, and GTEx) | CervixTestis | |
| Cancer types related to the specific-tissues in cancer samples (assigned by TissGDB using TCGA) | CESCTGCT | |
| Reference showing the relevant tissue of NCAPG | ||
| Description by TissGene annotations | ||
| * Class A consists of genes with literature evidence and is part of the cTissGenes. Class B consists of only cTissGenes without additional evidence. The remaining genes belong to Class C. |
| Gene ontology having evidence of Inferred from Direct Assay (IDA) from Entrez |
| GO ID | GO term | PubMed ID | GO:0007076 | mitotic chromosome condensation | 11136719 | GO:0007076 | mitotic chromosome condensation | 11136719 |
| Top |
| TissGeneExp for NCAPG |
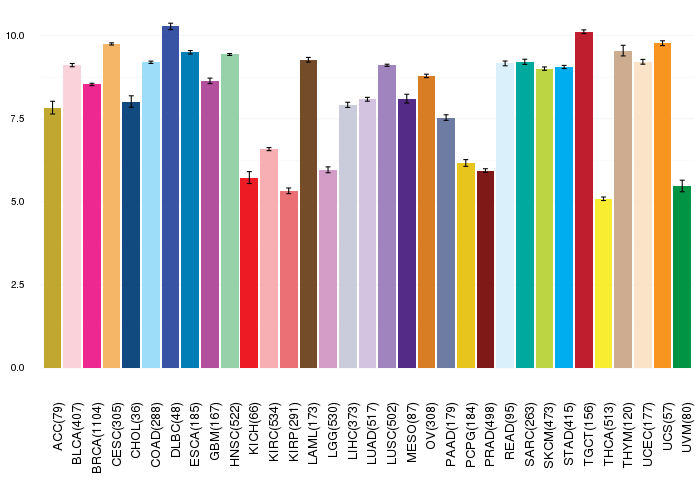
| Gene expressions across 28 cancer types (X-axis: cancer type and Y-axis: log2(norm_counts+1)) (TCGA IlluminaHiSeq_RNASeqV2, pan-cancer normalized log2(norm_counts+1) data, version 2016-08-16) |
 |
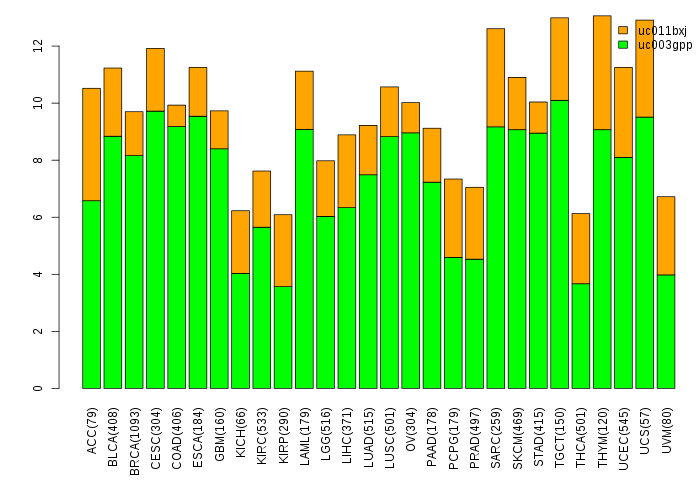
| Gene isoform expressions across 28 cancer types (X-axis: cancer type and Y-axis: log2(norm_counts+1)) (TCGA pan-cancer tcga_rsem_isoform_tpm, version 2016-09-01) |
 |
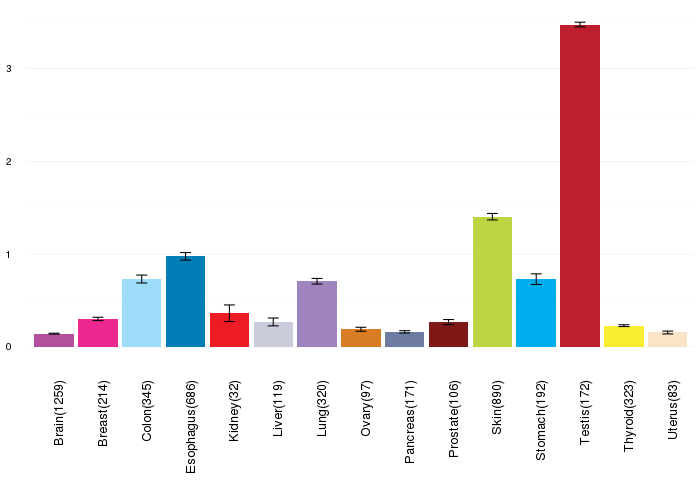
| Gene expressions across normal tissues of GTEx data (GTEx GTEx_Analysis_v6_RNA-seq_RNA-SeQCv1.1.8_gene_rpkm.gct) - Here, we shows the matched tissue types only among our 28 cancer types. |
 |
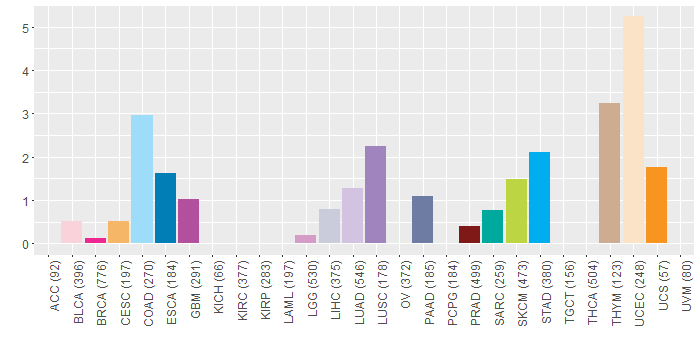
| Different expressions across 14 cancer types with more than 10 samples between matched tumors and normals (X-axis: cancer type and Y-axis: log2(norm_counts+1)) (TCGA IlluminaHiSeq_RNASeqV2, pan-cancer normalized log2(norm_counts+1) data, version 2016-08-16) |
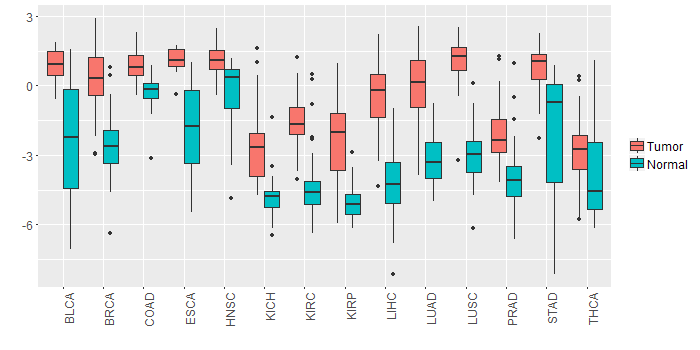 |
| - Significantly differentially expressed cancer types and information. (|Fold change|>1 and FDR<0.05) |
| Cancer type | Mean(exp) in tumor | Mean(exp) in matched normal | Log2FC | P-val. | FDR |
| KIRC | -1.549481978 | -4.426515311 | 2.877033333 | 4.11E-32 | 9.21E-31 |
| KICH | -2.484386422 | -4.789234422 | 2.304848 | 2.36E-06 | 8.31E-06 |
| KIRP | -2.325323297 | -4.995242047 | 2.66991875 | 8.43E-10 | 7.97E-09 |
| STAD | 0.761195453 | -1.964951422 | 2.726146875 | 5.54E-06 | 6.96E-05 |
| LIHC | -0.429730422 | -4.346454422 | 3.916724 | 6.36E-22 | 5.43E-20 |
| BRCA | 0.357641122 | -2.577676422 | 2.935317544 | 8.25E-50 | 5.17E-48 |
| PRAD | -2.112649499 | -4.039716807 | 1.927067308 | 1.26E-11 | 4.08E-10 |
| COAD | 0.850469732 | -0.269741807 | 1.120211538 | 4.87E-07 | 2.96E-06 |
| HNSC | 1.13778288 | -0.279305492 | 1.417088372 | 1.95E-07 | 1.78E-06 |
| LUAD | 0.04527875 | -3.22050056 | 3.26577931 | 2.41E-27 | 1.50E-25 |
| LUSC | 1.071450048 | -2.941432305 | 4.012882353 | 1.24E-33 | 1.16E-31 |
| ESCA | 1.070364487 | -1.949953695 | 3.020318182 | 0.000883 | 0.013268865 |
| THCA | -2.869006083 | -3.870651846 | 1.001645763 | 0.00125 | 0.002864907 |
| BLCA | 0.910899894 | -2.393000106 | 3.3039 | 3.04E-05 | 0.0004448 |
| Top |
| TissGene-miRNA for NCAPG |
| Significantly anti-correlated miRNAs of TissGene across 28 cancer types (Gene-miRNA relations from TargetScanHuman Relsease 7.1, Conserved_Site_Context_Scores.txt.zip, 06.01.2016) (TCGA IlluminaHiSeq_miRNASeq, log2(RPM+1) data, version 2016-11-21) (TCGA IlluminaHiSeq_RNASeqV2, log2(normalized_count+1) data, version 2016-08-16) (Spearman’s Rank Correlation (p-value<0.05 and coefficient<-0.25)) |
| Cancer type | miRNA id | miRNA accession | P-val. | Coeff. | # samples |
| Top |
| TissGeneMut for NCAPG |
| TissGeneSNV for NCAPG |
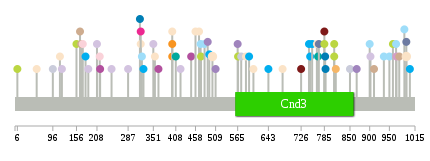
| nsSNV counts per each loci. Different colors of circles represent different cancer types. Circle size denotes number of samples. (TCGA somatic mutation (SNPs and small INDELs) data, version 2016-04-25) * Click on the image to enlarge it in a new window. |
 |
 |
| Somatic nucleotide variants of TissGene across 28 cancer types (X-axis: cancer type and Y-axis: % of mutated samples) The numbers in parentheses are numbers of samples with mutation (nsSNVs). (TCGA somatic mutation (SNPs and small INDELs) data, version 2016-04-25) |
 |
| - nsSNVs sorted by frequency. |
| AAchange | Cancer type | # samples |
| p.E501K | UCEC | 2 |
| p.R993Q | UCEC | 2 |
| p.S975I | THYM | 1 |
| p.L186F | LUAD | 1 |
| p.S787F | ESCA | 1 |
| p.P156S | SKCM | 1 |
| p.E546K | HNSC | 1 |
| p.K208N | LUAD | 1 |
| p.Y565H | LUSC | 1 |
| p.Q814* | CESC | 1 |
| p.S1002N | STAD | 1 |
| p.N319H | UCEC | 1 |
| p.E771Q | PAAD | 1 |
| p.A471V | COAD | 1 |
| p.P785T | PRAD | 1 |
| p.S574X | LIHC | 1 |
| p.R458I | UCEC | 1 |
| p.I326S | STAD | 1 |
| p.C769F | SARC | 1 |
| p.R6K | SKCM | 1 |
| p.G215V | BLCA | 1 |
| p.S788F | ESCA | 1 |
| p.E679* | UCEC | 1 |
| p.E900X | COAD | 1 |
| p.Q558H | HNSC | 1 |
| p.R993Q | PAAD | 1 |
| p.T962P | DLBC | 1 |
| p.R168X | THYM | 1 |
| p.A911V | THYM | 1 |
| p.Y850H | LIHC | 1 |
| p.V114L | UCEC | 1 |
| p.V55A | UCEC | 1 |
| p.C317F | ESCA | 1 |
| p.S959* | SKCM | 1 |
| p.R287W | LUAD | 1 |
| p.N319I | BRCA | 1 |
| p.T968I | LGG | 1 |
| p.A493T | STAD | 1 |
| p.S726I | PRAD | 1 |
| p.K643N | STAD | 1 |
| p.P472S | SKCM | 1 |
| p.R749Q | STAD | 1 |
| p.D351Y | LUAD | 1 |
| p.G810R | SKCM | 1 |
| p.L867F | LUSC | 1 |
| p.I408V | SARC | 1 |
| p.V936A | COAD | 1 |
| p.G902R | LUAD | 1 |
| p.P172T | BLCA | 1 |
| p.E489K | LUSC | 1 |
| p.E586K | UCEC | 1 |
| p.Q245E | LUAD | 1 |
| p.R420K | LUAD | 1 |
| p.N950I | COAD | 1 |
| p.G810E | SKCM | 1 |
| p.E566K | SKCM | 1 |
| p.I594R | STAD | 1 |
| p.R216H | GBM | 1 |
| p.P364L | GBM | 1 |
| p.G322D | COAD | 1 |
| p.R447G | GBM | 1 |
| p.N766Y | UCEC | 1 |
| p.P785R | SKCM | 1 |
| p.E399* | UCEC | 1 |
| p.E355* | UCEC | 1 |
| p.L96F | LIHC | 1 |
| p.V754M | STAD | 1 |
| p.S467* | UCEC | 1 |
| p.D481N | COAD | 1 |
| p.Q967H | COAD | 1 |
| p.A165V | THYM | 1 |
| p.E399X | UCS | 1 |
| p.V179L | STAD | 1 |
| p.V746I | STAD | 1 |
| p.E399* | UCS | 1 |
| p.C119W | LUAD | 1 |
| p.V605A | UCEC | 1 |
| p.C509F | LUSC | 1 |
| p.M988I | COAD | 1 |
| Top |
| TissGeneCNV for NCAPG |
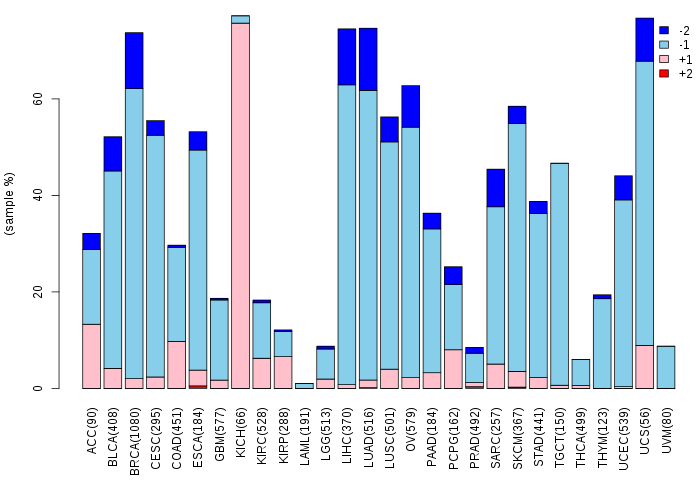
| Copy number variations of TissGene across 28 cancer types (X-axis: cancer type and Y-axis: % of CNV samples) (TCGA Gistic2_CopyNumber_Gistic2_all_data_by_genes, Gistic2 copy number data, version 2016-08-16) |
 |
| Top |
| TissGeneFusions for NCAPG |
| Fusion genes including TissGene (ChimerDB 3.0, 2016-12-01 and TCGA fusion Portal 2015-12-01) |
| Database | Src | Cancer type | Sample | Fusion gene | ORF | 5'-gene BP | 3'-gene BP |
| Chimerdb3.0 | ChiTaRs | NA | AW794691 | NCAPG-NCAPG | chr4:17844002 | chr4:17841698 |
| Top |
| TissGeneNet for NCAPG |
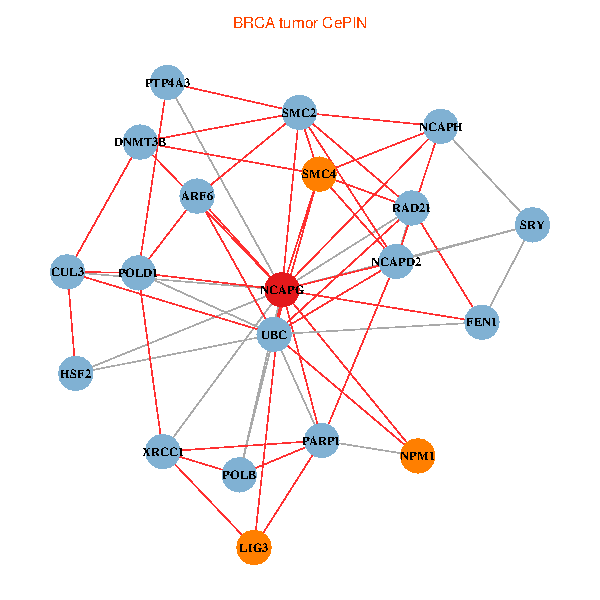
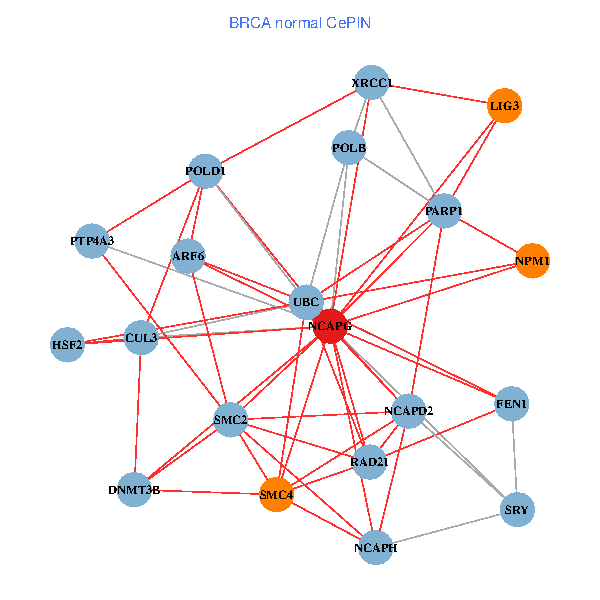
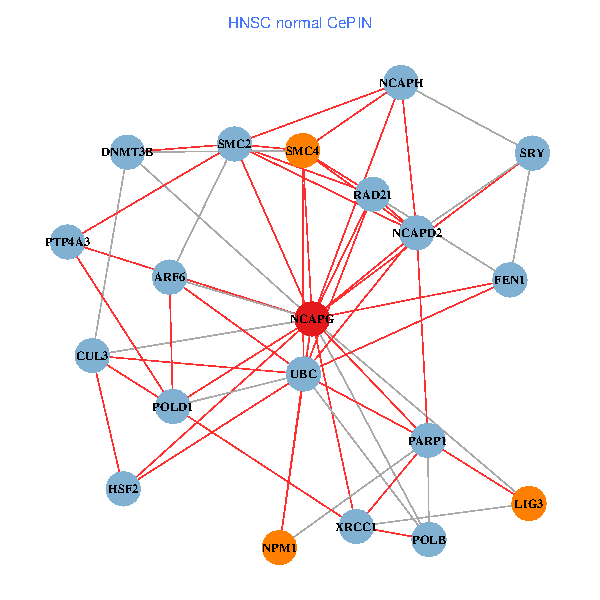
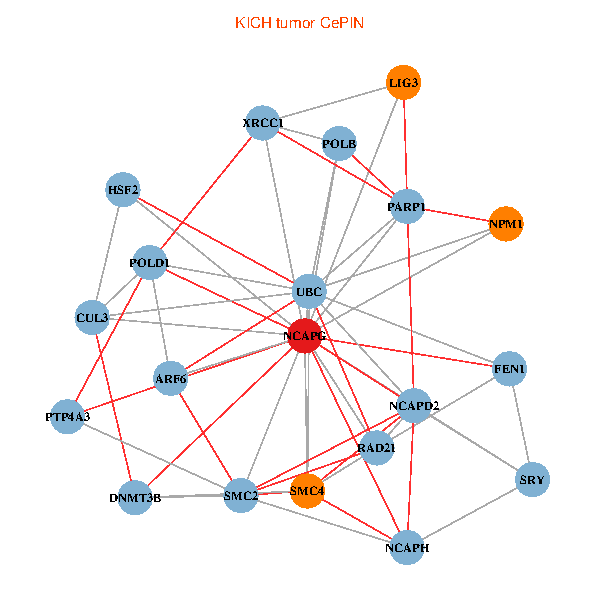
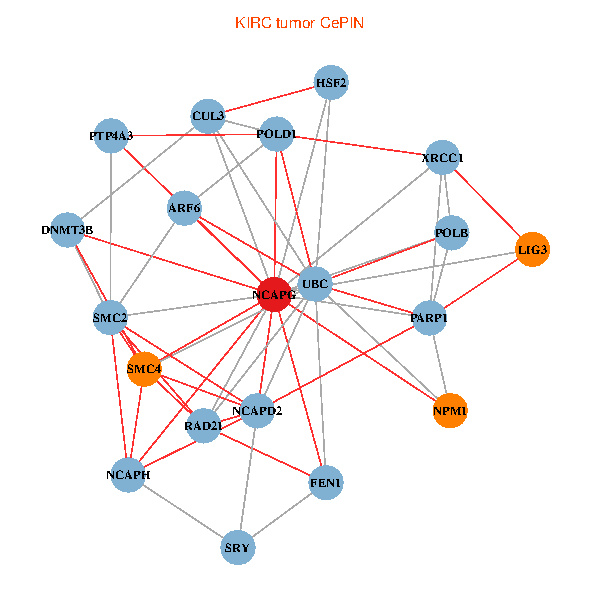
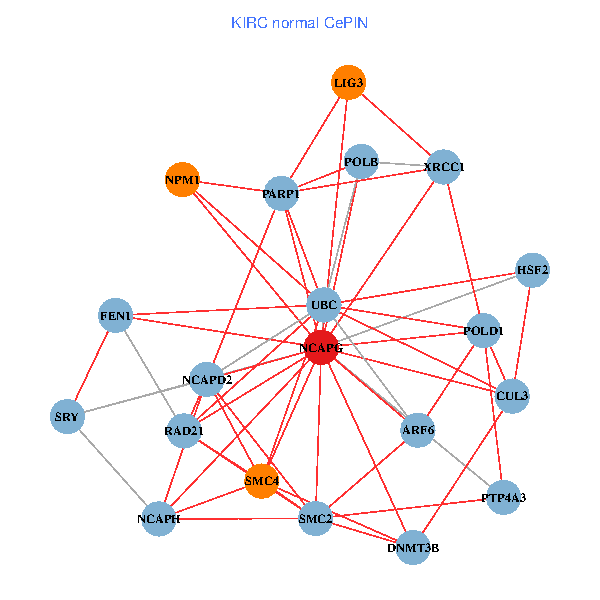
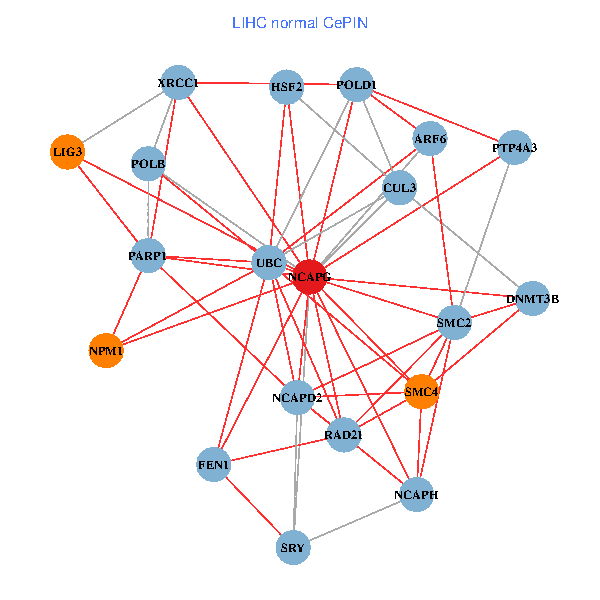
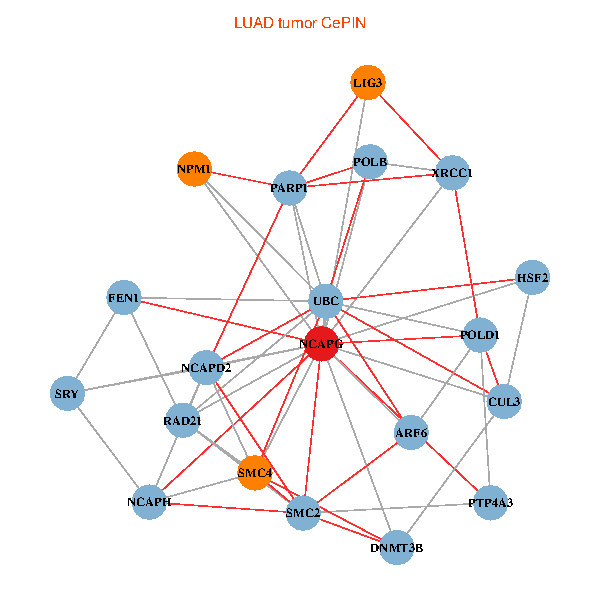
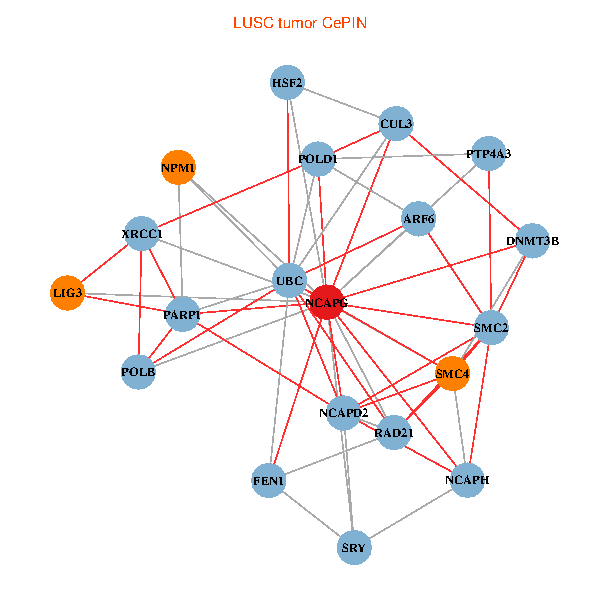
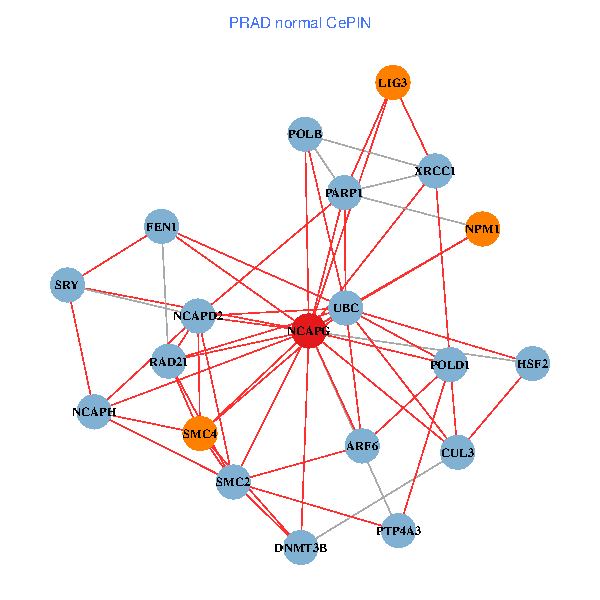
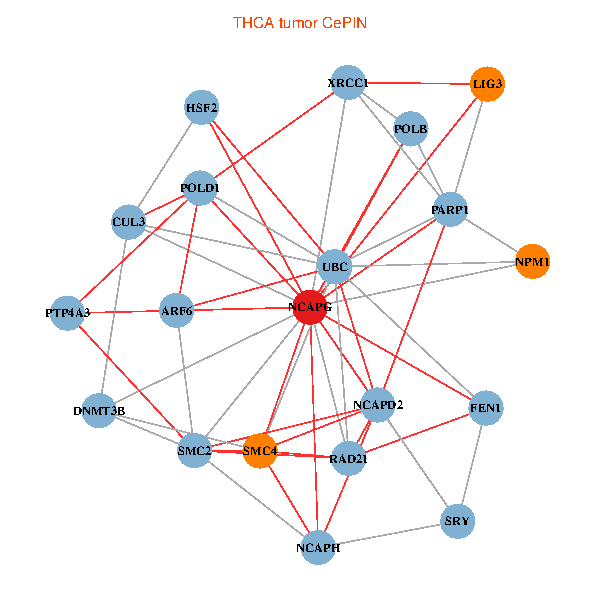
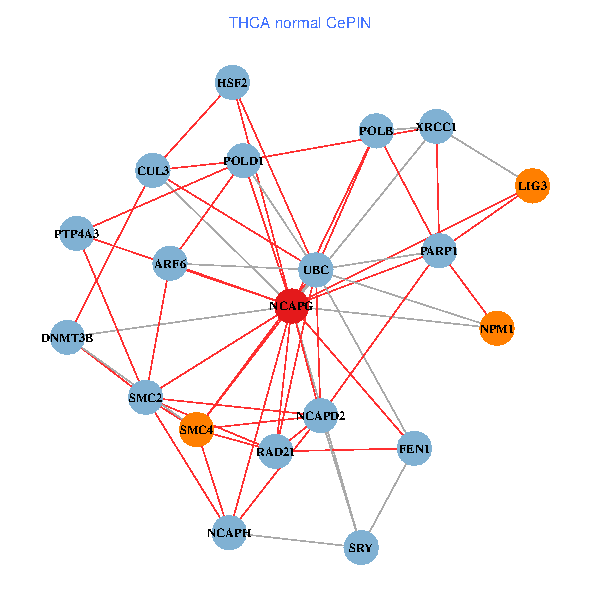
| Co-expressed gene networks based on protein-protein interaction data (CePIN) (TCGA IlluminaHiSeq_RNASeqV2, pan-cancer normalized log2(norm_counts+1) data, version 2016-08-16) (PINA2 ppi data) |
| BRCA (tumor) | BRCA (normal) |
| NCAPG, UBC, CUL3, POLB, SMC2, HSF2, DNMT3B, RAD21, LIG3, PTP4A3, NPM1, XRCC1, PARP1, FEN1, ARF6, POLD1, SRY, NCAPD2, NCAPH, SMC4 (tumor) | NCAPG, UBC, CUL3, POLB, SMC2, HSF2, DNMT3B, RAD21, LIG3, PTP4A3, NPM1, XRCC1, PARP1, FEN1, ARF6, POLD1, SRY, NCAPD2, NCAPH, SMC4 (normal) |
 |  |
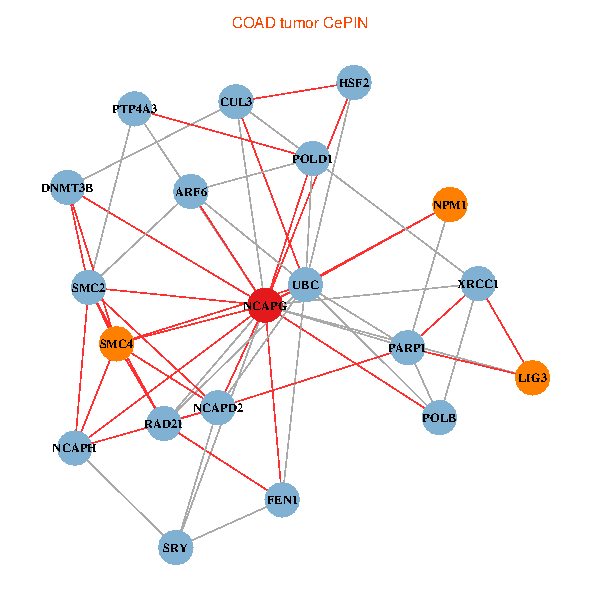
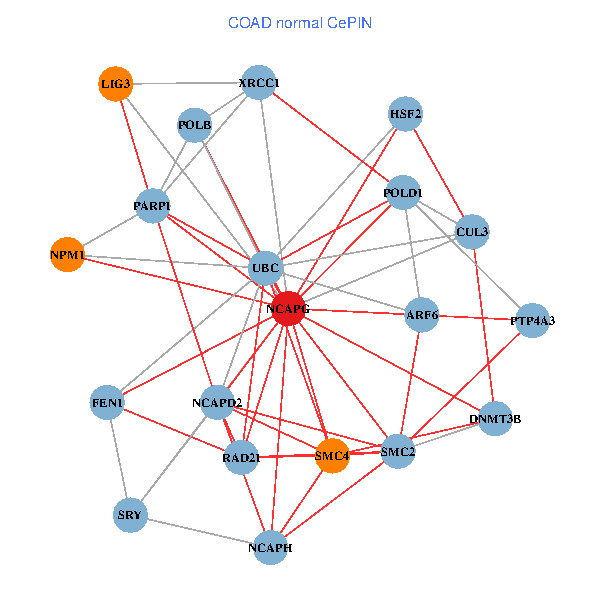
| COAD (tumor) | COAD (normal) |
| NCAPG, UBC, CUL3, POLB, SMC2, HSF2, DNMT3B, RAD21, LIG3, PTP4A3, NPM1, XRCC1, PARP1, FEN1, ARF6, POLD1, SRY, NCAPD2, NCAPH, SMC4 (tumor) | NCAPG, UBC, CUL3, POLB, SMC2, HSF2, DNMT3B, RAD21, LIG3, PTP4A3, NPM1, XRCC1, PARP1, FEN1, ARF6, POLD1, SRY, NCAPD2, NCAPH, SMC4 (normal) |
 |  |
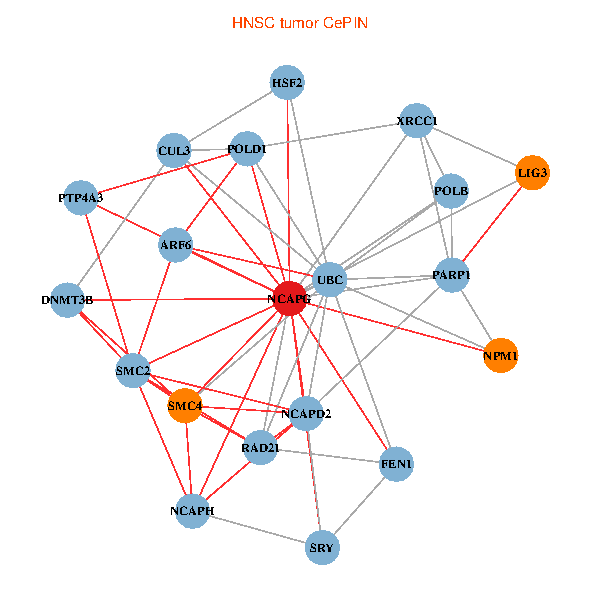
| HNSC (tumor) | HNSC (normal) |
| NCAPG, UBC, CUL3, POLB, SMC2, HSF2, DNMT3B, RAD21, LIG3, PTP4A3, NPM1, XRCC1, PARP1, FEN1, ARF6, POLD1, SRY, NCAPD2, NCAPH, SMC4 (tumor) | NCAPG, UBC, CUL3, POLB, SMC2, HSF2, DNMT3B, RAD21, LIG3, PTP4A3, NPM1, XRCC1, PARP1, FEN1, ARF6, POLD1, SRY, NCAPD2, NCAPH, SMC4 (normal) |
 |  |
| KICH (tumor) | KICH (normal) |
| NCAPG, UBC, CUL3, POLB, SMC2, HSF2, DNMT3B, RAD21, LIG3, PTP4A3, NPM1, XRCC1, PARP1, FEN1, ARF6, POLD1, SRY, NCAPD2, NCAPH, SMC4 (tumor) | NCAPG, UBC, CUL3, POLB, SMC2, HSF2, DNMT3B, RAD21, LIG3, PTP4A3, NPM1, XRCC1, PARP1, FEN1, ARF6, POLD1, SRY, NCAPD2, NCAPH, SMC4 (normal) |
 |  |
| KIRC (tumor) | KIRC (normal) |
| NCAPG, UBC, CUL3, POLB, SMC2, HSF2, DNMT3B, RAD21, LIG3, PTP4A3, NPM1, XRCC1, PARP1, FEN1, ARF6, POLD1, SRY, NCAPD2, NCAPH, SMC4 (tumor) | NCAPG, UBC, CUL3, POLB, SMC2, HSF2, DNMT3B, RAD21, LIG3, PTP4A3, NPM1, XRCC1, PARP1, FEN1, ARF6, POLD1, SRY, NCAPD2, NCAPH, SMC4 (normal) |
 |  |
| KIRP (tumor) | KIRP (normal) |
| NCAPG, UBC, CUL3, POLB, SMC2, HSF2, DNMT3B, RAD21, LIG3, PTP4A3, NPM1, XRCC1, PARP1, FEN1, ARF6, POLD1, SRY, NCAPD2, NCAPH, SMC4 (tumor) | NCAPG, UBC, CUL3, POLB, SMC2, HSF2, DNMT3B, RAD21, LIG3, PTP4A3, NPM1, XRCC1, PARP1, FEN1, ARF6, POLD1, SRY, NCAPD2, NCAPH, SMC4 (normal) |
 |  |
| LIHC (tumor) | LIHC (normal) |
| NCAPG, UBC, CUL3, POLB, SMC2, HSF2, DNMT3B, RAD21, LIG3, PTP4A3, NPM1, XRCC1, PARP1, FEN1, ARF6, POLD1, SRY, NCAPD2, NCAPH, SMC4 (tumor) | NCAPG, UBC, CUL3, POLB, SMC2, HSF2, DNMT3B, RAD21, LIG3, PTP4A3, NPM1, XRCC1, PARP1, FEN1, ARF6, POLD1, SRY, NCAPD2, NCAPH, SMC4 (normal) |
 |  |
| LUAD (tumor) | LUAD (normal) |
| NCAPG, UBC, CUL3, POLB, SMC2, HSF2, DNMT3B, RAD21, LIG3, PTP4A3, NPM1, XRCC1, PARP1, FEN1, ARF6, POLD1, SRY, NCAPD2, NCAPH, SMC4 (tumor) | NCAPG, UBC, CUL3, POLB, SMC2, HSF2, DNMT3B, RAD21, LIG3, PTP4A3, NPM1, XRCC1, PARP1, FEN1, ARF6, POLD1, SRY, NCAPD2, NCAPH, SMC4 (normal) |
 |  |
| LUSC (tumor) | LUSC (normal) |
| NCAPG, UBC, CUL3, POLB, SMC2, HSF2, DNMT3B, RAD21, LIG3, PTP4A3, NPM1, XRCC1, PARP1, FEN1, ARF6, POLD1, SRY, NCAPD2, NCAPH, SMC4 (tumor) | NCAPG, UBC, CUL3, POLB, SMC2, HSF2, DNMT3B, RAD21, LIG3, PTP4A3, NPM1, XRCC1, PARP1, FEN1, ARF6, POLD1, SRY, NCAPD2, NCAPH, SMC4 (normal) |
 |  |
| PRAD (tumor) | PRAD (normal) |
| NCAPG, UBC, CUL3, POLB, SMC2, HSF2, DNMT3B, RAD21, LIG3, PTP4A3, NPM1, XRCC1, PARP1, FEN1, ARF6, POLD1, SRY, NCAPD2, NCAPH, SMC4 (tumor) | NCAPG, UBC, CUL3, POLB, SMC2, HSF2, DNMT3B, RAD21, LIG3, PTP4A3, NPM1, XRCC1, PARP1, FEN1, ARF6, POLD1, SRY, NCAPD2, NCAPH, SMC4 (normal) |
 |  |
| STAD (tumor) | STAD (normal) |
| NCAPG, UBC, CUL3, POLB, SMC2, HSF2, DNMT3B, RAD21, LIG3, PTP4A3, NPM1, XRCC1, PARP1, FEN1, ARF6, POLD1, SRY, NCAPD2, NCAPH, SMC4 (tumor) | NCAPG, UBC, CUL3, POLB, SMC2, HSF2, DNMT3B, RAD21, LIG3, PTP4A3, NPM1, XRCC1, PARP1, FEN1, ARF6, POLD1, SRY, NCAPD2, NCAPH, SMC4 (normal) |
 |  |
| THCA (tumor) | THCA (normal) |
| NCAPG, UBC, CUL3, POLB, SMC2, HSF2, DNMT3B, RAD21, LIG3, PTP4A3, NPM1, XRCC1, PARP1, FEN1, ARF6, POLD1, SRY, NCAPD2, NCAPH, SMC4 (tumor) | NCAPG, UBC, CUL3, POLB, SMC2, HSF2, DNMT3B, RAD21, LIG3, PTP4A3, NPM1, XRCC1, PARP1, FEN1, ARF6, POLD1, SRY, NCAPD2, NCAPH, SMC4 (normal) |
 |  |
| Top |
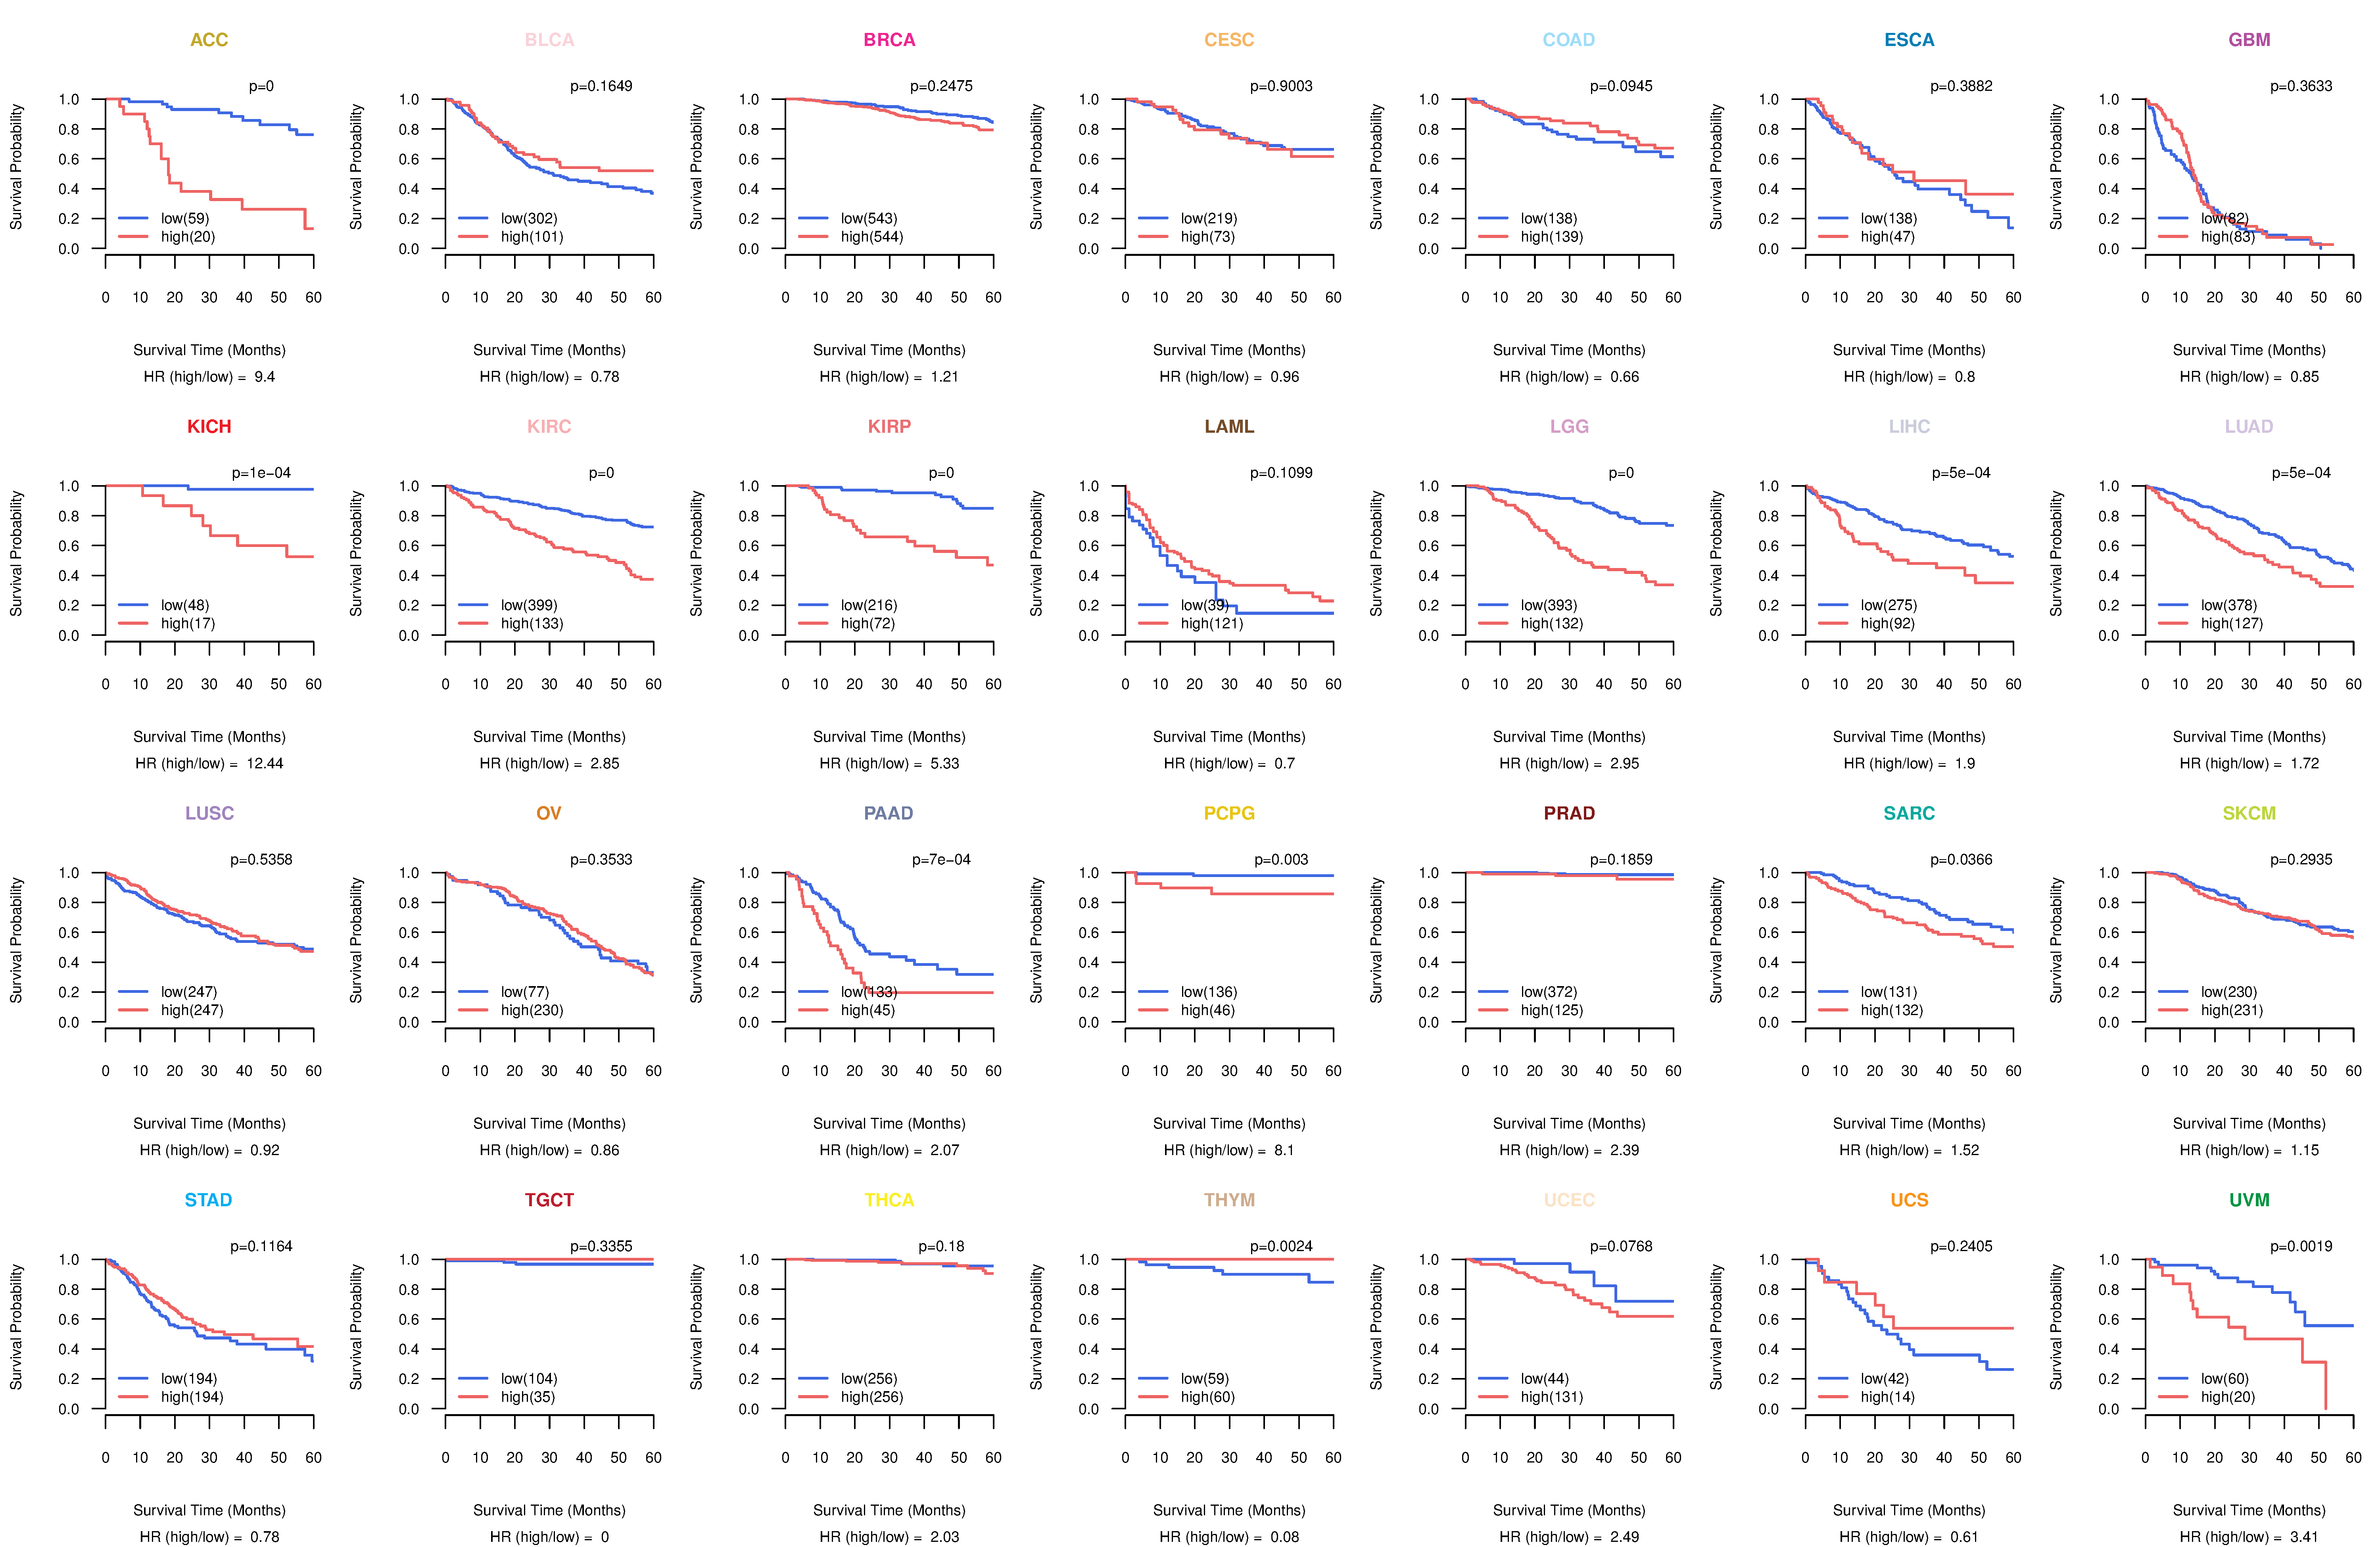
| TissGeneProg for NCAPG |
| Kaplan-Meier plots with logrank tests of overall survival (OS) using 28 cancer types (TCGA IlluminaHiSeq_RNASeqV2, pan-cancer normalized log2(norm_counts+1) data, version 2016-08-16) (TCGA clinicalMatrix, phenotype data, version 2016-04-27) * Click on the image to enlarge it in a new window. |
 |
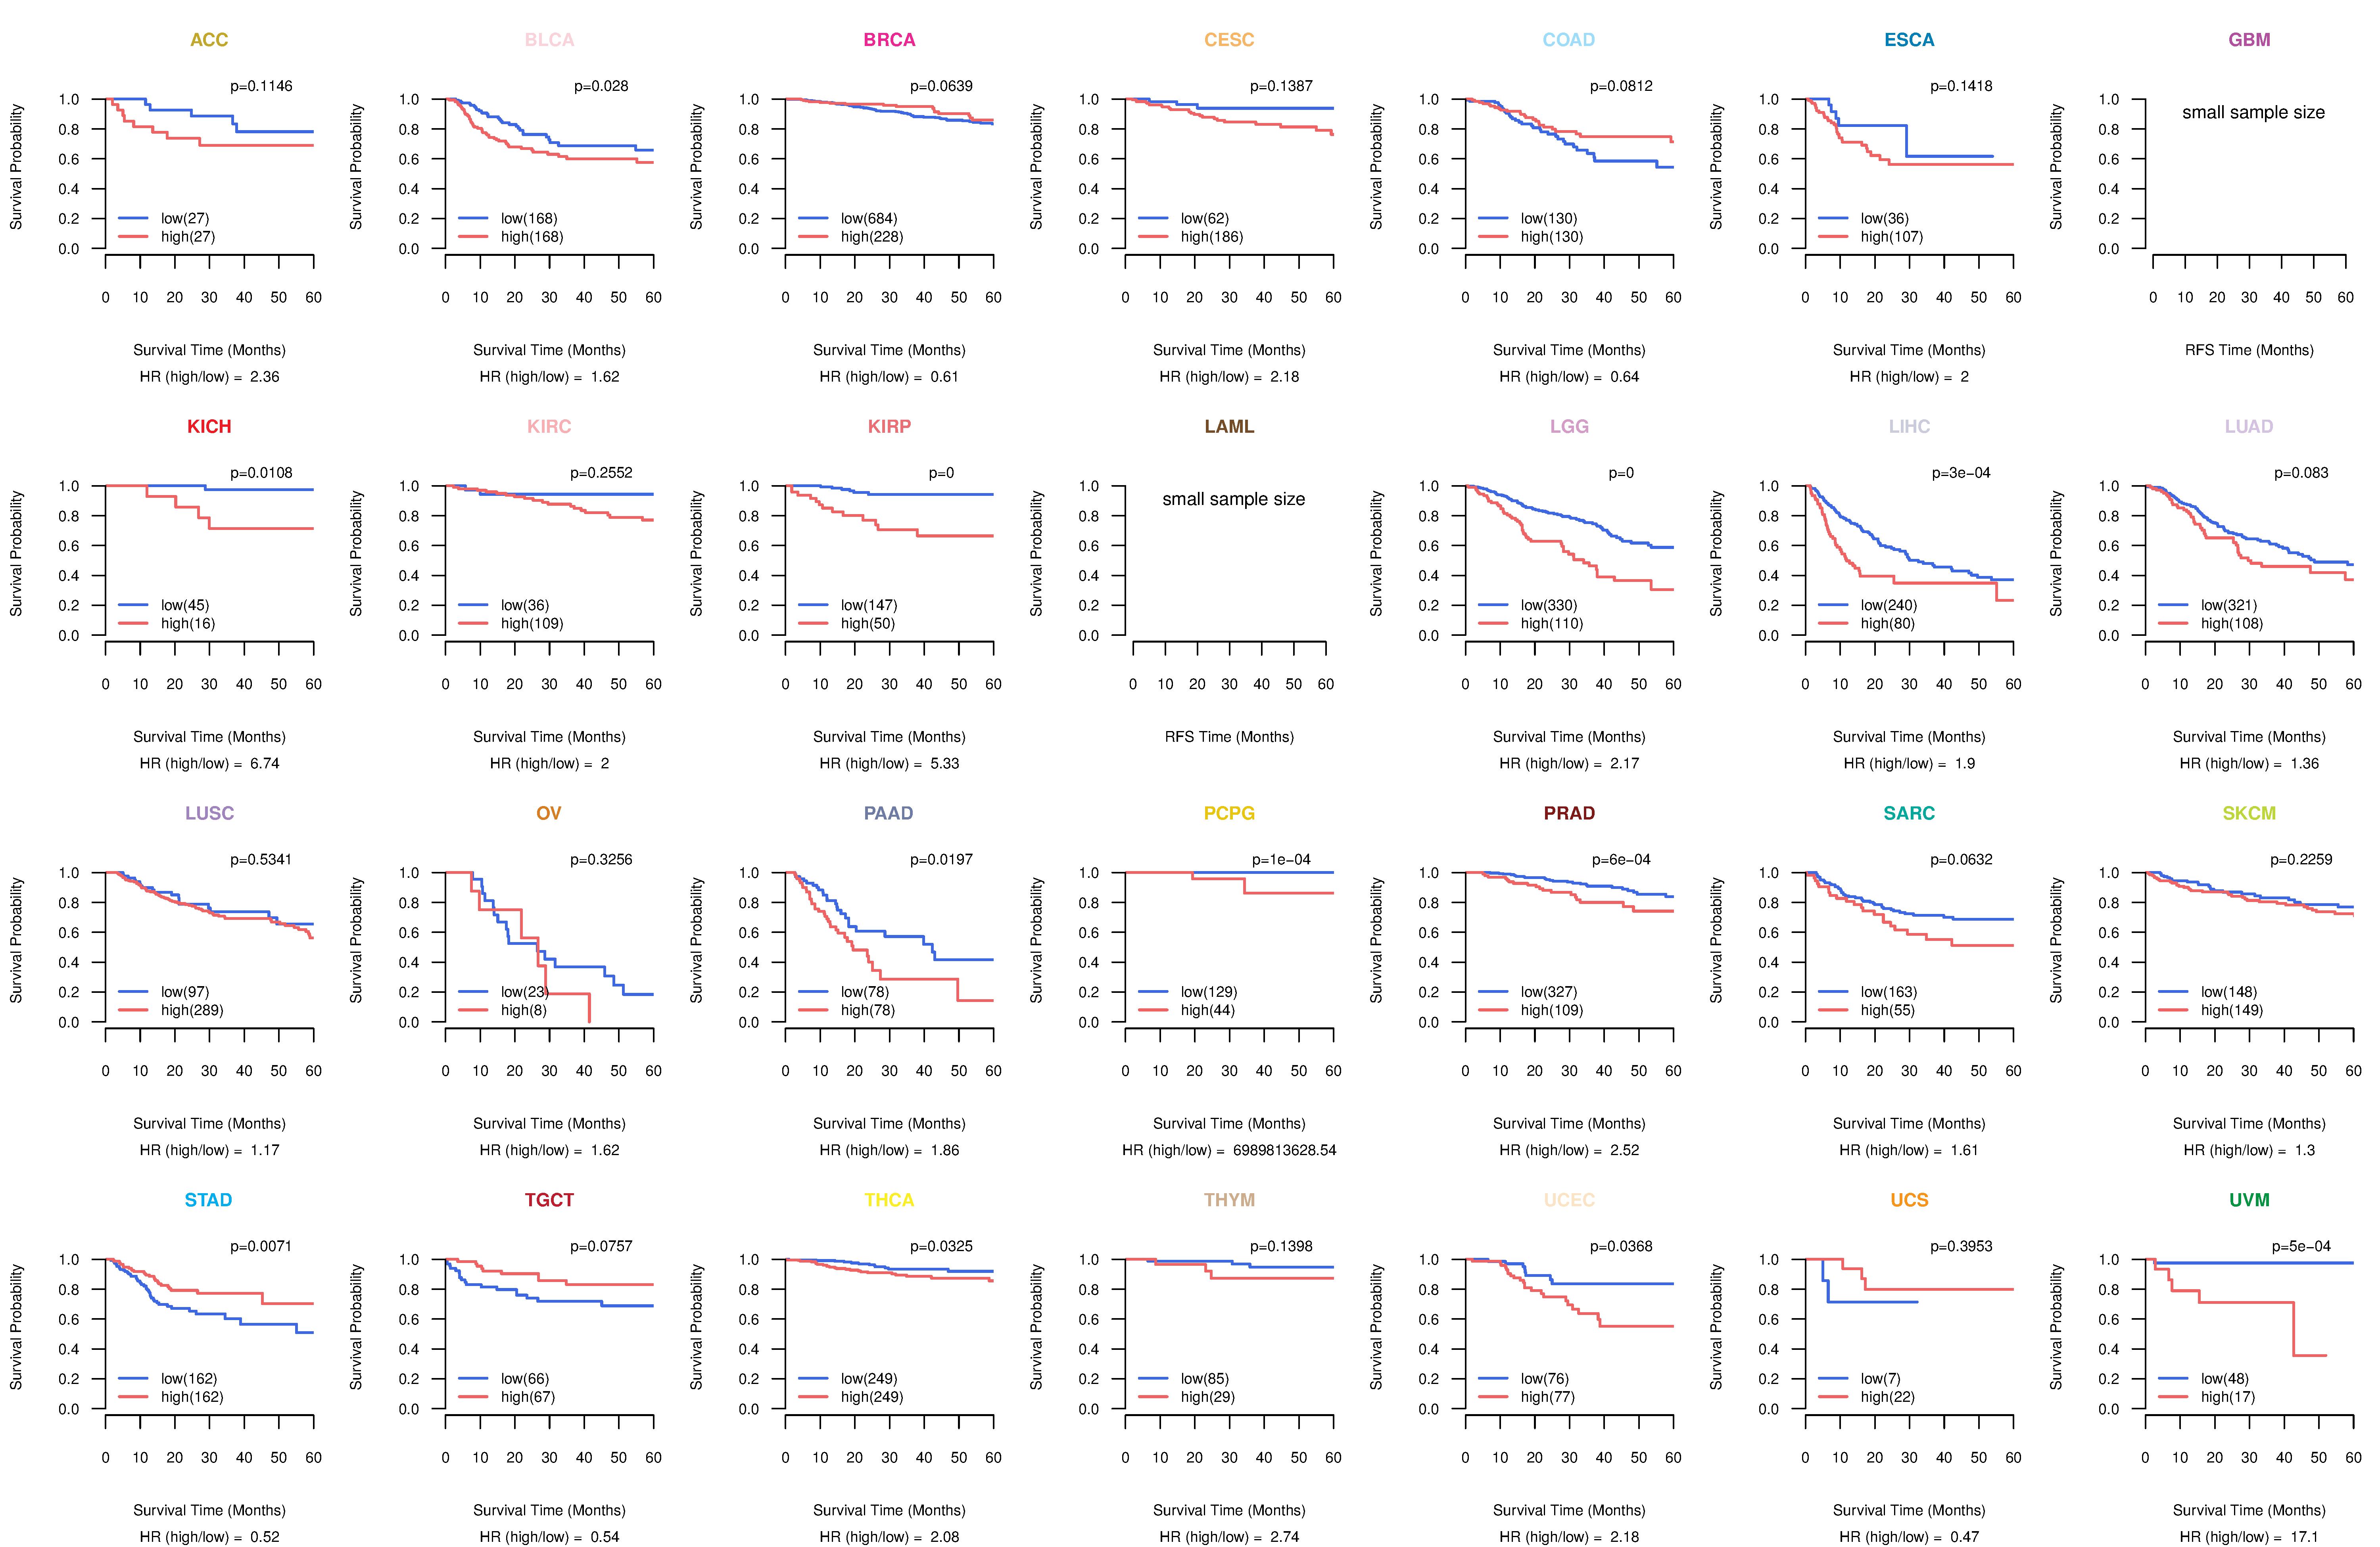
| Kaplan-Meier plots with logrank test of relapse free survival (RFS) using 28 cancer types (TCGA IlluminaHiSeq_RNASeqV2, pan-cancer normalized log2(norm_counts+1) data, version 2016-08-16) (TCGA clinicalMatrix, phenotype data, version 2016-04-27) * Click on the image enlarge it in a new window. |
 |
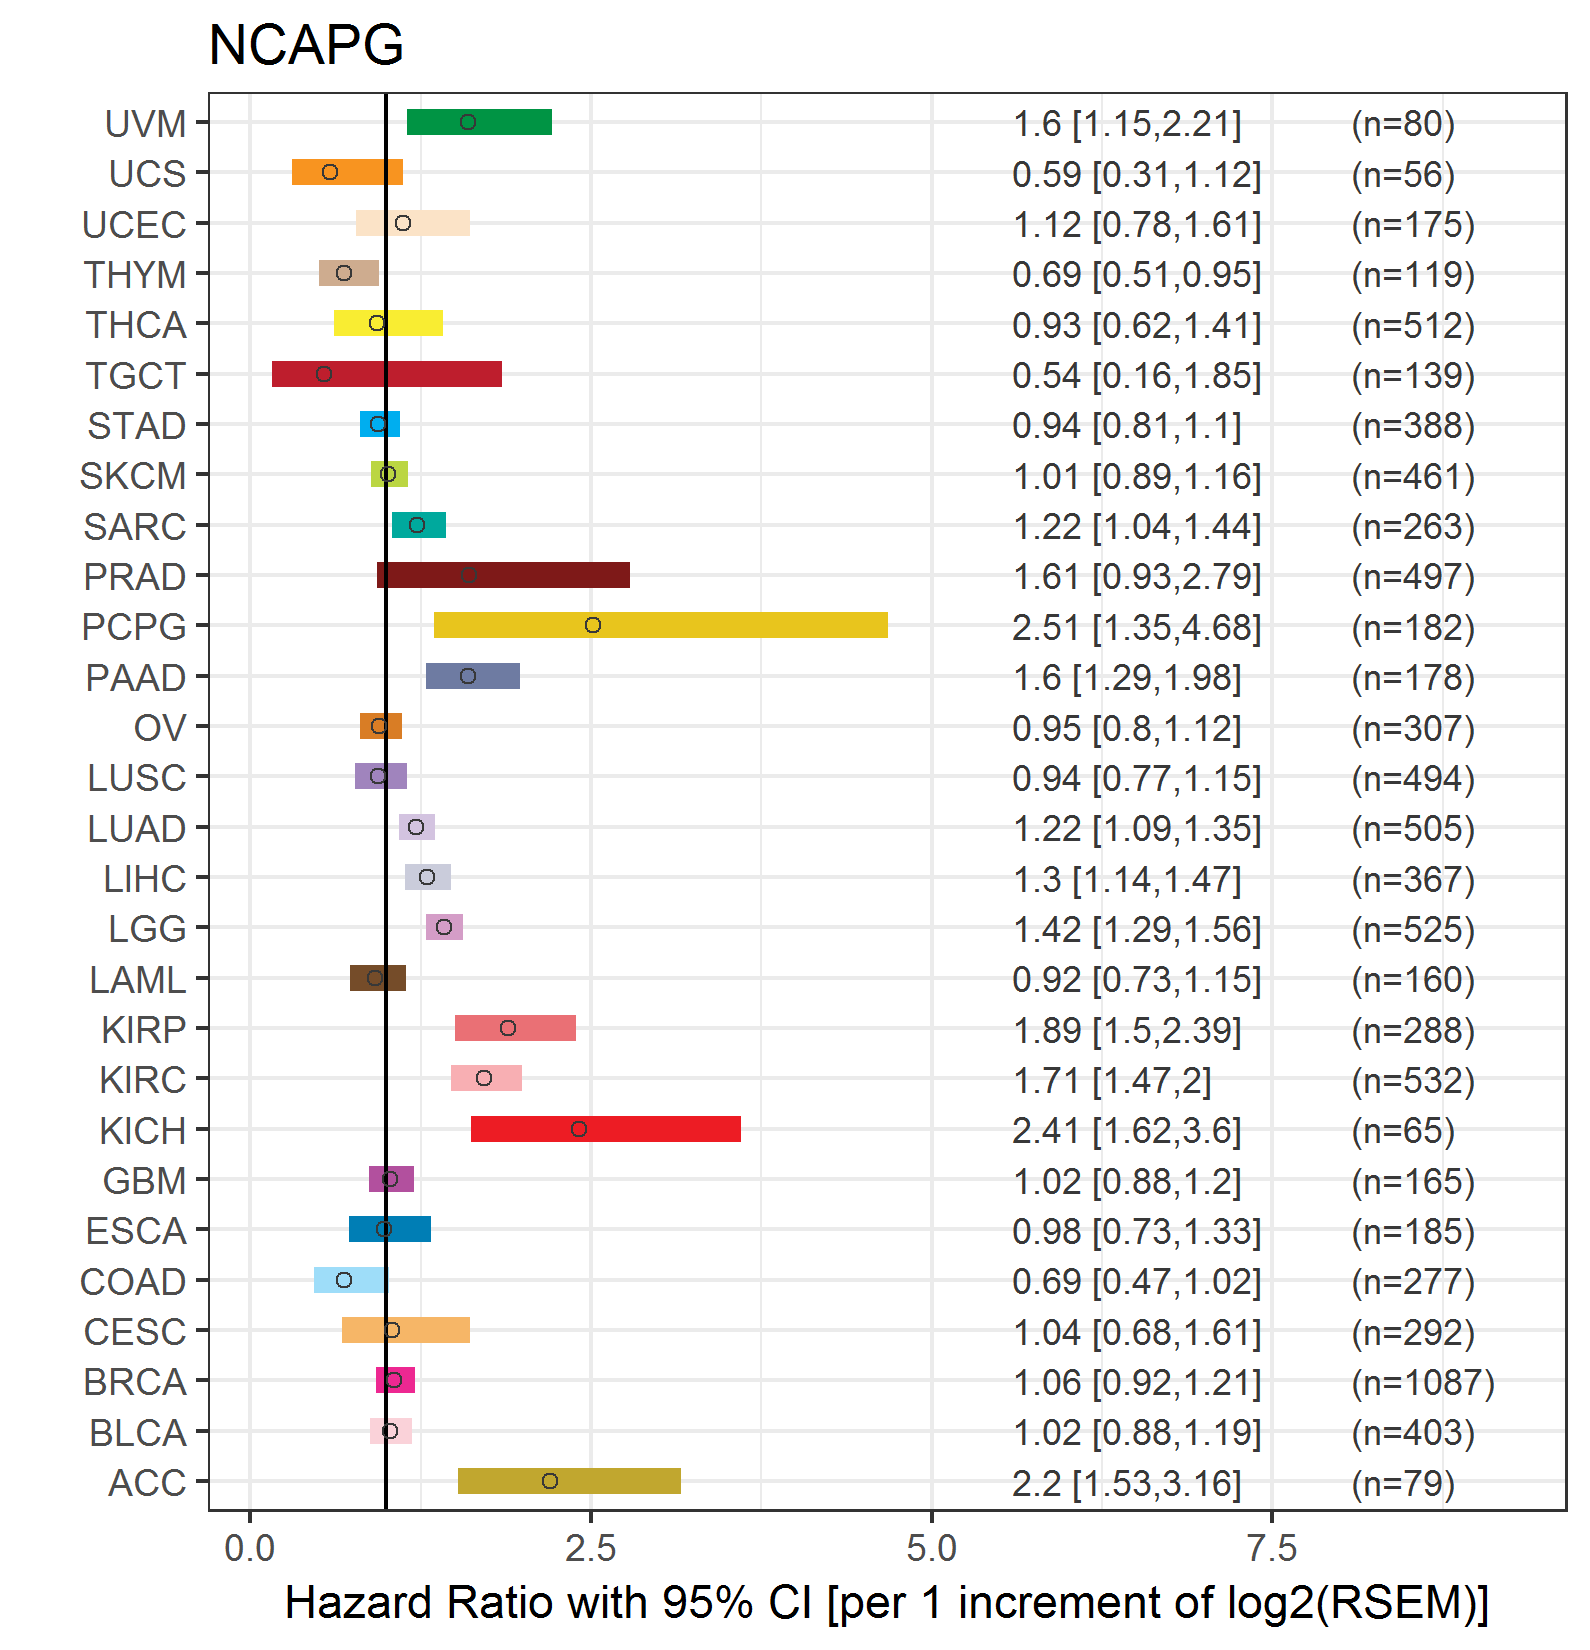
| Forest plot of Cox proportional hazard ratio (HR) and 95% CI of overall survival (OS) using 28 cancer types (TCGA IlluminaHiSeq_RNASeqV2, pan-cancer normalized log2(norm_counts+1) data, version 2016-08-16) (TCGA clinicalMatrix, phenotype data, version 2016-04-27) * Click on the image enlarge it in a new window. |
 |
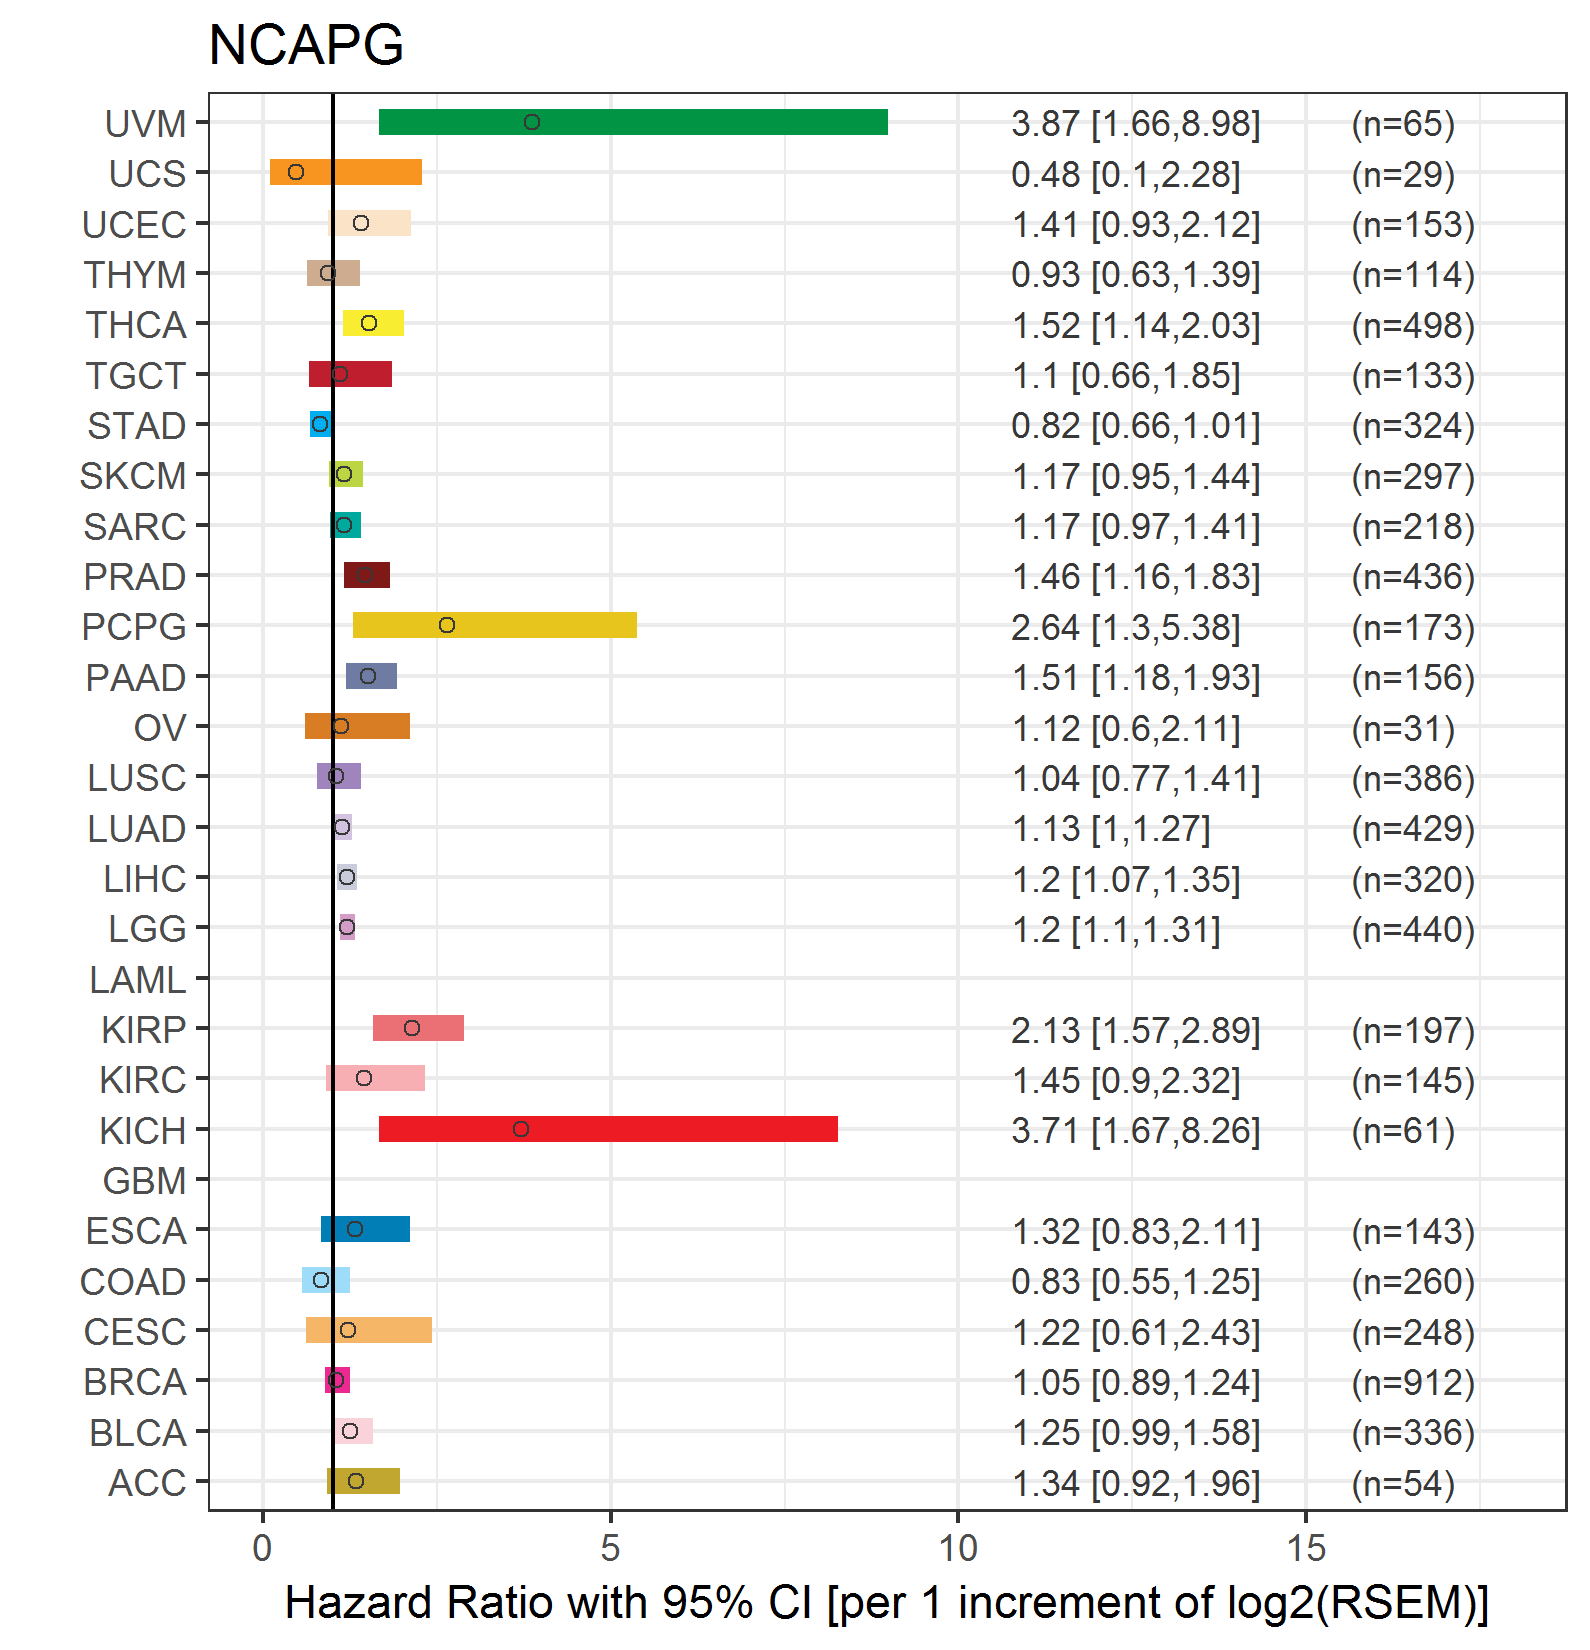
| Forest plot of Cox proportional hazard ratio (HR) and 95% CI of relapse free survival (RFS) using 28 cancer types (TCGA IlluminaHiSeq_RNASeqV2, pan-cancer normalized log2(norm_counts+1) data, version 2016-08-16) (TCGA clinicalMatrix, phenotype data, version 2016-04-27) * Click on the image enlarge it in a new window. |
 |
| Top |
| TissGeneClin for NCAPG |
| TissGeneDrug for NCAPG |
| Drug information targeting TissGene (DrugBank Version 5.0.6, 2017-04-01) |
| DrugBank ID | Drug name | Drug activity | Drug type | Drug status |
| Top |
| TissGeneDisease for NCAPG |
| Disease information associated with TissGene (DisGeNet, 2016-06-01) |
| Disease ID | Disease name | # pubmeds | Source |
| umls:C0001418 | Adenocarcinoma | 1 | BeFree |
| umls:C0006142 | Malignant neoplasm of breast | 1 | BeFree |
| umls:C0017661 | IGA Glomerulonephritis | 1 | CTD_human |
| umls:C0020443 | Hypercholesterolemia | 1 | BeFree |
| umls:C0025202 | melanoma | 1 | BeFree |
| umls:C0027627 | Neoplasm Metastasis | 1 | BeFree |
| umls:C0031117 | Peripheral Neuropathy | 1 | BeFree |
| umls:C0678222 | Breast Carcinoma | 1 | BeFree |
| umls:C2986665 | Early-Stage Breast Carcinoma | 1 | BeFree |
|
Copyright 2016-Present - The University of Texas Health Science Center at Houston (UTHealth) Web File Viewing | How to Report, Fraud, Waste and Abuse | State of Texas | Statewide Search | Texas Homeland Security | Site Policies |