 |
| |
| |
| |
| |
| |
| |
|

| TissGeneSummary for PGA3 |
 Gene summary Gene summary |
| Basic gene information | Gene symbol | PGA3 |
| Gene name | pepsinogen 3, group I (pepsinogen A) | |
| Synonyms | - | |
| Cytomap | UCSC genome browser: 11q12.2 | |
| Type of gene | protein-coding | |
| RefGenes | NM_001079807.2, | |
| Description | pepsin Apepsin A-3pepsinogen A3pepsinogen-3 | |
| Modification date | 20141207 | |
| dbXrefs | MIM : 169710 | |
| HGNC : HGNC | ||
| Protein | UniProt: go to UniProt's Cross Reference DB Table | |
| Expression | CleanEX: HS_PGA3 | |
| BioGPS: 643834 | ||
| Pathway | NCI Pathway Interaction Database: PGA3 | |
| KEGG: PGA3 | ||
| REACTOME: PGA3 | ||
| Pathway Commons: PGA3 | ||
| Context | iHOP: PGA3 | |
| ligand binding site mutation search in PubMed: PGA3 | ||
| UCL Cancer Institute: PGA3 | ||
| Assigned class in TissGDB* | C | |
| Included tissue-specific gene expression resources | HPA,GTEx | |
| Specific-tissues in normal samples (assigned by TissGDB using HPA, TiGER, and GTEx) | Stomach | |
| Cancer types related to the specific-tissues in cancer samples (assigned by TissGDB using TCGA) | STAD | |
| Reference showing the relevant tissue of PGA3 | ||
| Description by TissGene annotations | Fused withTSGene | |
| * Class A consists of genes with literature evidence and is part of the cTissGenes. Class B consists of only cTissGenes without additional evidence. The remaining genes belong to Class C. |
| Gene ontology having evidence of Inferred from Direct Assay (IDA) from Entrez |
| GO ID | GO term | PubMed ID |
| Top |
| TissGeneExp for PGA3 |
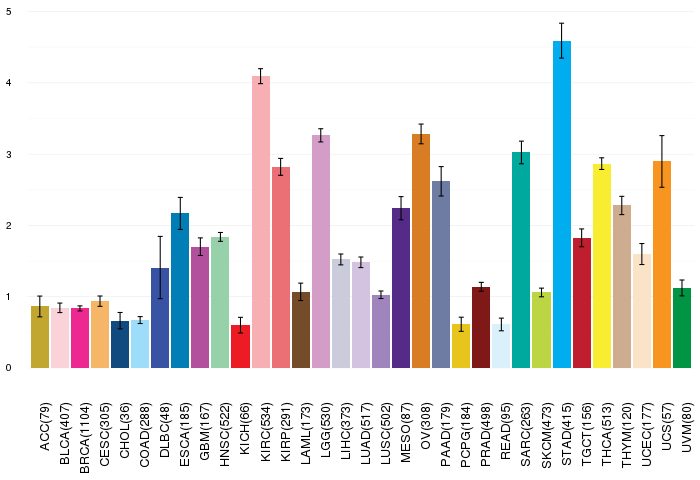
| Gene expressions across 28 cancer types (X-axis: cancer type and Y-axis: log2(norm_counts+1)) (TCGA IlluminaHiSeq_RNASeqV2, pan-cancer normalized log2(norm_counts+1) data, version 2016-08-16) |
 |
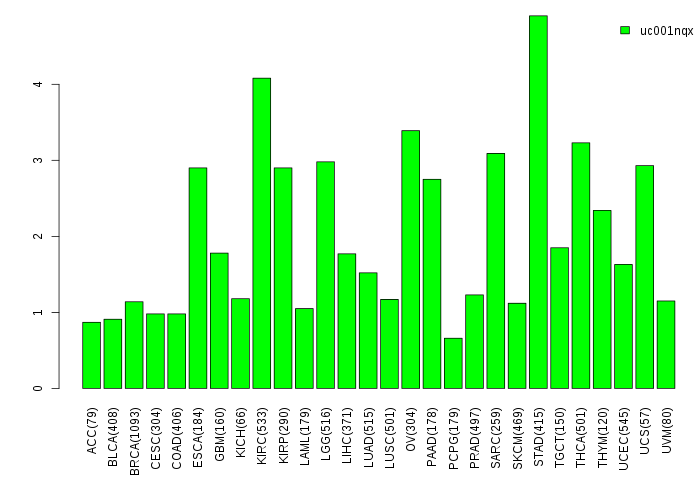
| Gene isoform expressions across 28 cancer types (X-axis: cancer type and Y-axis: log2(norm_counts+1)) (TCGA pan-cancer tcga_rsem_isoform_tpm, version 2016-09-01) |
 |
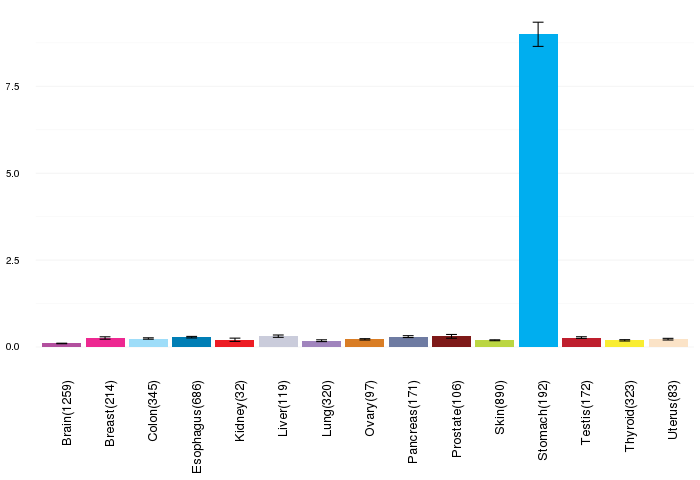
| Gene expressions across normal tissues of GTEx data (GTEx GTEx_Analysis_v6_RNA-seq_RNA-SeQCv1.1.8_gene_rpkm.gct) - Here, we shows the matched tissue types only among our 28 cancer types. |
 |
| Different expressions across 14 cancer types with more than 10 samples between matched tumors and normals (X-axis: cancer type and Y-axis: log2(norm_counts+1)) (TCGA IlluminaHiSeq_RNASeqV2, pan-cancer normalized log2(norm_counts+1) data, version 2016-08-16) |
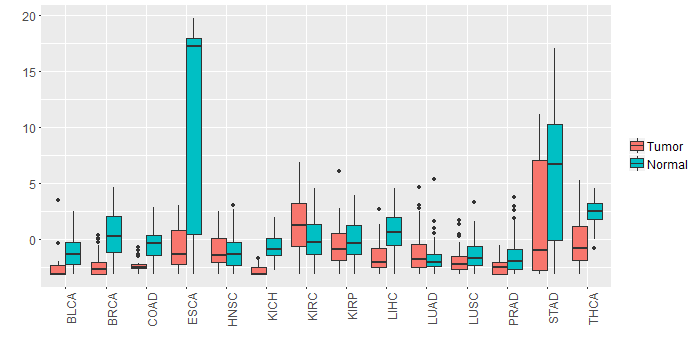 |
| - Significantly differentially expressed cancer types and information. (|Fold change|>1 and FDR<0.05) |
| Cancer type | Mean(exp) in tumor | Mean(exp) in matched normal | Log2FC | P-val. | FDR |
| KICH | -2.755077993 | -0.645025993 | -2.110052 | 1.16E-07 | 5.27E-07 |
| BRCA | -2.420917747 | 0.496193656 | -2.917111404 | 2.37E-29 | 2.98E-28 |
| COAD | -2.312665993 | -0.216650608 | -2.096015385 | 3.27E-07 | 2.06E-06 |
| LIHC | -1.609163993 | 0.611514007 | -2.220678 | 1.25E-10 | 1.61E-09 |
| THCA | -0.305301586 | 2.453106888 | -2.758408475 | 1.04E-15 | 1.52E-14 |
| ESCA | -0.712665993 | 10.71918855 | -11.43185455 | 0.00269 | 0.026927354 |
| STAD | 1.733690257 | 5.786840257 | -4.05315 | 0.0063 | 0.023419339 |
| KIRC | 1.163624285 | -0.080975715 | 1.2446 | 0.000569 | 0.001098302 |
| Top |
| TissGene-miRNA for PGA3 |
| Significantly anti-correlated miRNAs of TissGene across 28 cancer types (Gene-miRNA relations from TargetScanHuman Relsease 7.1, Conserved_Site_Context_Scores.txt.zip, 06.01.2016) (TCGA IlluminaHiSeq_miRNASeq, log2(RPM+1) data, version 2016-11-21) (TCGA IlluminaHiSeq_RNASeqV2, log2(normalized_count+1) data, version 2016-08-16) (Spearman’s Rank Correlation (p-value<0.05 and coefficient<-0.25)) |
| Cancer type | miRNA id | miRNA accession | P-val. | Coeff. | # samples |
| Top |
| TissGeneMut for PGA3 |
| TissGeneSNV for PGA3 |
| nsSNV counts per each loci. Different colors of circles represent different cancer types. Circle size denotes number of samples. (TCGA somatic mutation (SNPs and small INDELs) data, version 2016-04-25) * Click on the image to enlarge it in a new window. |
 |
 |
| Somatic nucleotide variants of TissGene across 28 cancer types (X-axis: cancer type and Y-axis: % of mutated samples) The numbers in parentheses are numbers of samples with mutation (nsSNVs). (TCGA somatic mutation (SNPs and small INDELs) data, version 2016-04-25) |
 |
| - nsSNVs sorted by frequency. |
| AAchange | Cancer type | # samples |
| p.M142V | KIRP | 1 |
| p.S13F | HNSC | 1 |
| p.P67T | LUAD | 1 |
| p.Y71N | STAD | 1 |
| p.T143I | BRCA | 1 |
| p.P67L | SKCM | 1 |
| p.L12I | TGCT | 1 |
| p.G8R | LUSC | 1 |
| p.D64H | BLCA | 1 |
| Top |
| TissGeneCNV for PGA3 |
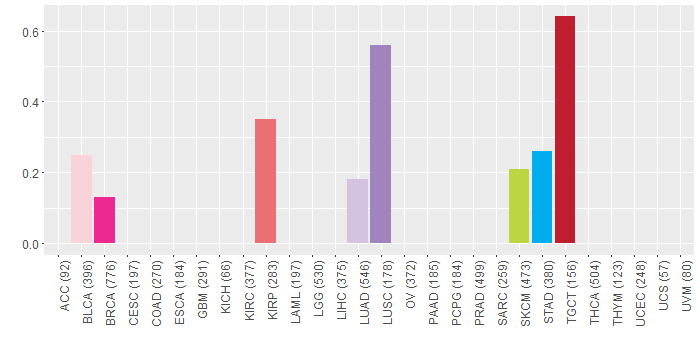
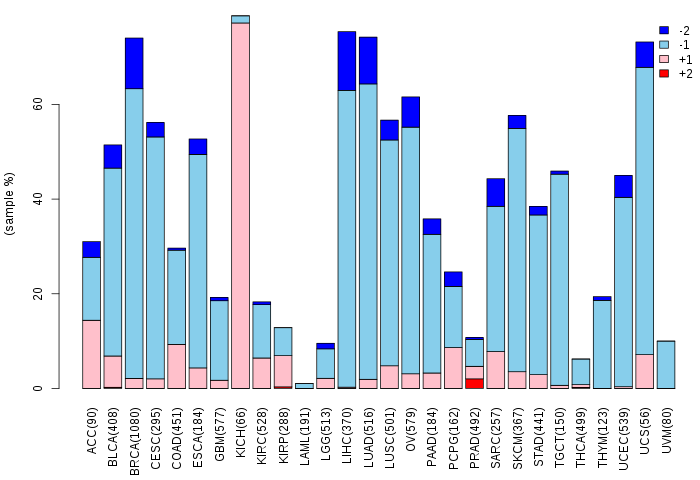
| Copy number variations of TissGene across 28 cancer types (X-axis: cancer type and Y-axis: % of CNV samples) (TCGA Gistic2_CopyNumber_Gistic2_all_data_by_genes, Gistic2 copy number data, version 2016-08-16) |
 |
| Top |
| TissGeneFusions for PGA3 |
| Fusion genes including TissGene (ChimerDB 3.0, 2016-12-01 and TCGA fusion Portal 2015-12-01) |
| Database | Src | Cancer type | Sample | Fusion gene | ORF | 5'-gene BP | 3'-gene BP |
| Chimerdb3.0 | ChiTaRs | NA | BP342282 | HDAC1-PGA3 | chr1:32792661 | chr11:60980279 | |
| Chimerdb3.0 | ChiTaRs | NA | DA968334 | PHF20L1-PGA3 | chr8:133858667 | chr11:60970987 | |
| Chimerdb3.0 | ChiTaRs | NA | BP342773 | RAPGEF4-PGA3 | chr2:173832125 | chr11:60971045 | |
| Chimerdb3.0 | ChiTaRs | NA | AK098500 | ARMC8-PGA3 | chr3:137965314 | chr11:60980265 | |
| Chimerdb3.0 | FusionScan | BRCA | TCGA-LL-A6FQ-01A | PLCB3-PGA3 | In-Frame | chr11:64023088 | chr11:60975762 |
| Chimerdb3.0 | FusionScan | ESCA | TCGA-L5-A4OJ-11A | PGA3-CTSE | In-Frame | chr11:60978907 | chr1:206331020 |
| Chimerdb3.0 | FusionScan | ESCA | TCGA-L5-A43C-11A | PGA3-PGC | In-Frame | chr11:60971741 | chr6:41705566 |
| Chimerdb3.0 | FusionScan | ESCA | TCGA-L5-A43C-11A | PGA3-PGC | In-Frame | chr11:60974099 | chr6:41711127 |
| Chimerdb3.0 | FusionScan | ESCA | TCGA-L5-A43C-11A | PGA3-PGC | In-Frame | chr11:60971741 | chr6:41712252 |
| Top |
| TissGeneNet for PGA3 |
| Co-expressed gene networks based on protein-protein interaction data (CePIN) (TCGA IlluminaHiSeq_RNASeqV2, pan-cancer normalized log2(norm_counts+1) data, version 2016-08-16) (PINA2 ppi data) |
| Top |
| TissGeneProg for PGA3 |
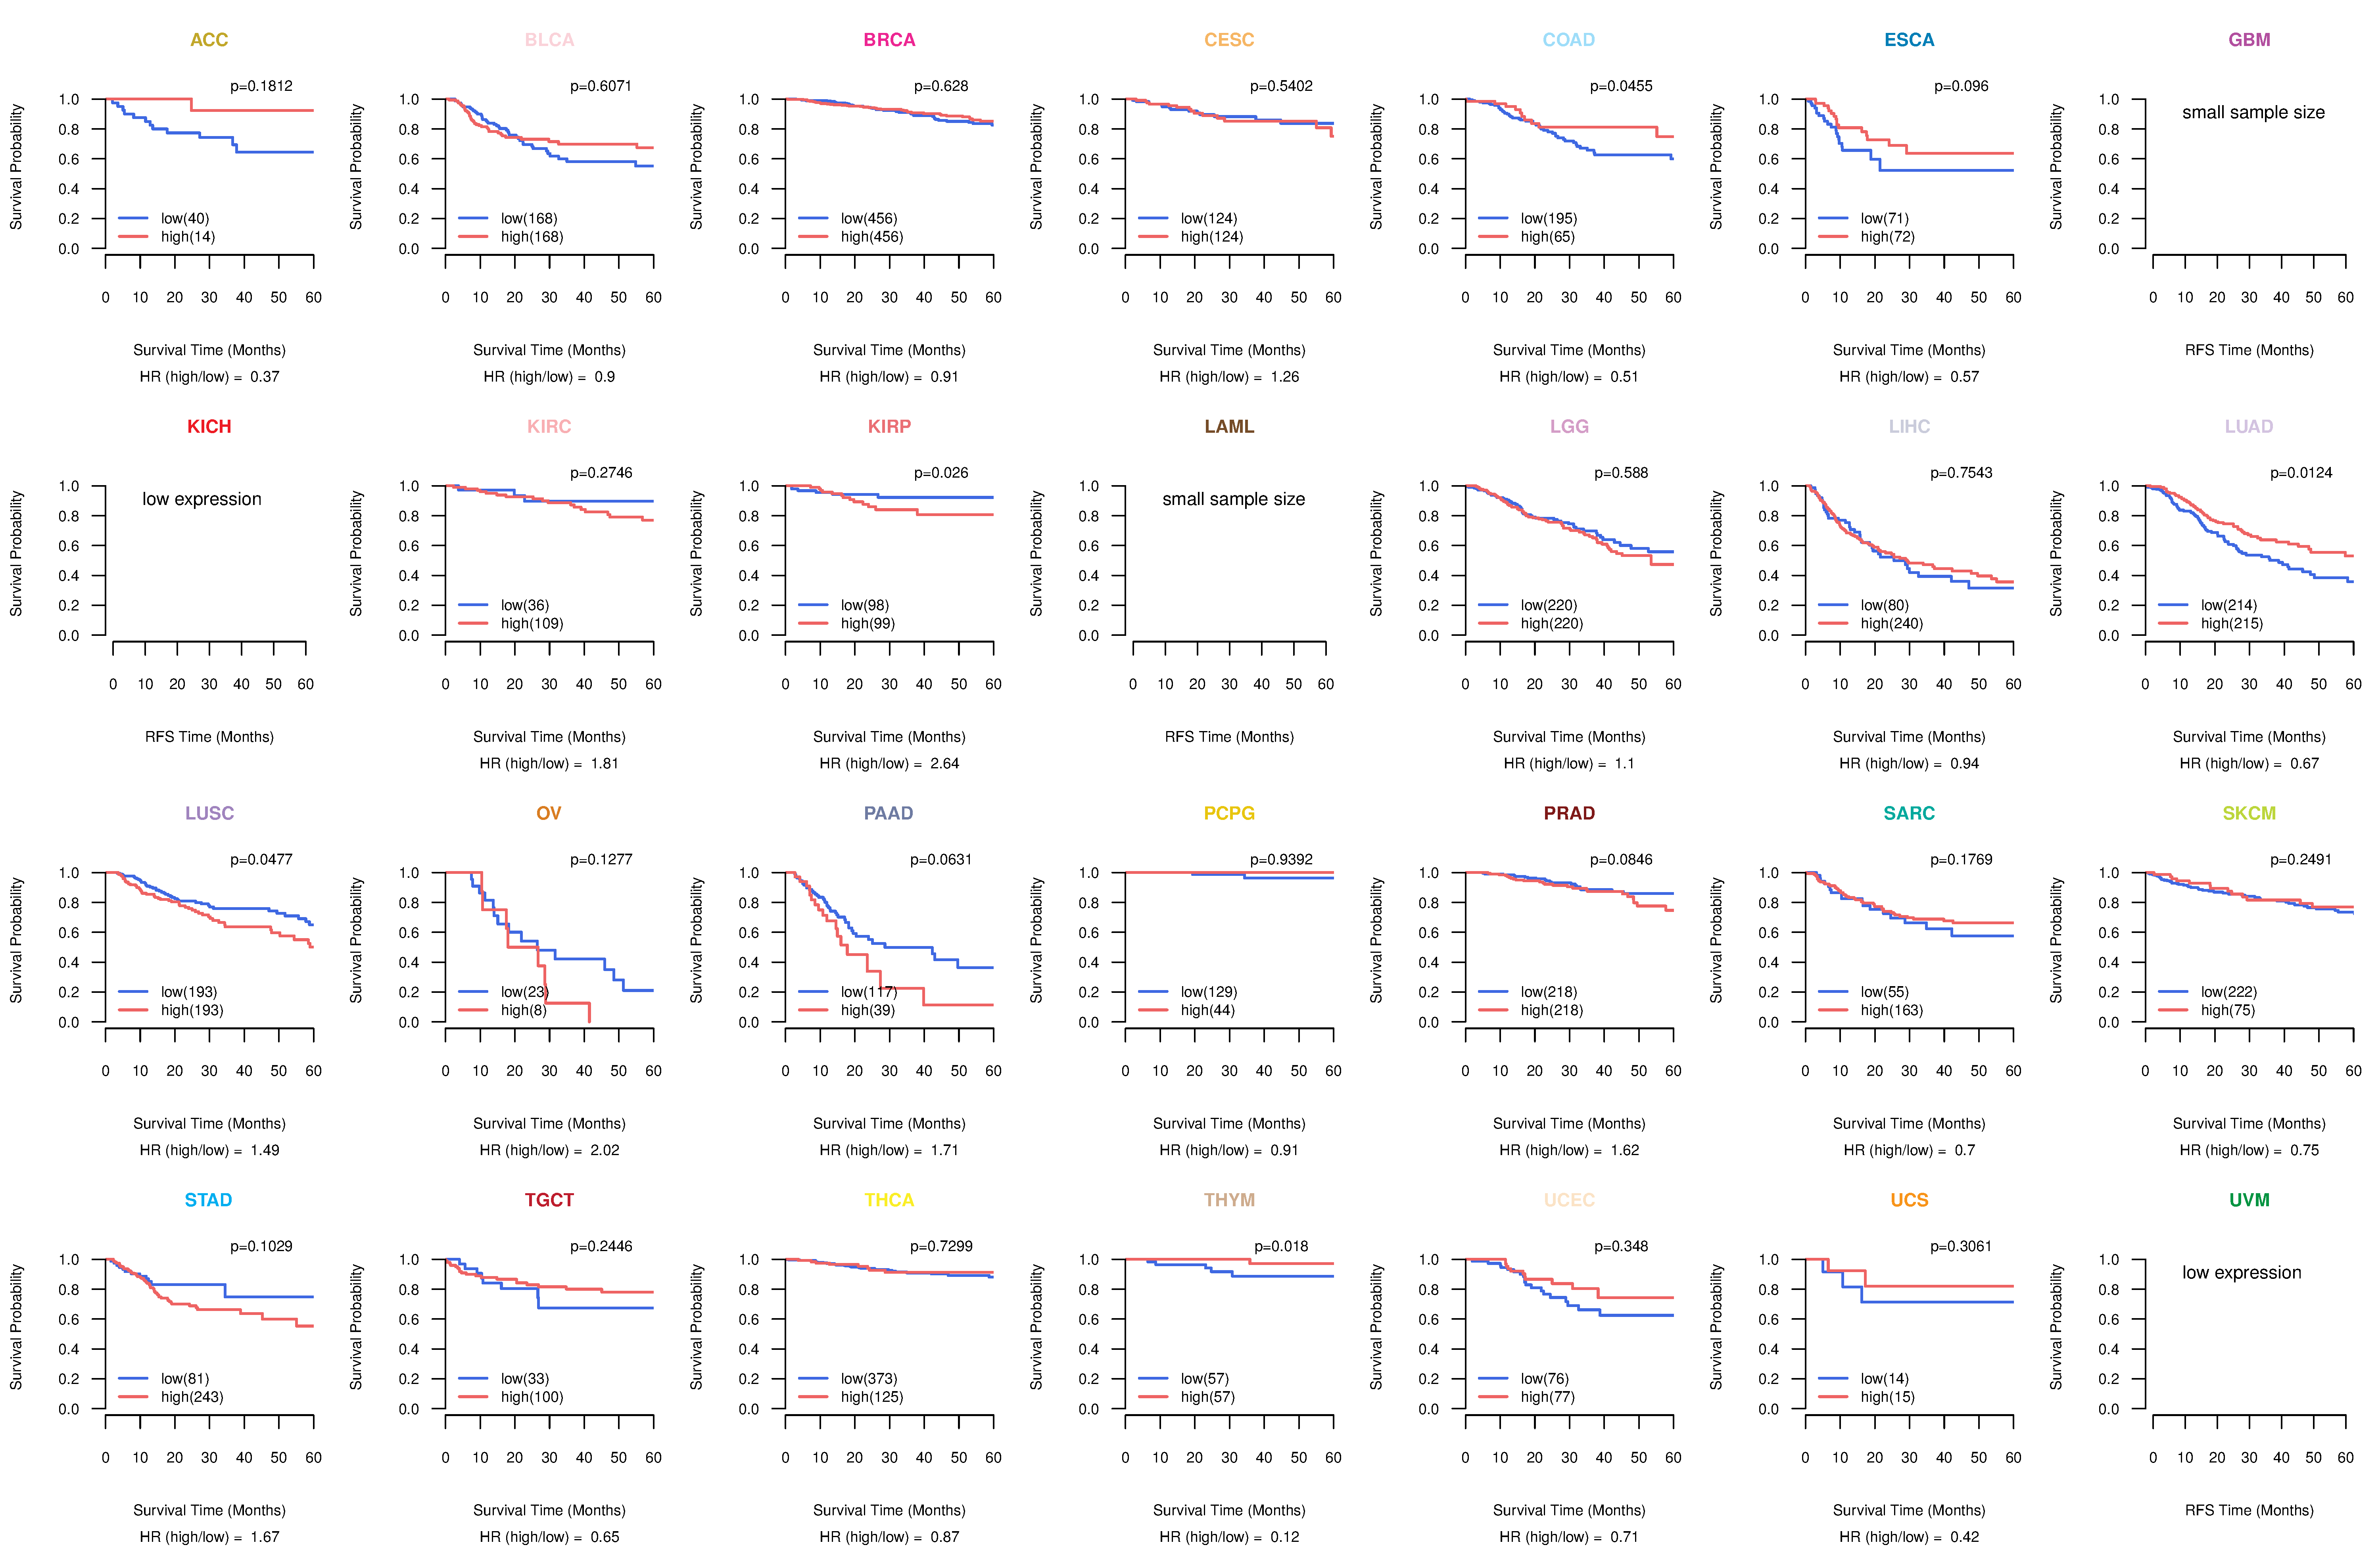
| Kaplan-Meier plots with logrank tests of overall survival (OS) using 28 cancer types (TCGA IlluminaHiSeq_RNASeqV2, pan-cancer normalized log2(norm_counts+1) data, version 2016-08-16) (TCGA clinicalMatrix, phenotype data, version 2016-04-27) * Click on the image to enlarge it in a new window. |
 |
| Kaplan-Meier plots with logrank test of relapse free survival (RFS) using 28 cancer types (TCGA IlluminaHiSeq_RNASeqV2, pan-cancer normalized log2(norm_counts+1) data, version 2016-08-16) (TCGA clinicalMatrix, phenotype data, version 2016-04-27) * Click on the image enlarge it in a new window. |
 |
| Forest plot of Cox proportional hazard ratio (HR) and 95% CI of overall survival (OS) using 28 cancer types (TCGA IlluminaHiSeq_RNASeqV2, pan-cancer normalized log2(norm_counts+1) data, version 2016-08-16) (TCGA clinicalMatrix, phenotype data, version 2016-04-27) * Click on the image enlarge it in a new window. |
 |
| Forest plot of Cox proportional hazard ratio (HR) and 95% CI of relapse free survival (RFS) using 28 cancer types (TCGA IlluminaHiSeq_RNASeqV2, pan-cancer normalized log2(norm_counts+1) data, version 2016-08-16) (TCGA clinicalMatrix, phenotype data, version 2016-04-27) * Click on the image enlarge it in a new window. |
 |
| Top |
| TissGeneClin for PGA3 |
| TissGeneDrug for PGA3 |
| Drug information targeting TissGene (DrugBank Version 5.0.6, 2017-04-01) |
| DrugBank ID | Drug name | Drug activity | Drug type | Drug status |
| Top |
| TissGeneDisease for PGA3 |
| Disease information associated with TissGene (DisGeNet, 2016-06-01) |
| Disease ID | Disease name | # pubmeds | Source |
| umls:C0017154 | Gastritis, Atrophic | 1 | BeFree |
| umls:C0024623 | Malignant neoplasm of stomach | 1 | BeFree |
| umls:C0038356 | Stomach Neoplasms | 1 | LHGDN |
| umls:C0151565 | Hemorrhagic colitis | 1 | BeFree |
| umls:C0699791 | Stomach Carcinoma | 1 | BeFree |
|
Copyright 2016-Present - The University of Texas Health Science Center at Houston (UTHealth) Web File Viewing | How to Report, Fraud, Waste and Abuse | State of Texas | Statewide Search | Texas Homeland Security | Site Policies |