 |
| |
| |
| |
| |
| |
| |
|

| TissGeneSummary for BNC1 |
 Gene summary Gene summary |
| Basic gene information | Gene symbol | BNC1 |
| Gene name | basonuclin 1 | |
| Synonyms | BNC|BSN1|HsT19447 | |
| Cytomap | UCSC genome browser: 15q25.2 | |
| Type of gene | protein-coding | |
| RefGenes | NM_001301206.1, NM_001717.3, | |
| Description | zinc finger protein basonuclin-1 | |
| Modification date | 20141207 | |
| dbXrefs | MIM : 601930 | |
| HGNC : HGNC | ||
| Ensembl : ENSG00000169594 | ||
| HPRD : 11799 | ||
| Vega : OTTHUMG00000147362 | ||
| Protein | UniProt: go to UniProt's Cross Reference DB Table | |
| Expression | CleanEX: HS_BNC1 | |
| BioGPS: 646 | ||
| Pathway | NCI Pathway Interaction Database: BNC1 | |
| KEGG: BNC1 | ||
| REACTOME: BNC1 | ||
| Pathway Commons: BNC1 | ||
| Context | iHOP: BNC1 | |
| ligand binding site mutation search in PubMed: BNC1 | ||
| UCL Cancer Institute: BNC1 | ||
| Assigned class in TissGDB* | C | |
| Included tissue-specific gene expression resources | TiGER,GTEx | |
| Specific-tissues in normal samples (assigned by TissGDB using HPA, TiGER, and GTEx) | Testis | |
| Cancer types related to the specific-tissues in cancer samples (assigned by TissGDB using TCGA) | TGCT | |
| Reference showing the relevant tissue of BNC1 | ||
| Description by TissGene annotations | ||
| * Class A consists of genes with literature evidence and is part of the cTissGenes. Class B consists of only cTissGenes without additional evidence. The remaining genes belong to Class C. |
| Gene ontology having evidence of Inferred from Direct Assay (IDA) from Entrez |
| GO ID | GO term | PubMed ID |
| Top |
| TissGeneExp for BNC1 |
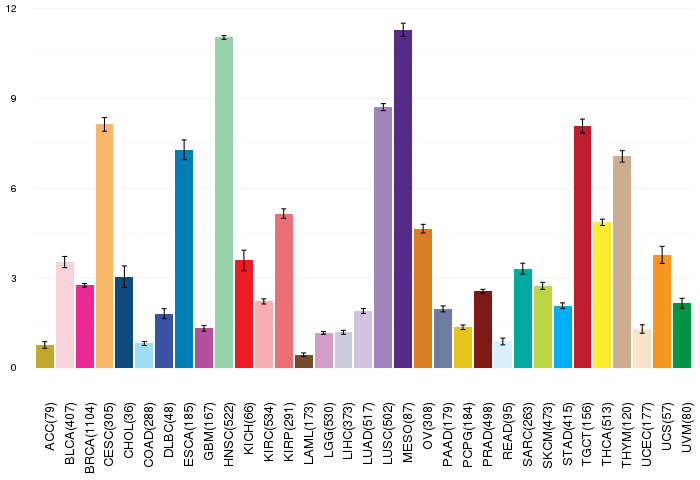
| Gene expressions across 28 cancer types (X-axis: cancer type and Y-axis: log2(norm_counts+1)) (TCGA IlluminaHiSeq_RNASeqV2, pan-cancer normalized log2(norm_counts+1) data, version 2016-08-16) |
 |
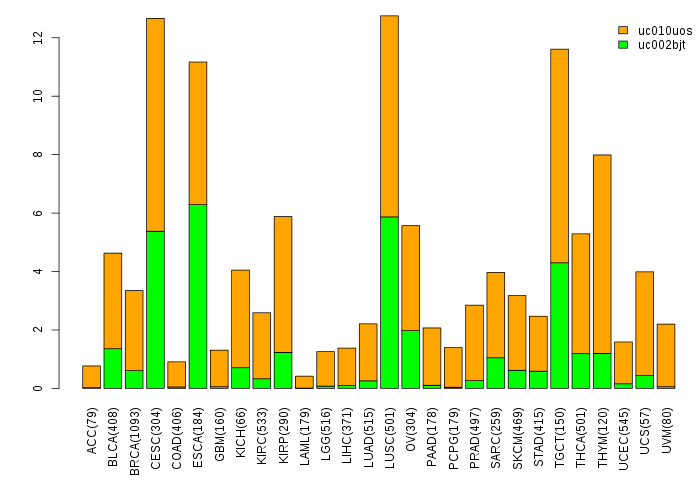
| Gene isoform expressions across 28 cancer types (X-axis: cancer type and Y-axis: log2(norm_counts+1)) (TCGA pan-cancer tcga_rsem_isoform_tpm, version 2016-09-01) |
 |
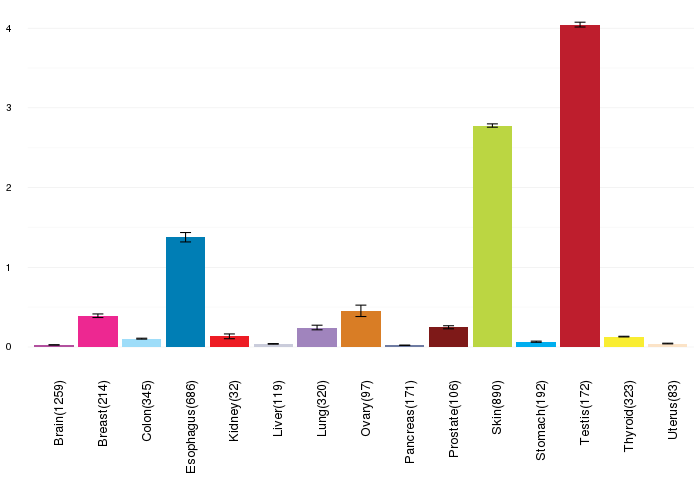
| Gene expressions across normal tissues of GTEx data (GTEx GTEx_Analysis_v6_RNA-seq_RNA-SeQCv1.1.8_gene_rpkm.gct) - Here, we shows the matched tissue types only among our 28 cancer types. |
 |
| Different expressions across 14 cancer types with more than 10 samples between matched tumors and normals (X-axis: cancer type and Y-axis: log2(norm_counts+1)) (TCGA IlluminaHiSeq_RNASeqV2, pan-cancer normalized log2(norm_counts+1) data, version 2016-08-16) |
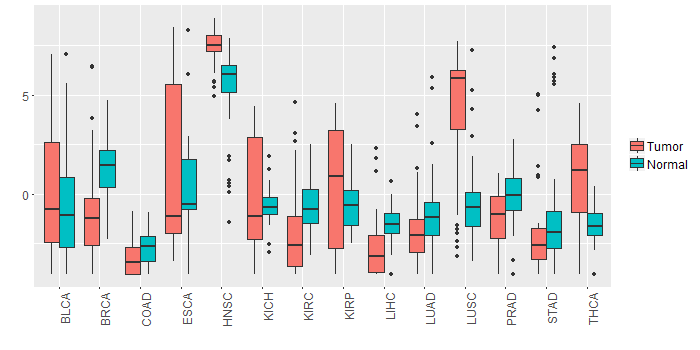 |
| - Significantly differentially expressed cancer types and information. (|Fold change|>1 and FDR<0.05) |
| Cancer type | Mean(exp) in tumor | Mean(exp) in matched normal | Log2FC | P-val. | FDR |
| LUSC | 4.362374509 | -0.411064707 | 4.773439216 | 1.58E-14 | 9.08E-14 |
| HNSC | 7.500128773 | 5.206031098 | 2.294097674 | 8.73E-08 | 8.69E-07 |
| BRCA | -1.193964087 | 1.415817491 | -2.609781579 | 6.98E-25 | 6.84E-24 |
| KIRC | -2.060874102 | -0.679082435 | -1.381791667 | 1.27E-06 | 3.23E-06 |
| THCA | 0.764723097 | -1.57354809 | 2.338271186 | 4.14E-10 | 2.52E-09 |
| LIHC | -2.727768158 | -1.500980158 | -1.226788 | 2.95E-06 | 1.43E-05 |
| PRAD | -1.211626773 | -0.022484465 | -1.189142308 | 2.68E-05 | 0.000131622 |
| Top |
| TissGene-miRNA for BNC1 |
| Significantly anti-correlated miRNAs of TissGene across 28 cancer types (Gene-miRNA relations from TargetScanHuman Relsease 7.1, Conserved_Site_Context_Scores.txt.zip, 06.01.2016) (TCGA IlluminaHiSeq_miRNASeq, log2(RPM+1) data, version 2016-11-21) (TCGA IlluminaHiSeq_RNASeqV2, log2(normalized_count+1) data, version 2016-08-16) (Spearman’s Rank Correlation (p-value<0.05 and coefficient<-0.25)) |
| Cancer type | miRNA id | miRNA accession | P-val. | Coeff. | # samples |
| Top |
| TissGeneMut for BNC1 |
| TissGeneSNV for BNC1 |
| nsSNV counts per each loci. Different colors of circles represent different cancer types. Circle size denotes number of samples. (TCGA somatic mutation (SNPs and small INDELs) data, version 2016-04-25) * Click on the image to enlarge it in a new window. |
 |
| Somatic nucleotide variants of TissGene across 28 cancer types (X-axis: cancer type and Y-axis: % of mutated samples) The numbers in parentheses are numbers of samples with mutation (nsSNVs). (TCGA somatic mutation (SNPs and small INDELs) data, version 2016-04-25) |
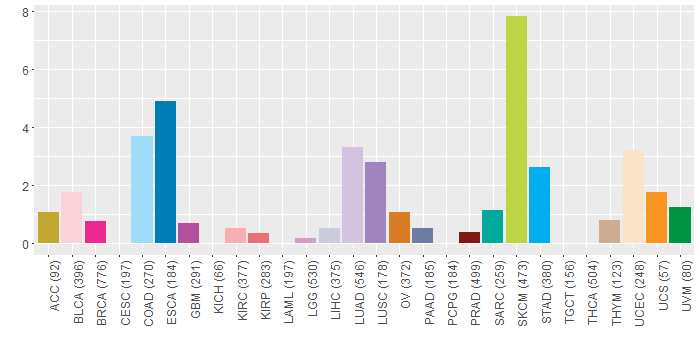 |
| - nsSNVs sorted by frequency. |
| AAchange | Cancer type | # samples |
| p.E526K | SKCM | 5 |
| p.E390K | SKCM | 3 |
| p.G225E | SKCM | 2 |
| p.P667S | SKCM | 2 |
| p.P760L | SKCM | 2 |
| p.S968L | SKCM | 2 |
| p.R611C | SKCM | 2 |
| p.E635* | SKCM | 1 |
| p.T497M | ACC | 1 |
| p.E788K | HNSC | 1 |
| p.R107H | STAD | 1 |
| p.P74S | BLCA | 1 |
| p.F248L | UCEC | 1 |
| p.G149E | SKCM | 1 |
| p.T446S | LUAD | 1 |
| p.P227S | LUAD | 1 |
| p.E578G | ESCA | 1 |
| p.G141* | LUAD | 1 |
| p.D275N | SKCM | 1 |
| p.E83K | SKCM | 1 |
| p.M887I | MESO | 1 |
| p.G62R | SKCM | 1 |
| p.Q247* | SKCM | 1 |
| p.N226S | SKCM | 1 |
| p.A710G | LUAD | 1 |
| p.N979I | ESCA | 1 |
| p.A915G | COAD | 1 |
| p.R172C | UCEC | 1 |
| p.G691E | SKCM | 1 |
| p.S292F | BLCA | 1 |
| p.E616Q | SKCM | 1 |
| p.S398F | SKCM | 1 |
| p.D670N | BRCA | 1 |
| p.E702K | SKCM | 1 |
| p.F791I | SKCM | 1 |
| p.T446M | KIRP | 1 |
| p.L135I | SARC | 1 |
| p.R953W | SKCM | 1 |
| p.E556A | STAD | 1 |
| p.E346Q | BLCA | 1 |
| p.R54H | UVM | 1 |
| p.R114Q | KIRC | 1 |
| p.R973Q | UCEC | 1 |
| p.R356W | COAD | 1 |
| p.R611G | LUAD | 1 |
| p.R114Q | CHOL | 1 |
| p.R971C | HNSC | 1 |
| p.D904N | LUAD | 1 |
| p.A407V | BRCA | 1 |
| p.R973Q | BRCA | 1 |
| p.S192F | SKCM | 1 |
| p.K150Q | STAD | 1 |
| p.S537F | SKCM | 1 |
| p.S968L | STAD | 1 |
| p.M827V | LUAD | 1 |
| p.N773K | LUAD | 1 |
| p.P227H | LUAD | 1 |
| p.R107C | COAD | 1 |
| p.I544V | COAD | 1 |
| p.M662I | SKCM | 1 |
| p.E187Q | ESCA | 1 |
| p.D286N | BLCA | 1 |
| p.S847Y | OV | 1 |
| p.H375P | STAD | 1 |
| p.M887I | LUAD | 1 |
| p.I553L | COAD | 1 |
| p.S338F | SKCM | 1 |
| p.E663K | SKCM | 1 |
| p.R953W | PRAD | 1 |
| p.L96F | SKCM | 1 |
| p.P568T | ESCA | 1 |
| p.N974K | LUAD | 1 |
| p.A920V | PAAD | 1 |
| p.R611S | ESCA | 1 |
| p.K313E | BLCA | 1 |
| p.E175D | UCEC | 1 |
| p.V379I | UCEC | 1 |
| p.R971C | UCS | 1 |
| p.D651N | LGG | 1 |
| p.G682E | COAD | 1 |
| p.R107H | GBM | 1 |
| p.D462N | SKCM | 1 |
| p.R402W | STAD | 1 |
| p.R114Q | BLCA | 1 |
| p.R792H | READ | 1 |
| p.N410K | LUAD | 1 |
| p.D113Y | LUSC | 1 |
| p.D316G | COAD | 1 |
| p.D57V | STAD | 1 |
| p.T751K | LUAD | 1 |
| p.R493S | LUAD | 1 |
| p.R402Q | SKCM | 1 |
| p.A65V | SKCM | 1 |
| p.L919I | LUAD | 1 |
| p.M183K | BRCA | 1 |
| p.R107C | OV | 1 |
| p.M394L | DLBC | 1 |
| p.S212R | STAD | 1 |
| p.S968L | SARC | 1 |
| p.G225R | SKCM | 1 |
| p.E363K | BLCA | 1 |
| p.I507K | LUAD | 1 |
| p.L372I | COAD | 1 |
| p.S210N | LUAD | 1 |
| p.S563L | HNSC | 1 |
| p.C450Y | LIHC | 1 |
| p.S617F | SKCM | 1 |
| p.G465A | LIHC | 1 |
| p.N503T | STAD | 1 |
| p.P285S | SKCM | 1 |
| p.R412W | ESCA | 1 |
| p.P75H | THYM | 1 |
| p.P74H | COAD | 1 |
| p.P907T | LUSC | 1 |
| p.P308L | UCEC | 1 |
| p.L119S | UCEC | 1 |
| p.R404H | OV | 1 |
| p.Y264H | KIRC | 1 |
| p.R690M | STAD | 1 |
| p.S968L | COAD | 1 |
| p.T504M | HNSC | 1 |
| p.M415V | STAD | 1 |
| p.E262K | SKCM | 1 |
| p.S595L | SKCM | 1 |
| p.E526K | BRCA | 1 |
| p.P105S | LUSC | 1 |
| p.Y264S | ESCA | 1 |
| p.Y264F | SKCM | 1 |
| p.G653R | PRAD | 1 |
| p.Q836H | COAD | 1 |
| p.E300K | SKCM | 1 |
| p.D807E | UCEC | 1 |
| p.S317G | LUSC | 1 |
| p.P568S | ESCA | 1 |
| p.P308L | STAD | 1 |
| p.N771S | LUSC | 1 |
| p.D271H | GBM | 1 |
| p.P416Q | LUAD | 1 |
| p.M567K | SARC | 1 |
| p.D302N | SKCM | 1 |
| p.G941R | BRCA | 1 |
| p.D425N | ESCA | 1 |
| p.R412G | BLCA | 1 |
| p.E852D | OV | 1 |
| p.G883V | LUAD | 1 |
| p.I615M | SKCM | 1 |
| p.P457S | SKCM | 1 |
| p.H270Y | STAD | 1 |
| p.S524L | SKCM | 1 |
| p.R172C | SKCM | 1 |
| p.L119F | UCEC | 1 |
| p.T854N | LUAD | 1 |
| p.E279K | SKCM | 1 |
| p.T824A | UCEC | 1 |
| p.I544F | ESCA | 1 |
| Top |
| TissGeneCNV for BNC1 |
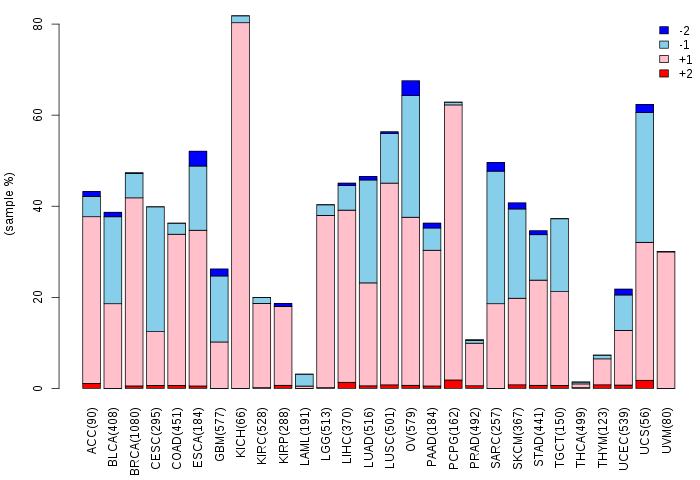
| Copy number variations of TissGene across 28 cancer types (X-axis: cancer type and Y-axis: % of CNV samples) (TCGA Gistic2_CopyNumber_Gistic2_all_data_by_genes, Gistic2 copy number data, version 2016-08-16) |
 |
| Top |
| TissGeneFusions for BNC1 |
| Fusion genes including TissGene (ChimerDB 3.0, 2016-12-01 and TCGA fusion Portal 2015-12-01) |
| Database | Src | Cancer type | Sample | Fusion gene | ORF | 5'-gene BP | 3'-gene BP |
| Top |
| TissGeneNet for BNC1 |
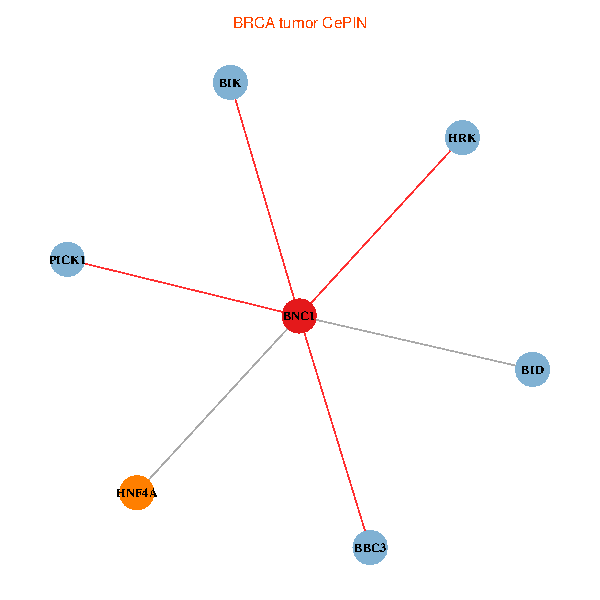
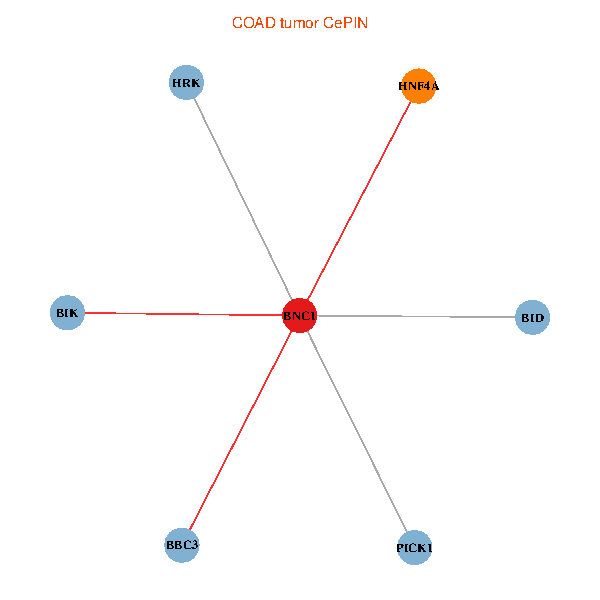
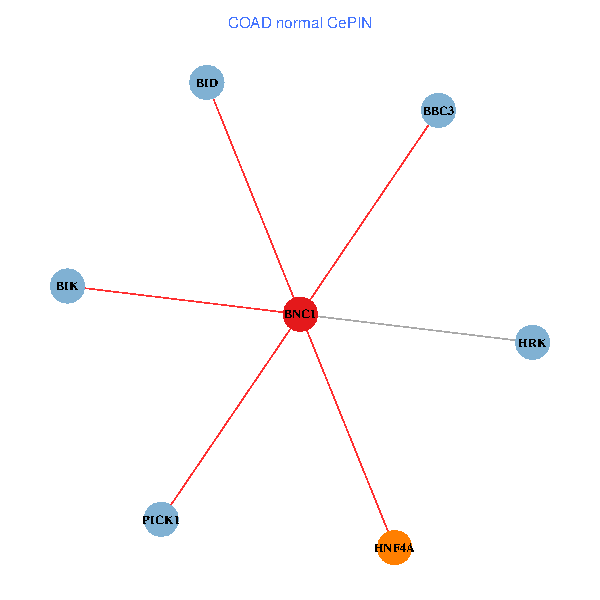
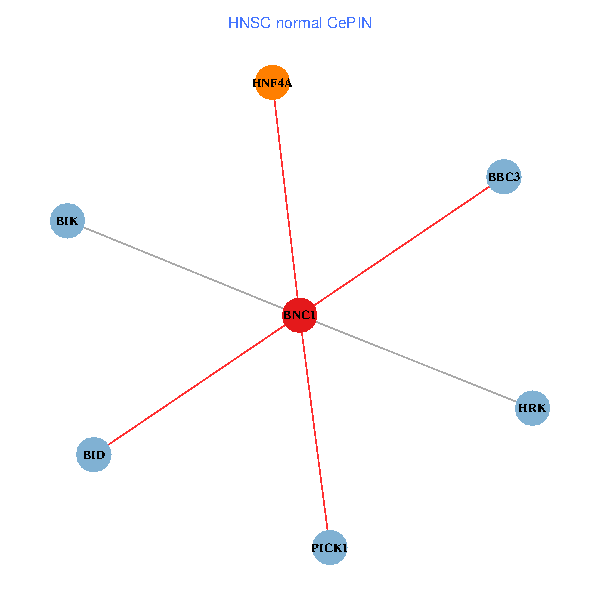
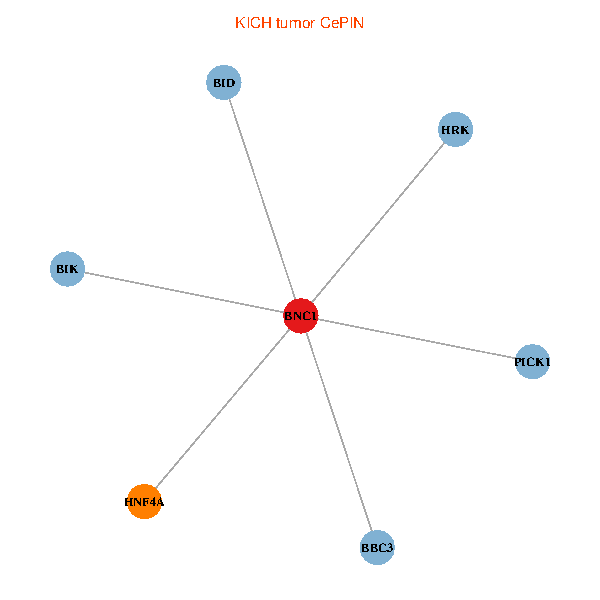
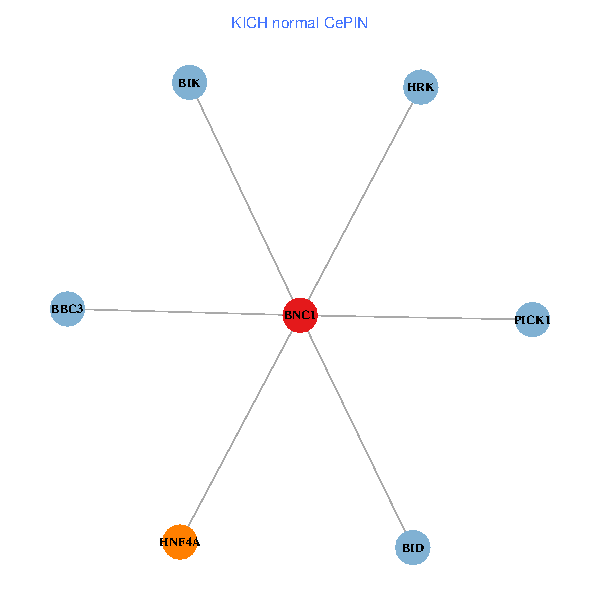
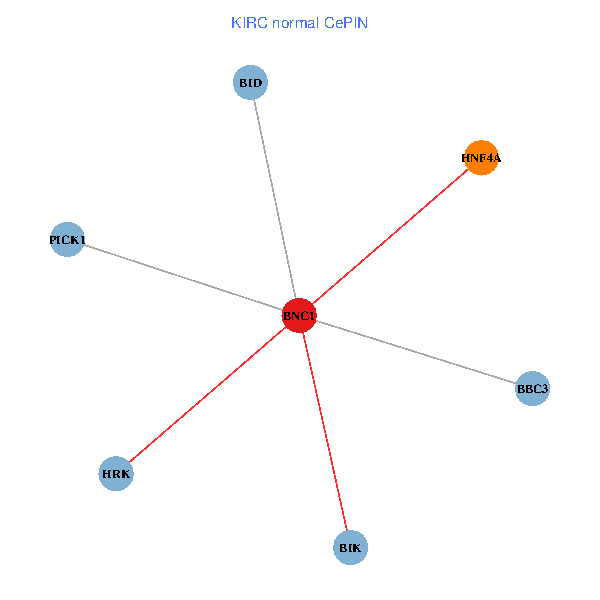
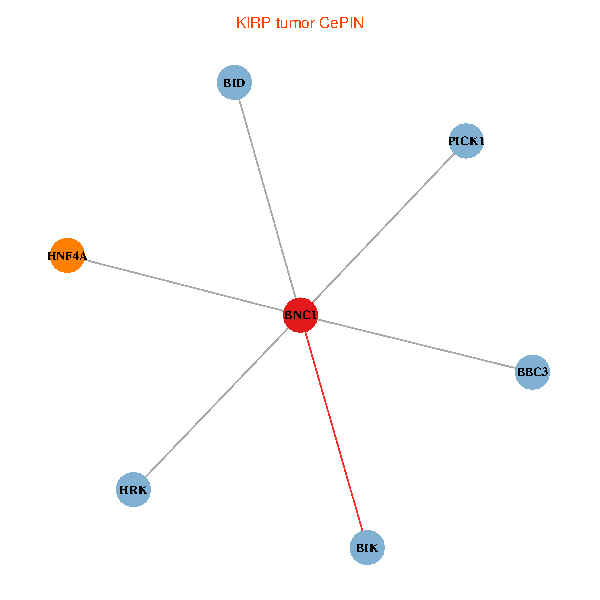
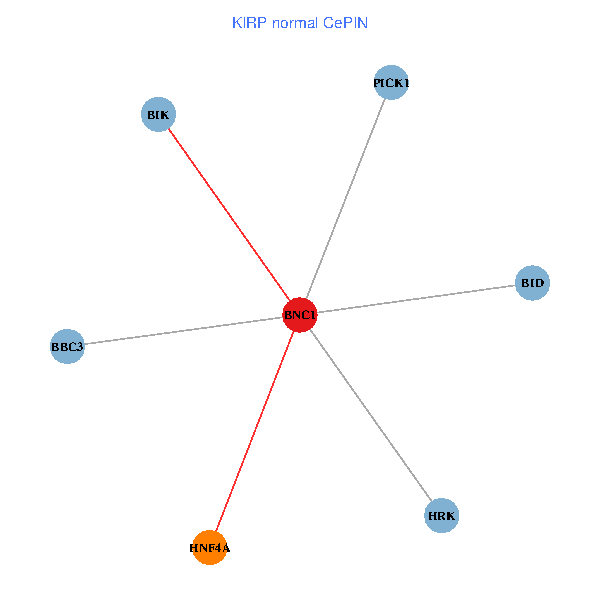
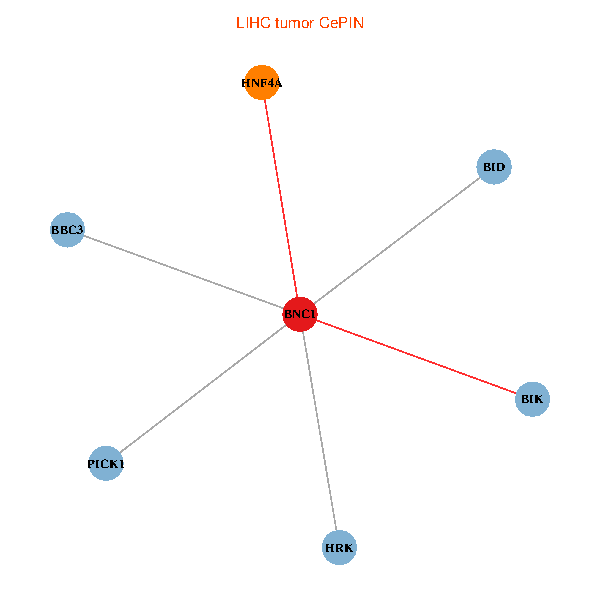
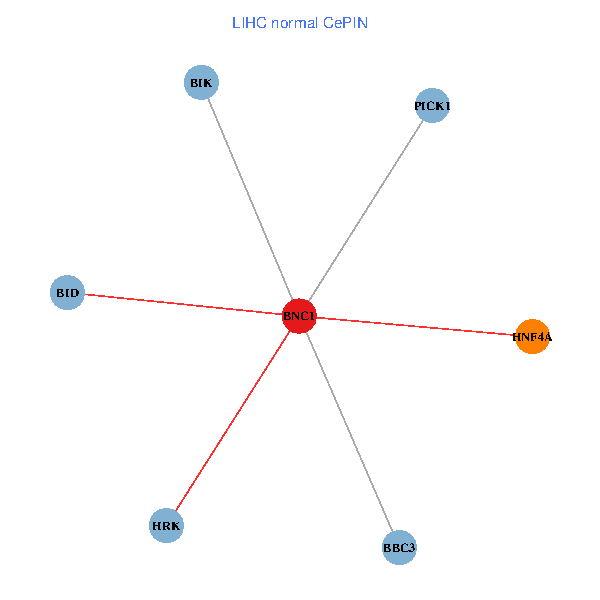
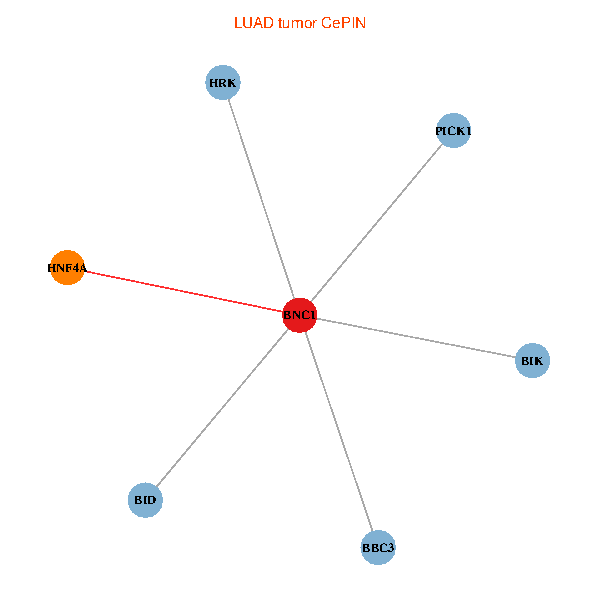
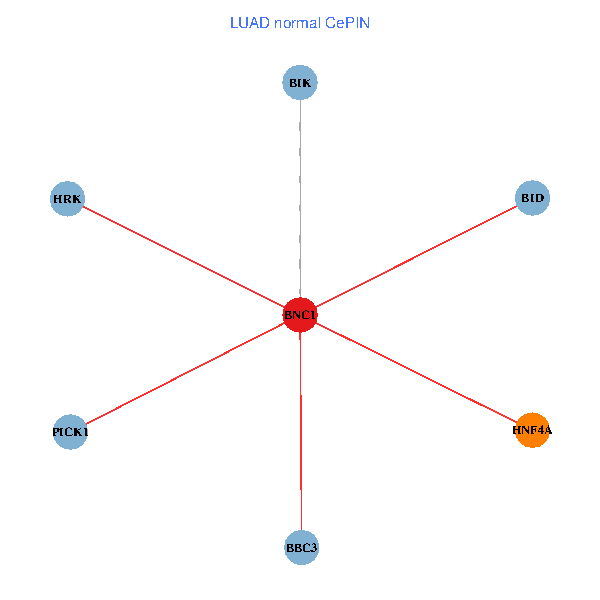
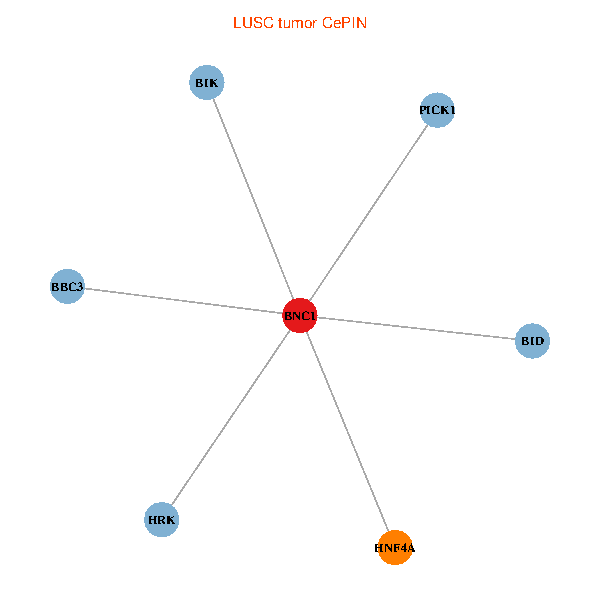
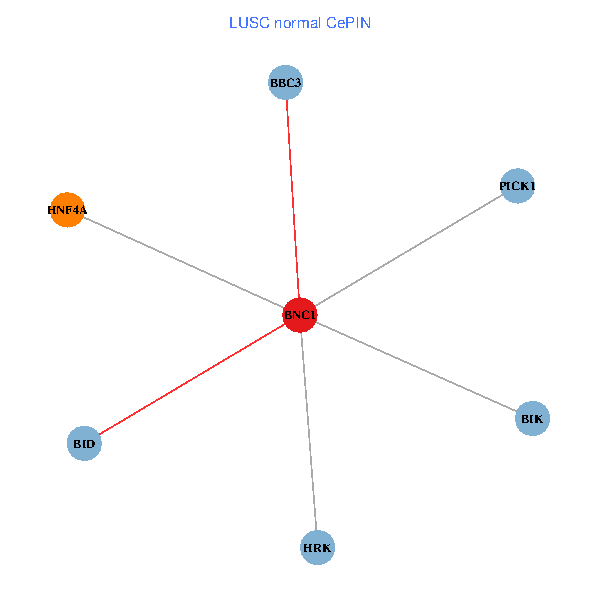
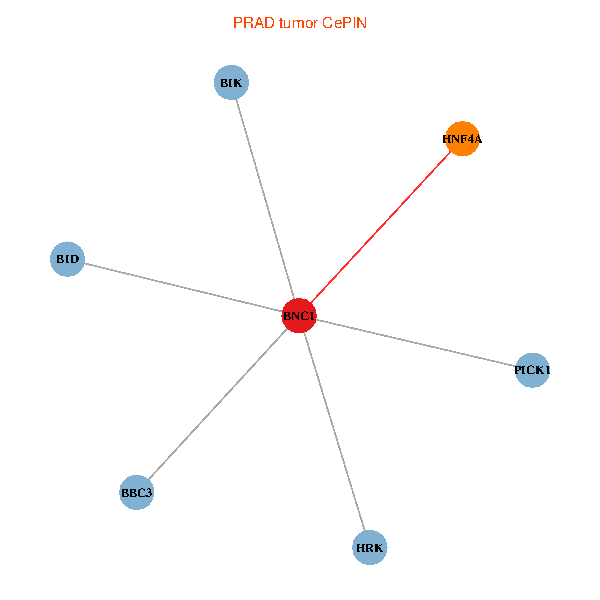
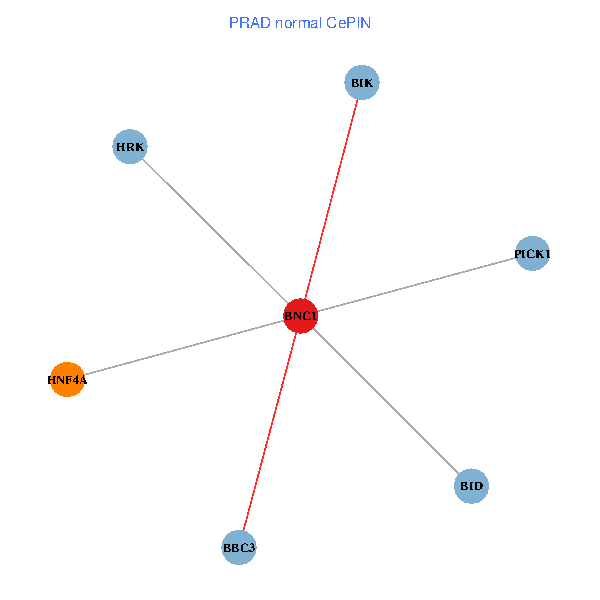
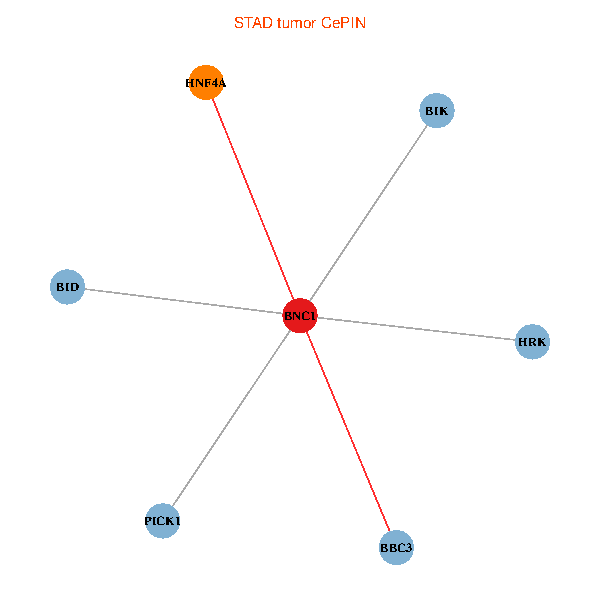
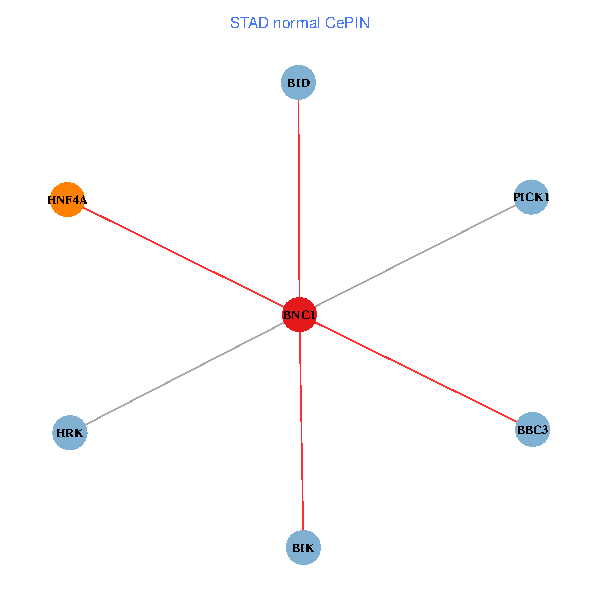
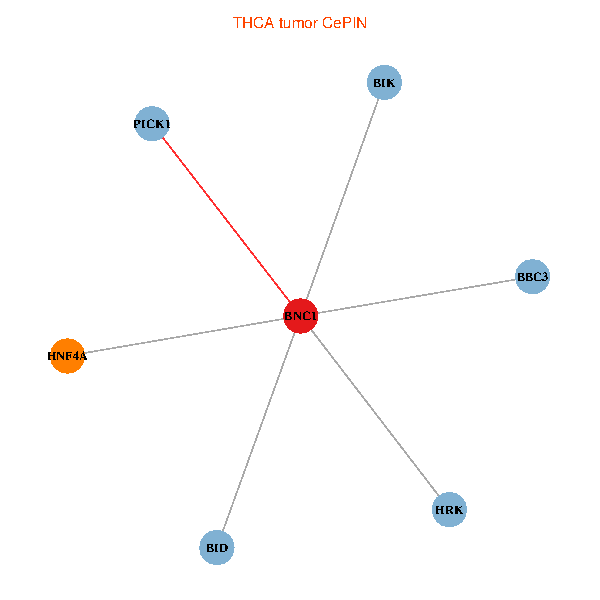
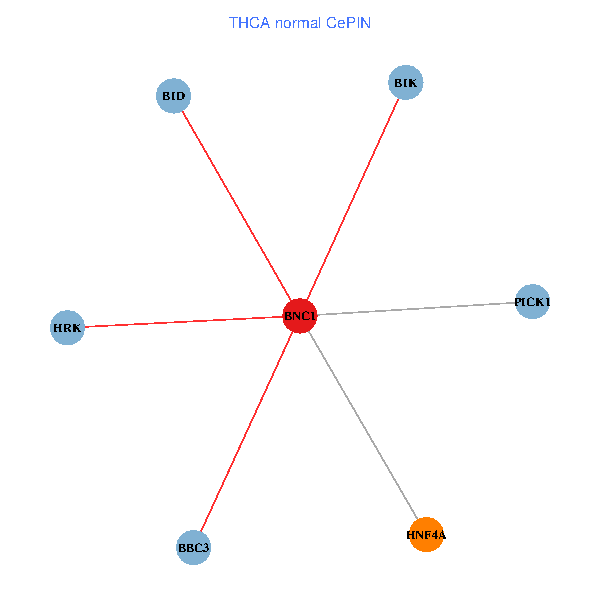
| Co-expressed gene networks based on protein-protein interaction data (CePIN) (TCGA IlluminaHiSeq_RNASeqV2, pan-cancer normalized log2(norm_counts+1) data, version 2016-08-16) (PINA2 ppi data) |
| BRCA (tumor) | BRCA (normal) |
| BNC1, HNF4A, PICK1, HRK, BIK, BID, BBC3 (tumor) | BNC1, HNF4A, PICK1, HRK, BIK, BID, BBC3 (normal) |
 |  |
| COAD (tumor) | COAD (normal) |
| BNC1, HNF4A, PICK1, HRK, BIK, BID, BBC3 (tumor) | BNC1, HNF4A, PICK1, HRK, BIK, BID, BBC3 (normal) |
 |  |
| HNSC (tumor) | HNSC (normal) |
| BNC1, HNF4A, PICK1, HRK, BIK, BID, BBC3 (tumor) | BNC1, HNF4A, PICK1, HRK, BIK, BID, BBC3 (normal) |
 |  |
| KICH (tumor) | KICH (normal) |
| BNC1, HNF4A, PICK1, HRK, BIK, BID, BBC3 (tumor) | BNC1, HNF4A, PICK1, HRK, BIK, BID, BBC3 (normal) |
 |  |
| KIRC (tumor) | KIRC (normal) |
| BNC1, HNF4A, PICK1, HRK, BIK, BID, BBC3 (tumor) | BNC1, HNF4A, PICK1, HRK, BIK, BID, BBC3 (normal) |
 |  |
| KIRP (tumor) | KIRP (normal) |
| BNC1, HNF4A, PICK1, HRK, BIK, BID, BBC3 (tumor) | BNC1, HNF4A, PICK1, HRK, BIK, BID, BBC3 (normal) |
 |  |
| LIHC (tumor) | LIHC (normal) |
| BNC1, HNF4A, PICK1, HRK, BIK, BID, BBC3 (tumor) | BNC1, HNF4A, PICK1, HRK, BIK, BID, BBC3 (normal) |
 |  |
| LUAD (tumor) | LUAD (normal) |
| BNC1, HNF4A, PICK1, HRK, BIK, BID, BBC3 (tumor) | BNC1, HNF4A, PICK1, HRK, BIK, BID, BBC3 (normal) |
 |  |
| LUSC (tumor) | LUSC (normal) |
| BNC1, HNF4A, PICK1, HRK, BIK, BID, BBC3 (tumor) | BNC1, HNF4A, PICK1, HRK, BIK, BID, BBC3 (normal) |
 |  |
| PRAD (tumor) | PRAD (normal) |
| BNC1, HNF4A, PICK1, HRK, BIK, BID, BBC3 (tumor) | BNC1, HNF4A, PICK1, HRK, BIK, BID, BBC3 (normal) |
 |  |
| STAD (tumor) | STAD (normal) |
| BNC1, HNF4A, PICK1, HRK, BIK, BID, BBC3 (tumor) | BNC1, HNF4A, PICK1, HRK, BIK, BID, BBC3 (normal) |
 |  |
| THCA (tumor) | THCA (normal) |
| BNC1, HNF4A, PICK1, HRK, BIK, BID, BBC3 (tumor) | BNC1, HNF4A, PICK1, HRK, BIK, BID, BBC3 (normal) |
 |  |
| Top |
| TissGeneProg for BNC1 |
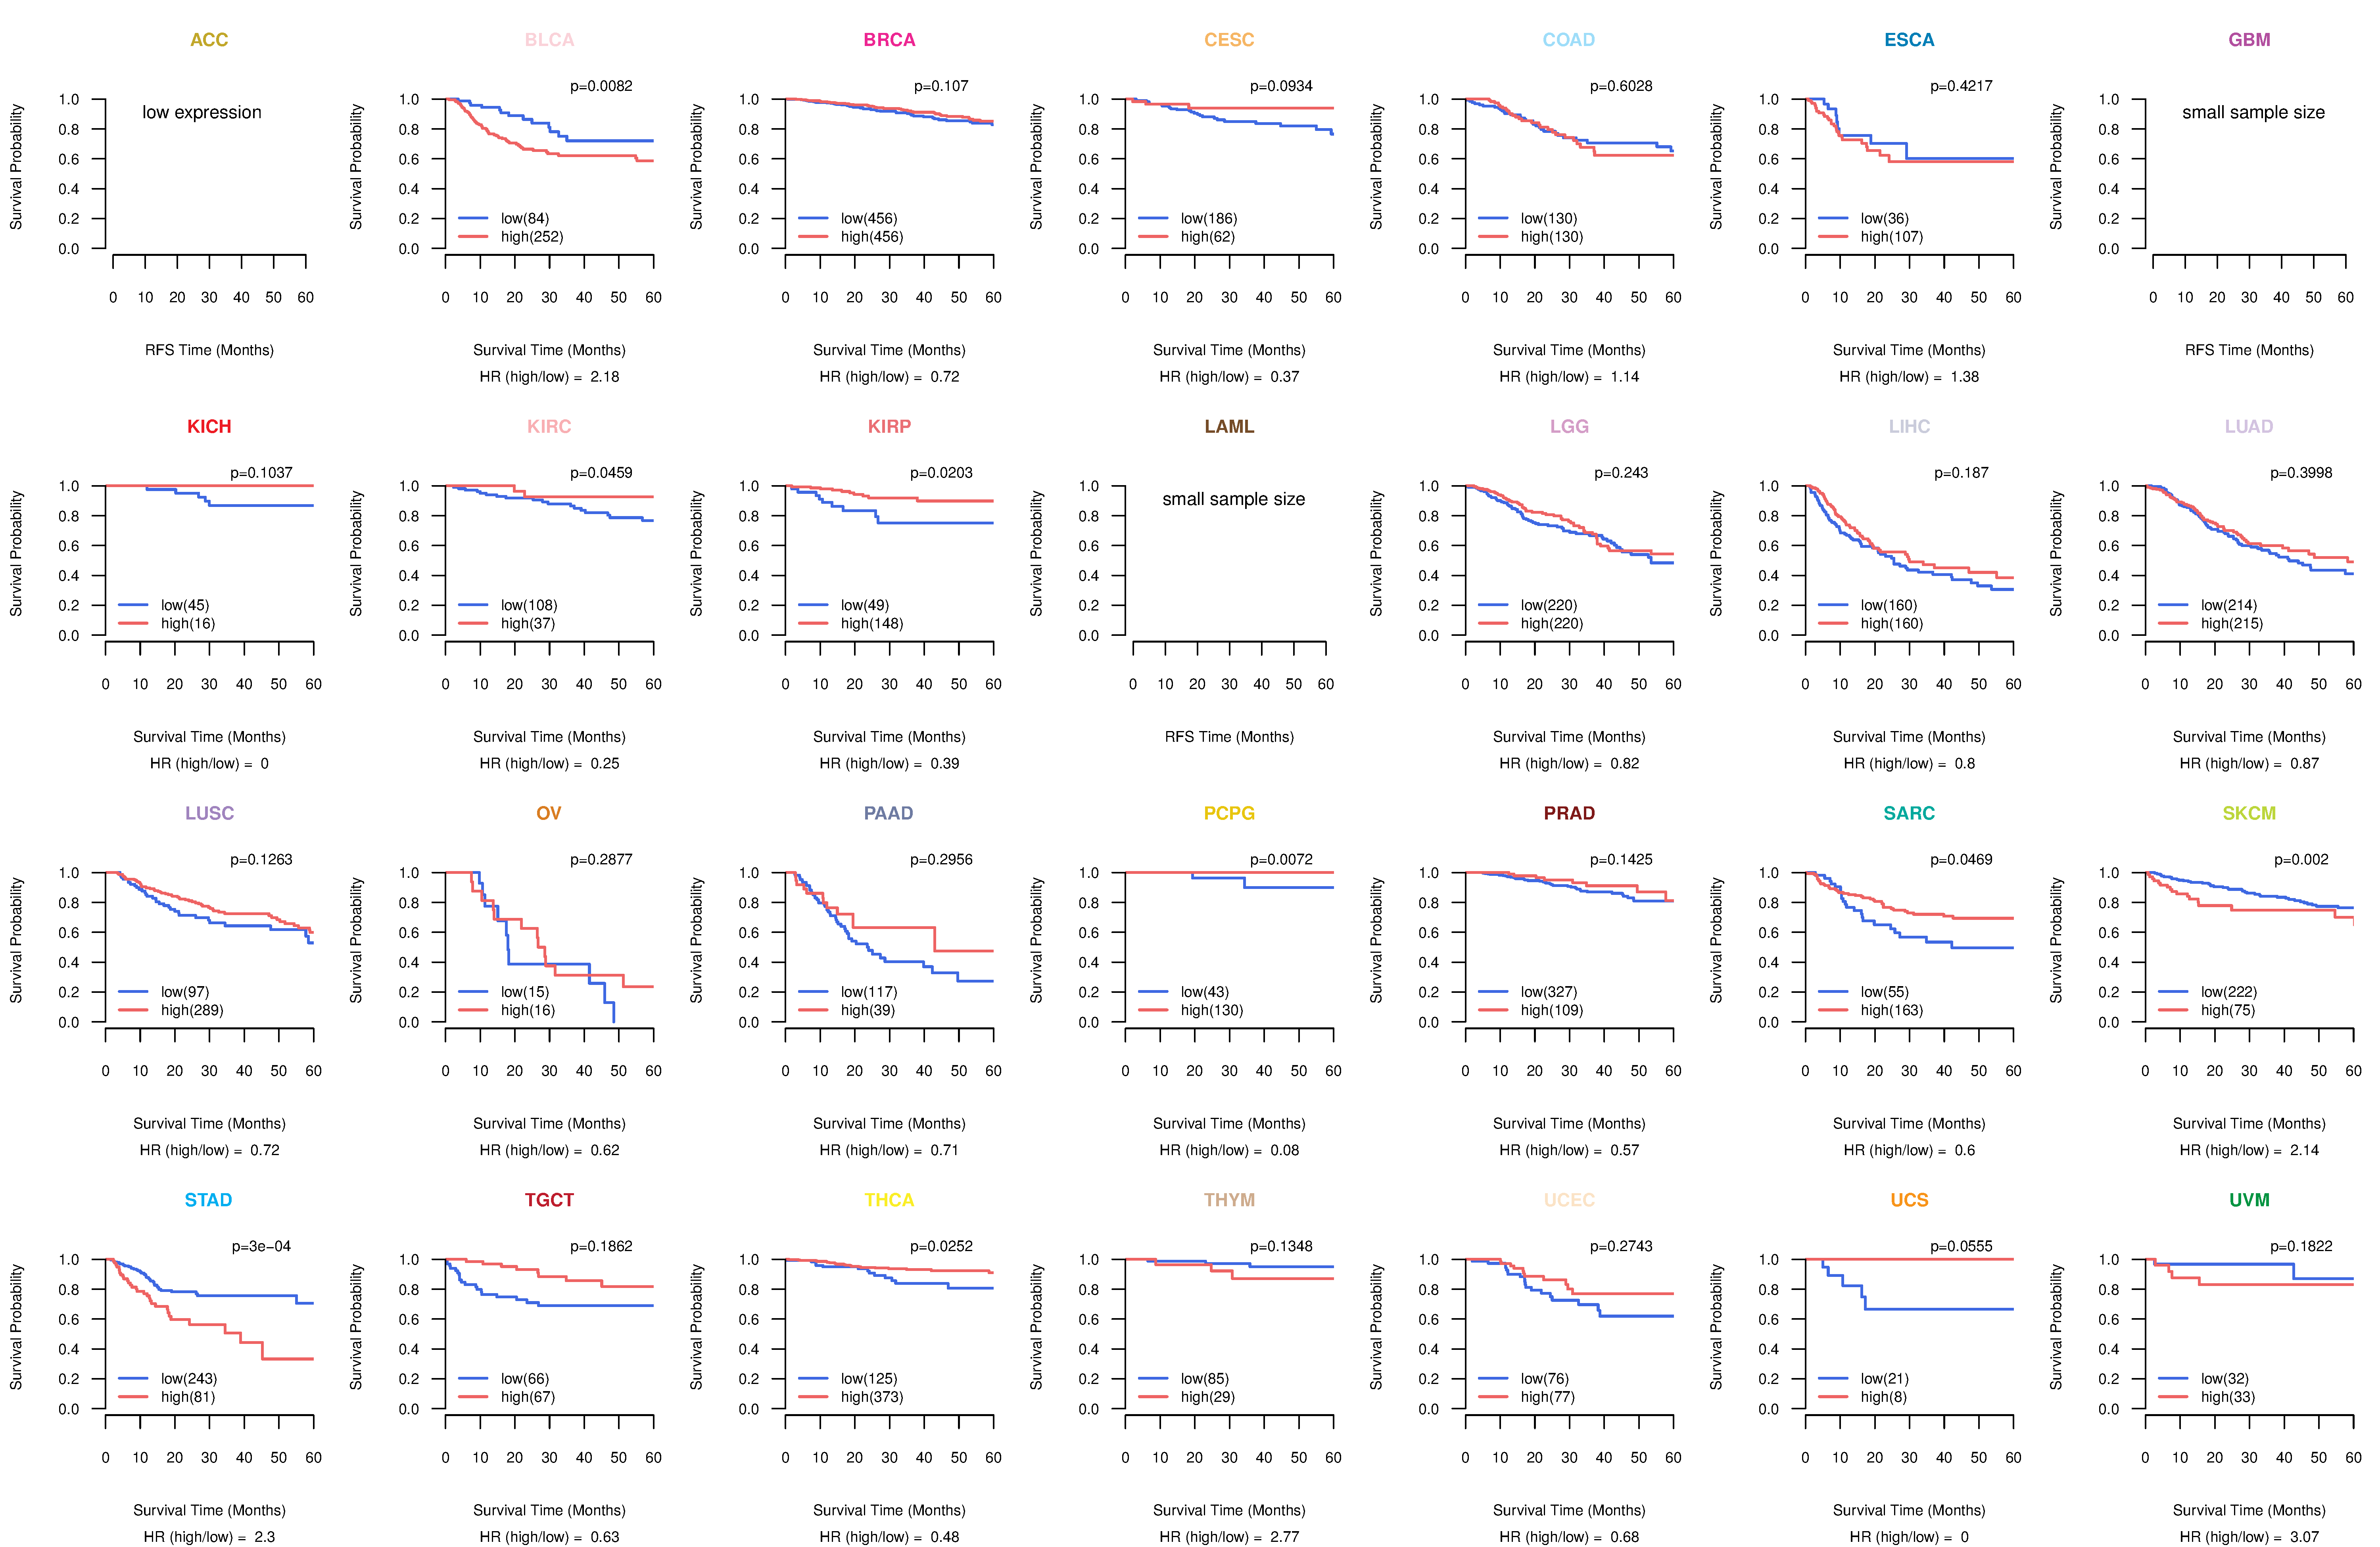
| Kaplan-Meier plots with logrank tests of overall survival (OS) using 28 cancer types (TCGA IlluminaHiSeq_RNASeqV2, pan-cancer normalized log2(norm_counts+1) data, version 2016-08-16) (TCGA clinicalMatrix, phenotype data, version 2016-04-27) * Click on the image to enlarge it in a new window. |
 |
| Kaplan-Meier plots with logrank test of relapse free survival (RFS) using 28 cancer types (TCGA IlluminaHiSeq_RNASeqV2, pan-cancer normalized log2(norm_counts+1) data, version 2016-08-16) (TCGA clinicalMatrix, phenotype data, version 2016-04-27) * Click on the image enlarge it in a new window. |
 |
| Forest plot of Cox proportional hazard ratio (HR) and 95% CI of overall survival (OS) using 28 cancer types (TCGA IlluminaHiSeq_RNASeqV2, pan-cancer normalized log2(norm_counts+1) data, version 2016-08-16) (TCGA clinicalMatrix, phenotype data, version 2016-04-27) * Click on the image enlarge it in a new window. |
 |
| Forest plot of Cox proportional hazard ratio (HR) and 95% CI of relapse free survival (RFS) using 28 cancer types (TCGA IlluminaHiSeq_RNASeqV2, pan-cancer normalized log2(norm_counts+1) data, version 2016-08-16) (TCGA clinicalMatrix, phenotype data, version 2016-04-27) * Click on the image enlarge it in a new window. |
 |
| Top |
| TissGeneClin for BNC1 |
| TissGeneDrug for BNC1 |
| Drug information targeting TissGene (DrugBank Version 5.0.6, 2017-04-01) |
| DrugBank ID | Drug name | Drug activity | Drug type | Drug status |
| Top |
| TissGeneDisease for BNC1 |
| Disease information associated with TissGene (DisGeNet, 2016-06-01) |
| Disease ID | Disease name | # pubmeds | Source |
| umls:C0023903 | Liver neoplasms | 2 | BeFree |
| umls:C2239176 | Liver carcinoma | 2 | BeFree |
| umls:C0002793 | Anaplasia | 1 | BeFree |
| umls:C0007137 | Squamous cell carcinoma | 1 | BeFree |
| umls:C0235974 | Pancreatic carcinoma | 1 | BeFree |
| umls:C0346647 | Malignant neoplasm of pancreas | 1 | BeFree |
| umls:C3811653 | Experimental Organism Basal Cell Carcinoma | 1 | BeFree |
|
Copyright 2016-Present - The University of Texas Health Science Center at Houston (UTHealth) Web File Viewing | How to Report, Fraud, Waste and Abuse | State of Texas | Statewide Search | Texas Homeland Security | Site Policies |