 |
| |
| |
| |
| |
| |
| |
|

| TissGeneSummary for HS3ST6 |
 Gene summary Gene summary |
| Basic gene information | Gene symbol | HS3ST6 |
| Gene name | heparan sulfate (glucosamine) 3-O-sulfotransferase 6 | |
| Synonyms | 3-OST-6|HS3ST5|h3-OST-6 | |
| Cytomap | UCSC genome browser: 16p13.3 | |
| Type of gene | protein-coding | |
| RefGenes | NM_001009606.3, | |
| Description | heparan sulfate (glucosamine) 3-O-sulfotransferase 5heparan sulfate D-glucosaminyl 3-O-sulfotransferase 6heparan sulfate glucosamine 3-O-sulfotransferase 6heparan sulphate D-glucosaminyl 3-O-sulfotransferase-3B like | |
| Modification date | 20141207 | |
| dbXrefs | HGNC : HGNC | |
| Ensembl : ENSG00000162040 | ||
| HPRD : 17115 | ||
| Vega : OTTHUMG00000047860 | ||
| Protein | UniProt: go to UniProt's Cross Reference DB Table | |
| Expression | CleanEX: HS_HS3ST6 | |
| BioGPS: 64711 | ||
| Pathway | NCI Pathway Interaction Database: HS3ST6 | |
| KEGG: HS3ST6 | ||
| REACTOME: HS3ST6 | ||
| Pathway Commons: HS3ST6 | ||
| Context | iHOP: HS3ST6 | |
| ligand binding site mutation search in PubMed: HS3ST6 | ||
| UCL Cancer Institute: HS3ST6 | ||
| Assigned class in TissGDB* | C | |
| Included tissue-specific gene expression resources | HPA,GTEx | |
| Specific-tissues in normal samples (assigned by TissGDB using HPA, TiGER, and GTEx) | Skin | |
| Cancer types related to the specific-tissues in cancer samples (assigned by TissGDB using TCGA) | SKCM | |
| Reference showing the relevant tissue of HS3ST6 | ||
| Description by TissGene annotations | ||
| * Class A consists of genes with literature evidence and is part of the cTissGenes. Class B consists of only cTissGenes without additional evidence. The remaining genes belong to Class C. |
| Gene ontology having evidence of Inferred from Direct Assay (IDA) from Entrez |
| GO ID | GO term | PubMed ID |
| Top |
| TissGeneExp for HS3ST6 |
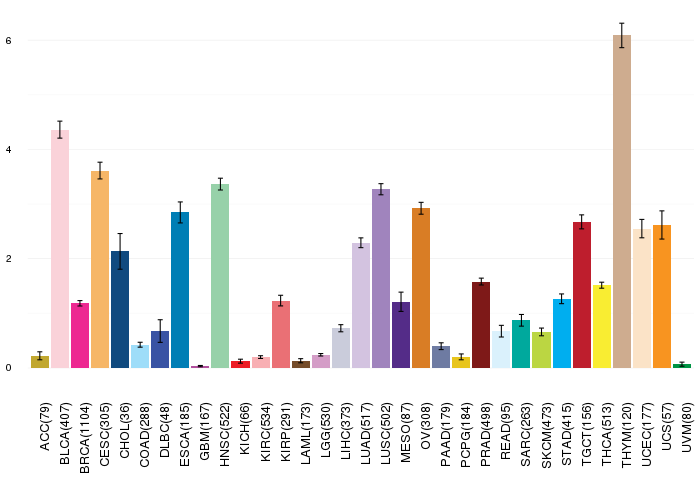
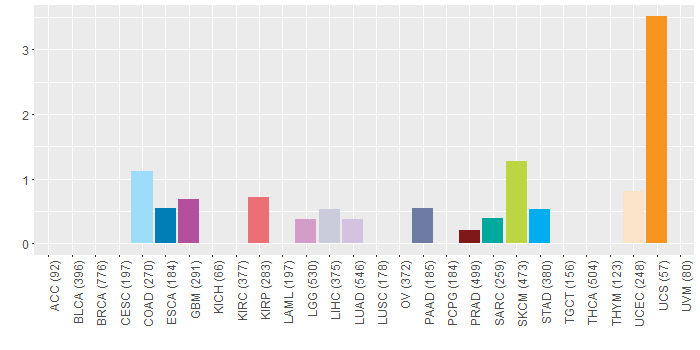
| Gene expressions across 28 cancer types (X-axis: cancer type and Y-axis: log2(norm_counts+1)) (TCGA IlluminaHiSeq_RNASeqV2, pan-cancer normalized log2(norm_counts+1) data, version 2016-08-16) |
 |
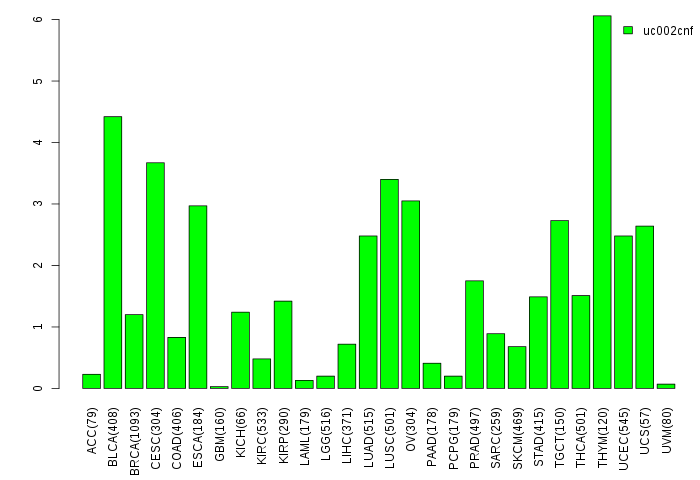
| Gene isoform expressions across 28 cancer types (X-axis: cancer type and Y-axis: log2(norm_counts+1)) (TCGA pan-cancer tcga_rsem_isoform_tpm, version 2016-09-01) |
 |
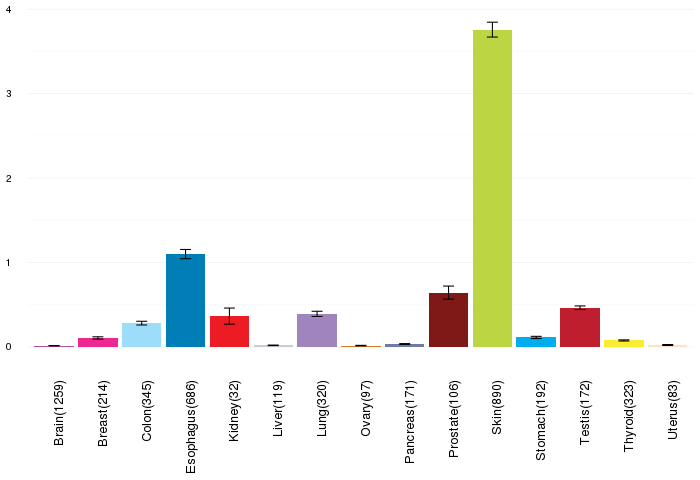
| Gene expressions across normal tissues of GTEx data (GTEx GTEx_Analysis_v6_RNA-seq_RNA-SeQCv1.1.8_gene_rpkm.gct) - Here, we shows the matched tissue types only among our 28 cancer types. |
 |
| Different expressions across 14 cancer types with more than 10 samples between matched tumors and normals (X-axis: cancer type and Y-axis: log2(norm_counts+1)) (TCGA IlluminaHiSeq_RNASeqV2, pan-cancer normalized log2(norm_counts+1) data, version 2016-08-16) |
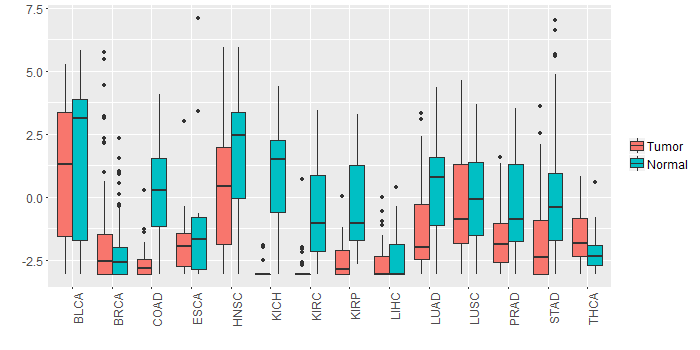 |
| - Significantly differentially expressed cancer types and information. (|Fold change|>1 and FDR<0.05) |
| Cancer type | Mean(exp) in tumor | Mean(exp) in matched normal | Log2FC | P-val. | FDR |
| KIRP | -2.513286233 | -0.297304983 | -2.21598125 | 5.49E-08 | 3.52E-07 |
| COAD | -2.513599694 | 0.329850306 | -2.84345 | 4.48E-08 | 3.42E-07 |
| KICH | -2.934421233 | 0.902474767 | -3.836896 | 5.04E-10 | 3.41E-09 |
| KIRC | -2.930484844 | -0.640359844 | -2.290125 | 3.42E-17 | 2.07E-16 |
| LUAD | -1.297623302 | 0.479256008 | -1.77687931 | 2.83E-07 | 1.03E-06 |
| HNSC | 0.364557372 | 1.850971325 | -1.486413953 | 0.00453 | 0.012414738 |
| STAD | -1.738936233 | 0.307304392 | -2.046240625 | 0.00151 | 0.007334752 |
| PRAD | -1.622192002 | -0.288253541 | -1.333938462 | 2.41E-05 | 0.000120554 |
| Top |
| TissGene-miRNA for HS3ST6 |
| Significantly anti-correlated miRNAs of TissGene across 28 cancer types (Gene-miRNA relations from TargetScanHuman Relsease 7.1, Conserved_Site_Context_Scores.txt.zip, 06.01.2016) (TCGA IlluminaHiSeq_miRNASeq, log2(RPM+1) data, version 2016-11-21) (TCGA IlluminaHiSeq_RNASeqV2, log2(normalized_count+1) data, version 2016-08-16) (Spearman’s Rank Correlation (p-value<0.05 and coefficient<-0.25)) |
| Cancer type | miRNA id | miRNA accession | P-val. | Coeff. | # samples |
| Top |
| TissGeneMut for HS3ST6 |
| TissGeneSNV for HS3ST6 |
| nsSNV counts per each loci. Different colors of circles represent different cancer types. Circle size denotes number of samples. (TCGA somatic mutation (SNPs and small INDELs) data, version 2016-04-25) * Click on the image to enlarge it in a new window. |
 |
 |
| Somatic nucleotide variants of TissGene across 28 cancer types (X-axis: cancer type and Y-axis: % of mutated samples) The numbers in parentheses are numbers of samples with mutation (nsSNVs). (TCGA somatic mutation (SNPs and small INDELs) data, version 2016-04-25) |
 |
| - nsSNVs sorted by frequency. |
| AAchange | Cancer type | # samples |
| p.L285V | COAD | 2 |
| p.D190E | SARC | 1 |
| p.V242I | COAD | 1 |
| p.S158F | HNSC | 1 |
| p.P181S | SKCM | 1 |
| p.S206F | HNSC | 1 |
| p.E219K | SKCM | 1 |
| p.R231H | UCEC | 1 |
| p.K259N | UCS | 1 |
| p.R112X | PAAD | 1 |
| p.E228K | SKCM | 1 |
| p.G231R | LUAD | 1 |
| p.A191T | ESCA | 1 |
| p.R182C | SKCM | 1 |
| p.T163M | UCS | 1 |
| p.A239T | ESCA | 1 |
| p.Y301H | KIRP | 1 |
| p.S217G | LIHC | 1 |
| p.R160* | PAAD | 1 |
| p.E276K | SKCM | 1 |
| p.K307N | UCS | 1 |
| p.R222H | LGG | 1 |
| p.T211M | UCS | 1 |
| p.R130X | STAD | 1 |
| p.P133S | SKCM | 1 |
| p.R143* | PAAD | 1 |
| p.R130* | STAD | 1 |
| p.R174H | LGG | 1 |
| p.D142G | KIRP | 1 |
| p.R150Q | STAD | 1 |
| p.N298S | LIHC | 1 |
| p.T167I | SKCM | 1 |
| p.G164R | LGG | 1 |
| p.T177M | PRAD | 1 |
| p.G183R | LUAD | 1 |
| p.R231H | GBM | 1 |
| p.K166T | UCEC | 1 |
| p.S108I | GBM | 1 |
| p.R254C | LUAD | 1 |
| p.R160Q | SKCM | 1 |
| p.E267K | SKCM | 1 |
| Top |
| TissGeneCNV for HS3ST6 |
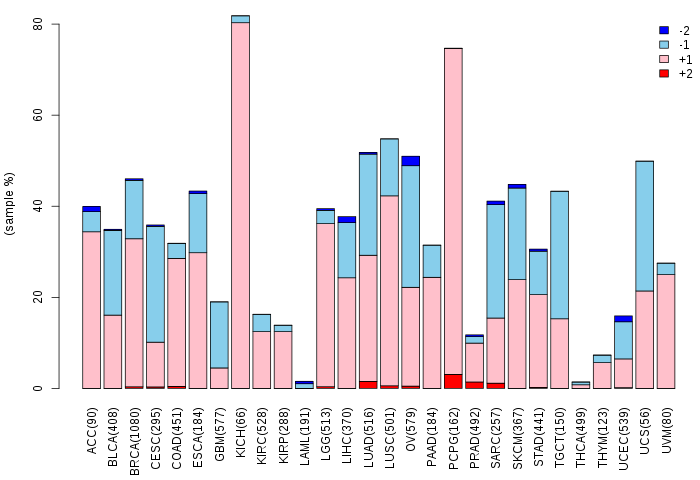
| Copy number variations of TissGene across 28 cancer types (X-axis: cancer type and Y-axis: % of CNV samples) (TCGA Gistic2_CopyNumber_Gistic2_all_data_by_genes, Gistic2 copy number data, version 2016-08-16) |
 |
| Top |
| TissGeneFusions for HS3ST6 |
| Fusion genes including TissGene (ChimerDB 3.0, 2016-12-01 and TCGA fusion Portal 2015-12-01) |
| Database | Src | Cancer type | Sample | Fusion gene | ORF | 5'-gene BP | 3'-gene BP |
| Top |
| TissGeneNet for HS3ST6 |
| Co-expressed gene networks based on protein-protein interaction data (CePIN) (TCGA IlluminaHiSeq_RNASeqV2, pan-cancer normalized log2(norm_counts+1) data, version 2016-08-16) (PINA2 ppi data) |
| Top |
| TissGeneProg for HS3ST6 |
| Kaplan-Meier plots with logrank tests of overall survival (OS) using 28 cancer types (TCGA IlluminaHiSeq_RNASeqV2, pan-cancer normalized log2(norm_counts+1) data, version 2016-08-16) (TCGA clinicalMatrix, phenotype data, version 2016-04-27) * Click on the image to enlarge it in a new window. |
 |
| Kaplan-Meier plots with logrank test of relapse free survival (RFS) using 28 cancer types (TCGA IlluminaHiSeq_RNASeqV2, pan-cancer normalized log2(norm_counts+1) data, version 2016-08-16) (TCGA clinicalMatrix, phenotype data, version 2016-04-27) * Click on the image enlarge it in a new window. |
 |
| Forest plot of Cox proportional hazard ratio (HR) and 95% CI of overall survival (OS) using 28 cancer types (TCGA IlluminaHiSeq_RNASeqV2, pan-cancer normalized log2(norm_counts+1) data, version 2016-08-16) (TCGA clinicalMatrix, phenotype data, version 2016-04-27) * Click on the image enlarge it in a new window. |
 |
| Forest plot of Cox proportional hazard ratio (HR) and 95% CI of relapse free survival (RFS) using 28 cancer types (TCGA IlluminaHiSeq_RNASeqV2, pan-cancer normalized log2(norm_counts+1) data, version 2016-08-16) (TCGA clinicalMatrix, phenotype data, version 2016-04-27) * Click on the image enlarge it in a new window. |
 |
| Top |
| TissGeneClin for HS3ST6 |
| TissGeneDrug for HS3ST6 |
| Drug information targeting TissGene (DrugBank Version 5.0.6, 2017-04-01) |
| DrugBank ID | Drug name | Drug activity | Drug type | Drug status |
| Top |
| TissGeneDisease for HS3ST6 |
| Disease information associated with TissGene (DisGeNet, 2016-06-01) |
| Disease ID | Disease name | # pubmeds | Source |
| umls:C0019348 | Herpes Simplex Infections | 2 | BeFree,LHGDN |
| umls:C0032273 | Pneumoconiosis | 1 | CTD_human |
|
Copyright 2016-Present - The University of Texas Health Science Center at Houston (UTHealth) Web File Viewing | How to Report, Fraud, Waste and Abuse | State of Texas | Statewide Search | Texas Homeland Security | Site Policies |