 |
| |
| |
| |
| |
| |
| |
|

| TissGeneSummary for PDIA2 |
 Gene summary Gene summary |
| Basic gene information | Gene symbol | PDIA2 |
| Gene name | protein disulfide isomerase family A, member 2 | |
| Synonyms | PDA2|PDI|PDIP|PDIR | |
| Cytomap | UCSC genome browser: 16p13.3 | |
| Type of gene | protein-coding | |
| RefGenes | NM_006849.2, | |
| Description | Rho GDP dissociation inhibitor gammapancreas-specific protein disulfide isomerasepancreatic protein disulfide isomeraseprotein disulfide isomerase A2protein disulfide isomerase, pancreaticprotein disulfide isomerase-associated 2protein disulfide-iso | |
| Modification date | 20141222 | |
| dbXrefs | MIM : 608012 | |
| HGNC : HGNC | ||
| Ensembl : ENSG00000185615 | ||
| HPRD : 07617 | ||
| Vega : OTTHUMG00000064891 | ||
| Protein | UniProt: go to UniProt's Cross Reference DB Table | |
| Expression | CleanEX: HS_PDIA2 | |
| BioGPS: 64714 | ||
| Pathway | NCI Pathway Interaction Database: PDIA2 | |
| KEGG: PDIA2 | ||
| REACTOME: PDIA2 | ||
| Pathway Commons: PDIA2 | ||
| Context | iHOP: PDIA2 | |
| ligand binding site mutation search in PubMed: PDIA2 | ||
| UCL Cancer Institute: PDIA2 | ||
| Assigned class in TissGDB* | A | |
| Included tissue-specific gene expression resources | HPA,TiGER,GTEx | |
| Specific-tissues in normal samples (assigned by TissGDB using HPA, TiGER, and GTEx) | Pancreas | |
| Cancer types related to the specific-tissues in cancer samples (assigned by TissGDB using TCGA) | PAAD | |
| Reference showing the relevant tissue of PDIA2 | CTLA-4 suppresses the pathogenicity of self antigen-specific T cells by cell-intrinsic and cell-extrinsic mechanisms. Ise W, Kohyama M, Nutsch KM, Lee HM, Suri A, Unanue ER, Murphy TL, Murphy KM. Nat Immunol. 2010 Feb;11(2):129-35. doi: 10.1038/ni.1835. Epub 2009 Dec 27 (pmid:20037585) go to article | |
| Description by TissGene annotations | ||
| * Class A consists of genes with literature evidence and is part of the cTissGenes. Class B consists of only cTissGenes without additional evidence. The remaining genes belong to Class C. |
| Gene ontology having evidence of Inferred from Direct Assay (IDA) from Entrez |
| GO ID | GO term | PubMed ID |
| Top |
| TissGeneExp for PDIA2 |
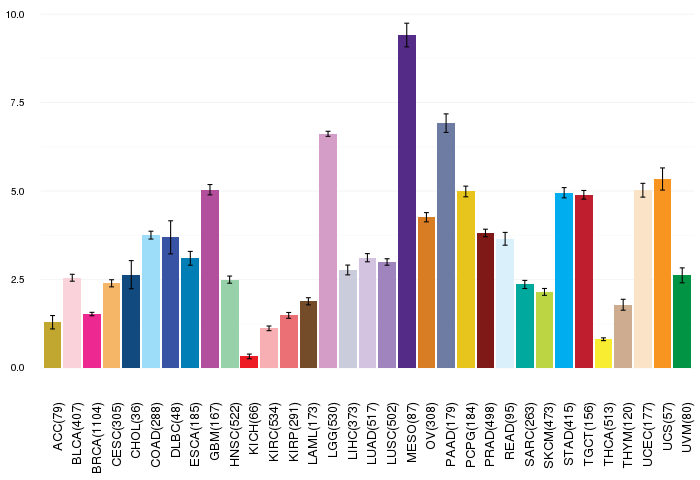
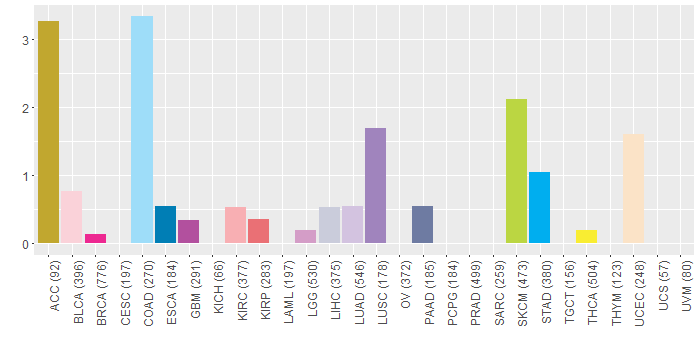
| Gene expressions across 28 cancer types (X-axis: cancer type and Y-axis: log2(norm_counts+1)) (TCGA IlluminaHiSeq_RNASeqV2, pan-cancer normalized log2(norm_counts+1) data, version 2016-08-16) |
 |
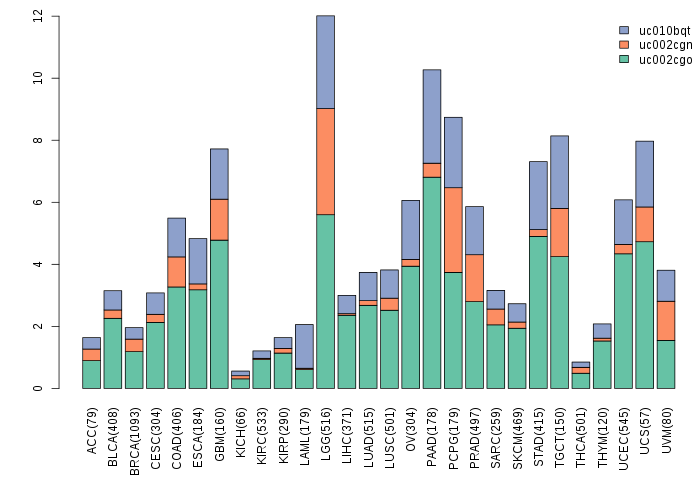
| Gene isoform expressions across 28 cancer types (X-axis: cancer type and Y-axis: log2(norm_counts+1)) (TCGA pan-cancer tcga_rsem_isoform_tpm, version 2016-09-01) |
 |
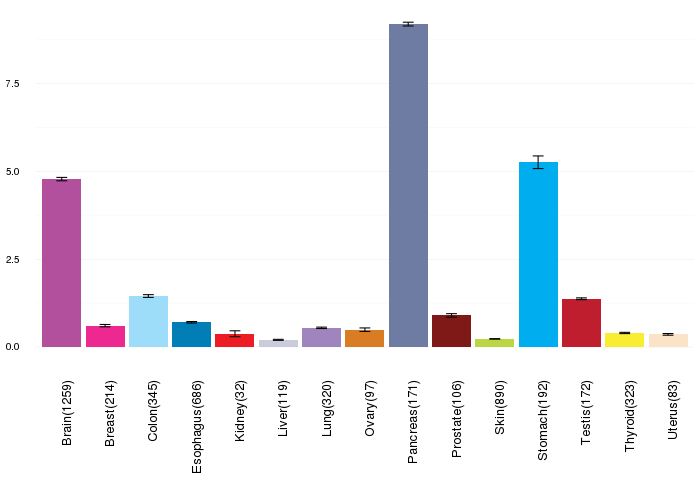
| Gene expressions across normal tissues of GTEx data (GTEx GTEx_Analysis_v6_RNA-seq_RNA-SeQCv1.1.8_gene_rpkm.gct) - Here, we shows the matched tissue types only among our 28 cancer types. |
 |
| Different expressions across 14 cancer types with more than 10 samples between matched tumors and normals (X-axis: cancer type and Y-axis: log2(norm_counts+1)) (TCGA IlluminaHiSeq_RNASeqV2, pan-cancer normalized log2(norm_counts+1) data, version 2016-08-16) |
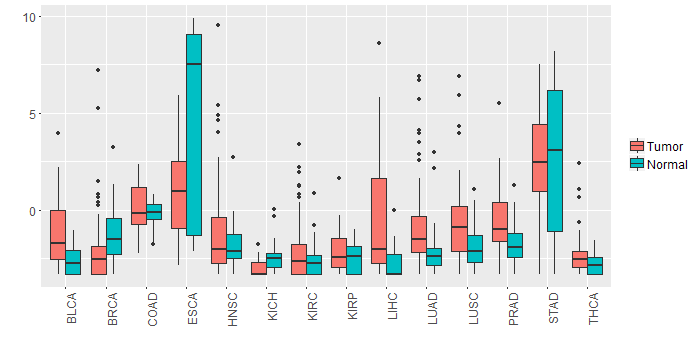 |
| - Significantly differentially expressed cancer types and information. (|Fold change|>1 and FDR<0.05) |
| Cancer type | Mean(exp) in tumor | Mean(exp) in matched normal | Log2FC | P-val. | FDR |
| LIHC | -0.514547957 | -2.790441957 | 2.275894 | 2.43E-06 | 1.20E-05 |
| BLCA | -1.00309522 | -2.596437326 | 1.593342105 | 0.00424 | 0.023457114 |
| PRAD | -0.621147649 | -1.683503419 | 1.062355769 | 0.00023 | 0.000884099 |
| LUAD | -0.76172444 | -2.215265819 | 1.453541379 | 0.000106 | 0.000267444 |
| LUSC | -0.4942978 | -1.953813486 | 1.459515686 | 6.30E-05 | 0.000133342 |
| Top |
| TissGene-miRNA for PDIA2 |
| Significantly anti-correlated miRNAs of TissGene across 28 cancer types (Gene-miRNA relations from TargetScanHuman Relsease 7.1, Conserved_Site_Context_Scores.txt.zip, 06.01.2016) (TCGA IlluminaHiSeq_miRNASeq, log2(RPM+1) data, version 2016-11-21) (TCGA IlluminaHiSeq_RNASeqV2, log2(normalized_count+1) data, version 2016-08-16) (Spearman’s Rank Correlation (p-value<0.05 and coefficient<-0.25)) |
| Cancer type | miRNA id | miRNA accession | P-val. | Coeff. | # samples |
| Top |
| TissGeneMut for PDIA2 |
| TissGeneSNV for PDIA2 |
| nsSNV counts per each loci. Different colors of circles represent different cancer types. Circle size denotes number of samples. (TCGA somatic mutation (SNPs and small INDELs) data, version 2016-04-25) * Click on the image to enlarge it in a new window. |
 |
 |
| Somatic nucleotide variants of TissGene across 28 cancer types (X-axis: cancer type and Y-axis: % of mutated samples) The numbers in parentheses are numbers of samples with mutation (nsSNVs). (TCGA somatic mutation (SNPs and small INDELs) data, version 2016-04-25) |
 |
| - nsSNVs sorted by frequency. |
| AAchange | Cancer type | # samples |
| p.L276H | LUAD | 1 |
| p.L276F | COAD | 1 |
| p.P502S | COAD | 1 |
| p.R388Q | COAD | 1 |
| p.E452K | KIRC | 1 |
| p.E185K | COAD | 1 |
| p.A188T | GBM | 1 |
| p.G72V | COAD | 1 |
| p.P502S | BRCA | 1 |
| p.F262L | BLCA | 1 |
| p.A348E | LUSC | 1 |
| p.T135A | UCEC | 1 |
| p.G296D | KIRP | 1 |
| p.E32Q | BLCA | 1 |
| p.S30W | THCA | 1 |
| p.N319K | ACC | 1 |
| p.D196N | SKCM | 1 |
| p.A272T | HNSC | 1 |
| p.A89G | LUAD | 1 |
| p.E145K | ACC | 1 |
| p.P60L | SKCM | 1 |
| p.A78V | COAD | 1 |
| p.G460S | COAD | 1 |
| p.L376I | UCEC | 1 |
| p.R303C | SKCM | 1 |
| p.R231W | COAD | 1 |
| p.G395D | STAD | 1 |
| p.E405K | SKCM | 1 |
| p.L97M | UCEC | 1 |
| p.E261K | SKCM | 1 |
| p.A402D | COAD | 1 |
| p.E505K | SKCM | 1 |
| p.P498H | STAD | 1 |
| p.G395S | SKCM | 1 |
| p.A515T | KIRC | 1 |
| p.L158P | CHOL | 1 |
| p.L45F | SKCM | 1 |
| p.L63M | LUAD | 1 |
| p.R149Q | SKCM | 1 |
| p.F304L | LIHC | 1 |
| p.Q379K | ESCA | 1 |
| p.T129M | UCEC | 1 |
| p.I270F | LIHC | 1 |
| p.D206N | SKCM | 1 |
| p.E331Q | LUSC | 1 |
| p.W428S | HNSC | 1 |
| p.R249P | LUSC | 1 |
| p.T481I | LGG | 1 |
| p.K412E | STAD | 1 |
| p.R291W | PAAD | 1 |
| p.R171W | COAD | 1 |
| p.R124L | STAD | 1 |
| p.V252G | STAD | 1 |
| p.P60S | SKCM | 1 |
| p.A104V | BLCA | 1 |
| p.R124C | ACC | 1 |
| Top |
| TissGeneCNV for PDIA2 |
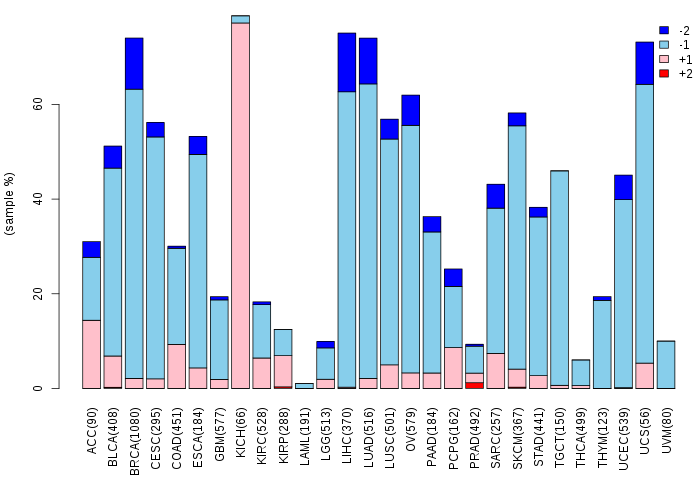
| Copy number variations of TissGene across 28 cancer types (X-axis: cancer type and Y-axis: % of CNV samples) (TCGA Gistic2_CopyNumber_Gistic2_all_data_by_genes, Gistic2 copy number data, version 2016-08-16) |
 |
| Top |
| TissGeneFusions for PDIA2 |
| Fusion genes including TissGene (ChimerDB 3.0, 2016-12-01 and TCGA fusion Portal 2015-12-01) |
| Database | Src | Cancer type | Sample | Fusion gene | ORF | 5'-gene BP | 3'-gene BP |
| Top |
| TissGeneNet for PDIA2 |
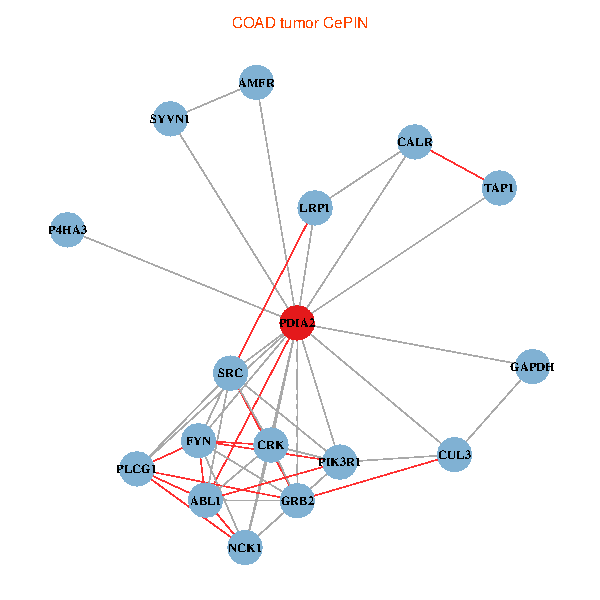
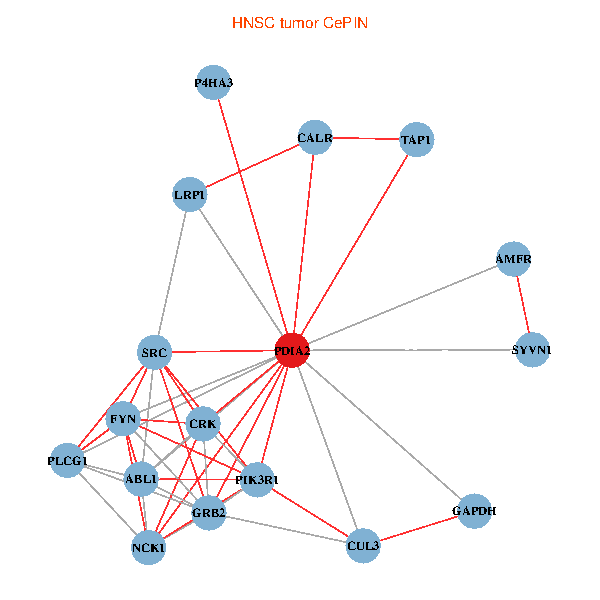
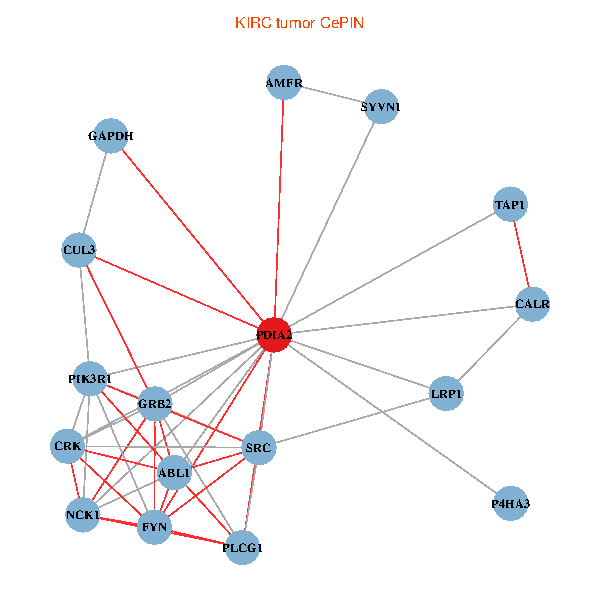
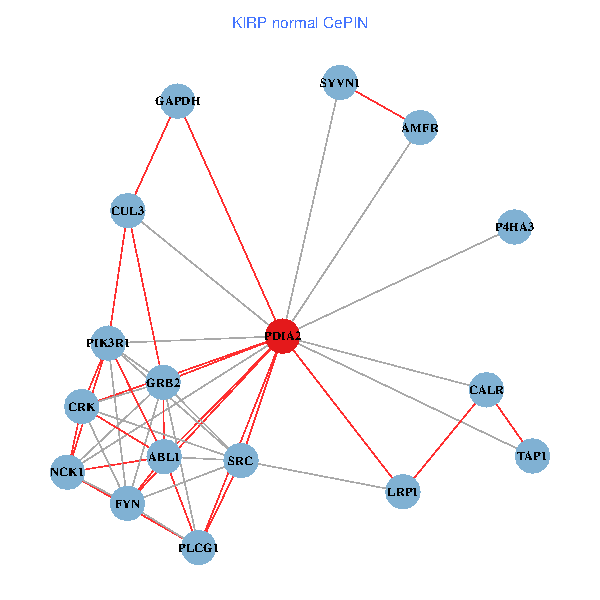
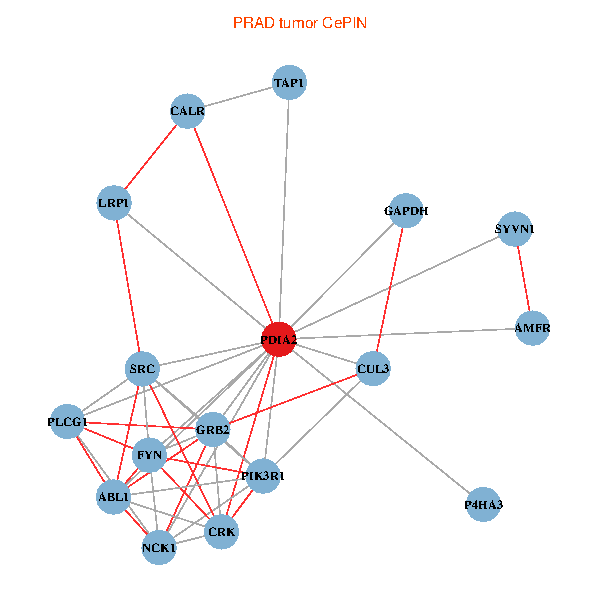
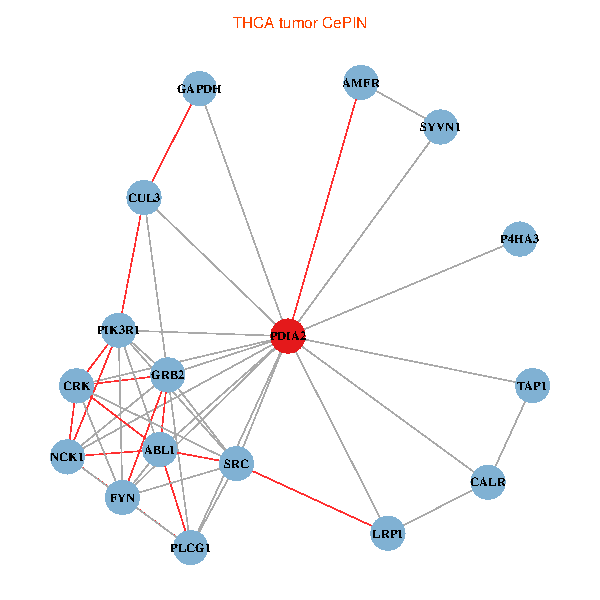
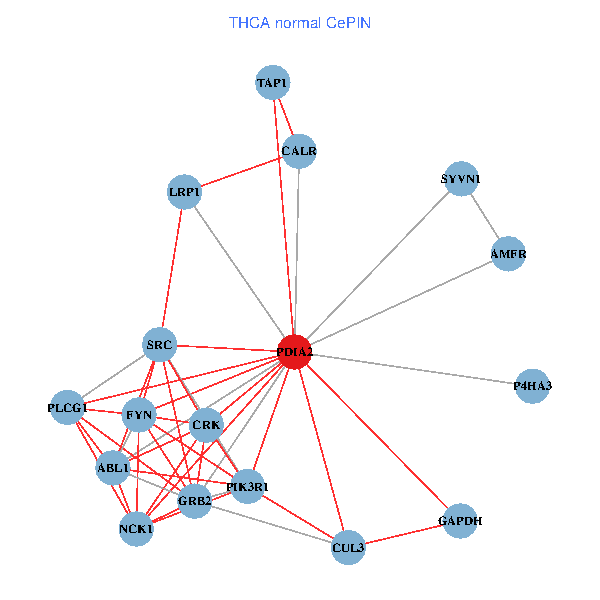
| Co-expressed gene networks based on protein-protein interaction data (CePIN) (TCGA IlluminaHiSeq_RNASeqV2, pan-cancer normalized log2(norm_counts+1) data, version 2016-08-16) (PINA2 ppi data) |
| BRCA (tumor) | BRCA (normal) |
| PDIA2, NCK1, PLCG1, GRB2, SRC, CUL3, GAPDH, AMFR, FYN, PIK3R1, ABL1, CALR, CRK, SYVN1, LRP1, TAP1, P4HA3 (tumor) | PDIA2, NCK1, PLCG1, GRB2, SRC, CUL3, GAPDH, AMFR, FYN, PIK3R1, ABL1, CALR, CRK, SYVN1, LRP1, TAP1, P4HA3 (normal) |
 |  |
| COAD (tumor) | COAD (normal) |
| PDIA2, NCK1, PLCG1, GRB2, SRC, CUL3, GAPDH, AMFR, FYN, PIK3R1, ABL1, CALR, CRK, SYVN1, LRP1, TAP1, P4HA3 (tumor) | PDIA2, NCK1, PLCG1, GRB2, SRC, CUL3, GAPDH, AMFR, FYN, PIK3R1, ABL1, CALR, CRK, SYVN1, LRP1, TAP1, P4HA3 (normal) |
 |  |
| HNSC (tumor) | HNSC (normal) |
| PDIA2, NCK1, PLCG1, GRB2, SRC, CUL3, GAPDH, AMFR, FYN, PIK3R1, ABL1, CALR, CRK, SYVN1, LRP1, TAP1, P4HA3 (tumor) | PDIA2, NCK1, PLCG1, GRB2, SRC, CUL3, GAPDH, AMFR, FYN, PIK3R1, ABL1, CALR, CRK, SYVN1, LRP1, TAP1, P4HA3 (normal) |
 |  |
| KICH (tumor) | KICH (normal) |
| PDIA2, NCK1, PLCG1, GRB2, SRC, CUL3, GAPDH, AMFR, FYN, PIK3R1, ABL1, CALR, CRK, SYVN1, LRP1, TAP1, P4HA3 (tumor) | PDIA2, NCK1, PLCG1, GRB2, SRC, CUL3, GAPDH, AMFR, FYN, PIK3R1, ABL1, CALR, CRK, SYVN1, LRP1, TAP1, P4HA3 (normal) |
 |  |
| KIRC (tumor) | KIRC (normal) |
| PDIA2, NCK1, PLCG1, GRB2, SRC, CUL3, GAPDH, AMFR, FYN, PIK3R1, ABL1, CALR, CRK, SYVN1, LRP1, TAP1, P4HA3 (tumor) | PDIA2, NCK1, PLCG1, GRB2, SRC, CUL3, GAPDH, AMFR, FYN, PIK3R1, ABL1, CALR, CRK, SYVN1, LRP1, TAP1, P4HA3 (normal) |
 |  |
| KIRP (tumor) | KIRP (normal) |
| PDIA2, NCK1, PLCG1, GRB2, SRC, CUL3, GAPDH, AMFR, FYN, PIK3R1, ABL1, CALR, CRK, SYVN1, LRP1, TAP1, P4HA3 (tumor) | PDIA2, NCK1, PLCG1, GRB2, SRC, CUL3, GAPDH, AMFR, FYN, PIK3R1, ABL1, CALR, CRK, SYVN1, LRP1, TAP1, P4HA3 (normal) |
 |  |
| LIHC (tumor) | LIHC (normal) |
| PDIA2, NCK1, PLCG1, GRB2, SRC, CUL3, GAPDH, AMFR, FYN, PIK3R1, ABL1, CALR, CRK, SYVN1, LRP1, TAP1, P4HA3 (tumor) | PDIA2, NCK1, PLCG1, GRB2, SRC, CUL3, GAPDH, AMFR, FYN, PIK3R1, ABL1, CALR, CRK, SYVN1, LRP1, TAP1, P4HA3 (normal) |
 |  |
| LUAD (tumor) | LUAD (normal) |
| PDIA2, NCK1, PLCG1, GRB2, SRC, CUL3, GAPDH, AMFR, FYN, PIK3R1, ABL1, CALR, CRK, SYVN1, LRP1, TAP1, P4HA3 (tumor) | PDIA2, NCK1, PLCG1, GRB2, SRC, CUL3, GAPDH, AMFR, FYN, PIK3R1, ABL1, CALR, CRK, SYVN1, LRP1, TAP1, P4HA3 (normal) |
 |  |
| LUSC (tumor) | LUSC (normal) |
| PDIA2, NCK1, PLCG1, GRB2, SRC, CUL3, GAPDH, AMFR, FYN, PIK3R1, ABL1, CALR, CRK, SYVN1, LRP1, TAP1, P4HA3 (tumor) | PDIA2, NCK1, PLCG1, GRB2, SRC, CUL3, GAPDH, AMFR, FYN, PIK3R1, ABL1, CALR, CRK, SYVN1, LRP1, TAP1, P4HA3 (normal) |
 |  |
| PRAD (tumor) | PRAD (normal) |
| PDIA2, NCK1, PLCG1, GRB2, SRC, CUL3, GAPDH, AMFR, FYN, PIK3R1, ABL1, CALR, CRK, SYVN1, LRP1, TAP1, P4HA3 (tumor) | PDIA2, NCK1, PLCG1, GRB2, SRC, CUL3, GAPDH, AMFR, FYN, PIK3R1, ABL1, CALR, CRK, SYVN1, LRP1, TAP1, P4HA3 (normal) |
 |  |
| STAD (tumor) | STAD (normal) |
| PDIA2, NCK1, PLCG1, GRB2, SRC, CUL3, GAPDH, AMFR, FYN, PIK3R1, ABL1, CALR, CRK, SYVN1, LRP1, TAP1, P4HA3 (tumor) | PDIA2, NCK1, PLCG1, GRB2, SRC, CUL3, GAPDH, AMFR, FYN, PIK3R1, ABL1, CALR, CRK, SYVN1, LRP1, TAP1, P4HA3 (normal) |
 |  |
| THCA (tumor) | THCA (normal) |
| PDIA2, NCK1, PLCG1, GRB2, SRC, CUL3, GAPDH, AMFR, FYN, PIK3R1, ABL1, CALR, CRK, SYVN1, LRP1, TAP1, P4HA3 (tumor) | PDIA2, NCK1, PLCG1, GRB2, SRC, CUL3, GAPDH, AMFR, FYN, PIK3R1, ABL1, CALR, CRK, SYVN1, LRP1, TAP1, P4HA3 (normal) |
 |  |
| Top |
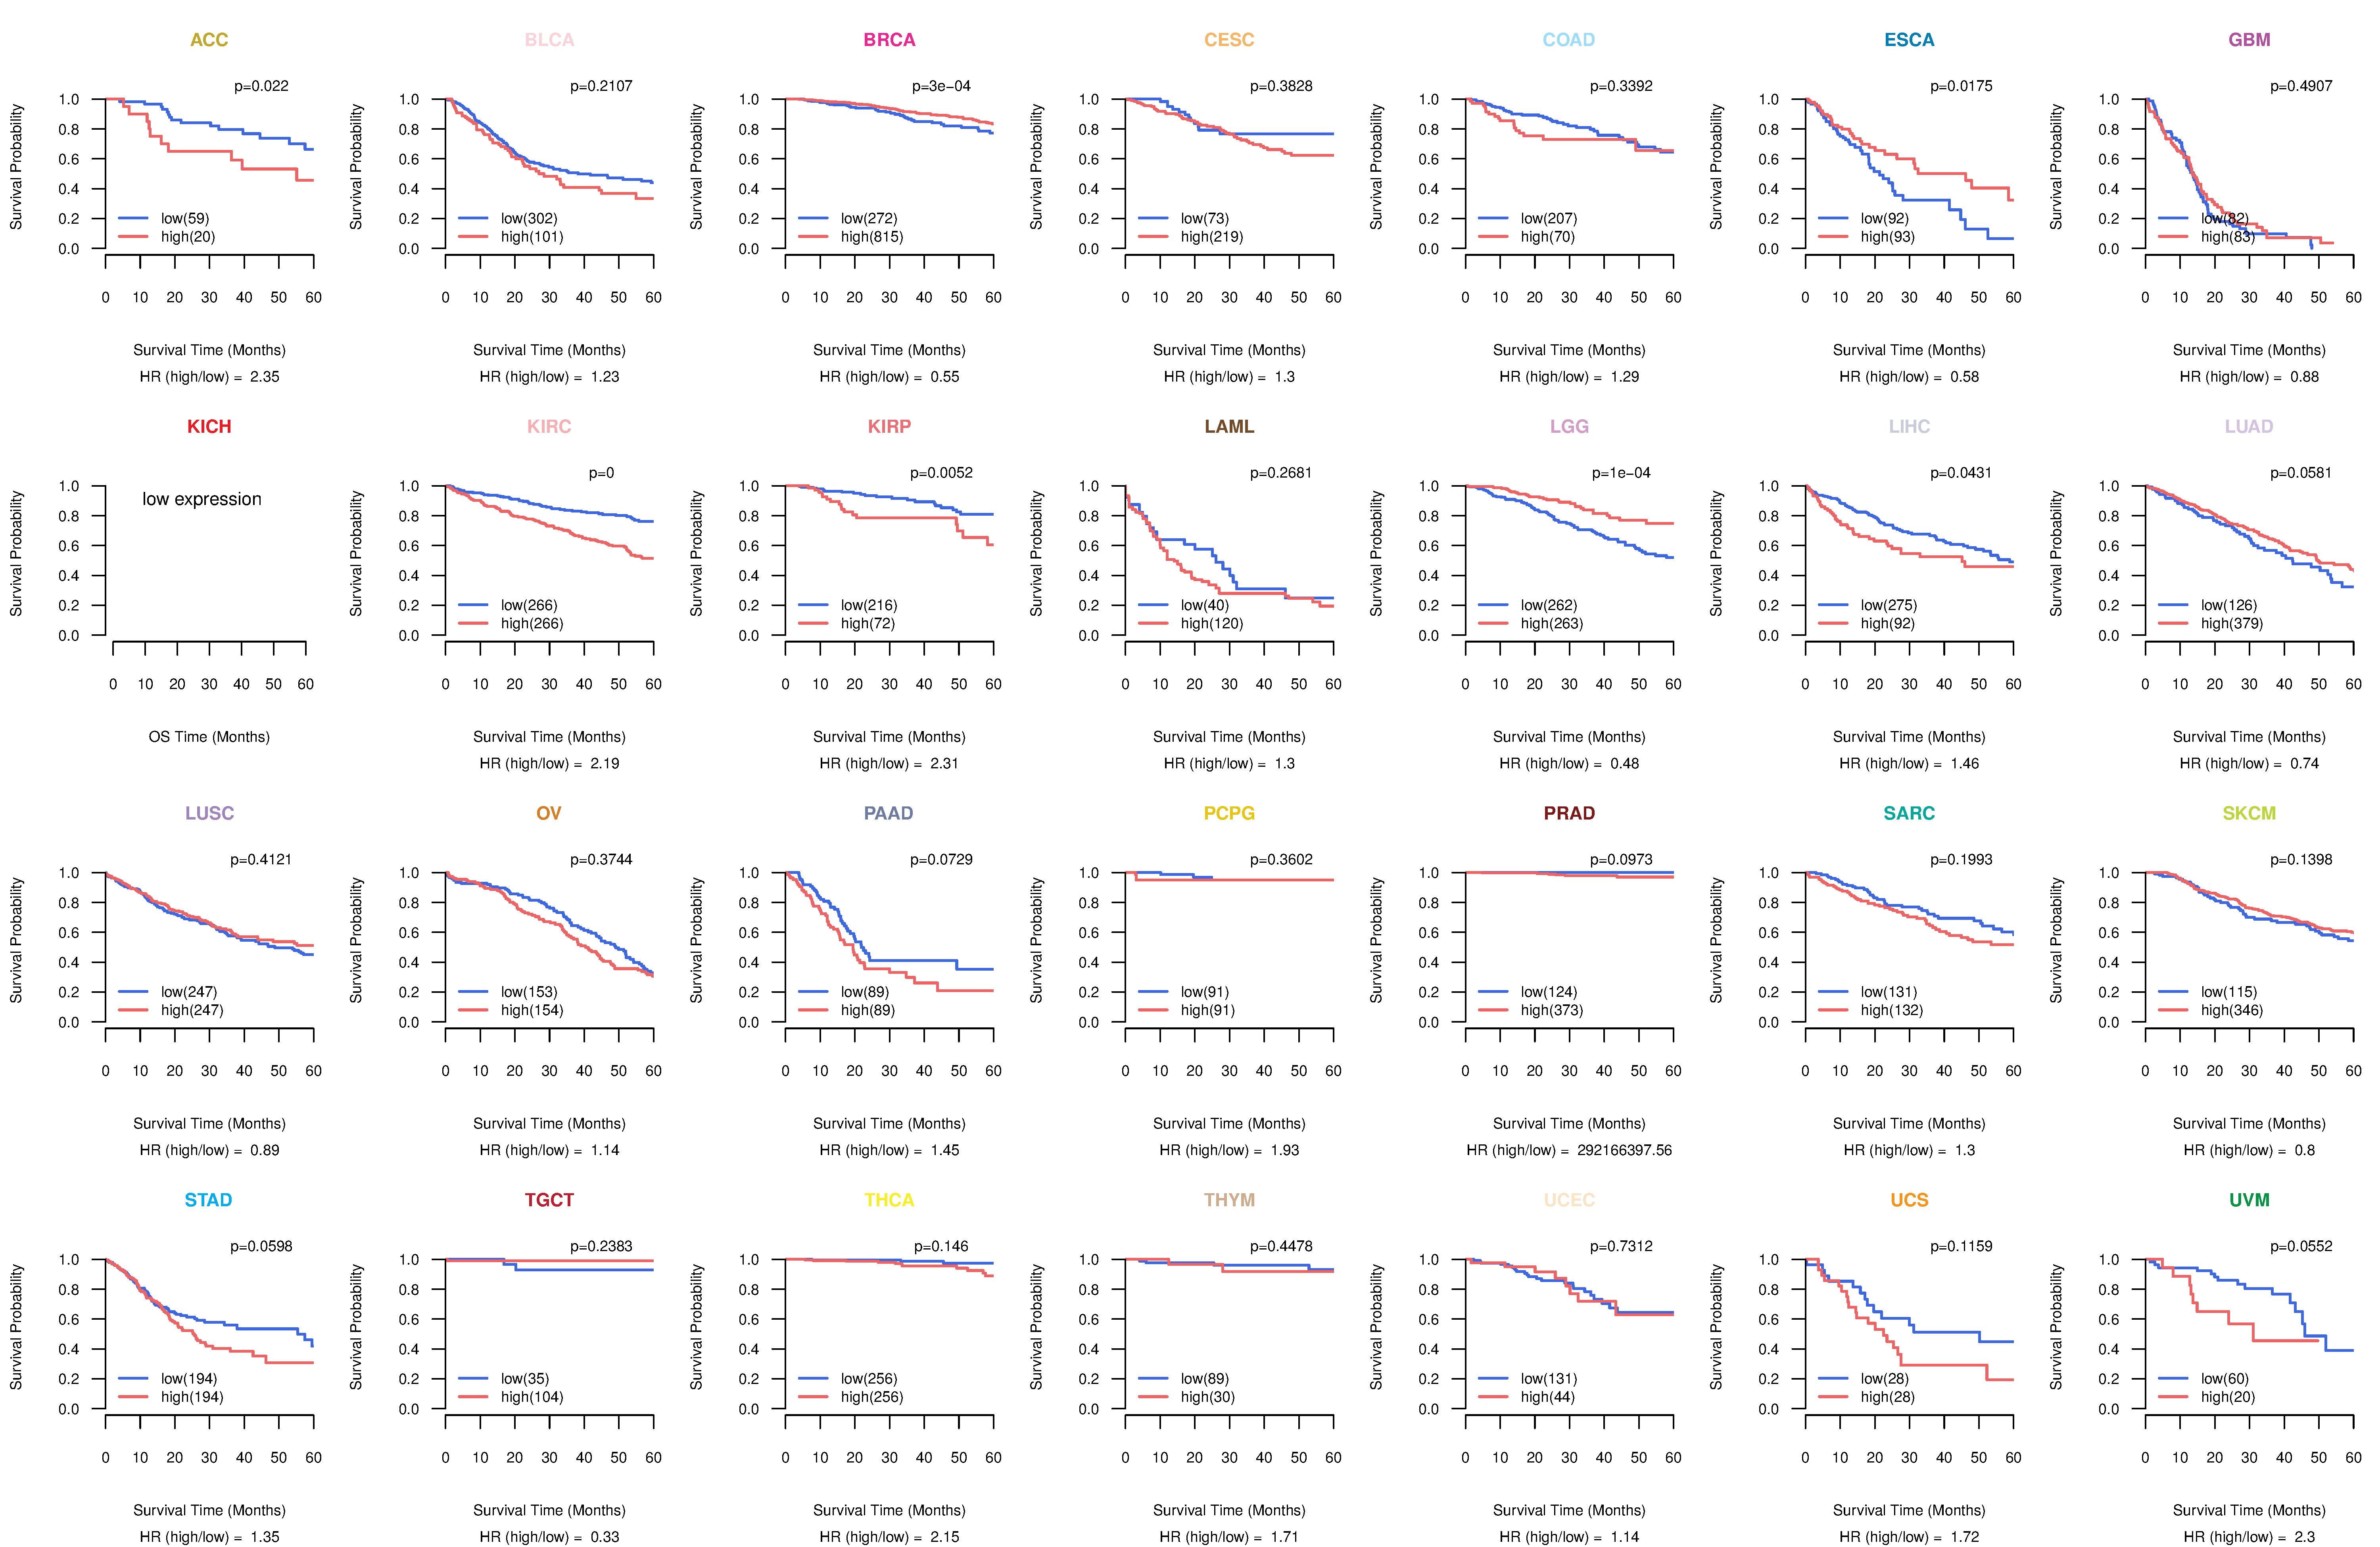
| TissGeneProg for PDIA2 |
| Kaplan-Meier plots with logrank tests of overall survival (OS) using 28 cancer types (TCGA IlluminaHiSeq_RNASeqV2, pan-cancer normalized log2(norm_counts+1) data, version 2016-08-16) (TCGA clinicalMatrix, phenotype data, version 2016-04-27) * Click on the image to enlarge it in a new window. |
 |
| Kaplan-Meier plots with logrank test of relapse free survival (RFS) using 28 cancer types (TCGA IlluminaHiSeq_RNASeqV2, pan-cancer normalized log2(norm_counts+1) data, version 2016-08-16) (TCGA clinicalMatrix, phenotype data, version 2016-04-27) * Click on the image enlarge it in a new window. |
 |
| Forest plot of Cox proportional hazard ratio (HR) and 95% CI of overall survival (OS) using 28 cancer types (TCGA IlluminaHiSeq_RNASeqV2, pan-cancer normalized log2(norm_counts+1) data, version 2016-08-16) (TCGA clinicalMatrix, phenotype data, version 2016-04-27) * Click on the image enlarge it in a new window. |
 |
| Forest plot of Cox proportional hazard ratio (HR) and 95% CI of relapse free survival (RFS) using 28 cancer types (TCGA IlluminaHiSeq_RNASeqV2, pan-cancer normalized log2(norm_counts+1) data, version 2016-08-16) (TCGA clinicalMatrix, phenotype data, version 2016-04-27) * Click on the image enlarge it in a new window. |
 |
| Top |
| TissGeneClin for PDIA2 |
| TissGeneDrug for PDIA2 |
| Drug information targeting TissGene (DrugBank Version 5.0.6, 2017-04-01) |
| DrugBank ID | Drug name | Drug activity | Drug type | Drug status |
| Top |
| TissGeneDisease for PDIA2 |
| Disease information associated with TissGene (DisGeNet, 2016-06-01) |
| Disease ID | Disease name | # pubmeds | Source |
| umls:C0003130 | Anoxia | 1 | LHGDN |
| umls:C0003850 | Arteriosclerosis | 1 | BeFree |
| umls:C0004153 | Atherosclerosis | 1 | BeFree |
| umls:C0006142 | Malignant neoplasm of breast | 1 | BeFree |
| umls:C0011847 | Diabetes | 1 | BeFree |
| umls:C0011849 | Diabetes Mellitus | 1 | BeFree |
| umls:C0011860 | Diabetes Mellitus, Non-Insulin-Dependent | 1 | BeFree |
| umls:C0018798 | Congenital Heart Defects | 1 | GAD |
| umls:C0027627 | Neoplasm Metastasis | 1 | BeFree |
| umls:C0027819 | Neuroblastoma | 1 | BeFree |
| umls:C0079504 | Hermanski-Pudlak Syndrome | 1 | BeFree |
| umls:C0149630 | Bicuspid aortic valve | 1 | BeFree |
| umls:C0375023 | Respiratory syncytial virus (RSV) infection in conditions classified elsewhere and of unspecified site | 1 | BeFree |
| umls:C0678222 | Breast Carcinoma | 1 | BeFree |
| umls:C0700095 | Central neuroblastoma | 1 | BeFree |
| umls:C2239176 | Liver carcinoma | 1 | BeFree |
| umls:C3542024 | AORTIC VALVE DISEASE 2 | 1 | BeFree |
|
Copyright 2016-Present - The University of Texas Health Science Center at Houston (UTHealth) Web File Viewing | How to Report, Fraud, Waste and Abuse | State of Texas | Statewide Search | Texas Homeland Security | Site Policies |