 |
| |
| |
| |
| |
| |
| |
|

| TissGeneSummary for SLC13A3 |
 Gene summary Gene summary |
| Basic gene information | Gene symbol | SLC13A3 |
| Gene name | solute carrier family 13 (sodium-dependent dicarboxylate transporter), member 3 | |
| Synonyms | NADC3|SDCT2 | |
| Cytomap | UCSC genome browser: 20q13.12 | |
| Type of gene | protein-coding | |
| RefGenes | NM_001011554.2, NM_001193339.1,NM_001193340.1,NM_001193342.1,NM_022829.5, | |
| Description | Na(+)/dicarboxylate cotransporter 3hNaDC3naDC-3sodium-dependent high affinity dicarboxylate transporter 3sodium-dependent high-affinity dicarboxylate transporter 2solute carrier family 13 member 3 | |
| Modification date | 20141207 | |
| dbXrefs | MIM : 606411 | |
| HGNC : HGNC | ||
| Ensembl : ENSG00000158296 | ||
| HPRD : 10450 | ||
| Vega : OTTHUMG00000033042 | ||
| Protein | UniProt: go to UniProt's Cross Reference DB Table | |
| Expression | CleanEX: HS_SLC13A3 | |
| BioGPS: 64849 | ||
| Pathway | NCI Pathway Interaction Database: SLC13A3 | |
| KEGG: SLC13A3 | ||
| REACTOME: SLC13A3 | ||
| Pathway Commons: SLC13A3 | ||
| Context | iHOP: SLC13A3 | |
| ligand binding site mutation search in PubMed: SLC13A3 | ||
| UCL Cancer Institute: SLC13A3 | ||
| Assigned class in TissGDB* | B | |
| Included tissue-specific gene expression resources | HPA,TiGER,GTEx | |
| Specific-tissues in normal samples (assigned by TissGDB using HPA, TiGER, and GTEx) | Kidney | |
| Cancer types related to the specific-tissues in cancer samples (assigned by TissGDB using TCGA) | KIRC,KIRP,KICH | |
| Reference showing the relevant tissue of SLC13A3 | ||
| Description by TissGene annotations | ||
| * Class A consists of genes with literature evidence and is part of the cTissGenes. Class B consists of only cTissGenes without additional evidence. The remaining genes belong to Class C. |
| Gene ontology having evidence of Inferred from Direct Assay (IDA) from Entrez |
| GO ID | GO term | PubMed ID |
| Top |
| TissGeneExp for SLC13A3 |
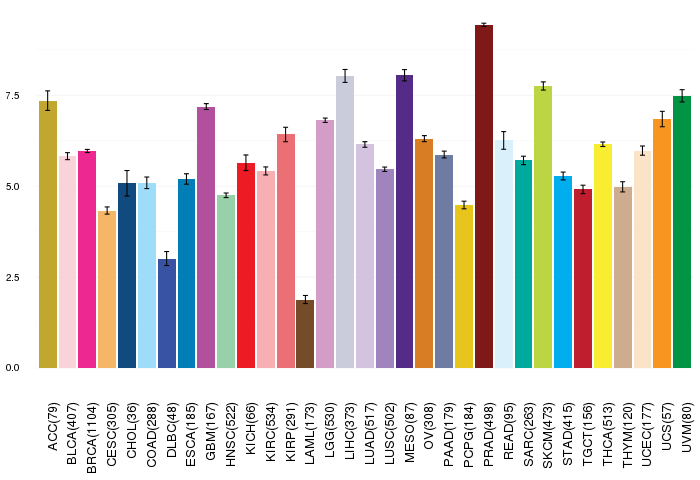
| Gene expressions across 28 cancer types (X-axis: cancer type and Y-axis: log2(norm_counts+1)) (TCGA IlluminaHiSeq_RNASeqV2, pan-cancer normalized log2(norm_counts+1) data, version 2016-08-16) |
 |
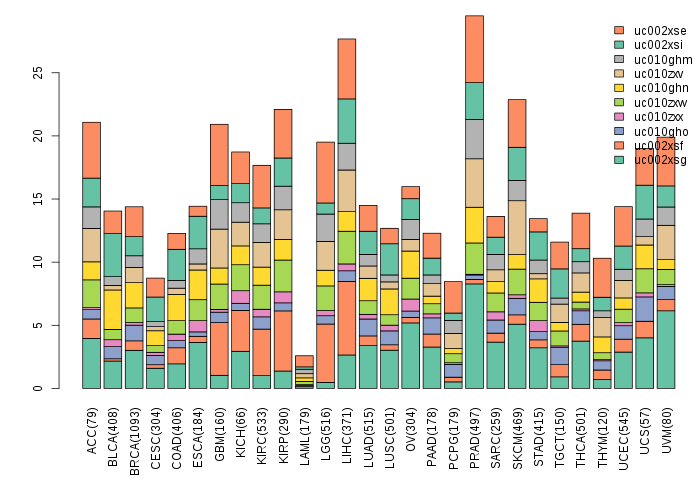
| Gene isoform expressions across 28 cancer types (X-axis: cancer type and Y-axis: log2(norm_counts+1)) (TCGA pan-cancer tcga_rsem_isoform_tpm, version 2016-09-01) |
 |
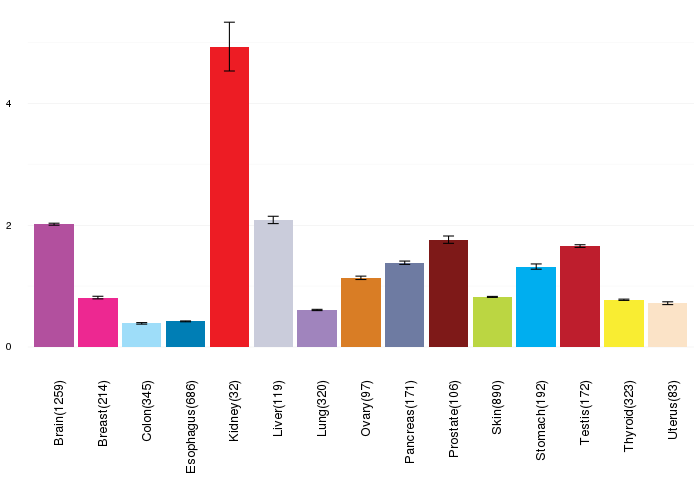
| Gene expressions across normal tissues of GTEx data (GTEx GTEx_Analysis_v6_RNA-seq_RNA-SeQCv1.1.8_gene_rpkm.gct) - Here, we shows the matched tissue types only among our 28 cancer types. |
 |
| Different expressions across 14 cancer types with more than 10 samples between matched tumors and normals (X-axis: cancer type and Y-axis: log2(norm_counts+1)) (TCGA IlluminaHiSeq_RNASeqV2, pan-cancer normalized log2(norm_counts+1) data, version 2016-08-16) |
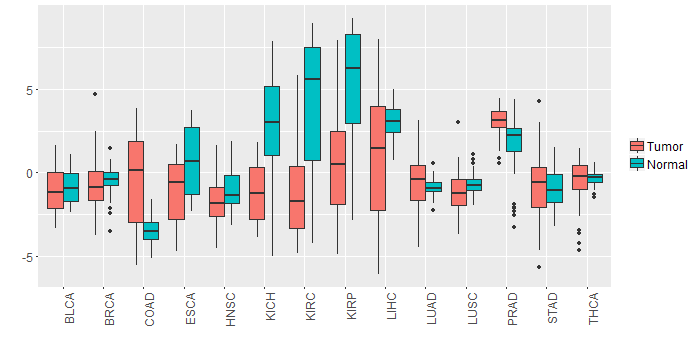 |
| - Significantly differentially expressed cancer types and information. (|Fold change|>1 and FDR<0.05) |
| Cancer type | Mean(exp) in tumor | Mean(exp) in matched normal | Log2FC | P-val. | FDR |
| KIRP | 0.601910482 | 5.227144857 | -4.625234375 | 9.36E-07 | 4.80E-06 |
| PRAD | 3.095381636 | 1.60212779 | 1.493253846 | 6.11E-07 | 4.54E-06 |
| KICH | -1.250744518 | 2.847611482 | -4.098356 | 8.81E-06 | 2.81E-05 |
| KIRC | -1.140357574 | 4.058299371 | -5.198656944 | 2.06E-15 | 1.07E-14 |
| LIHC | 1.154249482 | 3.045941482 | -1.891692 | 0.00137 | 0.003652785 |
| COAD | -0.537714518 | -3.567264518 | 3.02955 | 2.68E-05 | 0.00011079 |
| Top |
| TissGene-miRNA for SLC13A3 |
| Significantly anti-correlated miRNAs of TissGene across 28 cancer types (Gene-miRNA relations from TargetScanHuman Relsease 7.1, Conserved_Site_Context_Scores.txt.zip, 06.01.2016) (TCGA IlluminaHiSeq_miRNASeq, log2(RPM+1) data, version 2016-11-21) (TCGA IlluminaHiSeq_RNASeqV2, log2(normalized_count+1) data, version 2016-08-16) (Spearman’s Rank Correlation (p-value<0.05 and coefficient<-0.25)) |
| Cancer type | miRNA id | miRNA accession | P-val. | Coeff. | # samples |
| Top |
| TissGeneMut for SLC13A3 |
| TissGeneSNV for SLC13A3 |
| nsSNV counts per each loci. Different colors of circles represent different cancer types. Circle size denotes number of samples. (TCGA somatic mutation (SNPs and small INDELs) data, version 2016-04-25) * Click on the image to enlarge it in a new window. |
 |
 |
| Somatic nucleotide variants of TissGene across 28 cancer types (X-axis: cancer type and Y-axis: % of mutated samples) The numbers in parentheses are numbers of samples with mutation (nsSNVs). (TCGA somatic mutation (SNPs and small INDELs) data, version 2016-04-25) |
 |
| - nsSNVs sorted by frequency. |
| AAchange | Cancer type | # samples |
| p.R227C | SKCM | 3 |
| p.K166N | OV | 1 |
| p.T547R | HNSC | 1 |
| p.I316T | KIRP | 1 |
| p.S173I | STAD | 1 |
| p.I430F | LIHC | 1 |
| p.F349L | BLCA | 1 |
| p.D205G | SKCM | 1 |
| p.S526* | BLCA | 1 |
| p.L549F | SKCM | 1 |
| p.V494F | UCEC | 1 |
| p.I438V | READ | 1 |
| p.S241* | LUAD | 1 |
| p.A533T | UCEC | 1 |
| p.R325* | SKCM | 1 |
| p.R325G | LUAD | 1 |
| p.E497G | LUAD | 1 |
| p.R396M | LUAD | 1 |
| p.E460D | UCS | 1 |
| p.T410R | GBM | 1 |
| p.R329Q | LGG | 1 |
| p.F299Y | HNSC | 1 |
| p.Q123* | SKCM | 1 |
| p.K232M | LUAD | 1 |
| p.A535T | UCEC | 1 |
| p.L459M | READ | 1 |
| p.P215S | SKCM | 1 |
| p.G39D | COAD | 1 |
| p.P464S | SKCM | 1 |
| p.S176R | STAD | 1 |
| p.A146T | BLCA | 1 |
| p.G442C | STAD | 1 |
| p.W246X | SKCM | 1 |
| p.A248D | SARC | 1 |
| p.R169* | SKCM | 1 |
| p.P153S | SKCM | 1 |
| p.R317I | BLCA | 1 |
| p.W309* | SKCM | 1 |
| p.R451C | SKCM | 1 |
| p.S143G | STAD | 1 |
| p.I297L | SKCM | 1 |
| p.E444Q | LUSC | 1 |
| p.W259X | SKCM | 1 |
| p.S237F | SKCM | 1 |
| p.S536Y | LUSC | 1 |
| p.R501C | SKCM | 1 |
| p.R169X | SKCM | 1 |
| p.G454W | LUAD | 1 |
| p.L285V | HNSC | 1 |
| p.L348I | KIRP | 1 |
| p.W231* | HNSC | 1 |
| p.P397H | LUAD | 1 |
| p.M150V | KIRC | 1 |
| p.P463S | KIRP | 1 |
| p.A146T | READ | 1 |
| p.Q572* | SKCM | 1 |
| p.L235H | HNSC | 1 |
| p.E104K | LUAD | 1 |
| p.P493L | HNSC | 1 |
| p.S446L | SKCM | 1 |
| p.P337H | PAAD | 1 |
| p.P443L | COAD | 1 |
| p.A580V | HNSC | 1 |
| p.E140* | UCEC | 1 |
| p.R229Q | STAD | 1 |
| p.N229I | HNSC | 1 |
| p.R501C | STAD | 1 |
| p.P124R | LIHC | 1 |
| p.G386A | COAD | 1 |
| p.I154N | KIRP | 1 |
| p.M439I | KIRP | 1 |
| p.S536Y | CHOL | 1 |
| p.R279W | COAD | 1 |
| p.I247L | SKCM | 1 |
| p.R111L | ESCA | 1 |
| p.S536F | BLCA | 1 |
| p.D581N | BRCA | 1 |
| p.W296* | SKCM | 1 |
| p.W246C | READ | 1 |
| p.I266T | KIRP | 1 |
| p.N586S | BRCA | 1 |
| p.A282T | COAD | 1 |
| p.L127I | STAD | 1 |
| p.W427X | ESCA | 1 |
| p.R228W | COAD | 1 |
| p.W294C | LUAD | 1 |
| p.F477L | LIHC | 1 |
| p.F93I | UCEC | 1 |
| p.R184G | BRCA | 1 |
| p.S396L | SKCM | 1 |
| p.R279Q | LGG | 1 |
| p.L509M | UCEC | 1 |
| p.S377Y | BRCA | 1 |
| Top |
| TissGeneCNV for SLC13A3 |
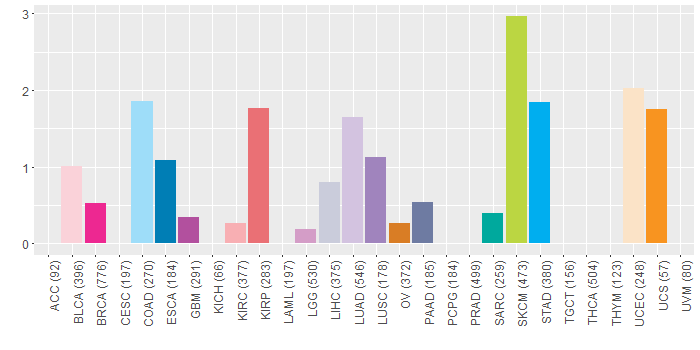
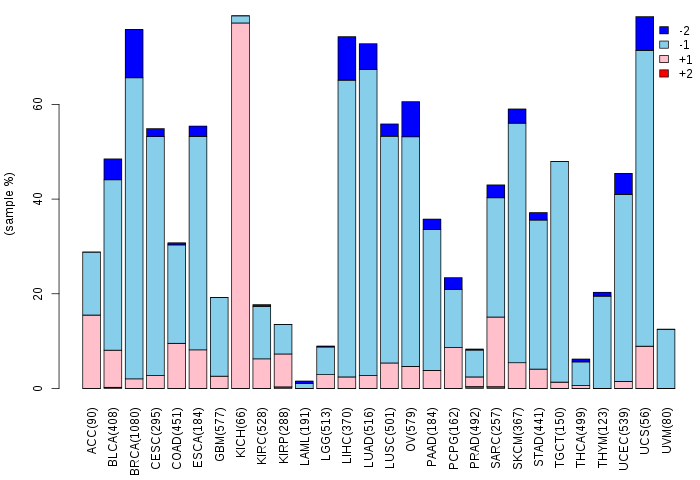
| Copy number variations of TissGene across 28 cancer types (X-axis: cancer type and Y-axis: % of CNV samples) (TCGA Gistic2_CopyNumber_Gistic2_all_data_by_genes, Gistic2 copy number data, version 2016-08-16) |
 |
| Top |
| TissGeneFusions for SLC13A3 |
| Fusion genes including TissGene (ChimerDB 3.0, 2016-12-01 and TCGA fusion Portal 2015-12-01) |
| Database | Src | Cancer type | Sample | Fusion gene | ORF | 5'-gene BP | 3'-gene BP |
| Chimerdb3.0 | ChiTaRs | NA | AW606827 | MPHOSPH10-SLC13A3 | chr2:71376376 | chr20:45259832 | |
| Chimerdb3.0 | ChiTaRs | NA | BE160828 | SLC13A3-MPHOSPH10 | chr20:45260144 | chr2:71368364 |
| Top |
| TissGeneNet for SLC13A3 |
| Co-expressed gene networks based on protein-protein interaction data (CePIN) (TCGA IlluminaHiSeq_RNASeqV2, pan-cancer normalized log2(norm_counts+1) data, version 2016-08-16) (PINA2 ppi data) |
| Top |
| TissGeneProg for SLC13A3 |
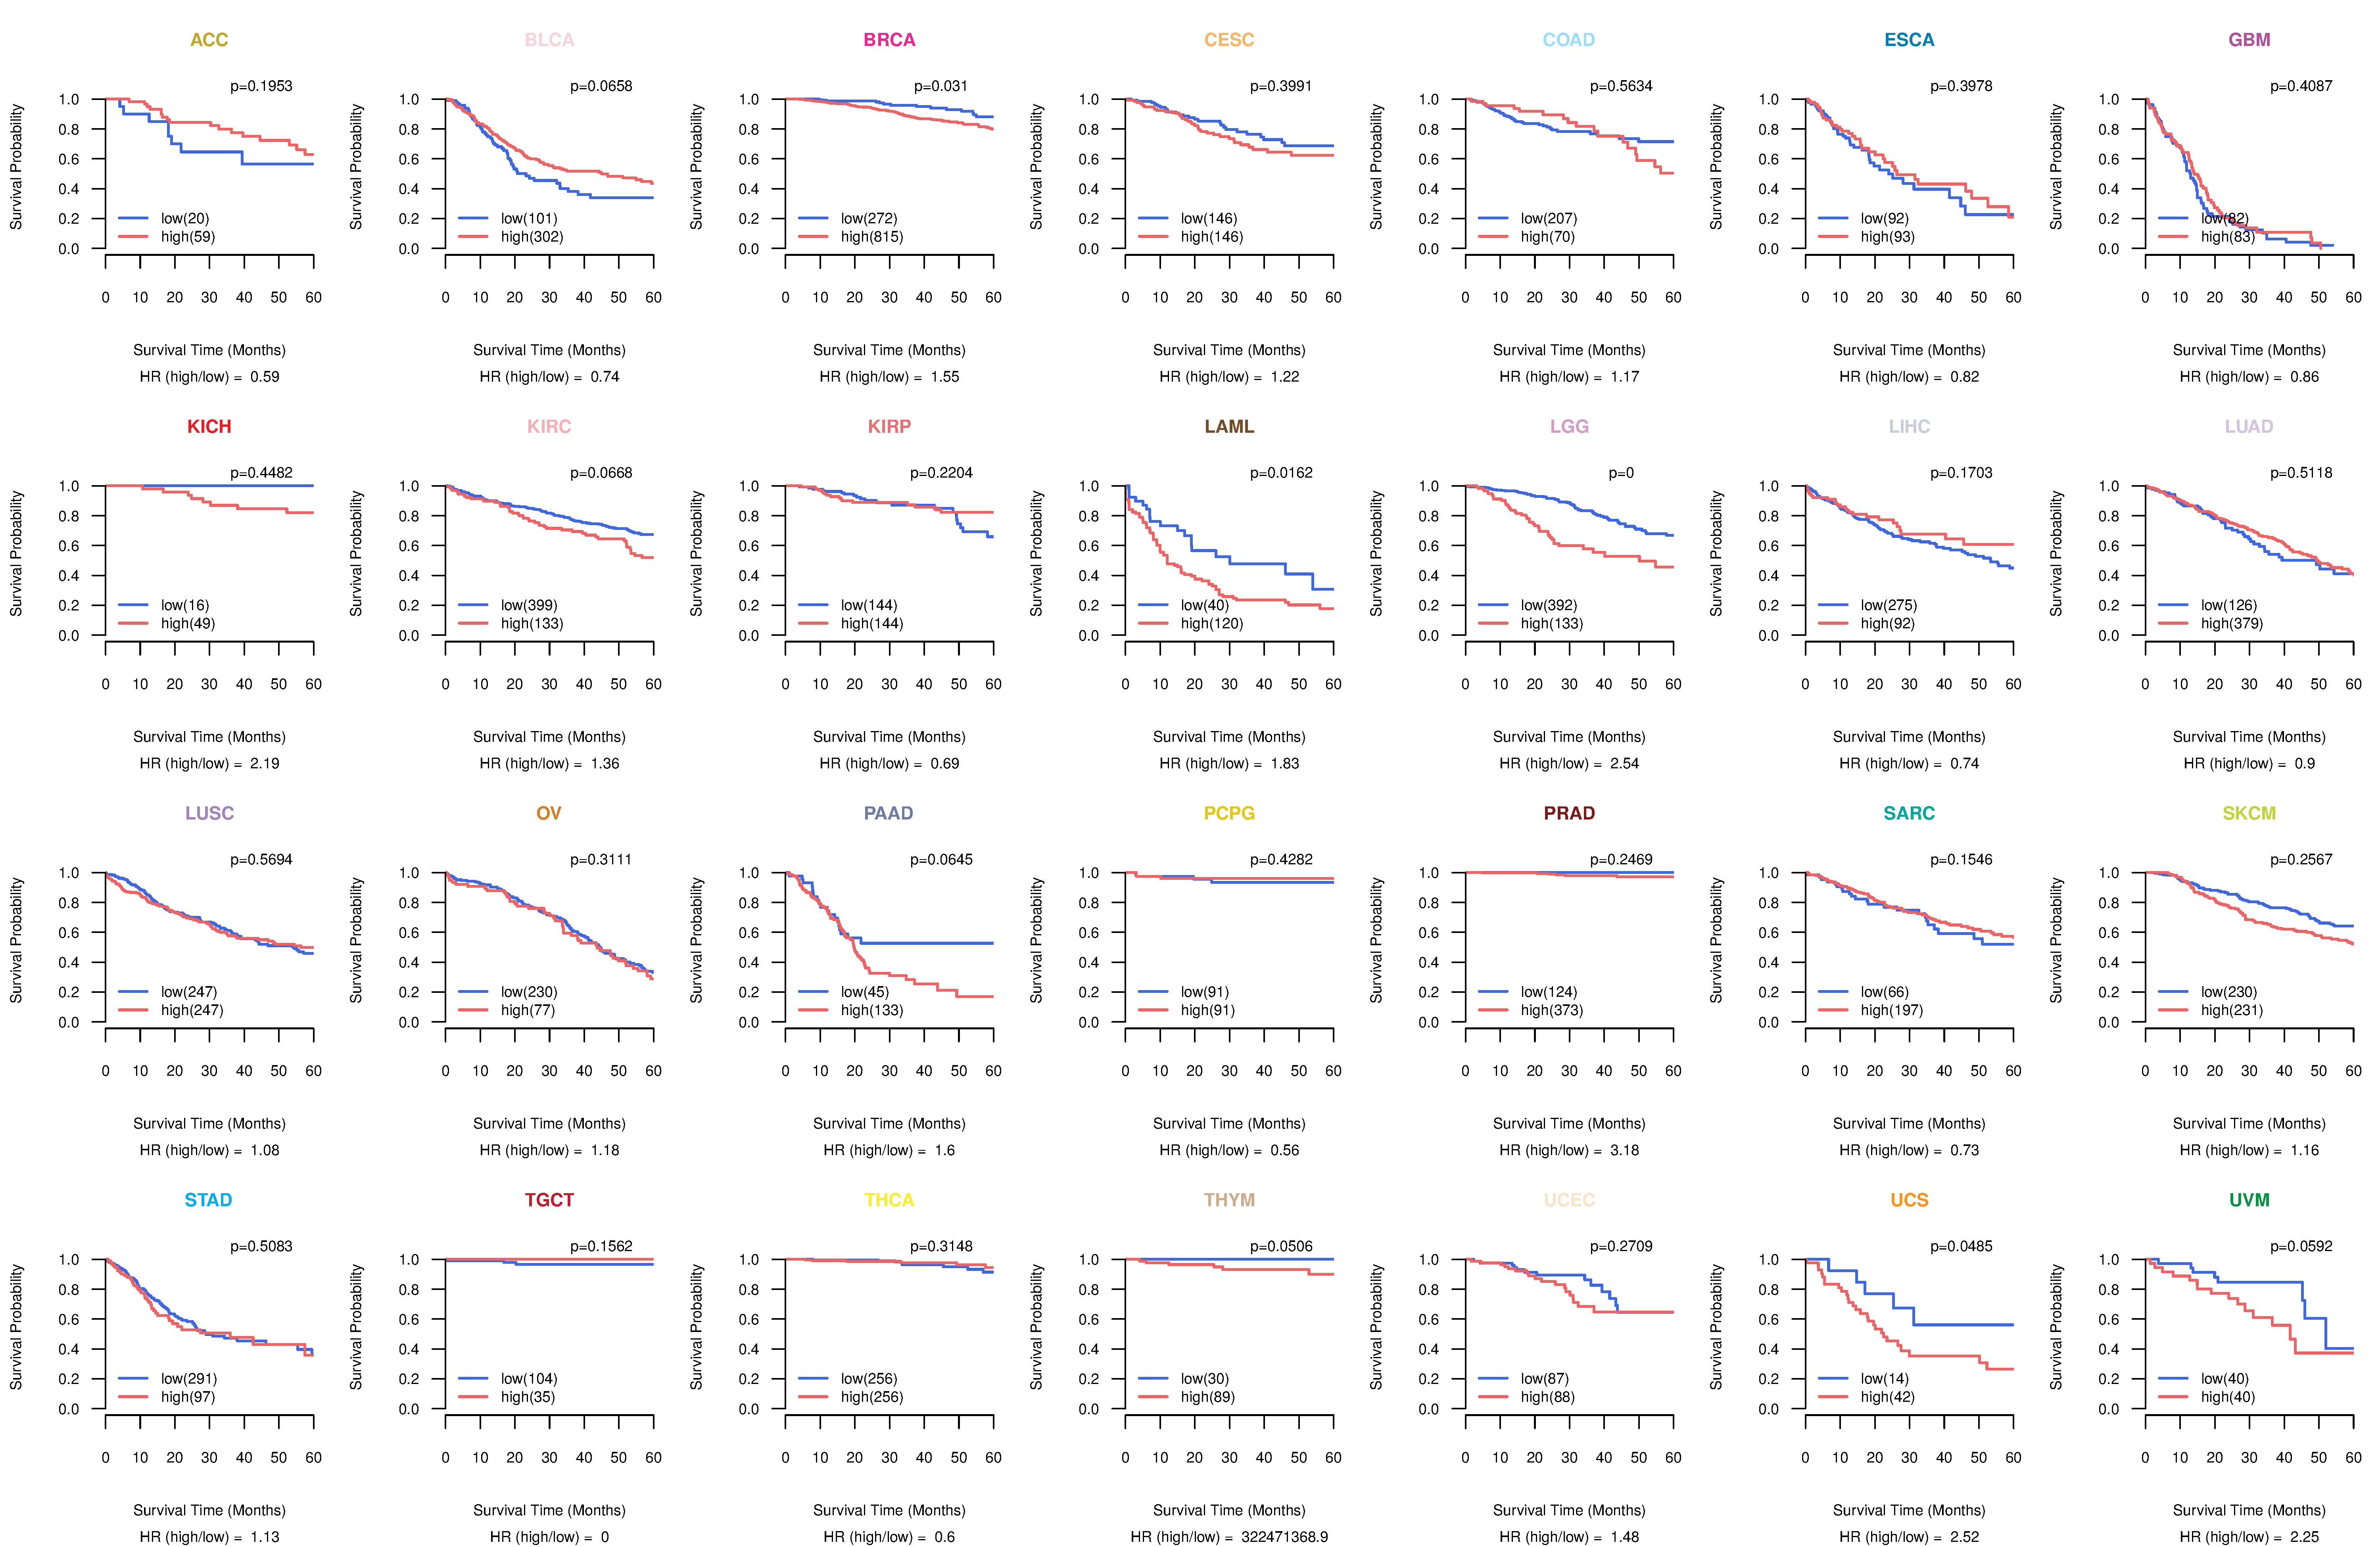
| Kaplan-Meier plots with logrank tests of overall survival (OS) using 28 cancer types (TCGA IlluminaHiSeq_RNASeqV2, pan-cancer normalized log2(norm_counts+1) data, version 2016-08-16) (TCGA clinicalMatrix, phenotype data, version 2016-04-27) * Click on the image to enlarge it in a new window. |
 |
| Kaplan-Meier plots with logrank test of relapse free survival (RFS) using 28 cancer types (TCGA IlluminaHiSeq_RNASeqV2, pan-cancer normalized log2(norm_counts+1) data, version 2016-08-16) (TCGA clinicalMatrix, phenotype data, version 2016-04-27) * Click on the image enlarge it in a new window. |
 |
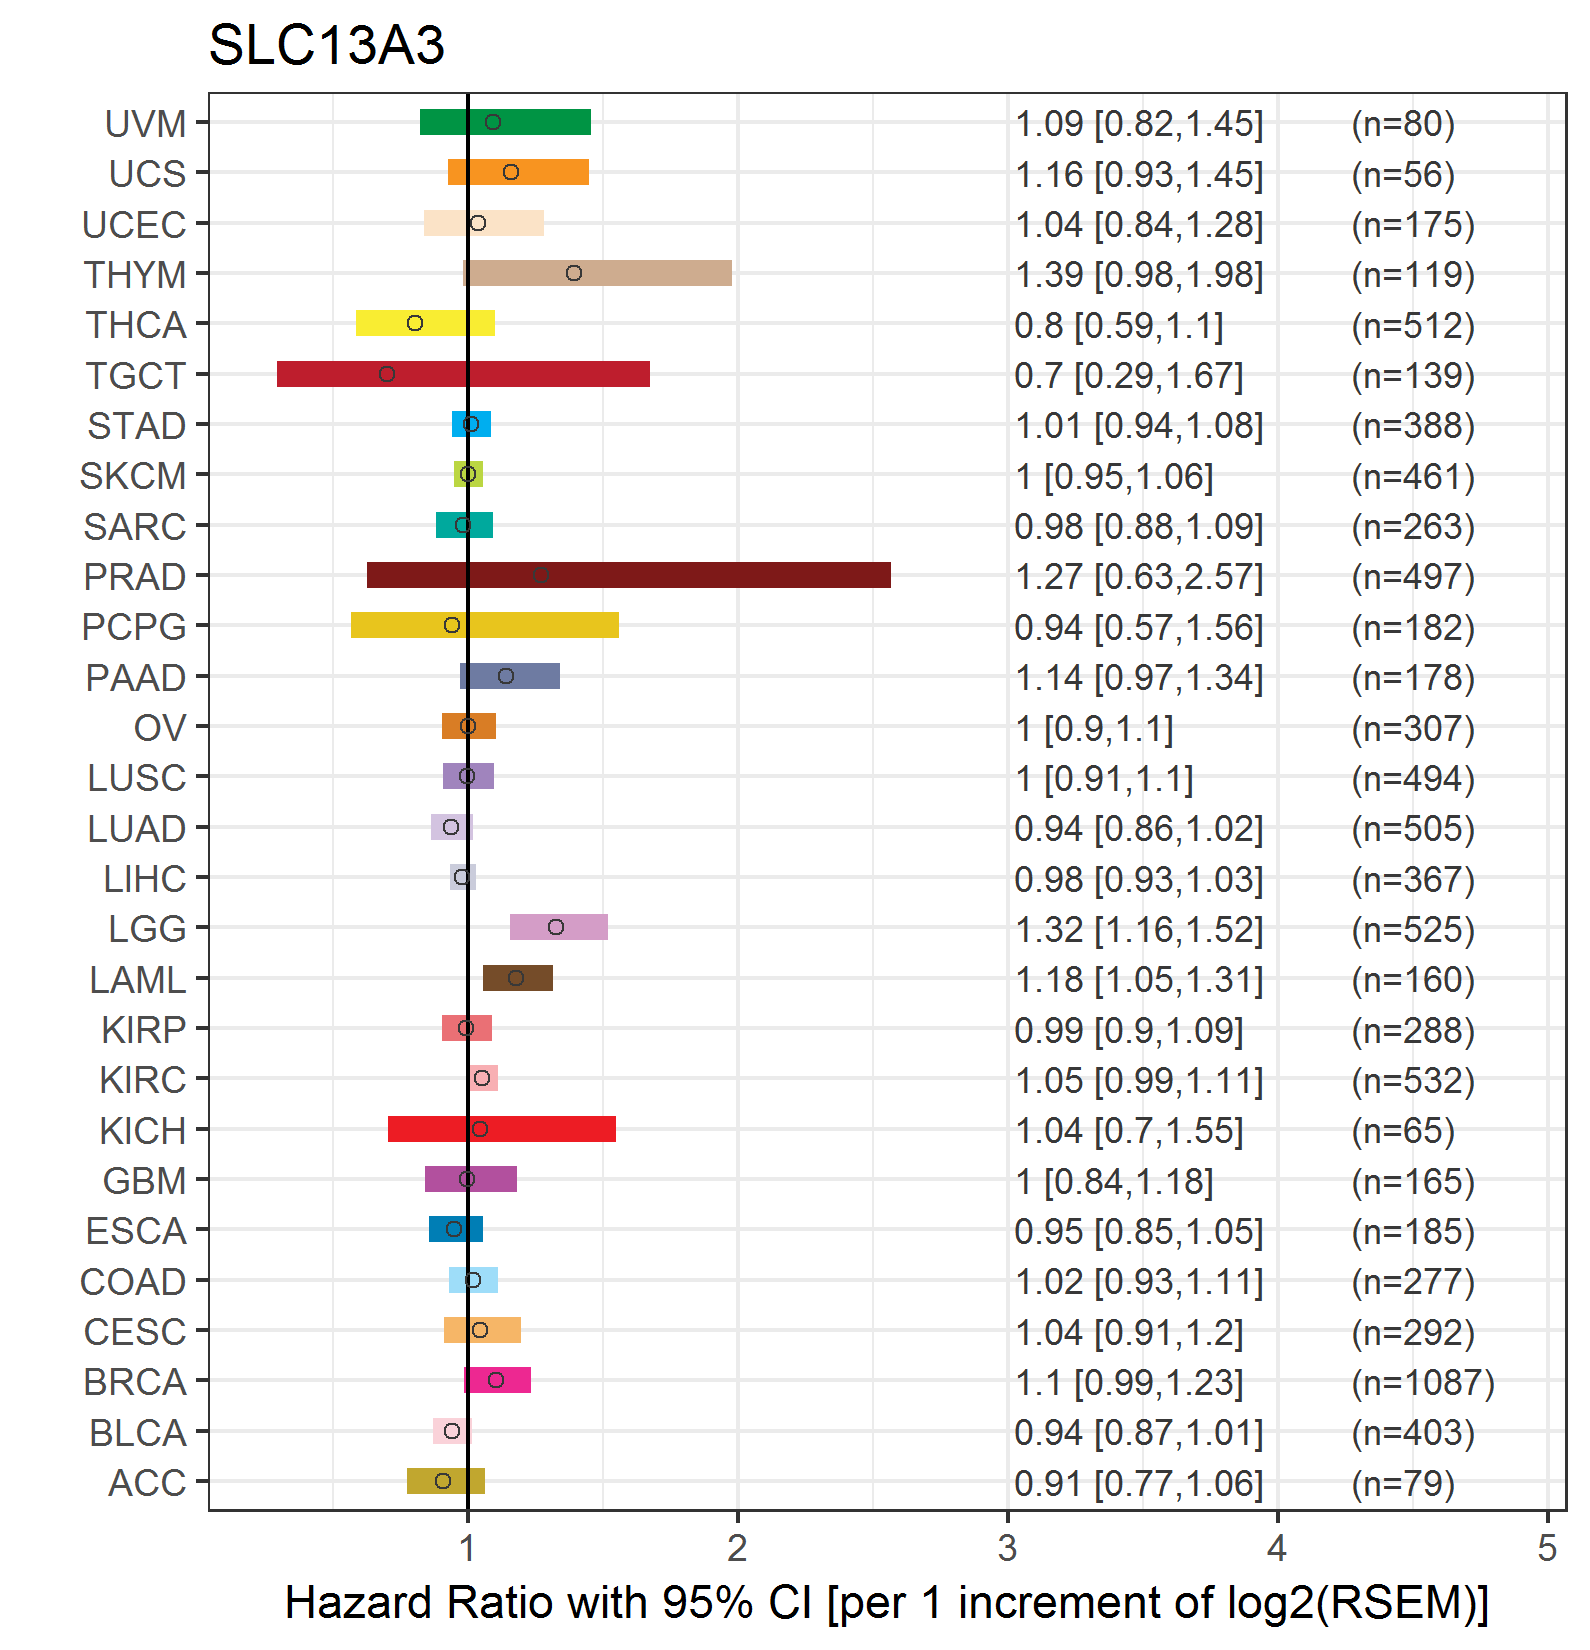
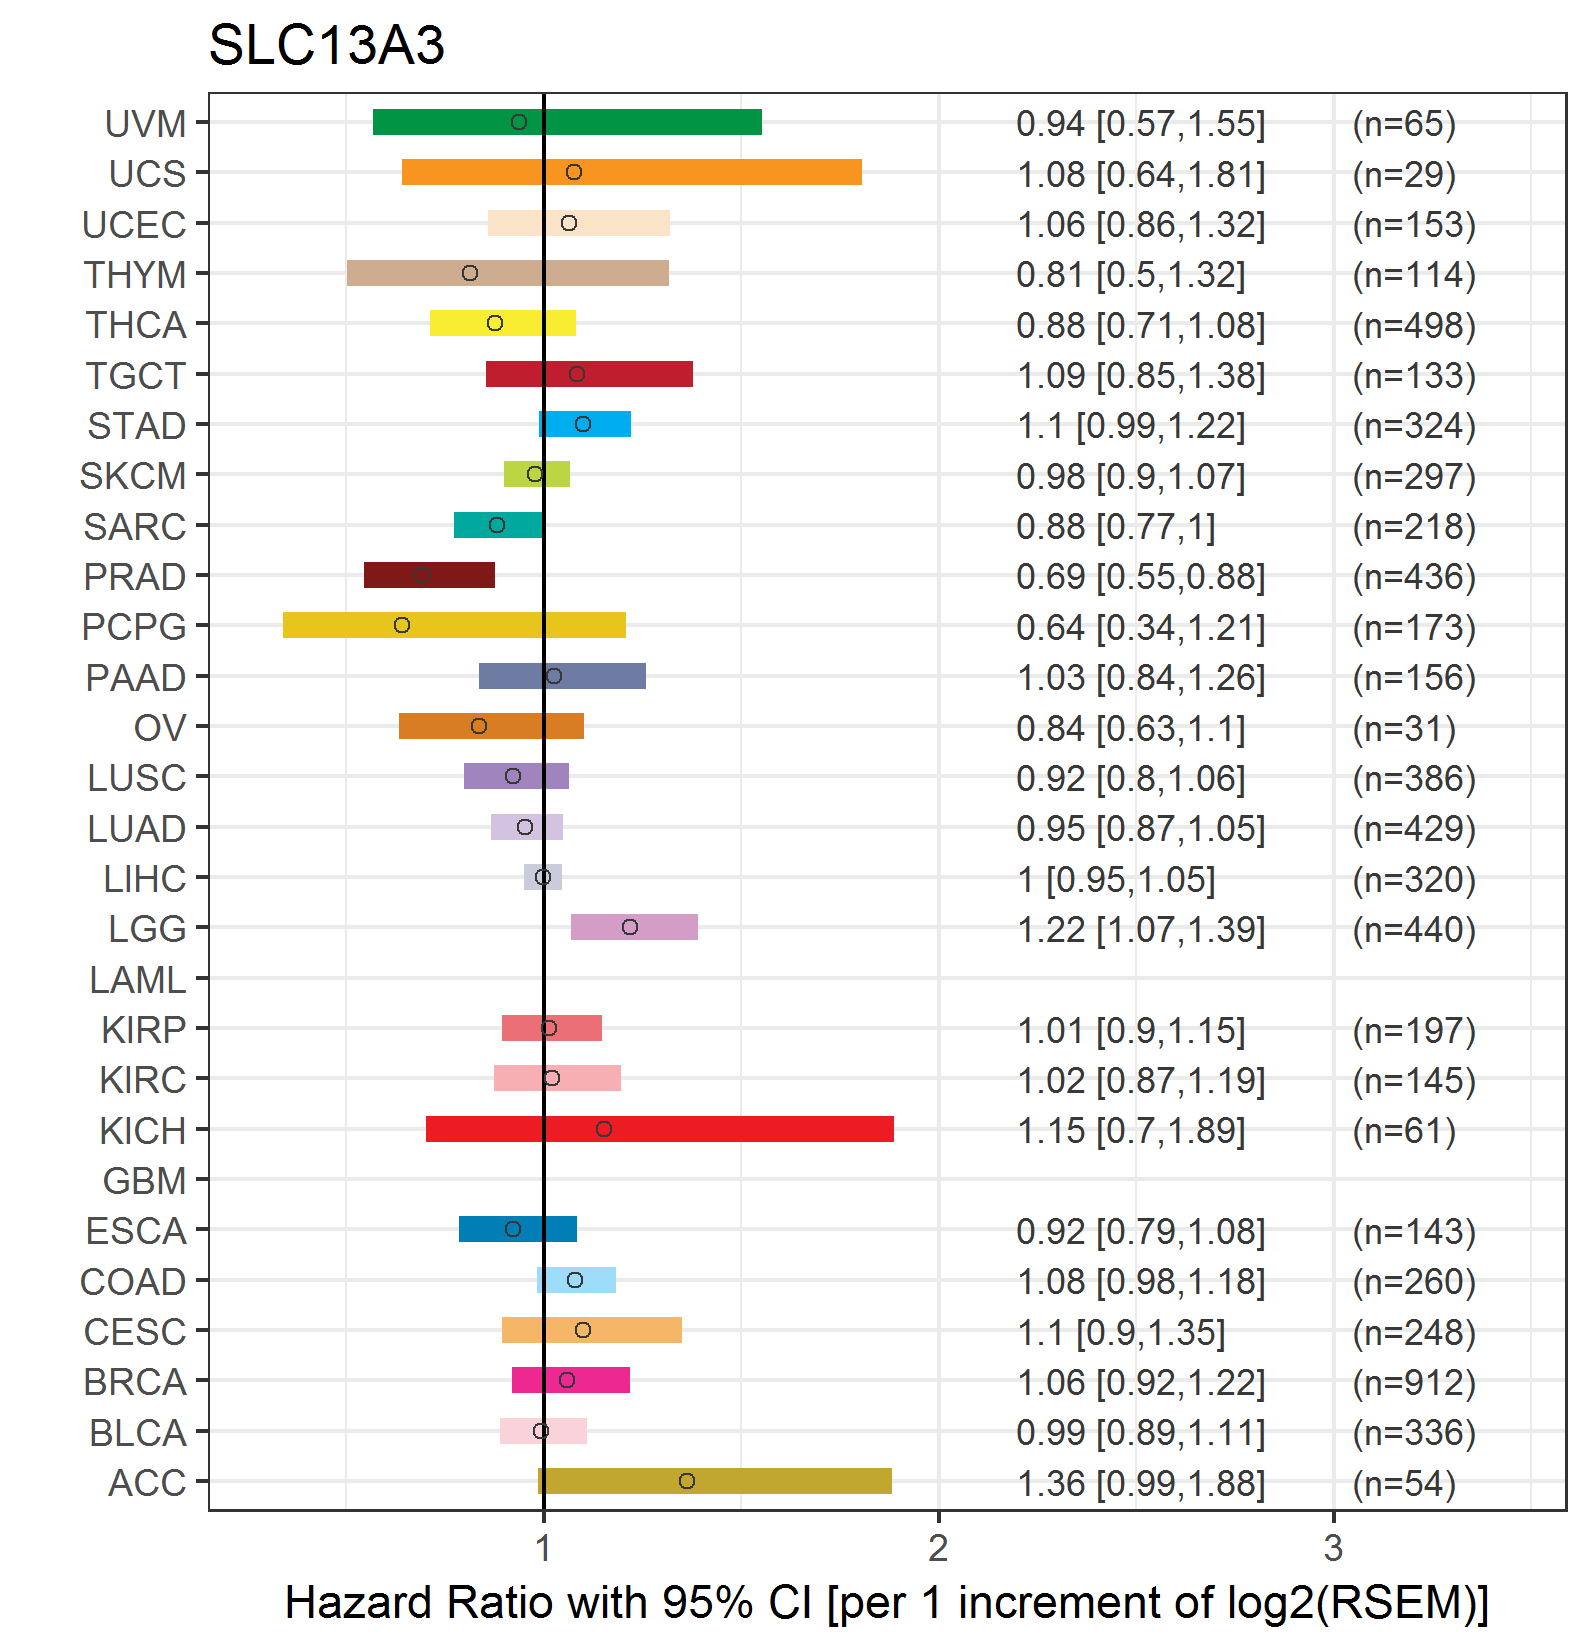
| Forest plot of Cox proportional hazard ratio (HR) and 95% CI of overall survival (OS) using 28 cancer types (TCGA IlluminaHiSeq_RNASeqV2, pan-cancer normalized log2(norm_counts+1) data, version 2016-08-16) (TCGA clinicalMatrix, phenotype data, version 2016-04-27) * Click on the image enlarge it in a new window. |
 |
| Forest plot of Cox proportional hazard ratio (HR) and 95% CI of relapse free survival (RFS) using 28 cancer types (TCGA IlluminaHiSeq_RNASeqV2, pan-cancer normalized log2(norm_counts+1) data, version 2016-08-16) (TCGA clinicalMatrix, phenotype data, version 2016-04-27) * Click on the image enlarge it in a new window. |
 |
| Top |
| TissGeneClin for SLC13A3 |
| TissGeneDrug for SLC13A3 |
| Drug information targeting TissGene (DrugBank Version 5.0.6, 2017-04-01) |
| DrugBank ID | Drug name | Drug activity | Drug type | Drug status |
| Top |
| TissGeneDisease for SLC13A3 |
| Disease information associated with TissGene (DisGeNet, 2016-06-01) |
| Disease ID | Disease name | # pubmeds | Source |
| umls:C0011860 | Diabetes Mellitus, Non-Insulin-Dependent | 1 | GAD |
| umls:C1561549 | Glomerular filtration rate finding | 1 | GWASCAT |
| umls:C1561643 | Chronic Kidney Diseases | 1 | GWASCAT |
|
Copyright 2016-Present - The University of Texas Health Science Center at Houston (UTHealth) Web File Viewing | How to Report, Fraud, Waste and Abuse | State of Texas | Statewide Search | Texas Homeland Security | Site Policies |