 |
| |
| |
| |
| |
| |
| |
|

| TissGeneSummary for CDK15 |
 Gene summary Gene summary |
| Basic gene information | Gene symbol | CDK15 |
| Gene name | cyclin-dependent kinase 15 | |
| Synonyms | ALS2CR7|PFTAIRE2|PFTK2 | |
| Cytomap | UCSC genome browser: 2q33.2 | |
| Type of gene | protein-coding | |
| RefGenes | NM_001261435.1, NM_001261436.1,NM_139158.2, | |
| Description | PFTAIRE protein kinase 2amyotrophic lateral sclerosis 2 (juvenile) chromosome region, candidate 7amyotrophic lateral sclerosis 2 chromosomal region candidate gene 7 proteincell division protein kinase 15serine/threonine protein kinaseserine/threonine | |
| Modification date | 20141207 | |
| dbXrefs | HGNC : HGNC | |
| Ensembl : ENSG00000138395 | ||
| HPRD : 12449 | ||
| Vega : OTTHUMG00000132838 | ||
| Protein | UniProt: go to UniProt's Cross Reference DB Table | |
| Expression | CleanEX: HS_CDK15 | |
| BioGPS: 65061 | ||
| Pathway | NCI Pathway Interaction Database: CDK15 | |
| KEGG: CDK15 | ||
| REACTOME: CDK15 | ||
| Pathway Commons: CDK15 | ||
| Context | iHOP: CDK15 | |
| ligand binding site mutation search in PubMed: CDK15 | ||
| UCL Cancer Institute: CDK15 | ||
| Assigned class in TissGDB* | C | |
| Included tissue-specific gene expression resources | TiGER,GTEx | |
| Specific-tissues in normal samples (assigned by TissGDB using HPA, TiGER, and GTEx) | OvaryTestis | |
| Cancer types related to the specific-tissues in cancer samples (assigned by TissGDB using TCGA) | OVTGCT | |
| Reference showing the relevant tissue of CDK15 | ||
| Description by TissGene annotations | Cancer gene | |
| * Class A consists of genes with literature evidence and is part of the cTissGenes. Class B consists of only cTissGenes without additional evidence. The remaining genes belong to Class C. |
| Gene ontology having evidence of Inferred from Direct Assay (IDA) from Entrez |
| GO ID | GO term | PubMed ID |
| Top |
| TissGeneExp for CDK15 |
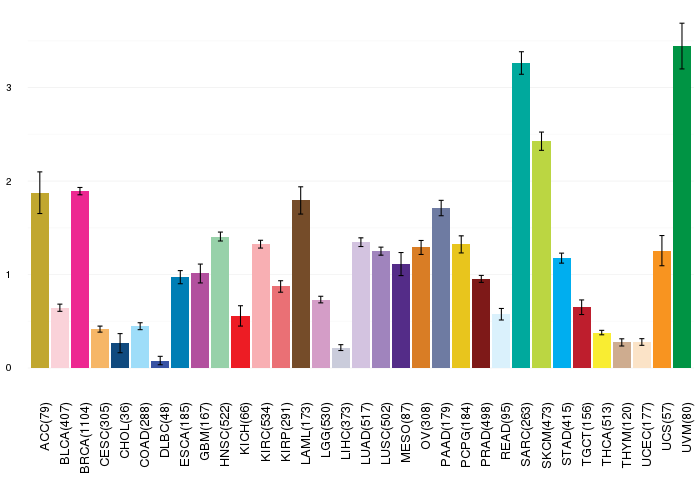
| Gene expressions across 28 cancer types (X-axis: cancer type and Y-axis: log2(norm_counts+1)) (TCGA IlluminaHiSeq_RNASeqV2, pan-cancer normalized log2(norm_counts+1) data, version 2016-08-16) |
 |
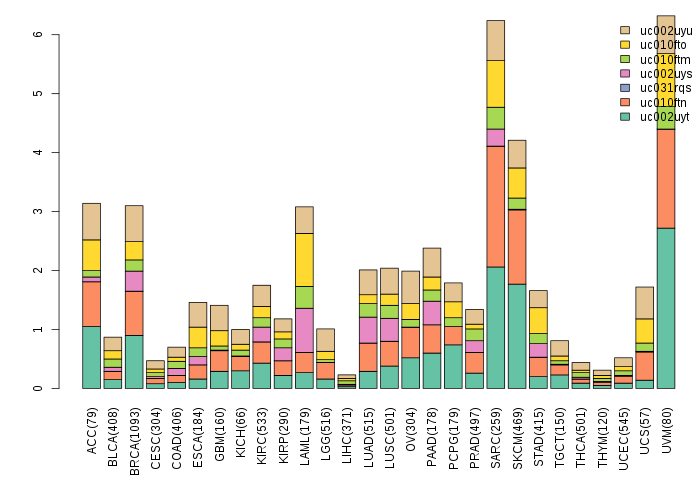
| Gene isoform expressions across 28 cancer types (X-axis: cancer type and Y-axis: log2(norm_counts+1)) (TCGA pan-cancer tcga_rsem_isoform_tpm, version 2016-09-01) |
 |
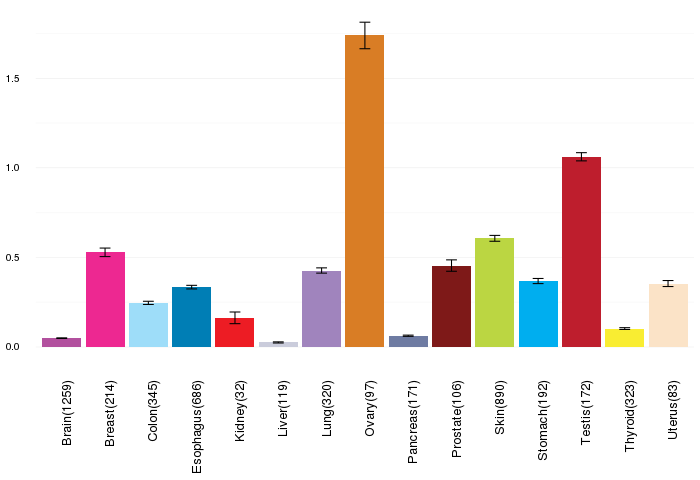
| Gene expressions across normal tissues of GTEx data (GTEx GTEx_Analysis_v6_RNA-seq_RNA-SeQCv1.1.8_gene_rpkm.gct) - Here, we shows the matched tissue types only among our 28 cancer types. |
 |
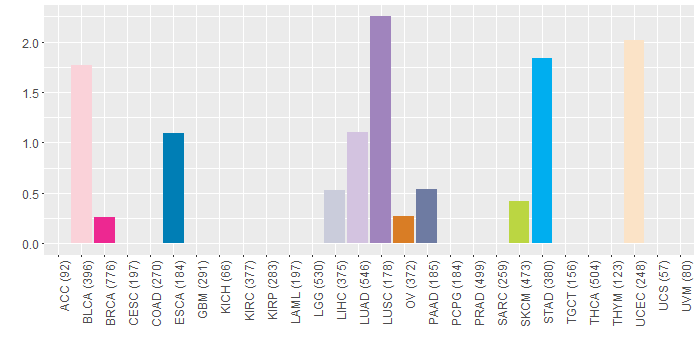
| Different expressions across 14 cancer types with more than 10 samples between matched tumors and normals (X-axis: cancer type and Y-axis: log2(norm_counts+1)) (TCGA IlluminaHiSeq_RNASeqV2, pan-cancer normalized log2(norm_counts+1) data, version 2016-08-16) |
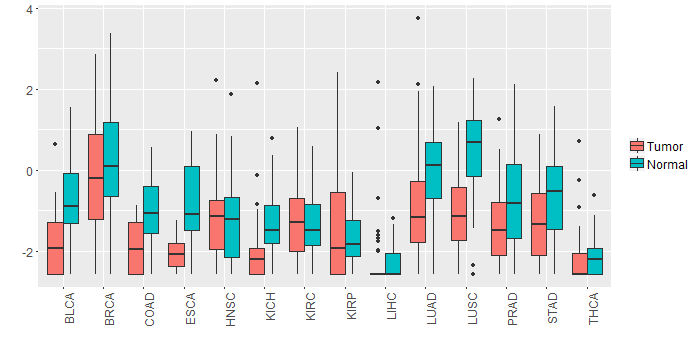 |
| - Significantly differentially expressed cancer types and information. (|Fold change|>1 and FDR<0.05) |
| Cancer type | Mean(exp) in tumor | Mean(exp) in matched normal | Log2FC | P-val. | FDR |
| LUSC | -1.0845567 | 0.470764869 | -1.555321569 | 7.52E-12 | 3.18E-11 |
| BLCA | -1.793491994 | -0.692686731 | -1.100805263 | 0.00223 | 0.014033127 |
| Top |
| TissGene-miRNA for CDK15 |
| Significantly anti-correlated miRNAs of TissGene across 28 cancer types (Gene-miRNA relations from TargetScanHuman Relsease 7.1, Conserved_Site_Context_Scores.txt.zip, 06.01.2016) (TCGA IlluminaHiSeq_miRNASeq, log2(RPM+1) data, version 2016-11-21) (TCGA IlluminaHiSeq_RNASeqV2, log2(normalized_count+1) data, version 2016-08-16) (Spearman’s Rank Correlation (p-value<0.05 and coefficient<-0.25)) |
| Cancer type | miRNA id | miRNA accession | P-val. | Coeff. | # samples |
| Top |
| TissGeneMut for CDK15 |
| TissGeneSNV for CDK15 |
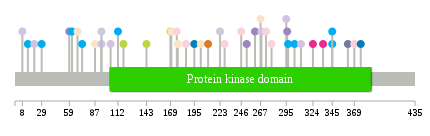
| nsSNV counts per each loci. Different colors of circles represent different cancer types. Circle size denotes number of samples. (TCGA somatic mutation (SNPs and small INDELs) data, version 2016-04-25) * Click on the image to enlarge it in a new window. |
 |
 |
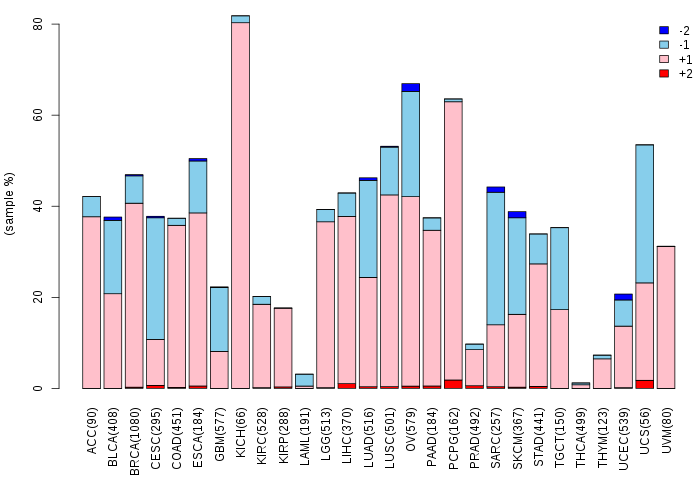
| Somatic nucleotide variants of TissGene across 28 cancer types (X-axis: cancer type and Y-axis: % of mutated samples) The numbers in parentheses are numbers of samples with mutation (nsSNVs). (TCGA somatic mutation (SNPs and small INDELs) data, version 2016-04-25) |
 |
| - nsSNVs sorted by frequency. |
| AAchange | Cancer type | # samples |
| p.A186T | BLCA | 1 |
| p.A246T | BLCA | 1 |
| p.Q297R | STAD | 1 |
| p.S304P | STAD | 1 |
| p.K8N | LUAD | 1 |
| p.E140K | HNSC | 1 |
| p.P268L | HNSC | 1 |
| p.R345X | STAD | 1 |
| p.G59V | LUSC | 1 |
| p.P143T | SKCM | 1 |
| p.G13A | HNSC | 1 |
| p.Y335F | BRCA | 1 |
| p.L104F | LUAD | 1 |
| p.C14R | STAD | 1 |
| p.E311K | LUAD | 1 |
| p.F155L | READ | 1 |
| p.G112C | STAD | 1 |
| p.P73S | STAD | 1 |
| p.V261L | LUSC | 1 |
| p.P252L | LUSC | 1 |
| p.A62V | STAD | 1 |
| p.R324C | BRCA | 1 |
| p.K369N | BLCA | 1 |
| p.Q177H | UCEC | 1 |
| p.D362Y | PAAD | 1 |
| p.L170I | UCEC | 1 |
| p.F176L | BLCA | 1 |
| p.R29W | STAD | 1 |
| p.V376F | ESCA | 1 |
| p.Q295H | LUAD | 1 |
| p.S202N | UCEC | 1 |
| p.R345* | STAD | 1 |
| p.L363M | HNSC | 1 |
| p.P268H | LUAD | 1 |
| p.V210M | OV | 1 |
| p.G195V | ESCA | 1 |
| p.H118Y | SKCM | 1 |
| p.K68N | UCEC | 1 |
| p.G296C | LUSC | 1 |
| p.R148Q | HNSC | 1 |
| p.S94C | LIHC | 1 |
| p.Q228* | BLCA | 1 |
| p.P267S | UCEC | 1 |
| p.R72G | CHOL | 1 |
| p.H169Y | SKCM | 1 |
| p.A87T | UCEC | 1 |
| p.G273E | BLCA | 1 |
| p.R223G | LIHC | 1 |
| p.S279C | BLCA | 1 |
| p.S94R | LUAD | 1 |
| p.E21D | LUAD | 1 |
| Top |
| TissGeneCNV for CDK15 |
| Copy number variations of TissGene across 28 cancer types (X-axis: cancer type and Y-axis: % of CNV samples) (TCGA Gistic2_CopyNumber_Gistic2_all_data_by_genes, Gistic2 copy number data, version 2016-08-16) |
 |
| Top |
| TissGeneFusions for CDK15 |
| Fusion genes including TissGene (ChimerDB 3.0, 2016-12-01 and TCGA fusion Portal 2015-12-01) |
| Database | Src | Cancer type | Sample | Fusion gene | ORF | 5'-gene BP | 3'-gene BP |
| Top |
| TissGeneNet for CDK15 |
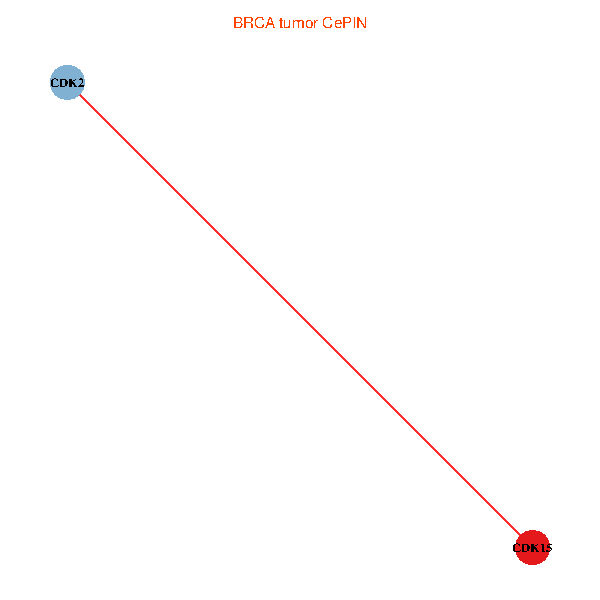
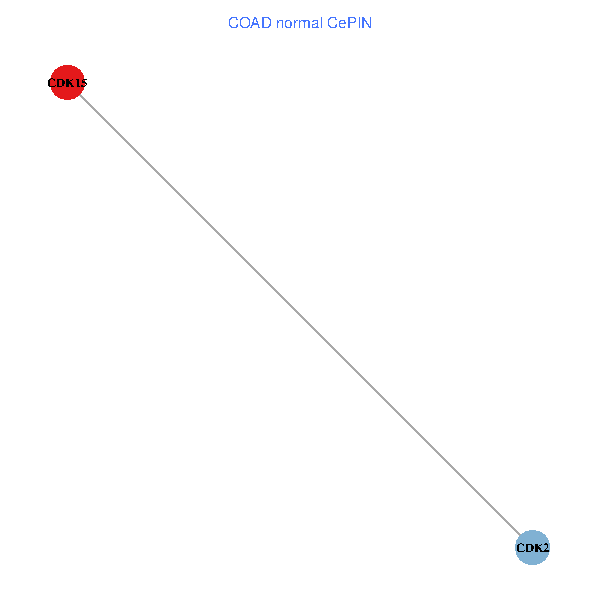
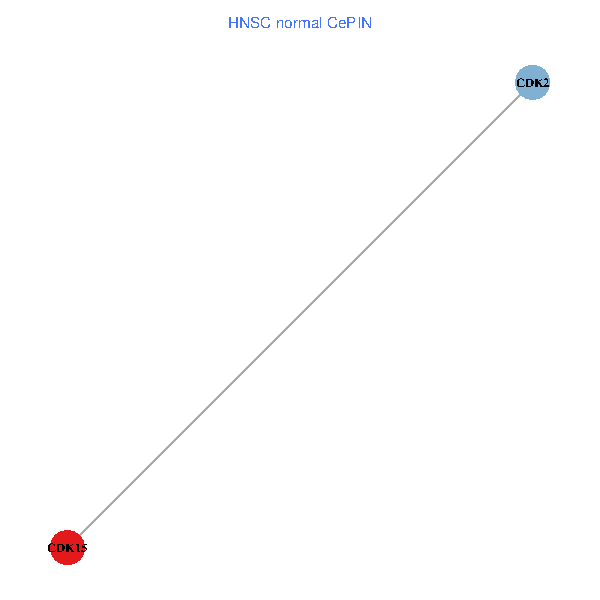
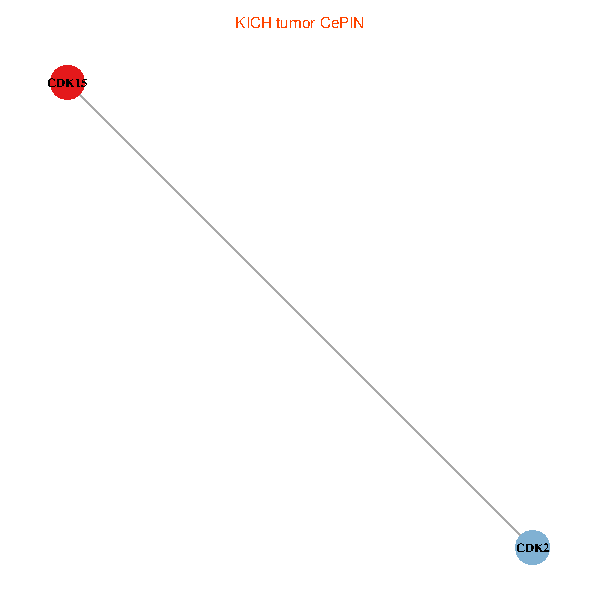
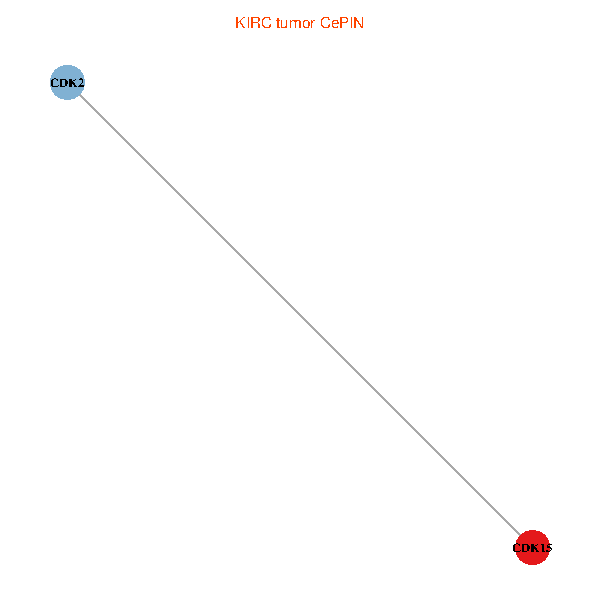
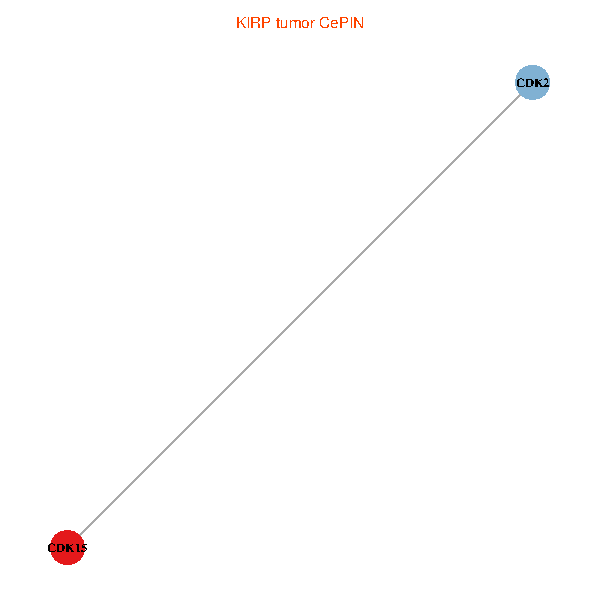
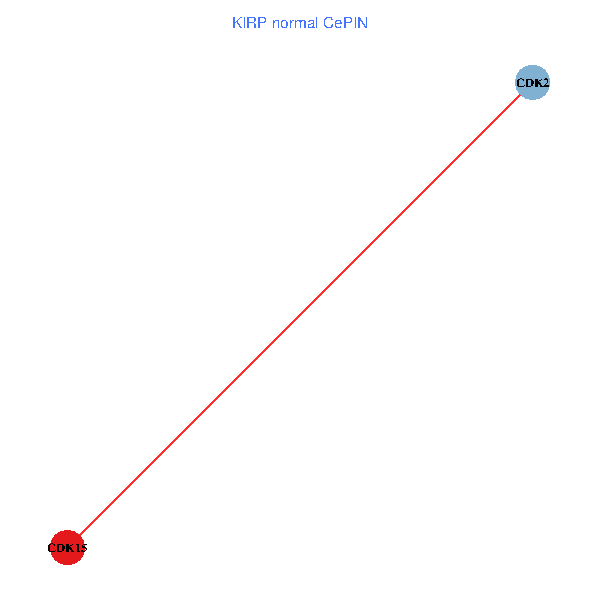
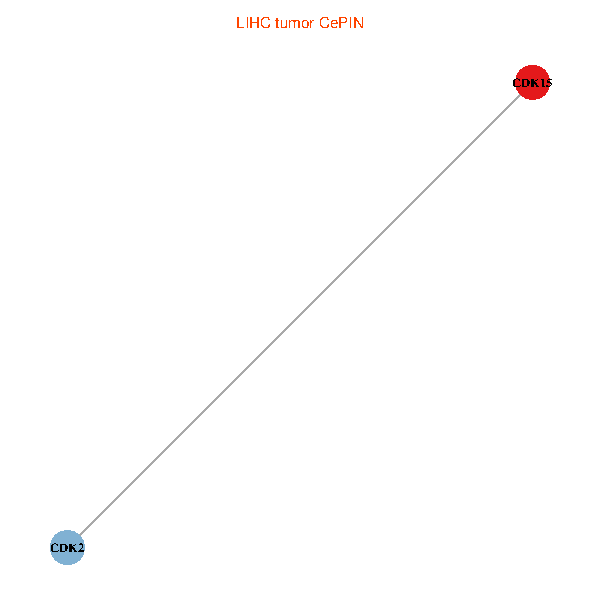
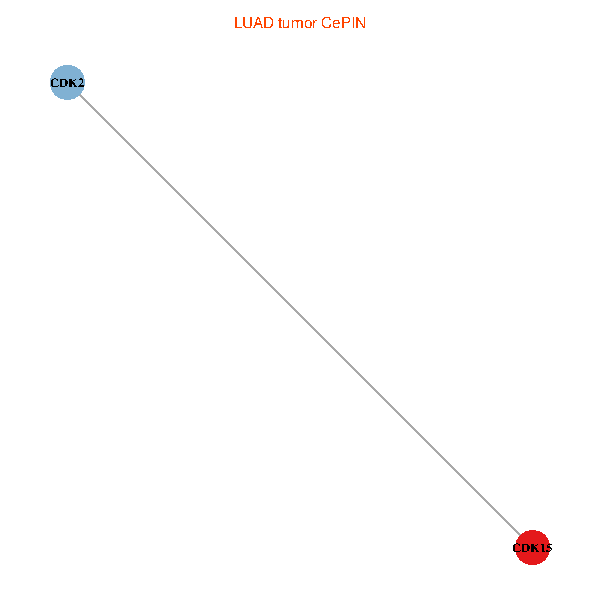
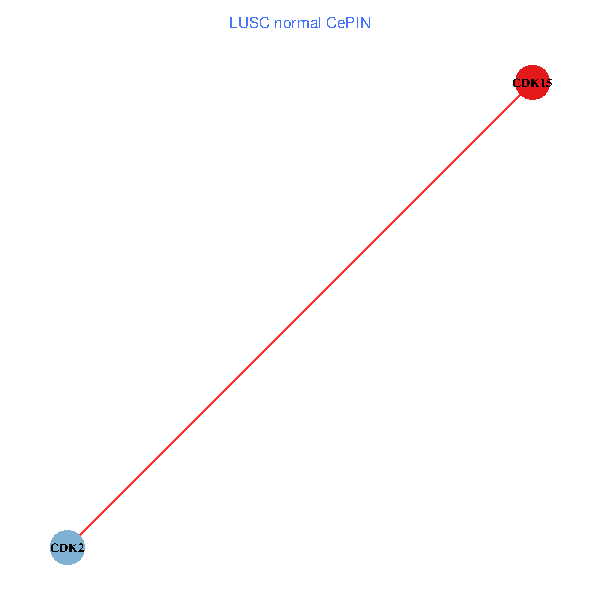
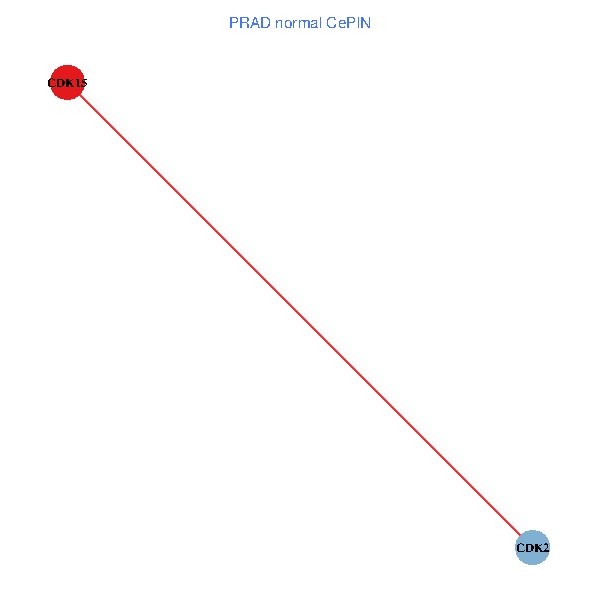
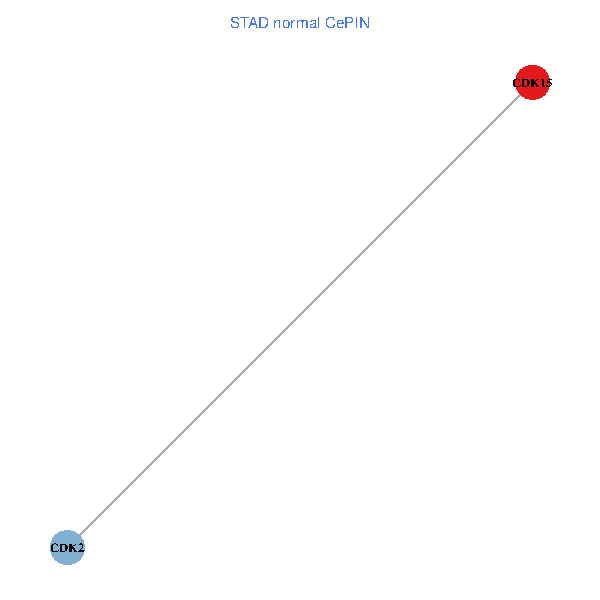
| Co-expressed gene networks based on protein-protein interaction data (CePIN) (TCGA IlluminaHiSeq_RNASeqV2, pan-cancer normalized log2(norm_counts+1) data, version 2016-08-16) (PINA2 ppi data) |
| BRCA (tumor) | BRCA (normal) |
| CDK15, CDK2 (tumor) | CDK15, CDK2 (normal) |
 |  |
| COAD (tumor) | COAD (normal) |
| CDK15, CDK2 (tumor) | CDK15, CDK2 (normal) |
 |  |
| HNSC (tumor) | HNSC (normal) |
| CDK15, CDK2 (tumor) | CDK15, CDK2 (normal) |
 |  |
| KICH (tumor) | KICH (normal) |
| CDK15, CDK2 (tumor) | CDK15, CDK2 (normal) |
 |  |
| KIRC (tumor) | KIRC (normal) |
| CDK15, CDK2 (tumor) | CDK15, CDK2 (normal) |
 |  |
| KIRP (tumor) | KIRP (normal) |
| CDK15, CDK2 (tumor) | CDK15, CDK2 (normal) |
 |  |
| LIHC (tumor) | LIHC (normal) |
| CDK15, CDK2 (tumor) | CDK15, CDK2 (normal) |
 |  |
| LUAD (tumor) | LUAD (normal) |
| CDK15, CDK2 (tumor) | CDK15, CDK2 (normal) |
 |  |
| LUSC (tumor) | LUSC (normal) |
| CDK15, CDK2 (tumor) | CDK15, CDK2 (normal) |
 |  |
| PRAD (tumor) | PRAD (normal) |
| CDK15, CDK2 (tumor) | CDK15, CDK2 (normal) |
 |  |
| STAD (tumor) | STAD (normal) |
| CDK15, CDK2 (tumor) | CDK15, CDK2 (normal) |
 |  |
| THCA (tumor) | THCA (normal) |
| CDK15, CDK2 (tumor) | CDK15, CDK2 (normal) |
 |  |
| Top |
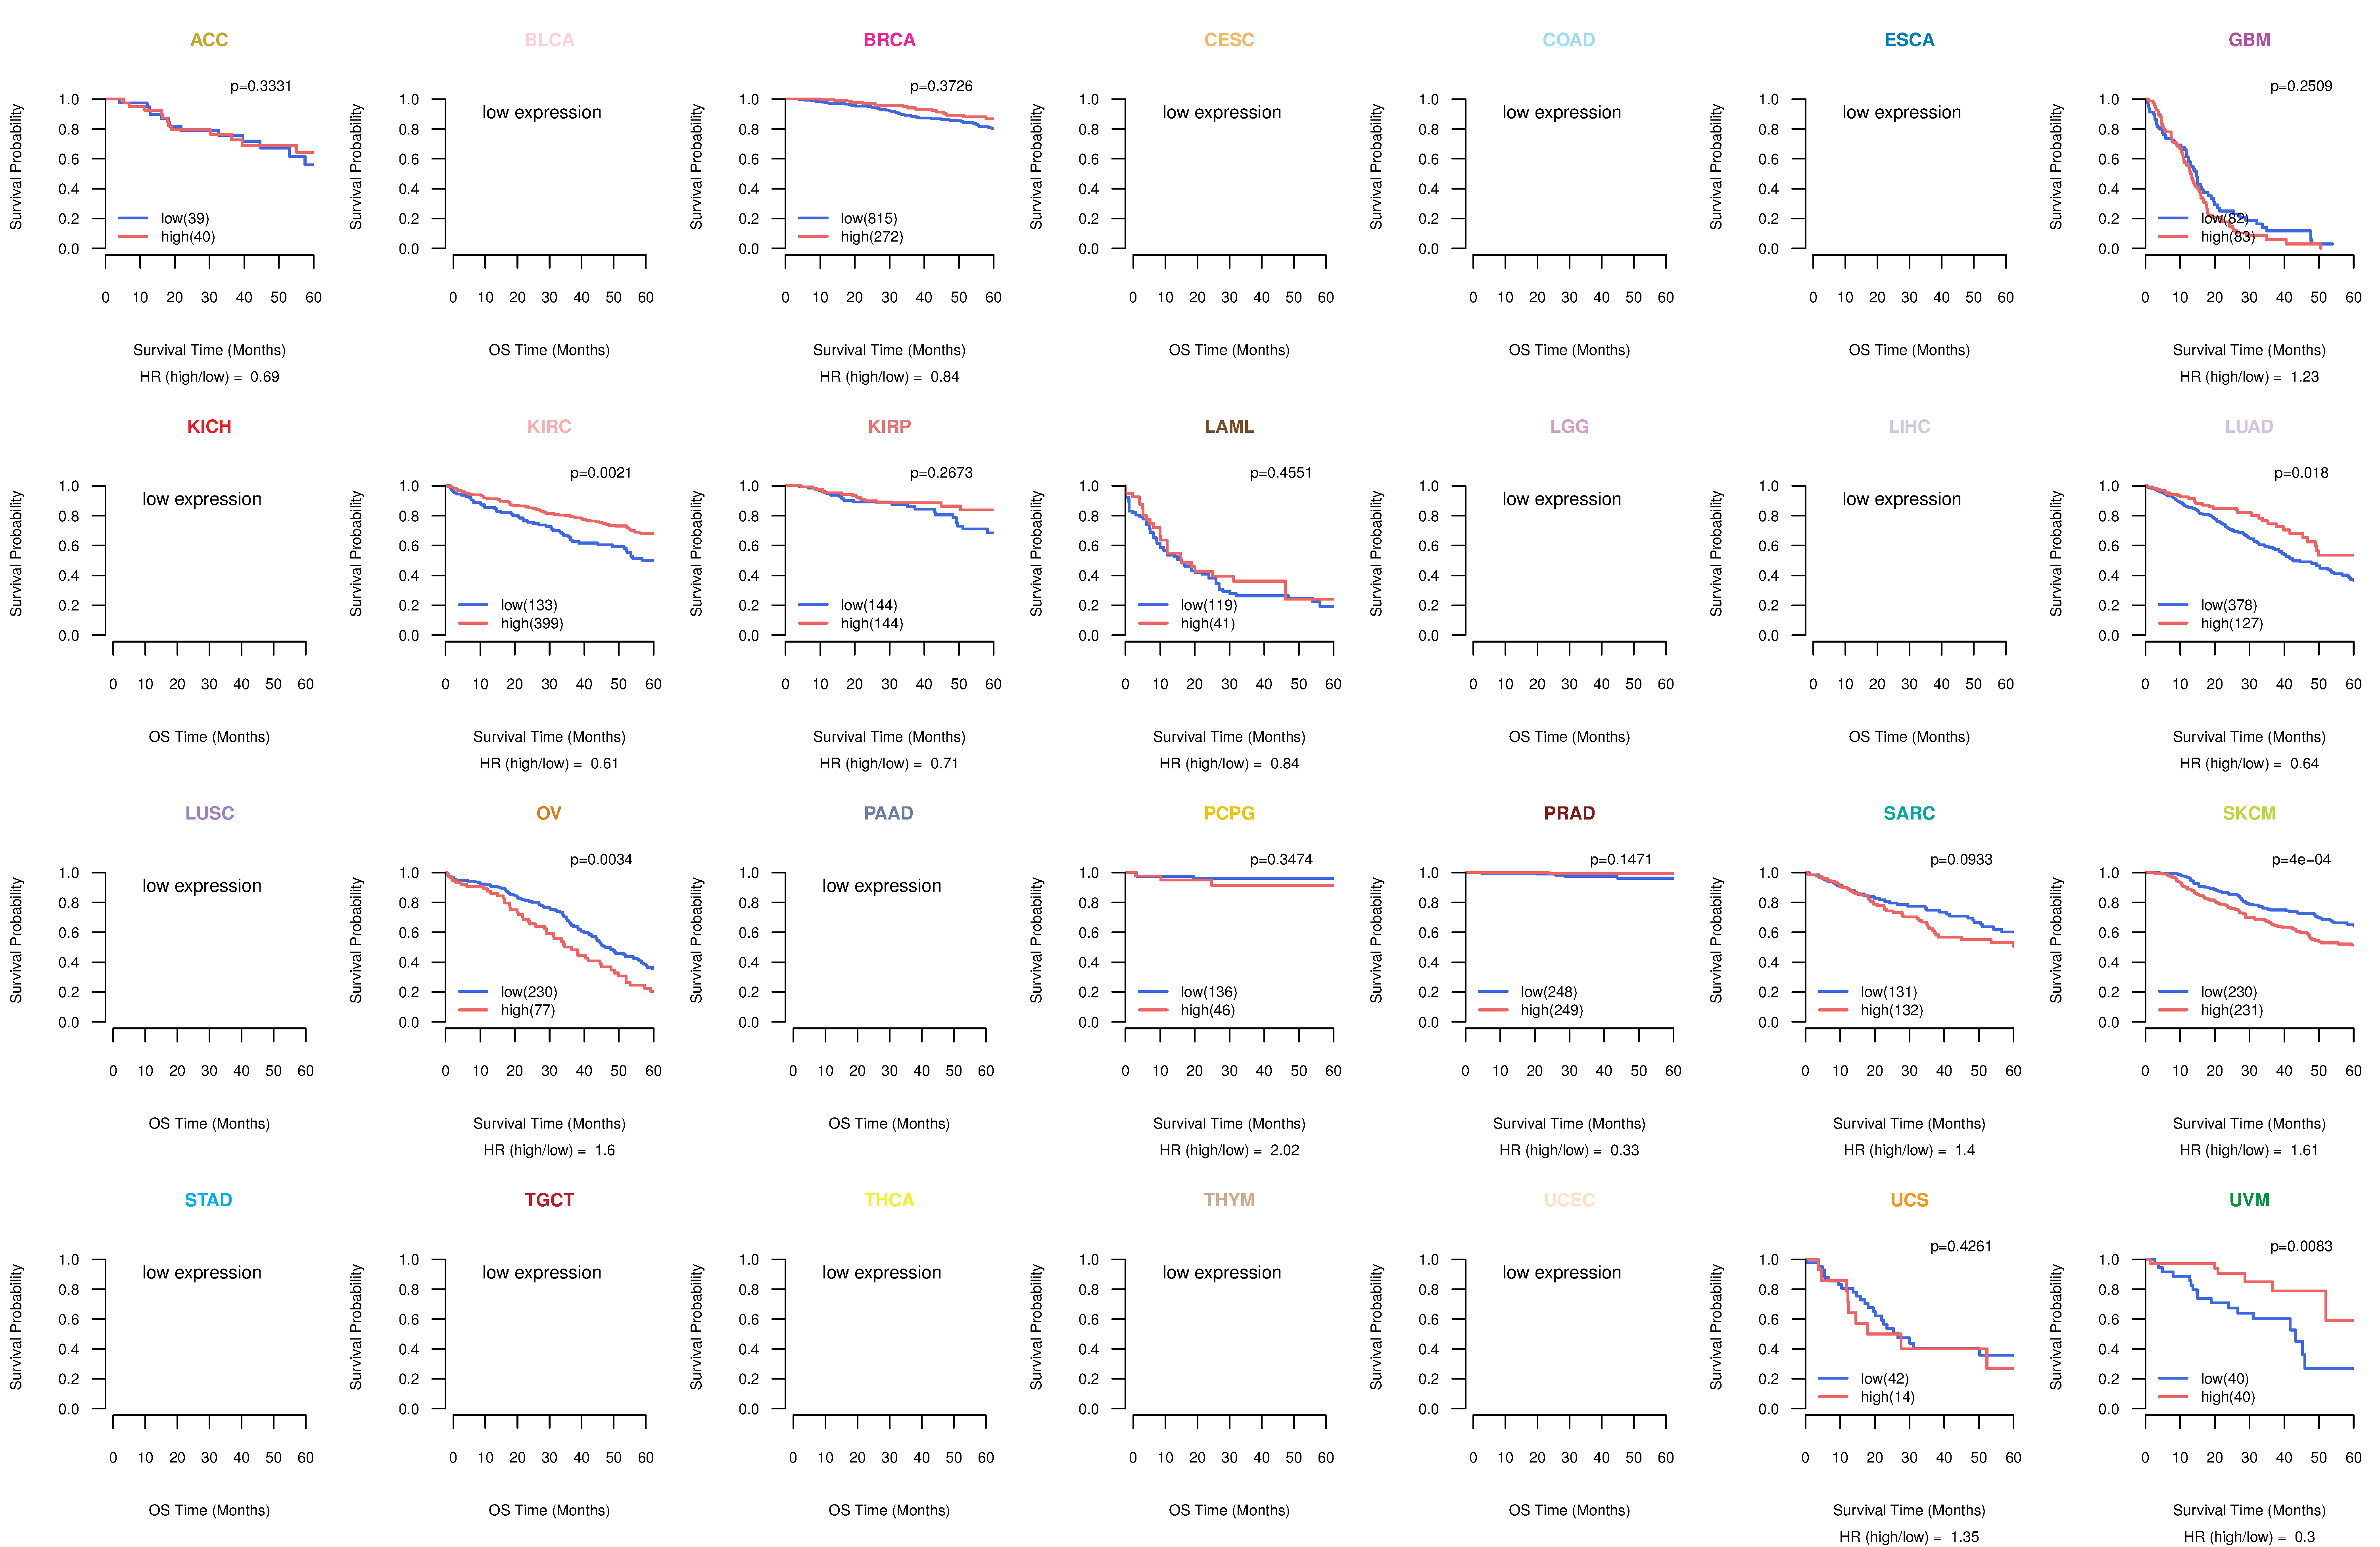
| TissGeneProg for CDK15 |
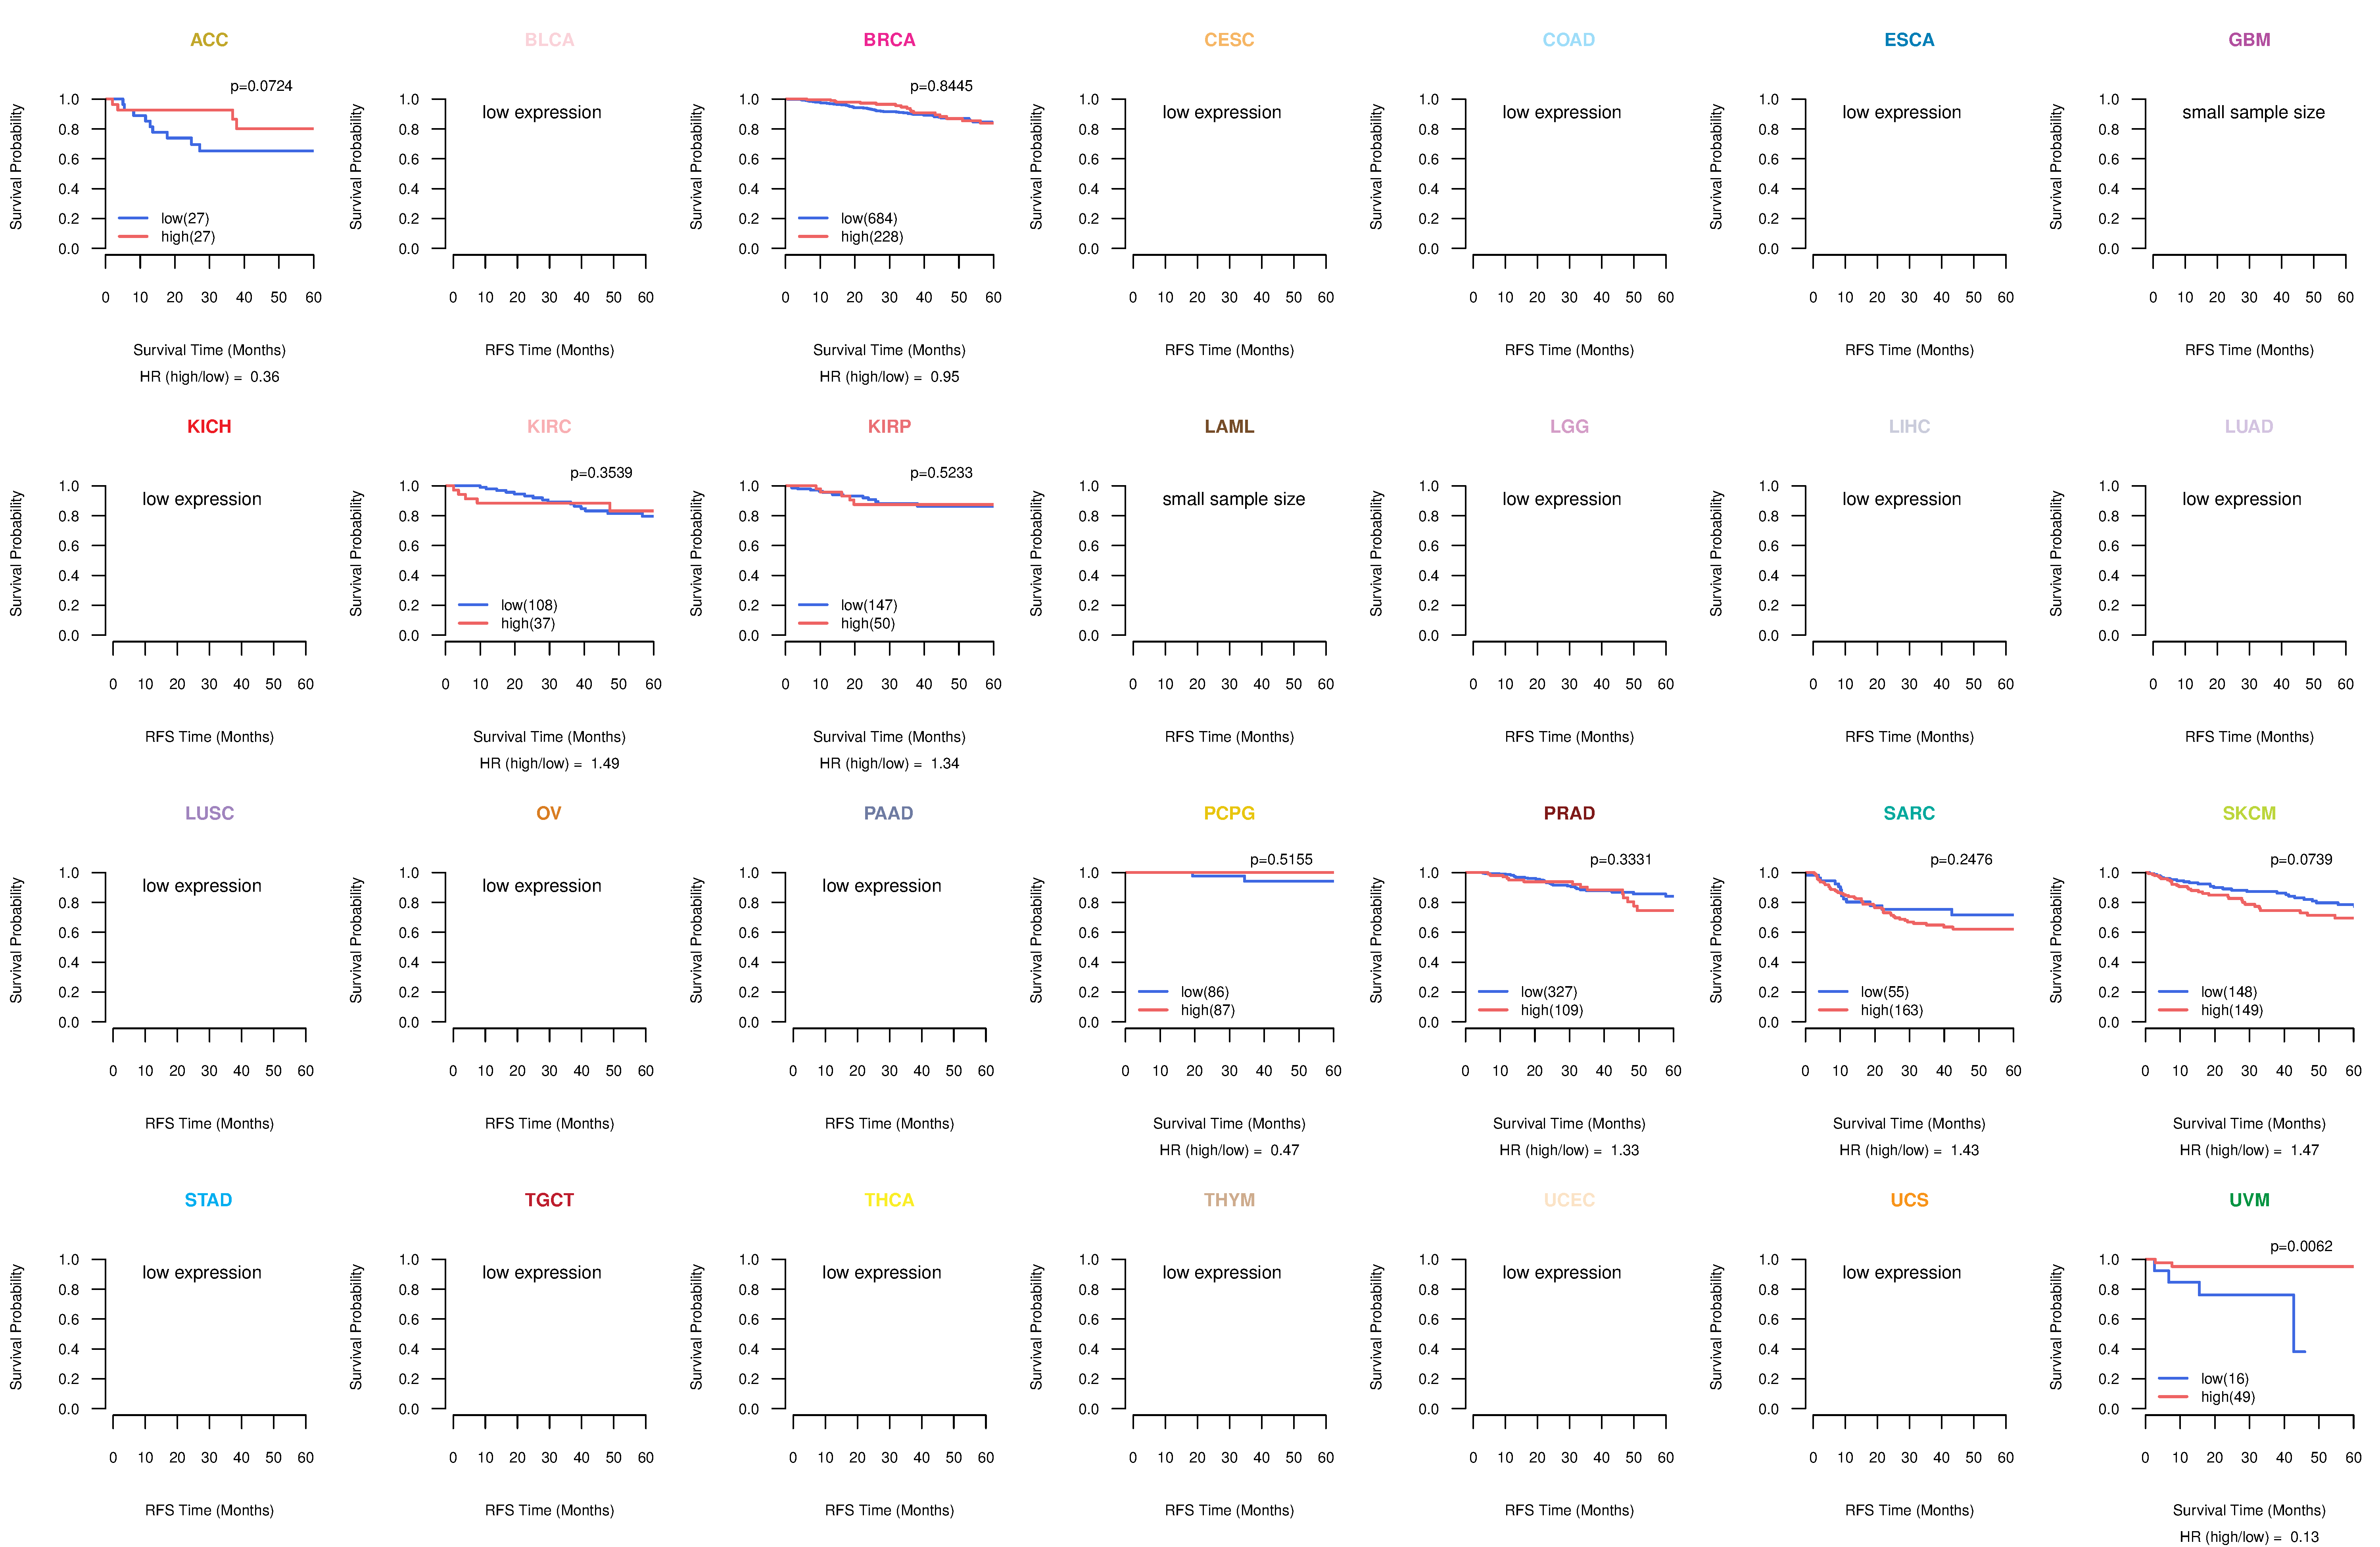
| Kaplan-Meier plots with logrank tests of overall survival (OS) using 28 cancer types (TCGA IlluminaHiSeq_RNASeqV2, pan-cancer normalized log2(norm_counts+1) data, version 2016-08-16) (TCGA clinicalMatrix, phenotype data, version 2016-04-27) * Click on the image to enlarge it in a new window. |
 |
| Kaplan-Meier plots with logrank test of relapse free survival (RFS) using 28 cancer types (TCGA IlluminaHiSeq_RNASeqV2, pan-cancer normalized log2(norm_counts+1) data, version 2016-08-16) (TCGA clinicalMatrix, phenotype data, version 2016-04-27) * Click on the image enlarge it in a new window. |
 |
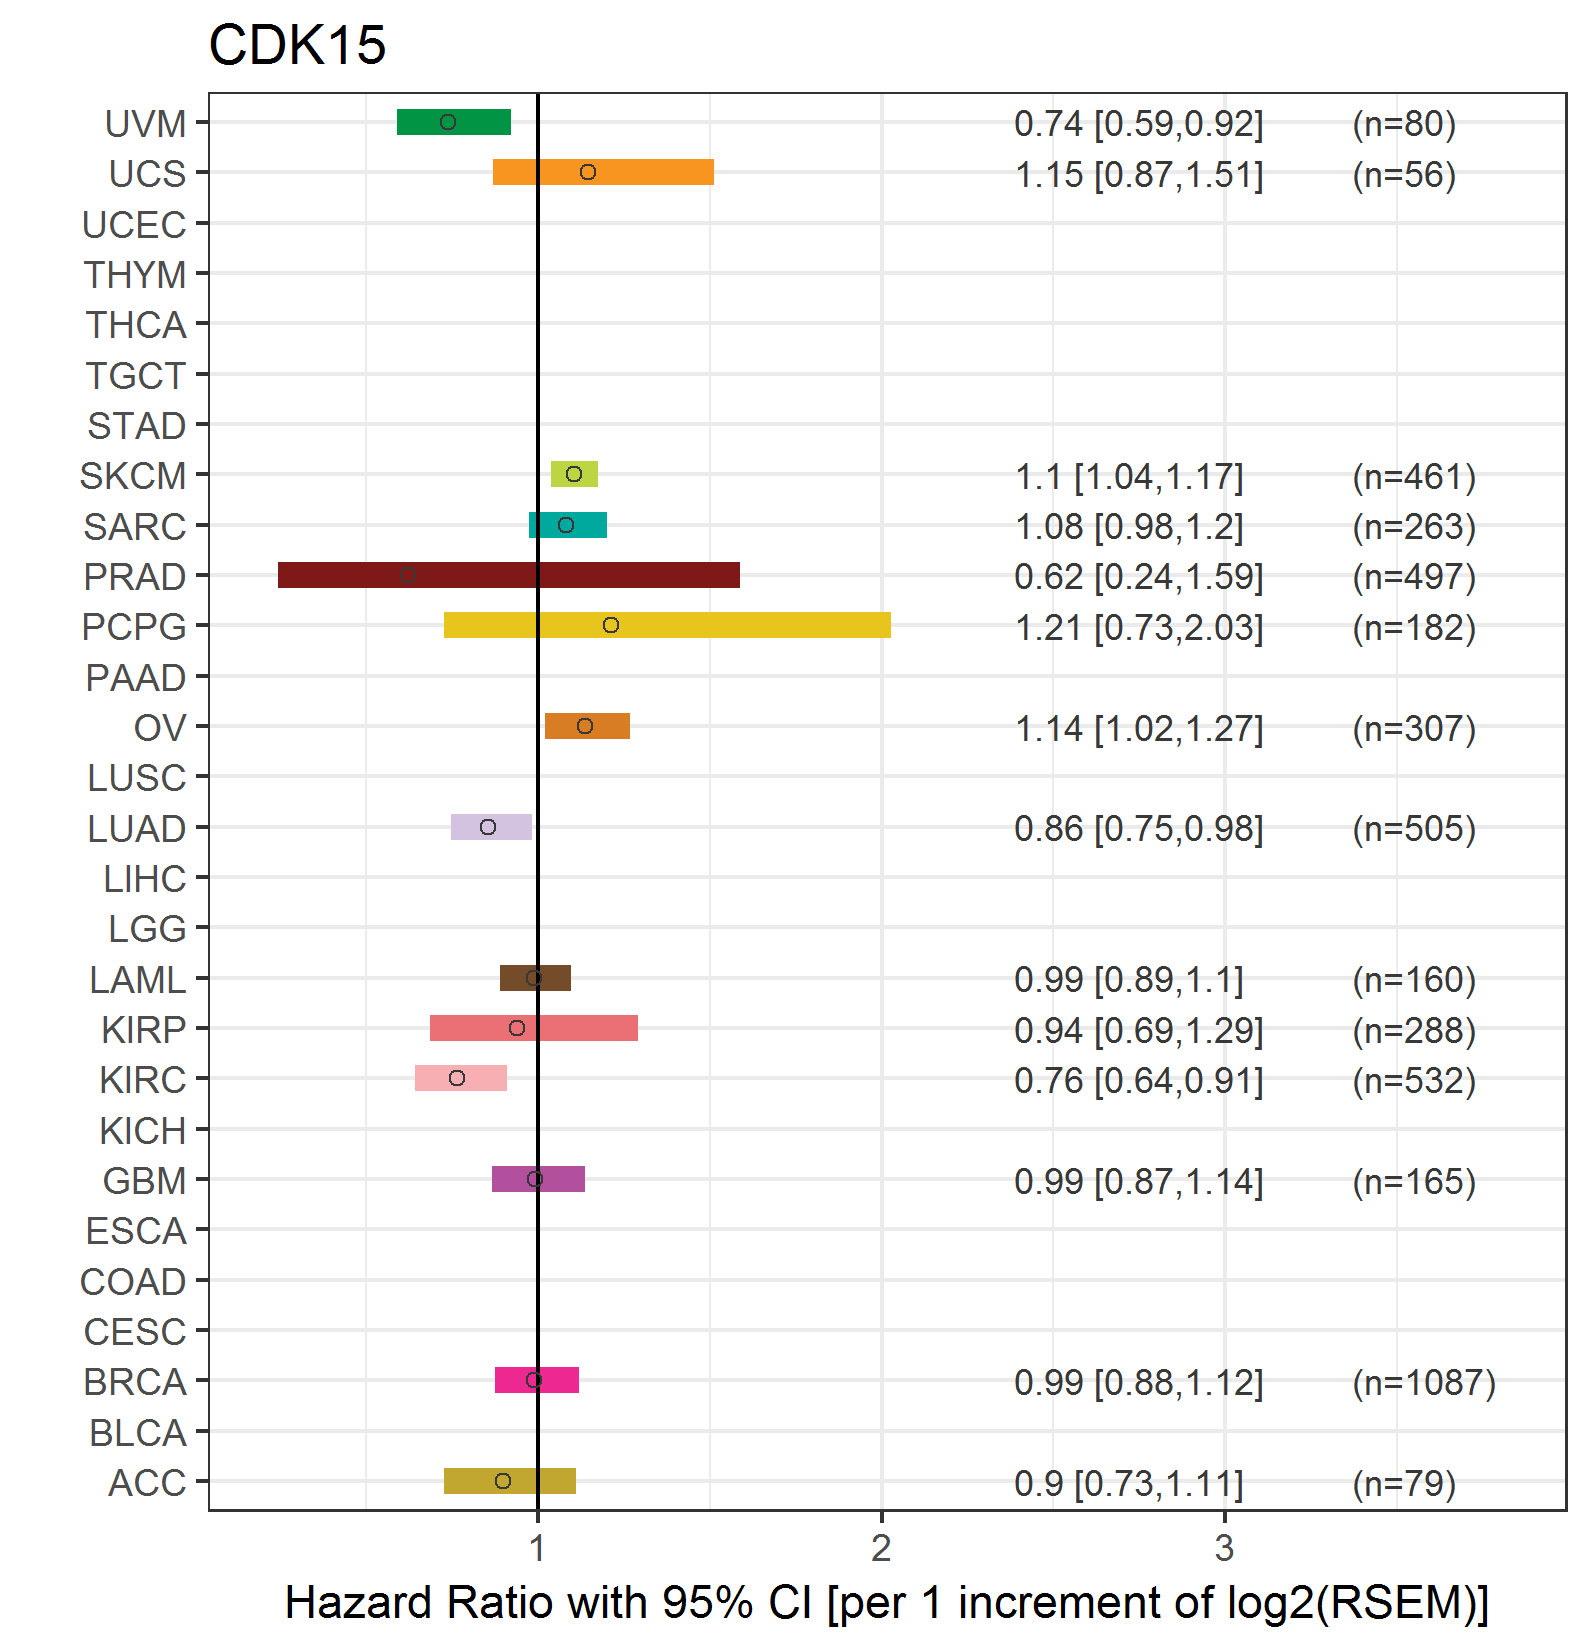
| Forest plot of Cox proportional hazard ratio (HR) and 95% CI of overall survival (OS) using 28 cancer types (TCGA IlluminaHiSeq_RNASeqV2, pan-cancer normalized log2(norm_counts+1) data, version 2016-08-16) (TCGA clinicalMatrix, phenotype data, version 2016-04-27) * Click on the image enlarge it in a new window. |
 |
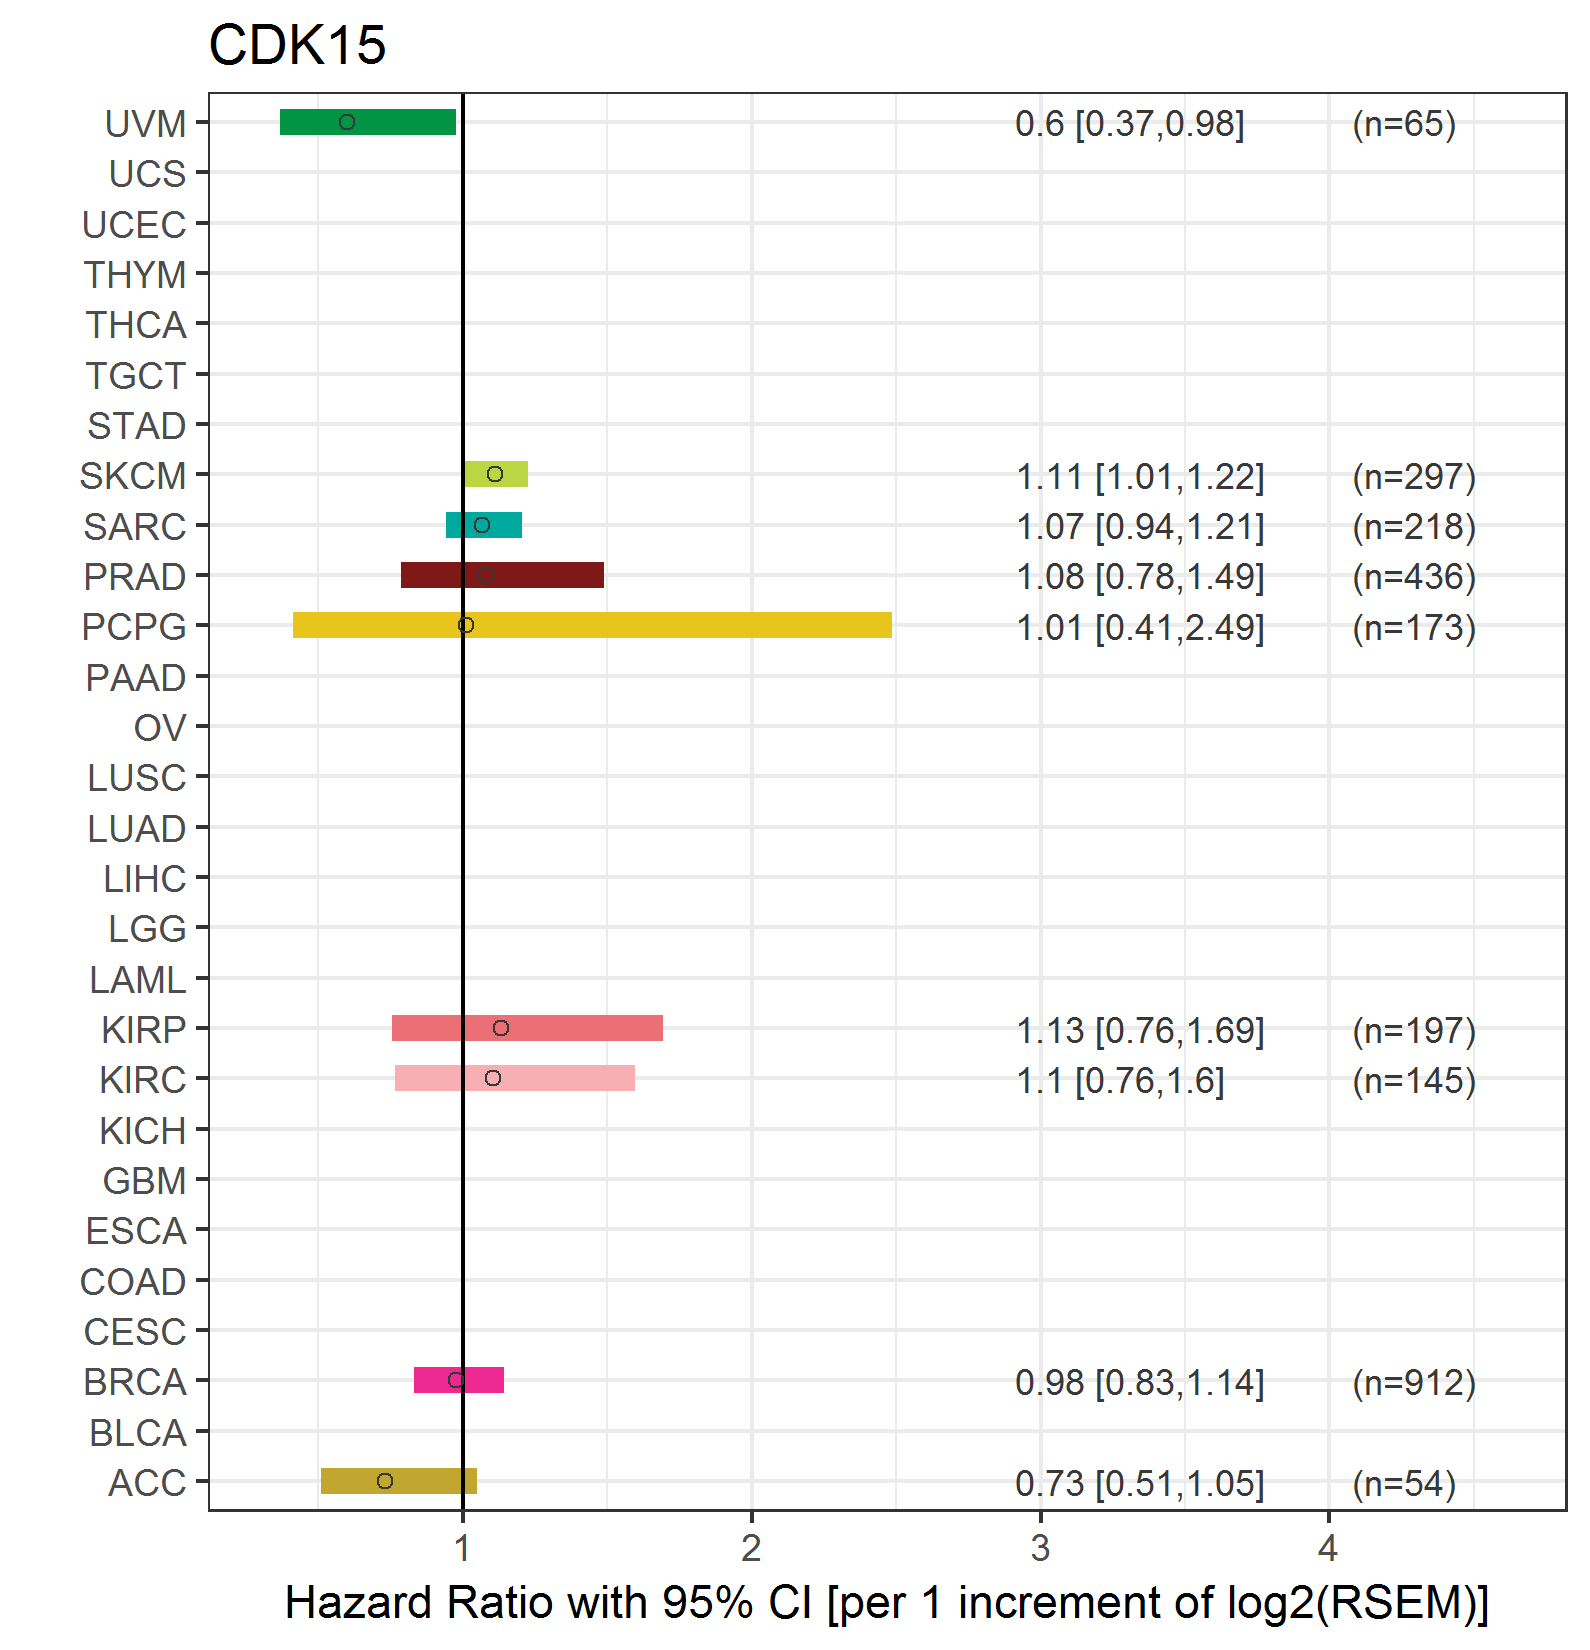
| Forest plot of Cox proportional hazard ratio (HR) and 95% CI of relapse free survival (RFS) using 28 cancer types (TCGA IlluminaHiSeq_RNASeqV2, pan-cancer normalized log2(norm_counts+1) data, version 2016-08-16) (TCGA clinicalMatrix, phenotype data, version 2016-04-27) * Click on the image enlarge it in a new window. |
 |
| Top |
| TissGeneClin for CDK15 |
| TissGeneDrug for CDK15 |
| Drug information targeting TissGene (DrugBank Version 5.0.6, 2017-04-01) |
| DrugBank ID | Drug name | Drug activity | Drug type | Drug status |
| Top |
| TissGeneDisease for CDK15 |
| Disease information associated with TissGene (DisGeNet, 2016-06-01) |
| Disease ID | Disease name | # pubmeds | Source |
| umls:C0019348 | Herpes Simplex Infections | 5 | BeFree |
| umls:C0031269 | Peutz-Jeghers Syndrome | 4 | BeFree |
| umls:C0041296 | Tuberculosis | 2 | BeFree |
| umls:C0178874 | Tumor Progression | 2 | BeFree |
| umls:C0596263 | Carcinogenesis | 2 | BeFree |
| umls:C0007124 | Noninfiltrating Intraductal Carcinoma | 1 | BeFree |
| umls:C0024623 | Malignant neoplasm of stomach | 1 | BeFree |
| umls:C0025202 | melanoma | 1 | BeFree |
| umls:C0036341 | Schizophrenia | 1 | BeFree |
| umls:C0085400 | Neurofibrillary degeneration (morphologic abnormality) | 1 | BeFree |
| umls:C0238461 | Anaplastic thyroid carcinoma | 1 | BeFree |
| umls:C0679395 | vascular ischemia | 1 | BeFree |
| umls:C0699791 | Stomach Carcinoma | 1 | BeFree |
|
Copyright 2016-Present - The University of Texas Health Science Center at Houston (UTHealth) Web File Viewing | How to Report, Fraud, Waste and Abuse | State of Texas | Statewide Search | Texas Homeland Security | Site Policies |