 |
| |
| |
| |
| |
| |
| |
|

| TissGeneSummary for SLC2A5 |
 Gene summary Gene summary |
| Basic gene information | Gene symbol | SLC2A5 |
| Gene name | solute carrier family 2 (facilitated glucose/fructose transporter), member 5 | |
| Synonyms | GLUT-5|GLUT5 | |
| Cytomap | UCSC genome browser: 1p36.2 | |
| Type of gene | protein-coding | |
| RefGenes | NR_024180.1, NM_001135585.1,NM_003039.2, | |
| Description | glucose transporter type 5, small intestineglucose transporter-like protein 5solute carrier family 2, facilitated glucose transporter member 5 | |
| Modification date | 20141207 | |
| dbXrefs | MIM : 138230 | |
| HGNC : HGNC | ||
| HPRD : 00690 | ||
| Protein | UniProt: go to UniProt's Cross Reference DB Table | |
| Expression | CleanEX: HS_SLC2A5 | |
| BioGPS: 6518 | ||
| Pathway | NCI Pathway Interaction Database: SLC2A5 | |
| KEGG: SLC2A5 | ||
| REACTOME: SLC2A5 | ||
| Pathway Commons: SLC2A5 | ||
| Context | iHOP: SLC2A5 | |
| ligand binding site mutation search in PubMed: SLC2A5 | ||
| UCL Cancer Institute: SLC2A5 | ||
| Assigned class in TissGDB* | C | |
| Included tissue-specific gene expression resources | TiGER,GTEx | |
| Specific-tissues in normal samples (assigned by TissGDB using HPA, TiGER, and GTEx) | Testis | |
| Cancer types related to the specific-tissues in cancer samples (assigned by TissGDB using TCGA) | TGCT | |
| Reference showing the relevant tissue of SLC2A5 | ||
| Description by TissGene annotations | Cancer gene | |
| * Class A consists of genes with literature evidence and is part of the cTissGenes. Class B consists of only cTissGenes without additional evidence. The remaining genes belong to Class C. |
| Gene ontology having evidence of Inferred from Direct Assay (IDA) from Entrez |
| GO ID | GO term | PubMed ID |
| Top |
| TissGeneExp for SLC2A5 |
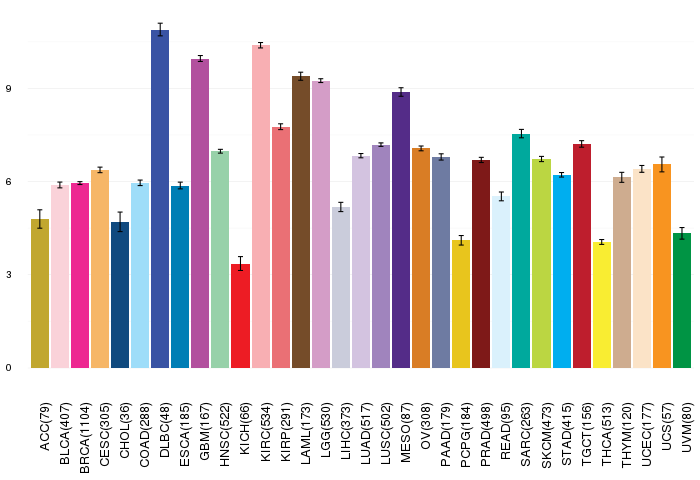
| Gene expressions across 28 cancer types (X-axis: cancer type and Y-axis: log2(norm_counts+1)) (TCGA IlluminaHiSeq_RNASeqV2, pan-cancer normalized log2(norm_counts+1) data, version 2016-08-16) |
 |
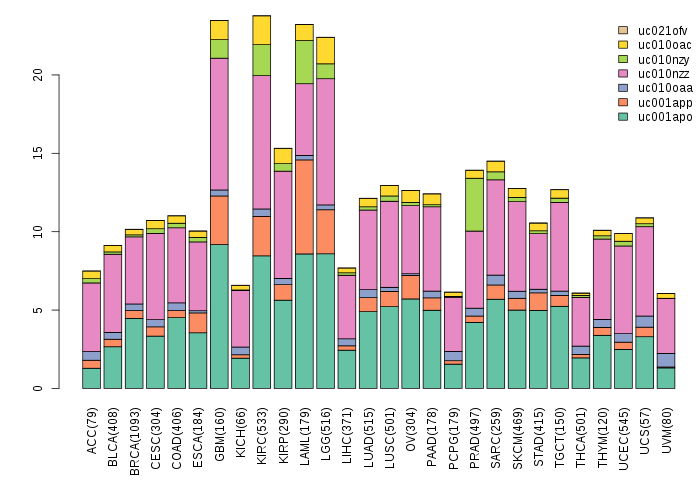
| Gene isoform expressions across 28 cancer types (X-axis: cancer type and Y-axis: log2(norm_counts+1)) (TCGA pan-cancer tcga_rsem_isoform_tpm, version 2016-09-01) |
 |
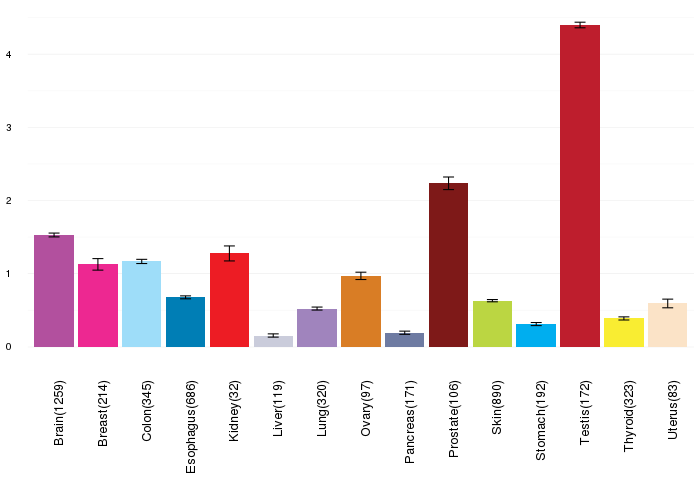
| Gene expressions across normal tissues of GTEx data (GTEx GTEx_Analysis_v6_RNA-seq_RNA-SeQCv1.1.8_gene_rpkm.gct) - Here, we shows the matched tissue types only among our 28 cancer types. |
 |
| Different expressions across 14 cancer types with more than 10 samples between matched tumors and normals (X-axis: cancer type and Y-axis: log2(norm_counts+1)) (TCGA IlluminaHiSeq_RNASeqV2, pan-cancer normalized log2(norm_counts+1) data, version 2016-08-16) |
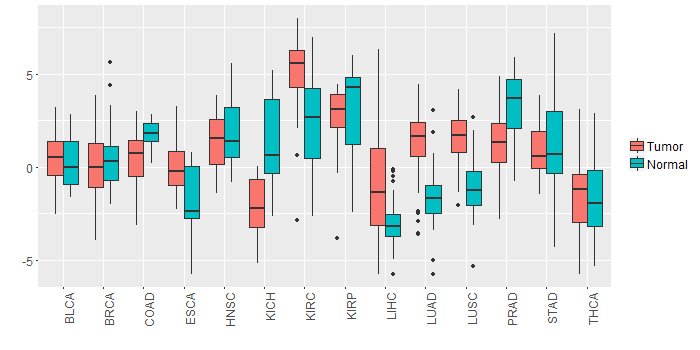 |
| - Significantly differentially expressed cancer types and information. (|Fold change|>1 and FDR<0.05) |
| Cancer type | Mean(exp) in tumor | Mean(exp) in matched normal | Log2FC | P-val. | FDR |
| LUSC | 1.631643106 | -0.999827483 | 2.631470588 | 4.31E-15 | 2.72E-14 |
| PRAD | 1.439647367 | 3.260487751 | -1.820840385 | 3.25E-07 | 2.62E-06 |
| KICH | -2.190051326 | 1.103760674 | -3.293812 | 6.34E-07 | 2.46E-06 |
| LUAD | 1.235278467 | -1.652104291 | 2.887382759 | 1.84E-16 | 2.18E-15 |
| KIRC | 5.074889674 | 2.215839674 | 2.85905 | 3.12E-13 | 1.39E-12 |
| COAD | 0.50004929 | 1.829230059 | -1.329180769 | 0.000246 | 0.000816645 |
| LIHC | -1.081243326 | -3.038713326 | 1.95747 | 2.94E-05 | 0.000112776 |
| Top |
| TissGene-miRNA for SLC2A5 |
| Significantly anti-correlated miRNAs of TissGene across 28 cancer types (Gene-miRNA relations from TargetScanHuman Relsease 7.1, Conserved_Site_Context_Scores.txt.zip, 06.01.2016) (TCGA IlluminaHiSeq_miRNASeq, log2(RPM+1) data, version 2016-11-21) (TCGA IlluminaHiSeq_RNASeqV2, log2(normalized_count+1) data, version 2016-08-16) (Spearman’s Rank Correlation (p-value<0.05 and coefficient<-0.25)) |
| Cancer type | miRNA id | miRNA accession | P-val. | Coeff. | # samples |
| Top |
| TissGeneMut for SLC2A5 |
| TissGeneSNV for SLC2A5 |
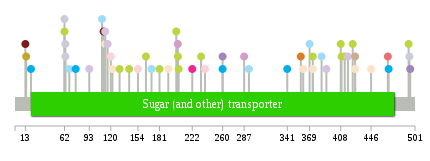
| nsSNV counts per each loci. Different colors of circles represent different cancer types. Circle size denotes number of samples. (TCGA somatic mutation (SNPs and small INDELs) data, version 2016-04-25) * Click on the image to enlarge it in a new window. |
 |
 |
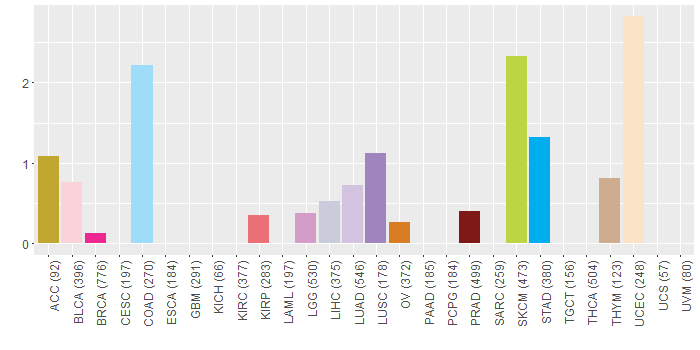
| Somatic nucleotide variants of TissGene across 28 cancer types (X-axis: cancer type and Y-axis: % of mutated samples) The numbers in parentheses are numbers of samples with mutation (nsSNVs). (TCGA somatic mutation (SNPs and small INDELs) data, version 2016-04-25) |
 |
| - nsSNVs sorted by frequency. |
| AAchange | Cancer type | # samples |
| p.M116R | LUAD | 1 |
| p.A233T | SKCM | 1 |
| p.P495T | LUSC | 1 |
| p.L13M | PRAD | 1 |
| p.A20V | STAD | 1 |
| p.T205I | SKCM | 1 |
| p.G287D | LGG | 1 |
| p.V164G | SKCM | 1 |
| p.A113E | UCEC | 1 |
| p.A113V | LUAD | 1 |
| p.V293I | COAD | 1 |
| p.E192* | UCEC | 1 |
| p.K477N | READ | 1 |
| p.A154V | BLCA | 1 |
| p.S76F | STAD | 1 |
| p.N423S | SKCM | 1 |
| p.R408W | SKCM | 1 |
| p.A260V | STAD | 1 |
| p.V384I | COAD | 1 |
| p.P373L | SKCM | 1 |
| p.P373A | UCEC | 1 |
| p.V93E | LUAD | 1 |
| p.M62I | SKCM | 1 |
| p.L494P | LIHC | 1 |
| p.M62I | LIHC | 1 |
| p.E493K | SKCM | 1 |
| p.R120G | BLCA | 1 |
| p.T171A | COAD | 1 |
| p.A204T | SKCM | 1 |
| p.A446D | UCEC | 1 |
| p.L222F | BRCA | 1 |
| p.T68M | COAD | 1 |
| p.G390W | LUAD | 1 |
| p.F468C | STAD | 1 |
| p.S131F | SKCM | 1 |
| p.V369E | COAD | 1 |
| p.V111M | PRAD | 1 |
| p.P409L | SKCM | 1 |
| p.T467A | KIRP | 1 |
| p.M413I | SKCM | 1 |
| p.R238C | BLCA | 1 |
| p.A122T | UCEC | 1 |
| p.T14M | ACC | 1 |
| p.S417G | LUAD | 1 |
| p.E63X | LIHC | 1 |
| p.A361E | UCEC | 1 |
| p.P147A | HNSC | 1 |
| p.A260V | LUSC | 1 |
| p.S143F | SKCM | 1 |
| p.G436S | DLBC | 1 |
| p.P202L | SKCM | 1 |
| p.S109Y | COAD | 1 |
| p.R341Q | STAD | 1 |
| p.G181D | SKCM | 1 |
| p.A204G | LGG | 1 |
| p.V426M | UCEC | 1 |
| p.V358M | OV | 1 |
| p.V426M | THYM | 1 |
| p.E63* | LIHC | 1 |
| Top |
| TissGeneCNV for SLC2A5 |
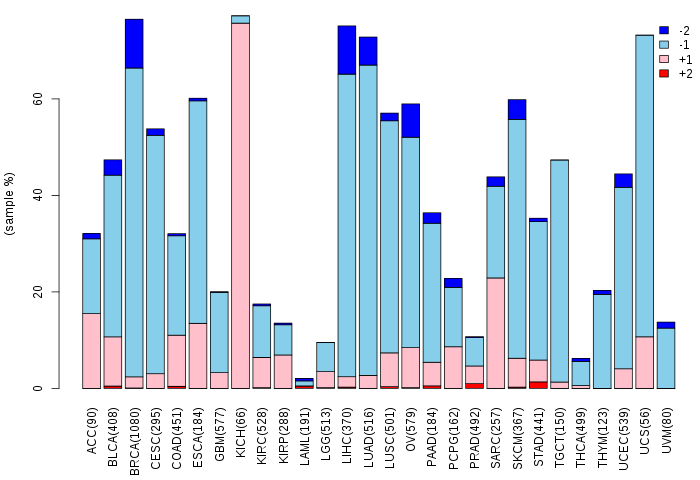
| Copy number variations of TissGene across 28 cancer types (X-axis: cancer type and Y-axis: % of CNV samples) (TCGA Gistic2_CopyNumber_Gistic2_all_data_by_genes, Gistic2 copy number data, version 2016-08-16) |
 |
| Top |
| TissGeneFusions for SLC2A5 |
| Fusion genes including TissGene (ChimerDB 3.0, 2016-12-01 and TCGA fusion Portal 2015-12-01) |
| Database | Src | Cancer type | Sample | Fusion gene | ORF | 5'-gene BP | 3'-gene BP |
| Chimerdb3.0 | ChiTaRs | NA | BP264264 | ITM2C-SLC2A5 | chr2:231740437 | chr1:9097639 | |
| TCGAfusionPortal | PRADA | BRCA | TCGA-A8-A09E-01A | TRIM11-SLC2A5 | In-frame | Chr1:228588665 | Chr1:9098565 |
| TCGAfusionPortal | PRADA | LUAD | TCGA-55-7576-01A | RERE-SLC2A5 | 5UTR-5UTR | Chr1:8877219 | Chr1:9129653 |
| Top |
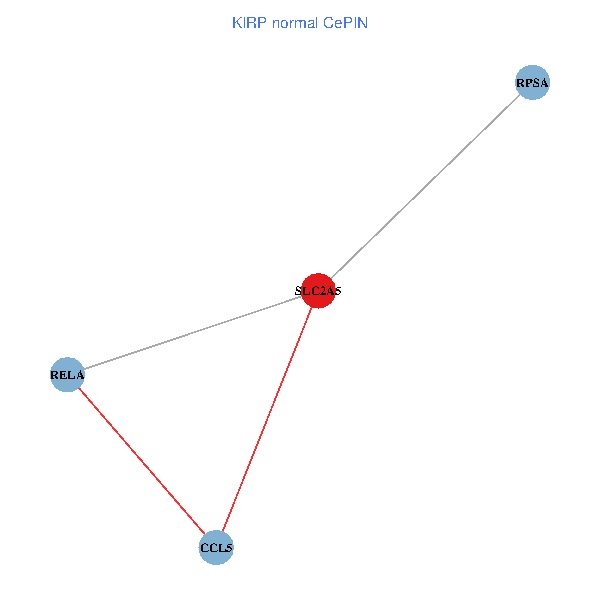
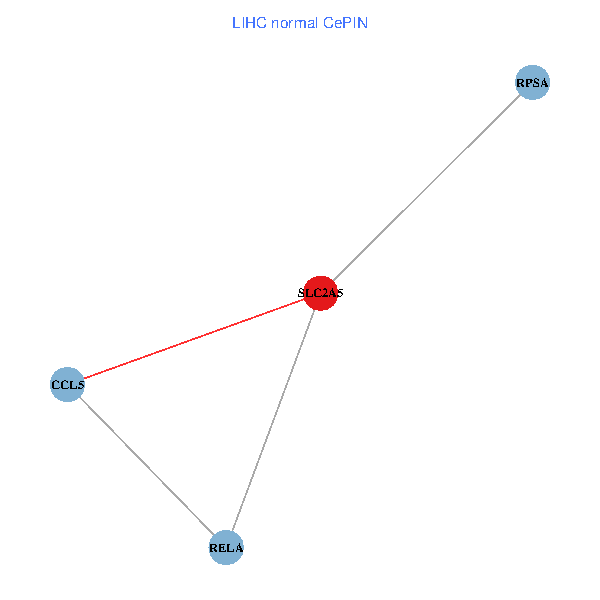
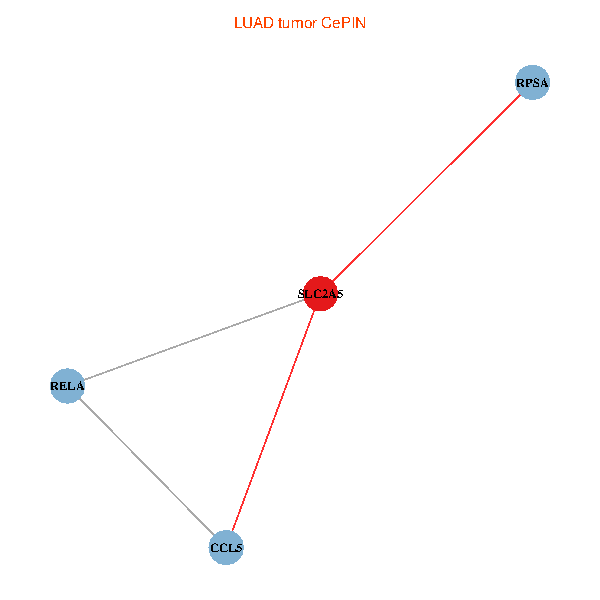
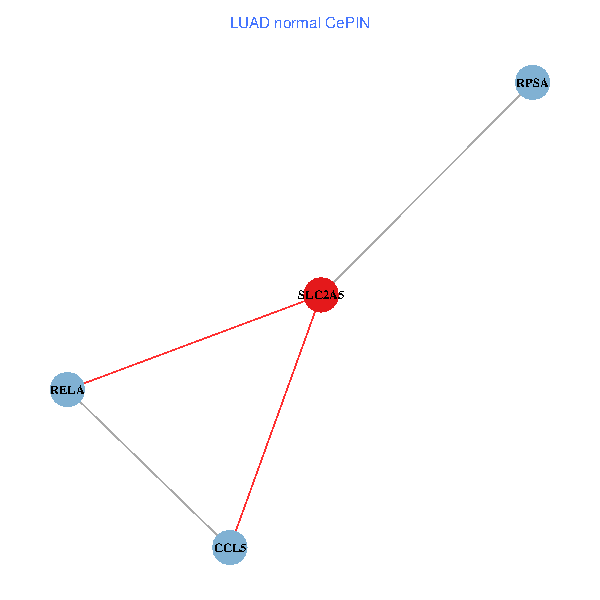
| TissGeneNet for SLC2A5 |
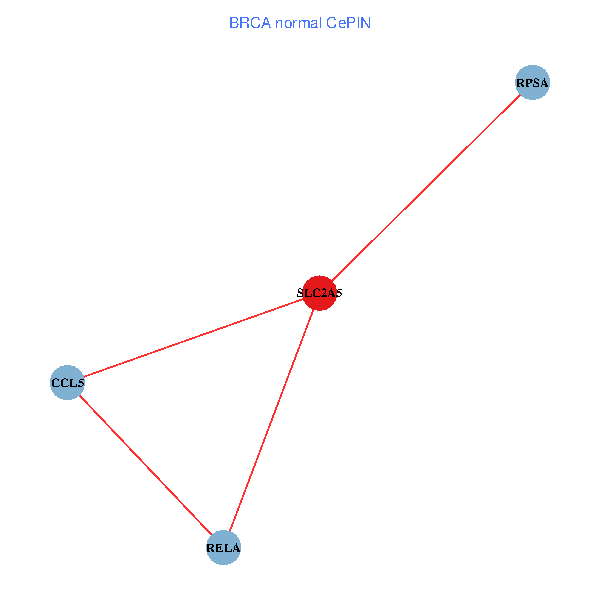
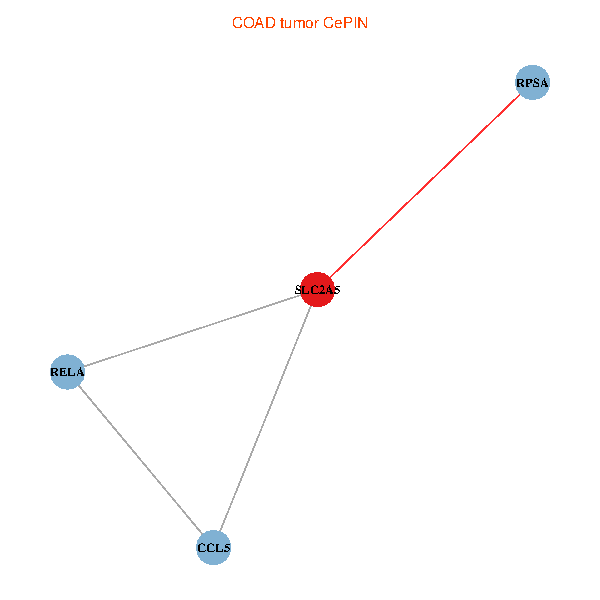
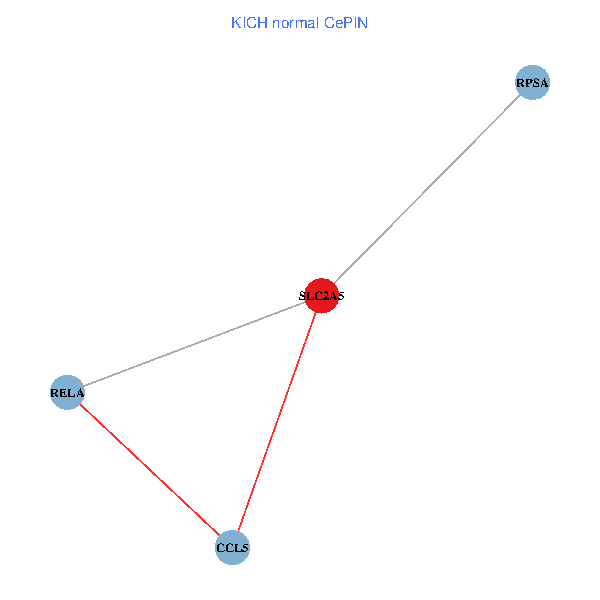
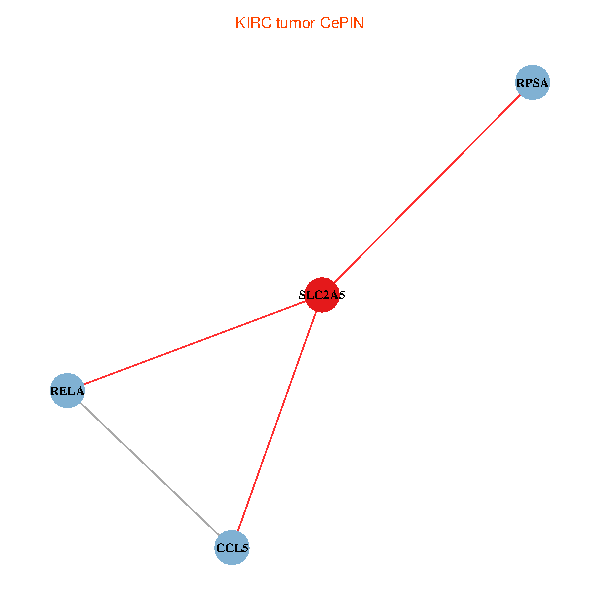
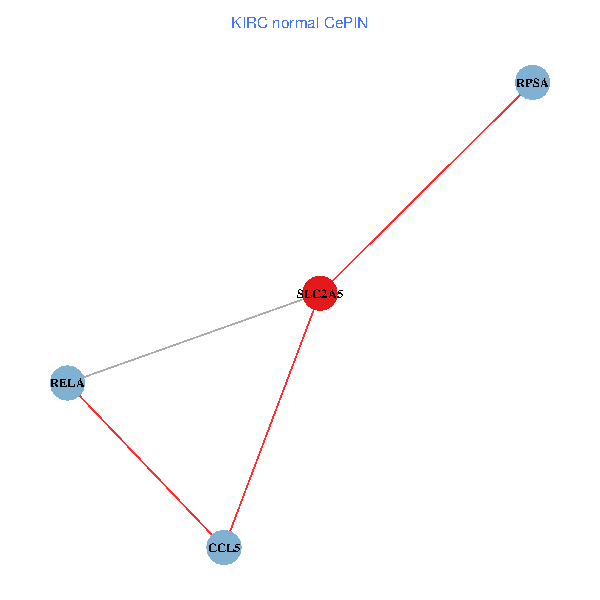
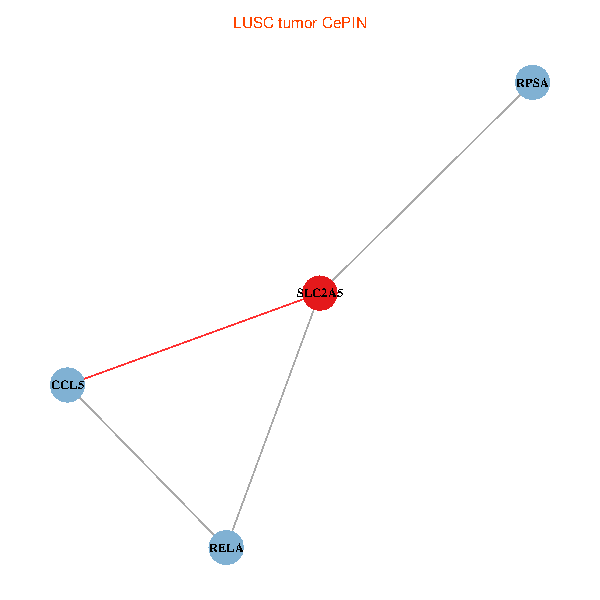
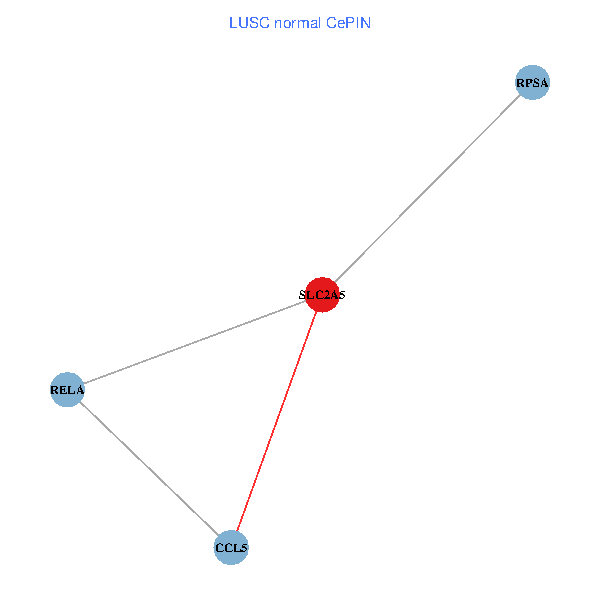
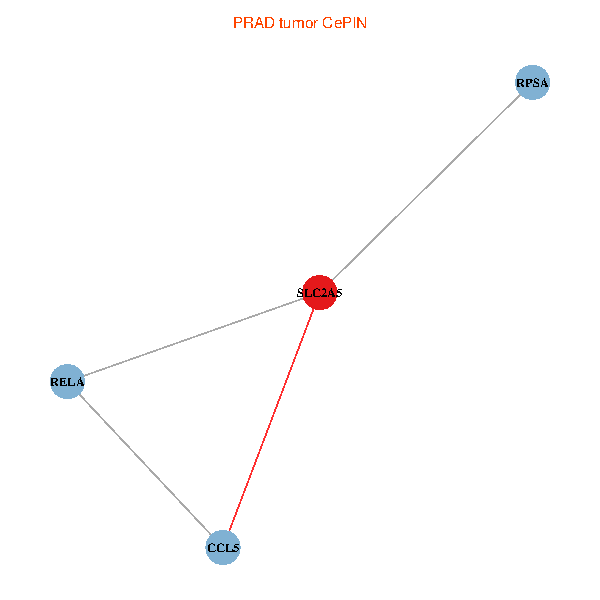
| Co-expressed gene networks based on protein-protein interaction data (CePIN) (TCGA IlluminaHiSeq_RNASeqV2, pan-cancer normalized log2(norm_counts+1) data, version 2016-08-16) (PINA2 ppi data) |
| BRCA (tumor) | BRCA (normal) |
| SLC2A5, RELA, CCL5, RPSA (tumor) | SLC2A5, RELA, CCL5, RPSA (normal) |
 |  |
| COAD (tumor) | COAD (normal) |
| SLC2A5, RELA, CCL5, RPSA (tumor) | SLC2A5, RELA, CCL5, RPSA (normal) |
 |  |
| HNSC (tumor) | HNSC (normal) |
| SLC2A5, RELA, CCL5, RPSA (tumor) | SLC2A5, RELA, CCL5, RPSA (normal) |
 |  |
| KICH (tumor) | KICH (normal) |
| SLC2A5, RELA, CCL5, RPSA (tumor) | SLC2A5, RELA, CCL5, RPSA (normal) |
 |  |
| KIRC (tumor) | KIRC (normal) |
| SLC2A5, RELA, CCL5, RPSA (tumor) | SLC2A5, RELA, CCL5, RPSA (normal) |
 |  |
| KIRP (tumor) | KIRP (normal) |
| SLC2A5, RELA, CCL5, RPSA (tumor) | SLC2A5, RELA, CCL5, RPSA (normal) |
 |  |
| LIHC (tumor) | LIHC (normal) |
| SLC2A5, RELA, CCL5, RPSA (tumor) | SLC2A5, RELA, CCL5, RPSA (normal) |
 |  |
| LUAD (tumor) | LUAD (normal) |
| SLC2A5, RELA, CCL5, RPSA (tumor) | SLC2A5, RELA, CCL5, RPSA (normal) |
 |  |
| LUSC (tumor) | LUSC (normal) |
| SLC2A5, RELA, CCL5, RPSA (tumor) | SLC2A5, RELA, CCL5, RPSA (normal) |
 |  |
| PRAD (tumor) | PRAD (normal) |
| SLC2A5, RELA, CCL5, RPSA (tumor) | SLC2A5, RELA, CCL5, RPSA (normal) |
 |  |
| STAD (tumor) | STAD (normal) |
| SLC2A5, RELA, CCL5, RPSA (tumor) | SLC2A5, RELA, CCL5, RPSA (normal) |
 |  |
| THCA (tumor) | THCA (normal) |
| SLC2A5, RELA, CCL5, RPSA (tumor) | SLC2A5, RELA, CCL5, RPSA (normal) |
 |  |
| Top |
| TissGeneProg for SLC2A5 |
| Kaplan-Meier plots with logrank tests of overall survival (OS) using 28 cancer types (TCGA IlluminaHiSeq_RNASeqV2, pan-cancer normalized log2(norm_counts+1) data, version 2016-08-16) (TCGA clinicalMatrix, phenotype data, version 2016-04-27) * Click on the image to enlarge it in a new window. |
 |
| Kaplan-Meier plots with logrank test of relapse free survival (RFS) using 28 cancer types (TCGA IlluminaHiSeq_RNASeqV2, pan-cancer normalized log2(norm_counts+1) data, version 2016-08-16) (TCGA clinicalMatrix, phenotype data, version 2016-04-27) * Click on the image enlarge it in a new window. |
 |
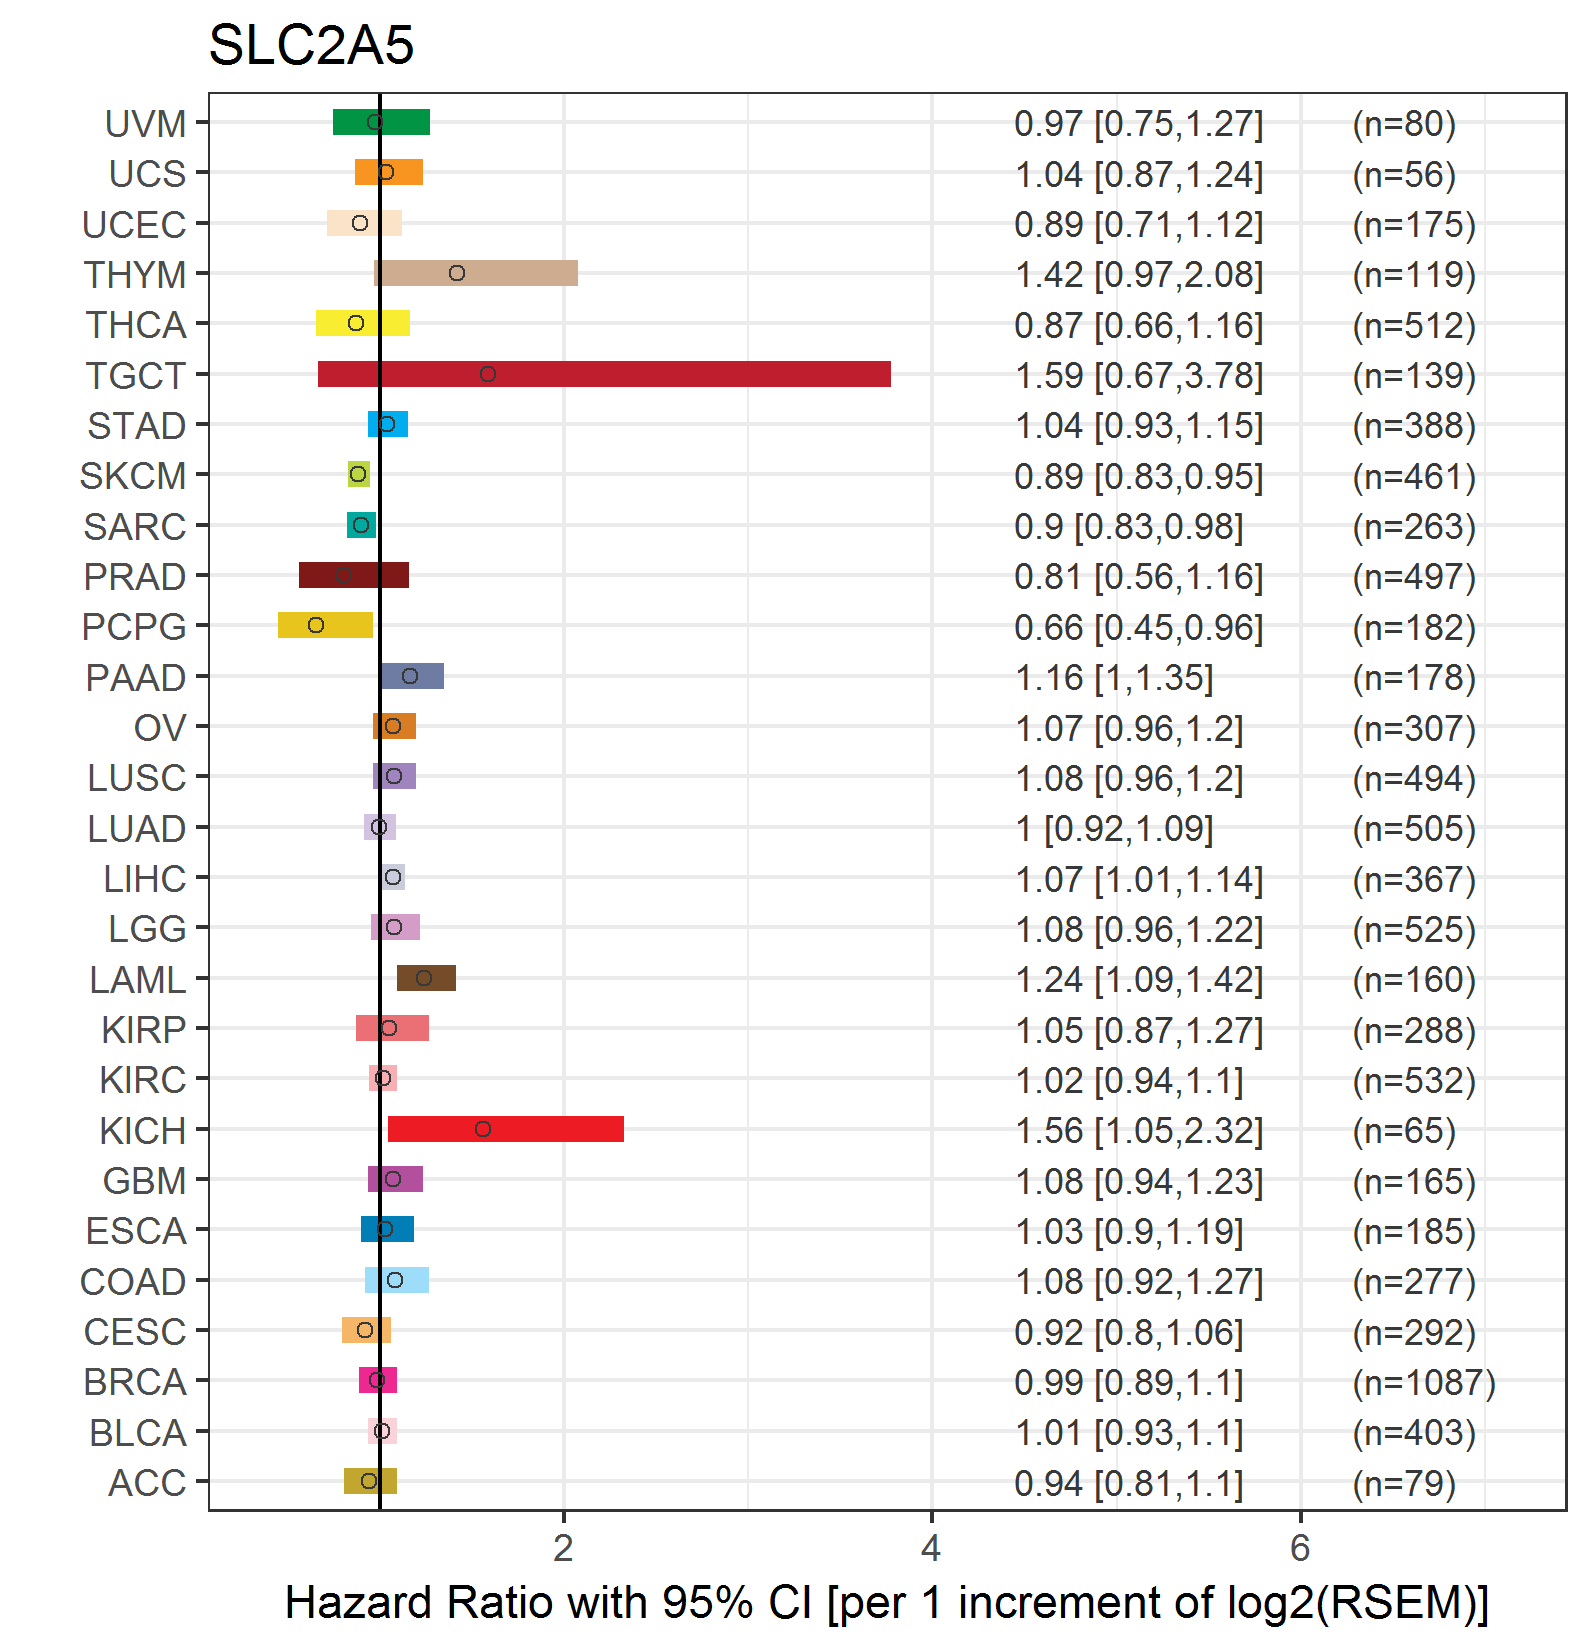
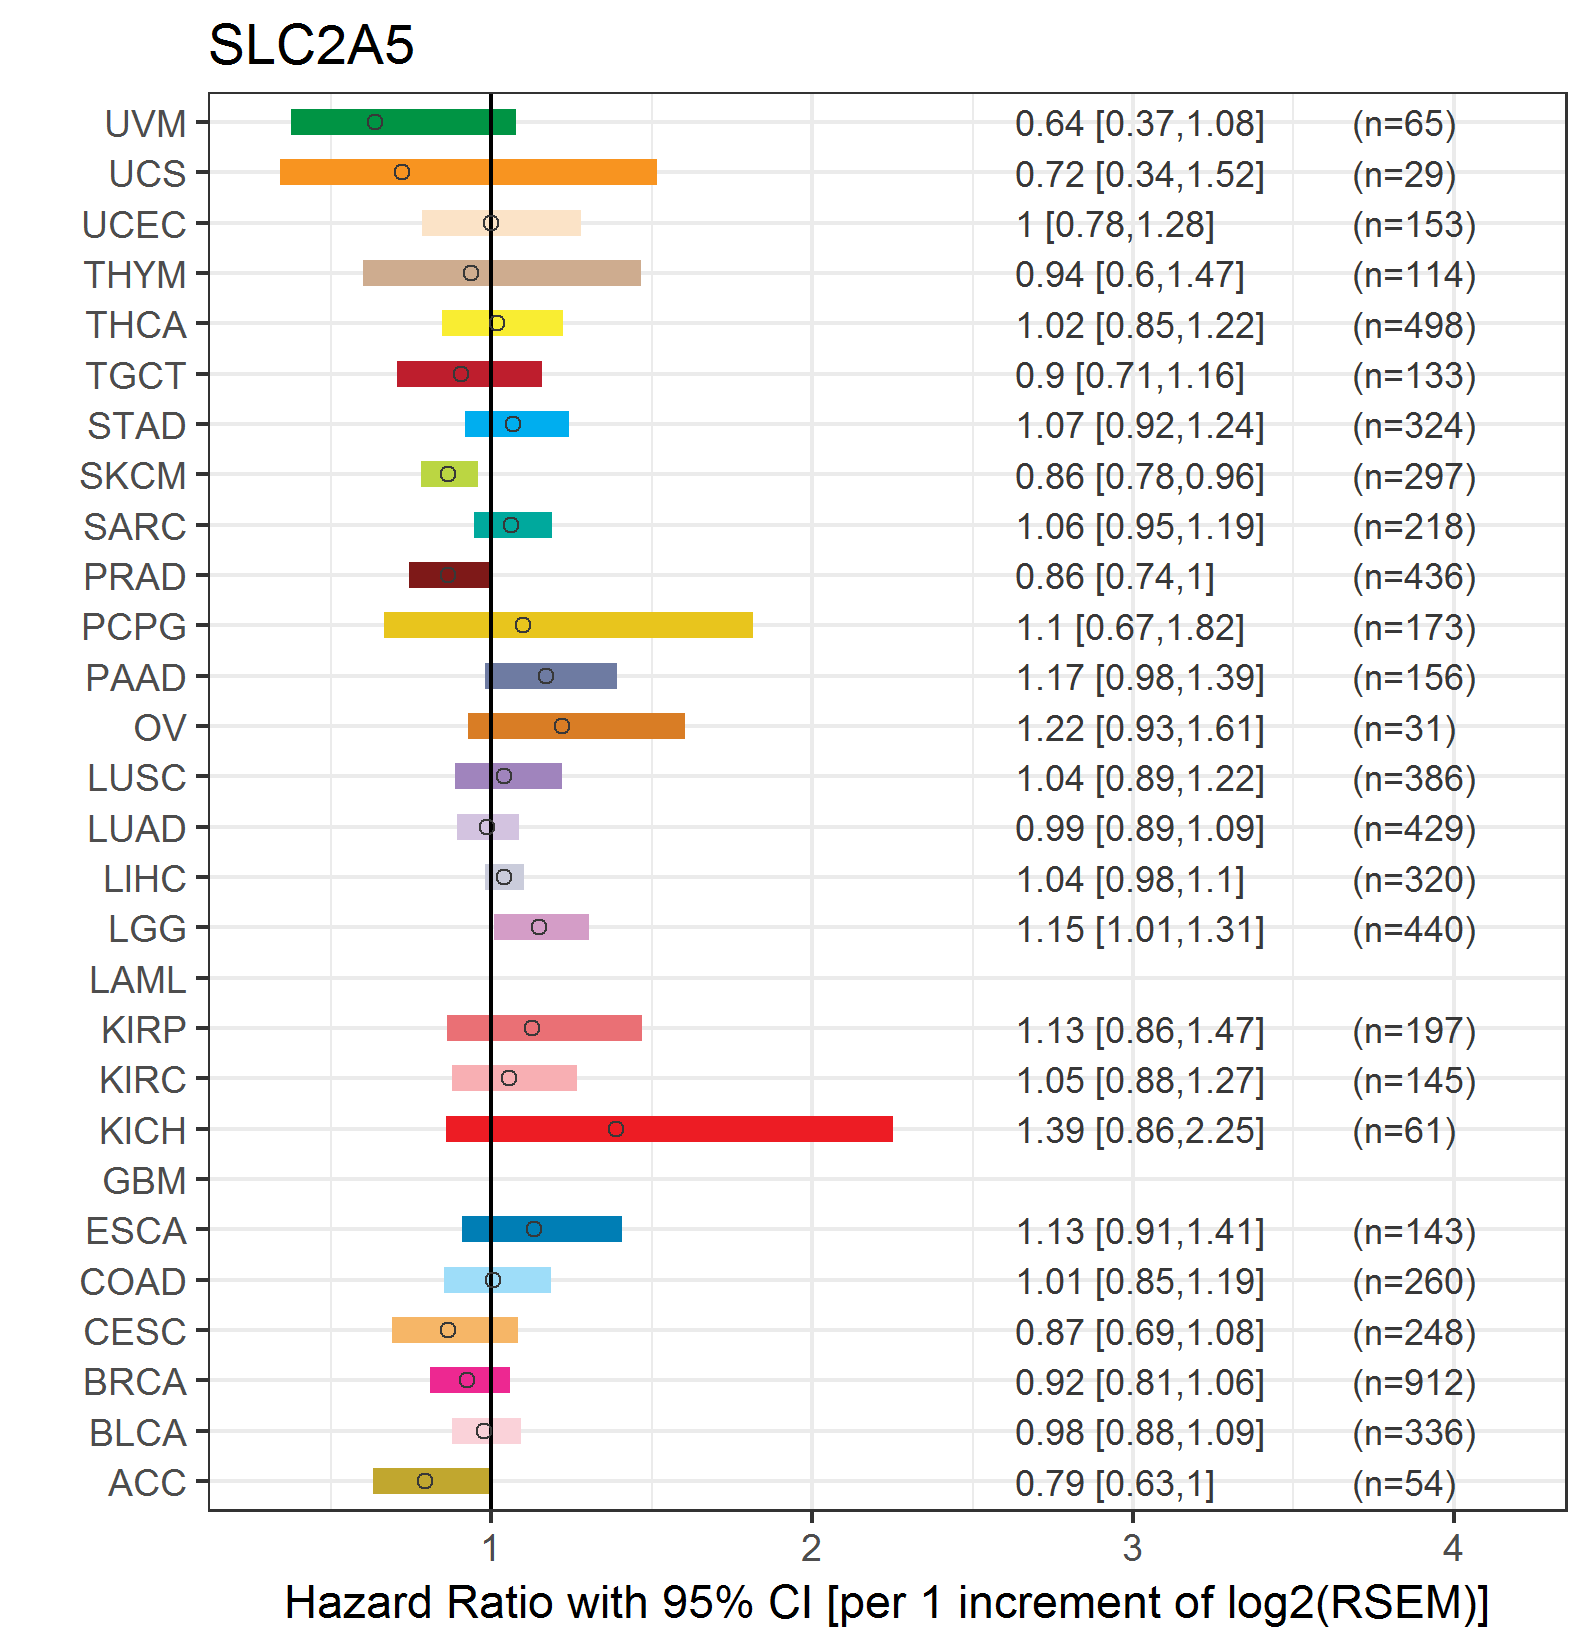
| Forest plot of Cox proportional hazard ratio (HR) and 95% CI of overall survival (OS) using 28 cancer types (TCGA IlluminaHiSeq_RNASeqV2, pan-cancer normalized log2(norm_counts+1) data, version 2016-08-16) (TCGA clinicalMatrix, phenotype data, version 2016-04-27) * Click on the image enlarge it in a new window. |
 |
| Forest plot of Cox proportional hazard ratio (HR) and 95% CI of relapse free survival (RFS) using 28 cancer types (TCGA IlluminaHiSeq_RNASeqV2, pan-cancer normalized log2(norm_counts+1) data, version 2016-08-16) (TCGA clinicalMatrix, phenotype data, version 2016-04-27) * Click on the image enlarge it in a new window. |
 |
| Top |
| TissGeneClin for SLC2A5 |
| TissGeneDrug for SLC2A5 |
| Drug information targeting TissGene (DrugBank Version 5.0.6, 2017-04-01) |
| DrugBank ID | Drug name | Drug activity | Drug type | Drug status |
| Top |
| TissGeneDisease for SLC2A5 |
| Disease information associated with TissGene (DisGeNet, 2016-06-01) |
| Disease ID | Disease name | # pubmeds | Source |
| umls:C0006142 | Malignant neoplasm of breast | 4 | BeFree |
| umls:C0024523 | Malabsorption Syndrome | 4 | BeFree |
| umls:C0678222 | Breast Carcinoma | 4 | BeFree |
| umls:C0020538 | Hypertensive disease | 3 | BeFree |
| umls:C1458155 | Mammary Neoplasms | 2 | BeFree,CTD_human |
| umls:C0011860 | Diabetes Mellitus, Non-Insulin-Dependent | 1 | BeFree |
| umls:C0023903 | Liver neoplasms | 1 | BeFree |
| umls:C0040336 | Tobacco Use Disorder | 1 | GAD |
| umls:C0152013 | Adenocarcinoma of lung (disorder) | 1 | BeFree |
| umls:C0338106 | Adenocarcinoma of colon | 1 | BeFree |
| umls:C0376358 | Malignant neoplasm of prostate | 1 | BeFree |
| umls:C0524620 | Metabolic Syndrome X | 1 | BeFree |
| umls:C0600139 | Prostate carcinoma | 1 | BeFree |
| umls:C1334015 | High Grade Intraepithelial Neoplasia | 1 | BeFree |
| umls:C1800706 | Idiopathic Pulmonary Fibrosis | 1 | BeFree |
| umls:C2239176 | Liver carcinoma | 1 | BeFree |
|
Copyright 2016-Present - The University of Texas Health Science Center at Houston (UTHealth) Web File Viewing | How to Report, Fraud, Waste and Abuse | State of Texas | Statewide Search | Texas Homeland Security | Site Policies |