 |
| |
| |
| |
| |
| |
| |
|

| TissGeneSummary for SLC5A2 |
 Gene summary Gene summary |
| Basic gene information | Gene symbol | SLC5A2 |
| Gene name | solute carrier family 5 (sodium/glucose cotransporter), member 2 | |
| Synonyms | SGLT2 | |
| Cytomap | UCSC genome browser: 16p11.2 | |
| Type of gene | protein-coding | |
| RefGenes | NM_003041.3, | |
| Description | Na(+)/glucose cotransporter 2low affinity sodium-glucose cotransportersodium/glucose cotransporter 2solute carrier family 5 (sodium/glucose transporter), member 2solute carrier family 5 member 2 | |
| Modification date | 20141207 | |
| dbXrefs | MIM : 182381 | |
| HGNC : HGNC | ||
| Ensembl : ENSG00000140675 | ||
| HPRD : 08919 | ||
| Vega : OTTHUMG00000176620 | ||
| Protein | UniProt: go to UniProt's Cross Reference DB Table | |
| Expression | CleanEX: HS_SLC5A2 | |
| BioGPS: 6524 | ||
| Pathway | NCI Pathway Interaction Database: SLC5A2 | |
| KEGG: SLC5A2 | ||
| REACTOME: SLC5A2 | ||
| Pathway Commons: SLC5A2 | ||
| Context | iHOP: SLC5A2 | |
| ligand binding site mutation search in PubMed: SLC5A2 | ||
| UCL Cancer Institute: SLC5A2 | ||
| Assigned class in TissGDB* | A | |
| Included tissue-specific gene expression resources | HPA,TiGER,GTEx | |
| Specific-tissues in normal samples (assigned by TissGDB using HPA, TiGER, and GTEx) | KidneyTestis | |
| Cancer types related to the specific-tissues in cancer samples (assigned by TissGDB using TCGA) | KIRC,KIRP,KICHTGCT | |
| Reference showing the relevant tissue of SLC5A2 | Pygo1 and Pygo2 roles in Wnt signaling in mammalian kidney development. Schwab KR, Patterson LT, Hartman HA, Song N, Lang RA, Lin X, Potter SS. BMC Biol. 2007 (pmid:17425782) go to article | |
| Description by TissGene annotations | ||
| * Class A consists of genes with literature evidence and is part of the cTissGenes. Class B consists of only cTissGenes without additional evidence. The remaining genes belong to Class C. |
| Gene ontology having evidence of Inferred from Direct Assay (IDA) from Entrez |
| GO ID | GO term | PubMed ID |
| Top |
| TissGeneExp for SLC5A2 |
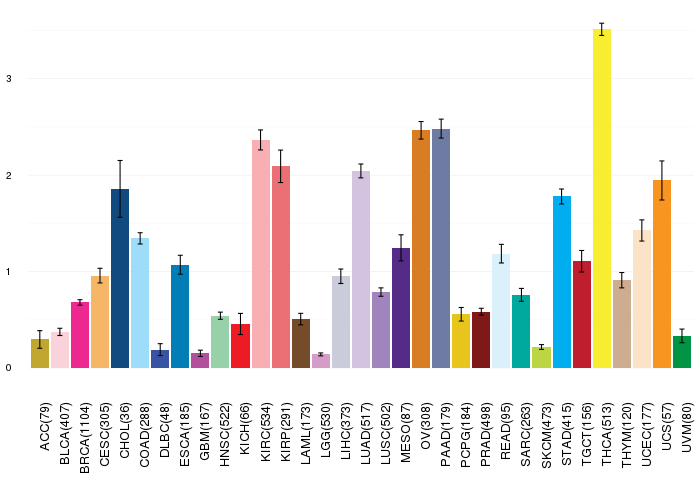
| Gene expressions across 28 cancer types (X-axis: cancer type and Y-axis: log2(norm_counts+1)) (TCGA IlluminaHiSeq_RNASeqV2, pan-cancer normalized log2(norm_counts+1) data, version 2016-08-16) |
 |
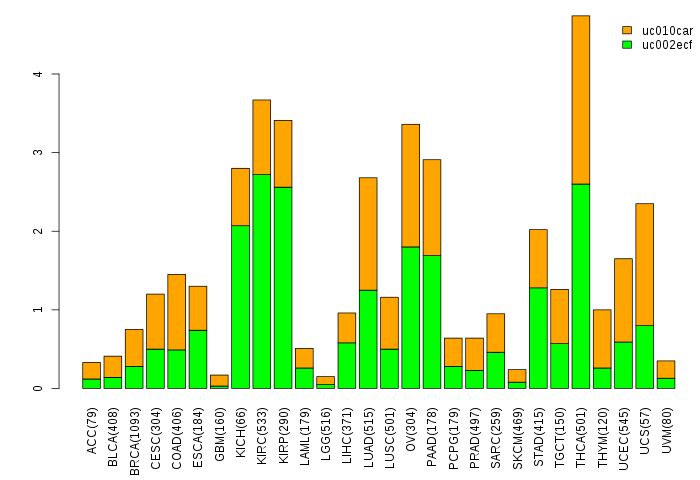
| Gene isoform expressions across 28 cancer types (X-axis: cancer type and Y-axis: log2(norm_counts+1)) (TCGA pan-cancer tcga_rsem_isoform_tpm, version 2016-09-01) |
 |
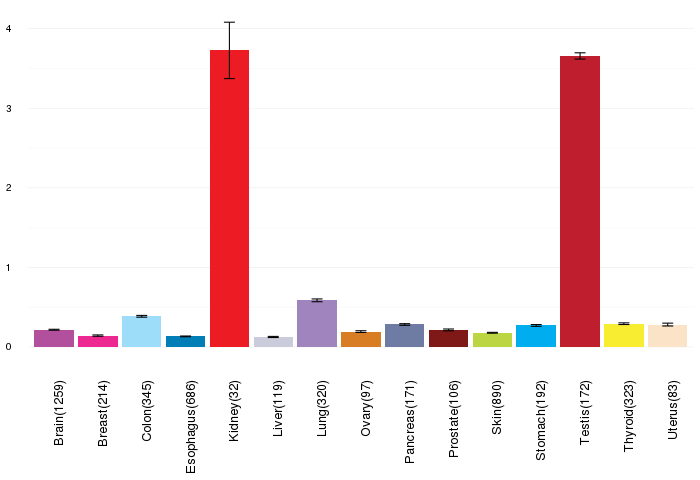
| Gene expressions across normal tissues of GTEx data (GTEx GTEx_Analysis_v6_RNA-seq_RNA-SeQCv1.1.8_gene_rpkm.gct) - Here, we shows the matched tissue types only among our 28 cancer types. |
 |
| Different expressions across 14 cancer types with more than 10 samples between matched tumors and normals (X-axis: cancer type and Y-axis: log2(norm_counts+1)) (TCGA IlluminaHiSeq_RNASeqV2, pan-cancer normalized log2(norm_counts+1) data, version 2016-08-16) |
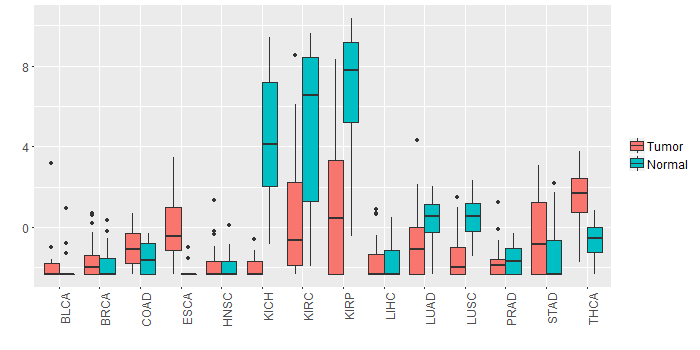 |
| - Significantly differentially expressed cancer types and information. (|Fold change|>1 and FDR<0.05) |
| Cancer type | Mean(exp) in tumor | Mean(exp) in matched normal | Log2FC | P-val. | FDR |
| LUAD | -0.825465945 | 0.462116814 | -1.287582759 | 2.37E-07 | 8.73E-07 |
| LUSC | -1.51405374 | 0.428654103 | -1.942707843 | 1.07E-16 | 8.31E-16 |
| KICH | -2.00307029 | 4.51062571 | -6.513696 | 5.63E-10 | 3.74E-09 |
| THCA | 1.437946592 | -0.588482222 | 2.026428814 | 8.82E-17 | 1.57E-15 |
| KIRC | 0.144138988 | 5.110580655 | -4.966441667 | 3.07E-15 | 1.57E-14 |
| KIRP | 1.06812996 | 6.56607996 | -5.49795 | 1.55E-08 | 1.15E-07 |
| STAD | -0.43158254 | -1.441866915 | 1.010284375 | 0.016 | 0.049360768 |
| ESCA | -0.018480835 | -2.123917199 | 2.105436364 | 0.00247 | 0.025314654 |
| Top |
| TissGene-miRNA for SLC5A2 |
| Significantly anti-correlated miRNAs of TissGene across 28 cancer types (Gene-miRNA relations from TargetScanHuman Relsease 7.1, Conserved_Site_Context_Scores.txt.zip, 06.01.2016) (TCGA IlluminaHiSeq_miRNASeq, log2(RPM+1) data, version 2016-11-21) (TCGA IlluminaHiSeq_RNASeqV2, log2(normalized_count+1) data, version 2016-08-16) (Spearman’s Rank Correlation (p-value<0.05 and coefficient<-0.25)) |
| Cancer type | miRNA id | miRNA accession | P-val. | Coeff. | # samples |
| Top |
| TissGeneMut for SLC5A2 |
| TissGeneSNV for SLC5A2 |
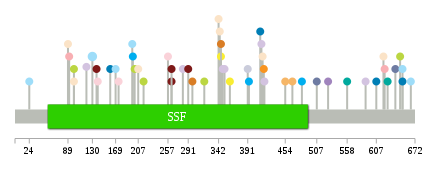
| nsSNV counts per each loci. Different colors of circles represent different cancer types. Circle size denotes number of samples. (TCGA somatic mutation (SNPs and small INDELs) data, version 2016-04-25) * Click on the image to enlarge it in a new window. |
 |
 |
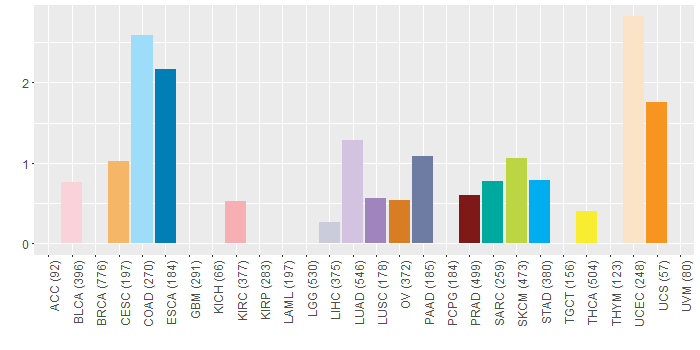
| Somatic nucleotide variants of TissGene across 28 cancer types (X-axis: cancer type and Y-axis: % of mutated samples) The numbers in parentheses are numbers of samples with mutation (nsSNVs). (TCGA somatic mutation (SNPs and small INDELs) data, version 2016-04-25) |
 |
| - nsSNVs sorted by frequency. |
| AAchange | Cancer type | # samples |
| p.R130C | COAD | 2 |
| p.G621A | KIRC | 1 |
| p.V298A | OV | 1 |
| p.F614L | HNSC | 1 |
| p.M216I | SKCM | 1 |
| p.G449D | HNSC | 1 |
| p.W291* | PRAD | 1 |
| p.M391I | LIHC | 1 |
| p.G318W | SKCM | 1 |
| p.R639Q | PAAD | 1 |
| p.M333I | HNSC | 1 |
| p.A24T | COAD | 1 |
| p.P647L | SKCM | 1 |
| p.G507R | PAAD | 1 |
| p.P619S | UCEC | 1 |
| p.A169T | COAD | 1 |
| p.V144A | HNSC | 1 |
| p.C589W | LUAD | 1 |
| p.S515L | HNSC | 1 |
| p.R558H | SARC | 1 |
| p.R651H | COAD | 1 |
| p.A120E | LUAD | 1 |
| p.R416W | UCEC | 1 |
| p.V346M | OV | 1 |
| p.E99K | UCEC | 1 |
| p.G282R | LUAD | 1 |
| p.V665M | COAD | 1 |
| p.E342K | UCEC | 1 |
| p.G418S | UCS | 1 |
| p.A89T | UCEC | 1 |
| p.P466S | CESC | 1 |
| p.E632* | HNSC | 1 |
| p.E349Q | LUAD | 1 |
| p.Y526D | LUSC | 1 |
| p.R137H | PRAD | 1 |
| p.F230L | HNSC | 1 |
| p.A90V | HNSC | 1 |
| p.R352S | LUAD | 1 |
| p.R257G | BLCA | 1 |
| p.I174M | BLCA | 1 |
| p.S460C | HNSC | 1 |
| p.F160S | ESCA | 1 |
| p.E482D | STAD | 1 |
| p.A344V | UCEC | 1 |
| p.V346M | THCA | 1 |
| p.R139H | BLCA | 1 |
| p.L197P | COAD | 1 |
| p.C361G | THCA | 1 |
| p.F607L | ESCA | 1 |
| p.V207I | UCEC | 1 |
| p.S91G | KIRC | 1 |
| p.Y263* | PRAD | 1 |
| p.R651H | ESCA | 1 |
| p.R414Q | LUAD | 1 |
| p.D419N | LUAD | 1 |
| p.S393L | STAD | 1 |
| p.Y462* | HNSC | 1 |
| p.Y263X | PRAD | 1 |
| p.D201N | SKCM | 1 |
| p.E99K | SKCM | 1 |
| p.D454N | CESC | 1 |
| p.M198I | STAD | 1 |
| p.P502S | HNSC | 1 |
| p.R412C | ESCA | 1 |
| p.P626L | SARC | 1 |
| p.P602L | DLBC | 1 |
| Top |
| TissGeneCNV for SLC5A2 |
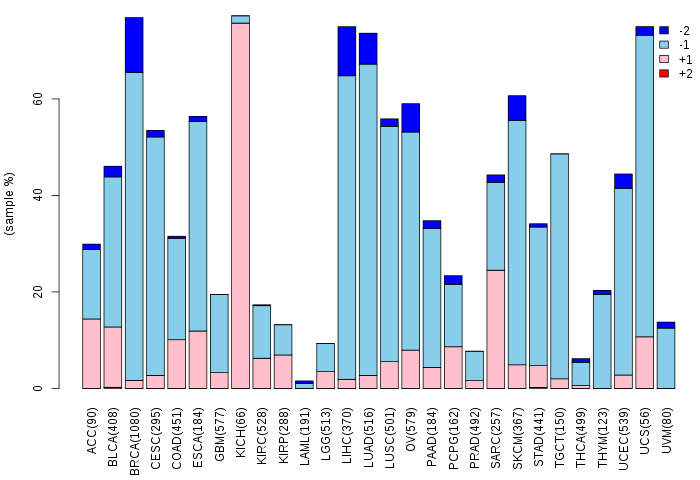
| Copy number variations of TissGene across 28 cancer types (X-axis: cancer type and Y-axis: % of CNV samples) (TCGA Gistic2_CopyNumber_Gistic2_all_data_by_genes, Gistic2 copy number data, version 2016-08-16) |
 |
| Top |
| TissGeneFusions for SLC5A2 |
| Fusion genes including TissGene (ChimerDB 3.0, 2016-12-01 and TCGA fusion Portal 2015-12-01) |
| Database | Src | Cancer type | Sample | Fusion gene | ORF | 5'-gene BP | 3'-gene BP |
| Chimerdb3.0 | ChiTaRs | NA | T29710 | SLC5A2-SLC5A2 | chr16:31501239 | chr16:31501864 | |
| Chimerdb3.0 | ChiTaRs | NA | BG913471 | SLC5A2-SLC5A2 | chr16:31501070 | chr16:31500810 | |
| Chimerdb3.0 | ChiTaRs | NA | BF944197 | SLC5A2-IGSF8 | chr16:31501280 | chr1:160061638 | |
| Chimerdb3.0 | ChiTaRs | NA | BQ367848 | SLC5A2-SLC5A2 | chr16:31501674 | chr16:31501273 | |
| Chimerdb3.0 | ChiTaRs | NA | BI517676 | SLC5A2-SLC5A2 | chr16:31500053 | chr16:31497545 | |
| Chimerdb3.0 | TopHat-Fusion | OV | TCGA-61-1743-01A | SLC5A2-C16orf58 | Out-of-Frame | chr16:31500928 | chr16:31503406 |
| Top |
| TissGeneNet for SLC5A2 |
| Co-expressed gene networks based on protein-protein interaction data (CePIN) (TCGA IlluminaHiSeq_RNASeqV2, pan-cancer normalized log2(norm_counts+1) data, version 2016-08-16) (PINA2 ppi data) |
| Top |
| TissGeneProg for SLC5A2 |
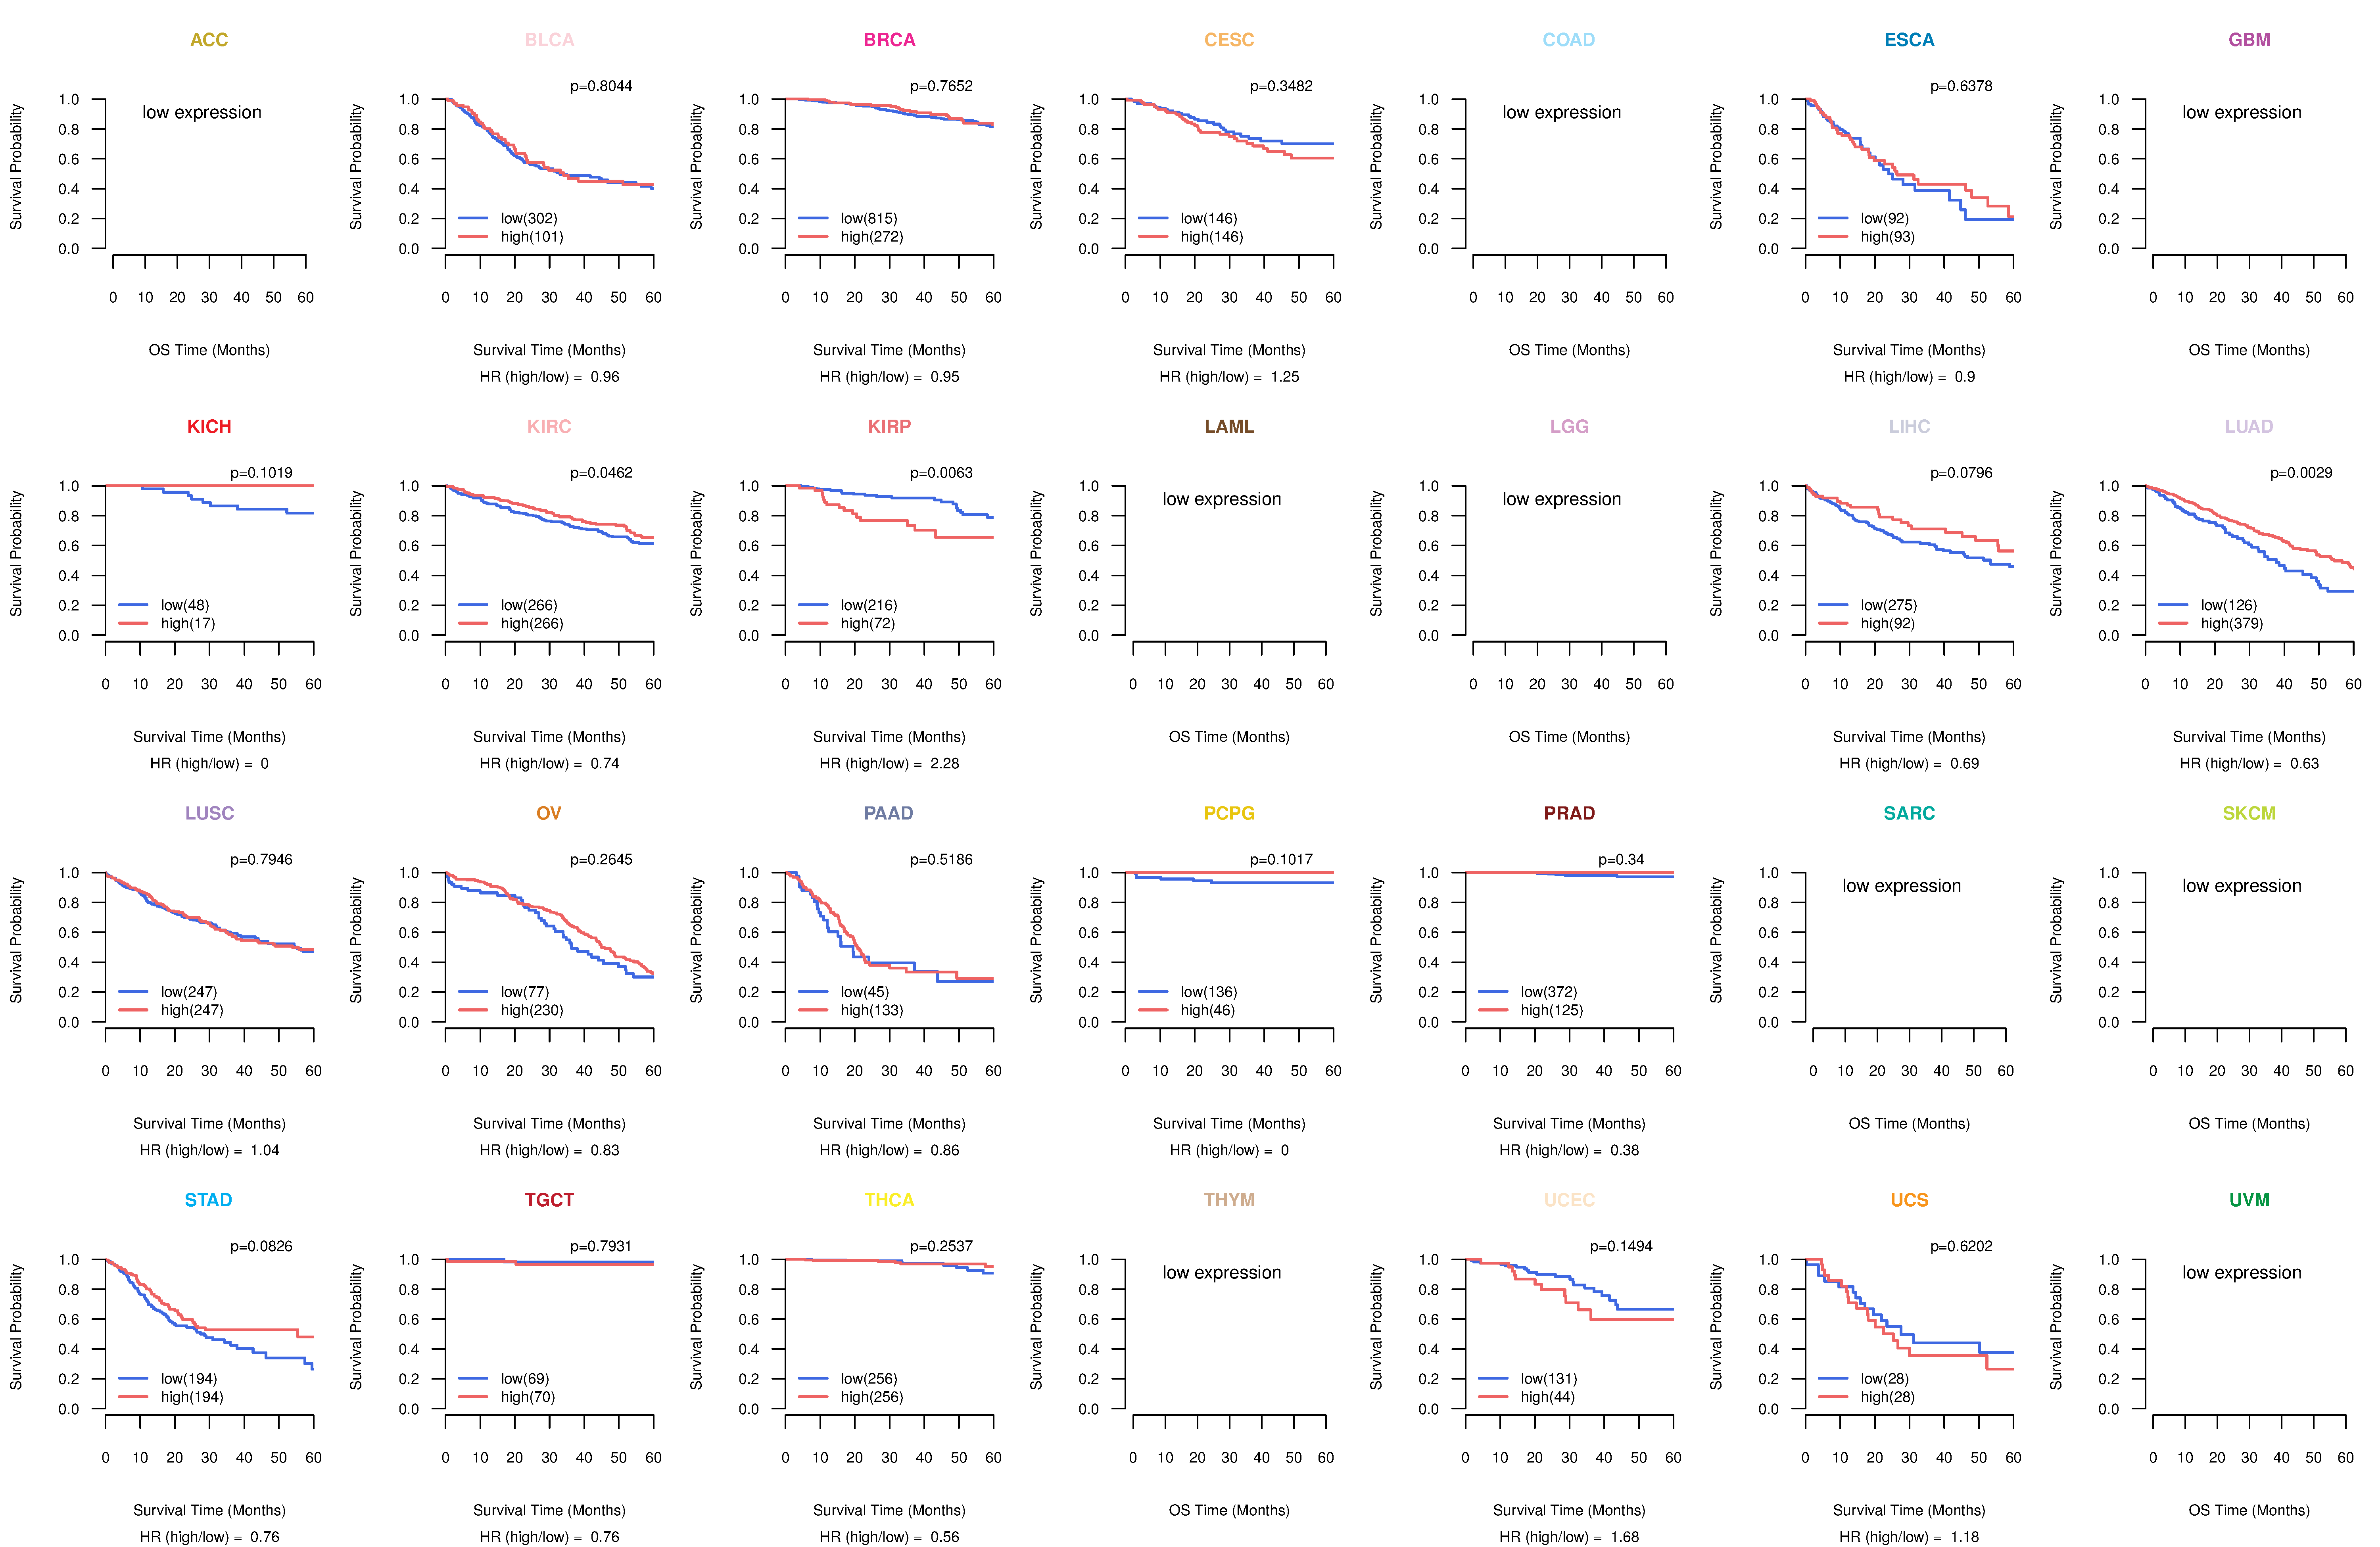
| Kaplan-Meier plots with logrank tests of overall survival (OS) using 28 cancer types (TCGA IlluminaHiSeq_RNASeqV2, pan-cancer normalized log2(norm_counts+1) data, version 2016-08-16) (TCGA clinicalMatrix, phenotype data, version 2016-04-27) * Click on the image to enlarge it in a new window. |
 |
| Kaplan-Meier plots with logrank test of relapse free survival (RFS) using 28 cancer types (TCGA IlluminaHiSeq_RNASeqV2, pan-cancer normalized log2(norm_counts+1) data, version 2016-08-16) (TCGA clinicalMatrix, phenotype data, version 2016-04-27) * Click on the image enlarge it in a new window. |
 |
| Forest plot of Cox proportional hazard ratio (HR) and 95% CI of overall survival (OS) using 28 cancer types (TCGA IlluminaHiSeq_RNASeqV2, pan-cancer normalized log2(norm_counts+1) data, version 2016-08-16) (TCGA clinicalMatrix, phenotype data, version 2016-04-27) * Click on the image enlarge it in a new window. |
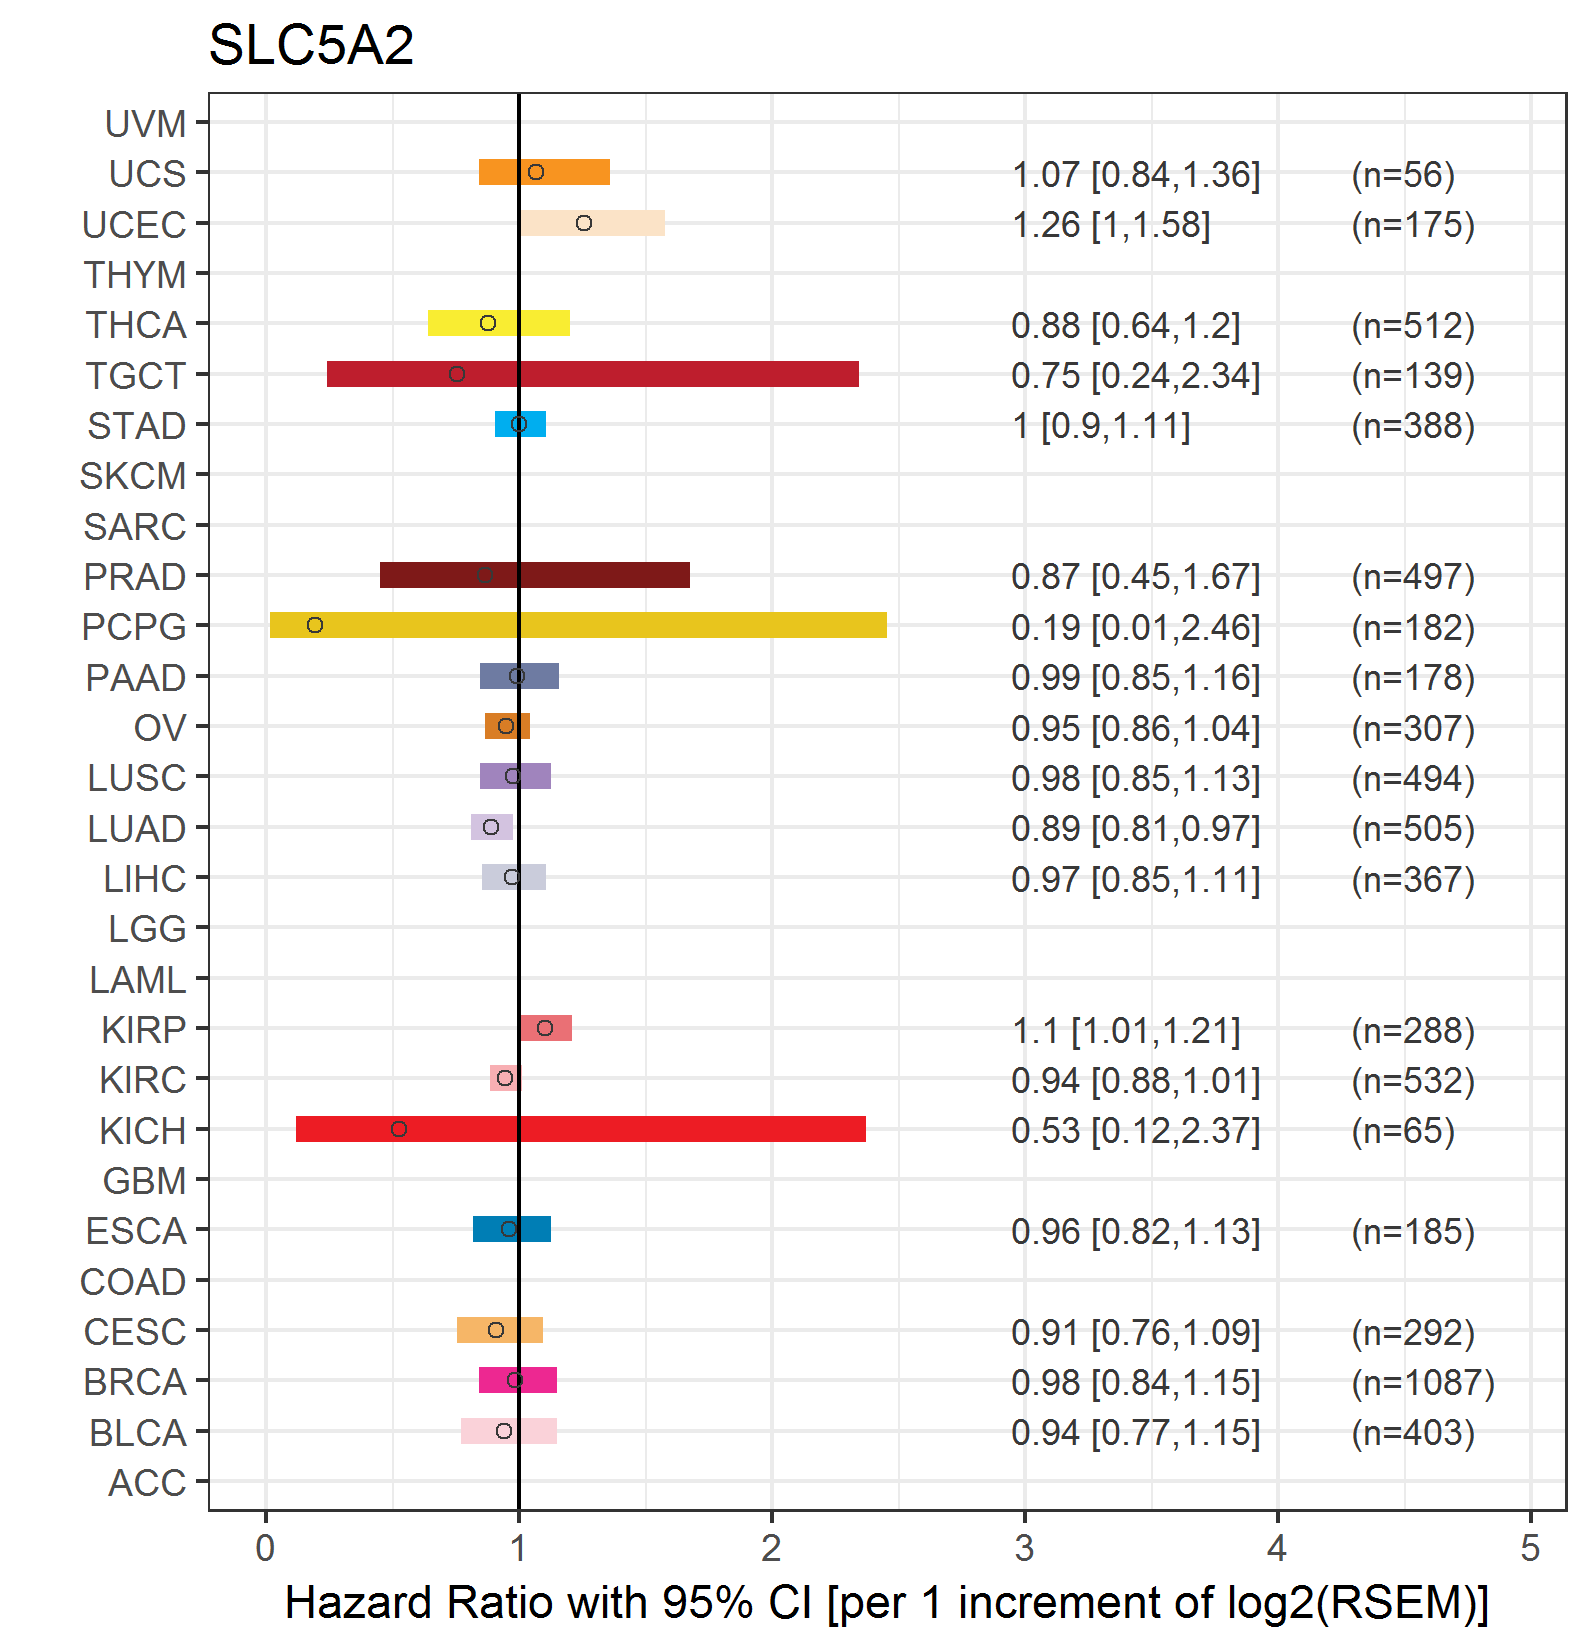 |
| Forest plot of Cox proportional hazard ratio (HR) and 95% CI of relapse free survival (RFS) using 28 cancer types (TCGA IlluminaHiSeq_RNASeqV2, pan-cancer normalized log2(norm_counts+1) data, version 2016-08-16) (TCGA clinicalMatrix, phenotype data, version 2016-04-27) * Click on the image enlarge it in a new window. |
 |
| Top |
| TissGeneClin for SLC5A2 |
| TissGeneDrug for SLC5A2 |
| Drug information targeting TissGene (DrugBank Version 5.0.6, 2017-04-01) |
| DrugBank ID | Drug name | Drug activity | Drug type | Drug status |
| Top |
| TissGeneDisease for SLC5A2 |
| Disease information associated with TissGene (DisGeNet, 2016-06-01) |
| Disease ID | Disease name | # pubmeds | Source |
| umls:C3245525 | Familial renal glucosuria | 9 | BeFree |
| umls:C0011860 | Diabetes Mellitus, Non-Insulin-Dependent | 8 | BeFree |
| umls:C0017980 | Glycosuria, Renal | 7 | BeFree,CLINVAR,CTD_human,ORPHANET,UNIPROT |
| umls:C0011849 | Diabetes Mellitus | 5 | BeFree |
| umls:C0020456 | Hyperglycemia | 4 | BeFree |
| umls:C0011847 | Diabetes | 3 | BeFree |
| umls:C0011881 | Diabetic Nephropathy | 3 | BeFree |
| umls:C0020615 | Hypoglycemia | 2 | BeFree |
| umls:C0020459 | Hyperinsulinism | 1 | BeFree |
| umls:C0020538 | Hypertensive disease | 1 | RGD |
| umls:C0027721 | Lipoid nephrosis | 1 | BeFree |
| umls:C0151747 | Renal tubular disorder | 1 | BeFree |
| umls:C0238621 | Aminoaciduria | 1 | BeFree |
| umls:C0524851 | Neurodegenerative Disorders | 1 | BeFree |
| umls:C1704320 | Glomerulonephritis, Minimal Change | 1 | BeFree |
| umls:C3495427 | Fanconi-Bickel Syndrome | 1 | BeFree |
|
Copyright 2016-Present - The University of Texas Health Science Center at Houston (UTHealth) Web File Viewing | How to Report, Fraud, Waste and Abuse | State of Texas | Statewide Search | Texas Homeland Security | Site Policies |