 |
| |
| |
| |
| |
| |
| |
|

| TissGeneSummary for SLC9A2 |
 Gene summary Gene summary |
| Basic gene information | Gene symbol | SLC9A2 |
| Gene name | solute carrier family 9, subfamily A (NHE2, cation proton antiporter 2), member 2 | |
| Synonyms | NHE2 | |
| Cytomap | UCSC genome browser: 2q11.2 | |
| Type of gene | protein-coding | |
| RefGenes | NM_003048.3, | |
| Description | NHE-2Na(+)/H(+) exchanger 2sodium/hydrogen exchanger 2solute carrier family 9 (sodium/hydrogen exchanger)solute carrier family 9 (sodium/hydrogen exchanger), member 2solute carrier family 9 member 2 | |
| Modification date | 20141207 | |
| dbXrefs | MIM : 600530 | |
| HGNC : HGNC | ||
| Ensembl : ENSG00000115616 | ||
| HPRD : 02756 | ||
| Vega : OTTHUMG00000130778 | ||
| Protein | UniProt: go to UniProt's Cross Reference DB Table | |
| Expression | CleanEX: HS_SLC9A2 | |
| BioGPS: 6549 | ||
| Pathway | NCI Pathway Interaction Database: SLC9A2 | |
| KEGG: SLC9A2 | ||
| REACTOME: SLC9A2 | ||
| Pathway Commons: SLC9A2 | ||
| Context | iHOP: SLC9A2 | |
| ligand binding site mutation search in PubMed: SLC9A2 | ||
| UCL Cancer Institute: SLC9A2 | ||
| Assigned class in TissGDB* | C | |
| Included tissue-specific gene expression resources | TiGER,GTEx | |
| Specific-tissues in normal samples (assigned by TissGDB using HPA, TiGER, and GTEx) | ColonStomach | |
| Cancer types related to the specific-tissues in cancer samples (assigned by TissGDB using TCGA) | COADSTAD | |
| Reference showing the relevant tissue of SLC9A2 | ||
| Description by TissGene annotations | ||
| * Class A consists of genes with literature evidence and is part of the cTissGenes. Class B consists of only cTissGenes without additional evidence. The remaining genes belong to Class C. |
| Gene ontology having evidence of Inferred from Direct Assay (IDA) from Entrez |
| GO ID | GO term | PubMed ID |
| Top |
| TissGeneExp for SLC9A2 |
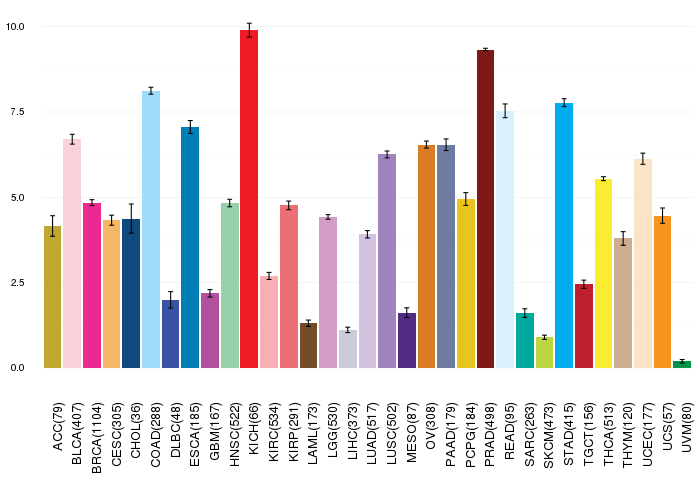
| Gene expressions across 28 cancer types (X-axis: cancer type and Y-axis: log2(norm_counts+1)) (TCGA IlluminaHiSeq_RNASeqV2, pan-cancer normalized log2(norm_counts+1) data, version 2016-08-16) |
 |
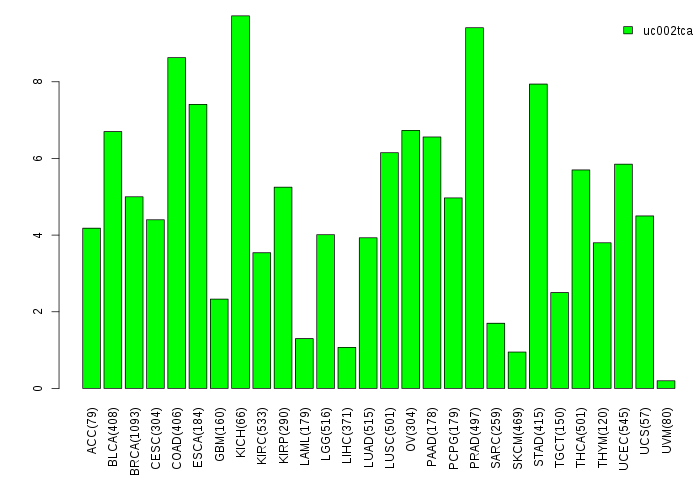
| Gene isoform expressions across 28 cancer types (X-axis: cancer type and Y-axis: log2(norm_counts+1)) (TCGA pan-cancer tcga_rsem_isoform_tpm, version 2016-09-01) |
 |
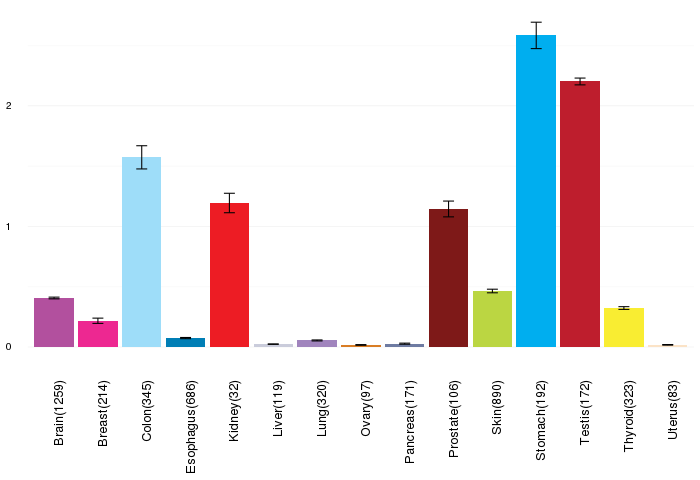
| Gene expressions across normal tissues of GTEx data (GTEx GTEx_Analysis_v6_RNA-seq_RNA-SeQCv1.1.8_gene_rpkm.gct) - Here, we shows the matched tissue types only among our 28 cancer types. |
 |
| Different expressions across 14 cancer types with more than 10 samples between matched tumors and normals (X-axis: cancer type and Y-axis: log2(norm_counts+1)) (TCGA IlluminaHiSeq_RNASeqV2, pan-cancer normalized log2(norm_counts+1) data, version 2016-08-16) |
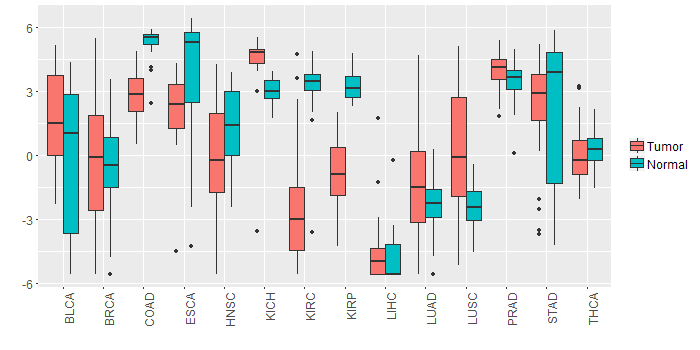 |
| - Significantly differentially expressed cancer types and information. (|Fold change|>1 and FDR<0.05) |
| Cancer type | Mean(exp) in tumor | Mean(exp) in matched normal | Log2FC | P-val. | FDR |
| COAD | 2.834195377 | 5.26169153 | -2.427496154 | 3.01E-11 | 4.92E-10 |
| KIRC | -2.690837957 | 3.302798154 | -5.993636111 | 1.52E-36 | 4.60E-35 |
| LUSC | 0.12037871 | -2.373850702 | 2.494229412 | 1.68E-07 | 4.59E-07 |
| KIRP | -0.872479623 | 3.231139127 | -4.10361875 | 1.16E-15 | 3.56E-14 |
| LUAD | -1.333483934 | -2.337878761 | 1.004394828 | 0.006 | 0.011252508 |
| HNSC | -0.126536019 | 1.34978026 | -1.476316279 | 0.00304 | 0.008837209 |
| KICH | 4.346417377 | 2.991781377 | 1.354636 | 0.000963 | 0.002093148 |
| Top |
| TissGene-miRNA for SLC9A2 |
| Significantly anti-correlated miRNAs of TissGene across 28 cancer types (Gene-miRNA relations from TargetScanHuman Relsease 7.1, Conserved_Site_Context_Scores.txt.zip, 06.01.2016) (TCGA IlluminaHiSeq_miRNASeq, log2(RPM+1) data, version 2016-11-21) (TCGA IlluminaHiSeq_RNASeqV2, log2(normalized_count+1) data, version 2016-08-16) (Spearman’s Rank Correlation (p-value<0.05 and coefficient<-0.25)) |
| Cancer type | miRNA id | miRNA accession | P-val. | Coeff. | # samples |
| Top |
| TissGeneMut for SLC9A2 |
| TissGeneSNV for SLC9A2 |
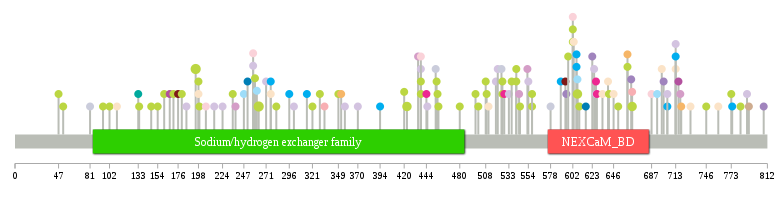
| nsSNV counts per each loci. Different colors of circles represent different cancer types. Circle size denotes number of samples. (TCGA somatic mutation (SNPs and small INDELs) data, version 2016-04-25) * Click on the image to enlarge it in a new window. |
 |
 |
| Somatic nucleotide variants of TissGene across 28 cancer types (X-axis: cancer type and Y-axis: % of mutated samples) The numbers in parentheses are numbers of samples with mutation (nsSNVs). (TCGA somatic mutation (SNPs and small INDELs) data, version 2016-04-25) |
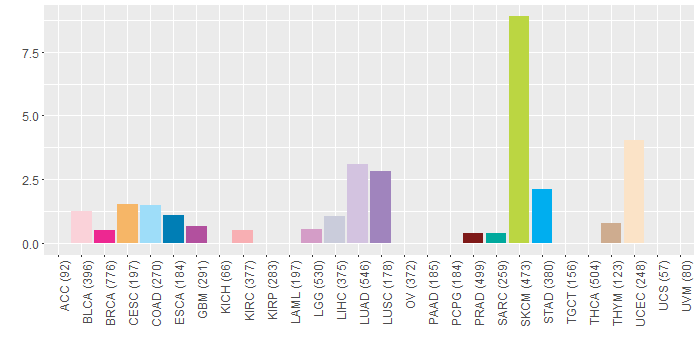 |
| - nsSNVs sorted by frequency. |
| AAchange | Cancer type | # samples |
| p.E195K | SKCM | 3 |
| p.M263I | SKCM | 3 |
| p.R666Q | SKCM | 2 |
| p.P423S | SKCM | 2 |
| p.R607K | SKCM | 2 |
| p.E646G | UCEC | 1 |
| p.T628R | BRCA | 1 |
| p.R607I | COAD | 1 |
| p.F525C | LIHC | 1 |
| p.S661F | CESC | 1 |
| p.K558* | SKCM | 1 |
| p.K536N | SKCM | 1 |
| p.Q206* | BLCA | 1 |
| p.M334I | KIRC | 1 |
| p.G185V | LUAD | 1 |
| p.V394I | STAD | 1 |
| p.S47F | SKCM | 1 |
| p.S352F | CESC | 1 |
| p.F257L | BLCA | 1 |
| p.P147L | SKCM | 1 |
| p.R301L | LUAD | 1 |
| p.R480Q | SKCM | 1 |
| p.S215* | LUAD | 1 |
| p.G176W | PRAD | 1 |
| p.P81T | LIHC | 1 |
| p.P790Q | LUAD | 1 |
| p.L199F | SKCM | 1 |
| p.W526X | SKCM | 1 |
| p.F719L | CESC | 1 |
| p.S606X | STAD | 1 |
| p.E783K | SKCM | 1 |
| p.S618F | HNSC | 1 |
| p.K634N | UCEC | 1 |
| p.P716Q | GBM | 1 |
| p.R438X | SKCM | 1 |
| p.R640Q | UCEC | 1 |
| p.S259L | SKCM | 1 |
| p.Y356D | LUAD | 1 |
| p.R602G | BLCA | 1 |
| p.S370G | LUAD | 1 |
| p.A296V | STAD | 1 |
| p.D627G | BRCA | 1 |
| p.V553A | LGG | 1 |
| p.K589N | STAD | 1 |
| p.S665F | LUSC | 1 |
| p.Q718E | LGG | 1 |
| p.L541F | SKCM | 1 |
| p.R792W | THYM | 1 |
| p.V704M | STAD | 1 |
| p.E371K | READ | 1 |
| p.K95N | SKCM | 1 |
| p.A700D | LUSC | 1 |
| p.G808V | LUSC | 1 |
| p.S606* | STAD | 1 |
| p.A698T | UCEC | 1 |
| p.H329Y | SKCM | 1 |
| p.R456Q | SKCM | 1 |
| p.V140A | HNSC | 1 |
| p.G167A | GBM | 1 |
| p.R438L | LUAD | 1 |
| p.G154C | SKCM | 1 |
| p.D528G | BRCA | 1 |
| p.E597K | SKCM | 1 |
| p.H102Y | SKCM | 1 |
| p.E545K | SKCM | 1 |
| p.N180K | SKCM | 1 |
| p.T759M | UCEC | 1 |
| p.E110D | UCEC | 1 |
| p.V271L | LUAD | 1 |
| p.K558X | SKCM | 1 |
| p.R713H | UCEC | 1 |
| p.G198S | UCEC | 1 |
| p.S321F | SKCM | 1 |
| p.L235F | SKCM | 1 |
| p.A444V | BRCA | 1 |
| p.P52S | SKCM | 1 |
| p.R602* | SKCM | 1 |
| p.L238M | LGG | 1 |
| p.E630D | HNSC | 1 |
| p.R666Q | KIRC | 1 |
| p.S693N | COAD | 1 |
| p.W171* | SKCM | 1 |
| p.Q206H | READ | 1 |
| p.A497V | SKCM | 1 |
| p.L541P | SKCM | 1 |
| p.F257L | LUAD | 1 |
| p.W521C | LUAD | 1 |
| p.V251L | ESCA | 1 |
| p.G519V | LUAD | 1 |
| p.P133L | SARC | 1 |
| p.S687C | BLCA | 1 |
| p.T594K | PRAD | 1 |
| p.S623C | LUSC | 1 |
| p.W526* | SKCM | 1 |
| p.E500K | SKCM | 1 |
| p.R438* | SKCM | 1 |
| p.C261F | COAD | 1 |
| p.D627Y | LUAD | 1 |
| p.T625I | LUAD | 1 |
| p.E349K | SKCM | 1 |
| p.P455S | SKCM | 1 |
| p.R420Q | SKCM | 1 |
| p.S661F | SKCM | 1 |
| p.D508N | SKCM | 1 |
| p.K511N | UCEC | 1 |
| p.F533L | LUAD | 1 |
| p.G282E | SKCM | 1 |
| p.L609F | SKCM | 1 |
| p.D651N | SKCM | 1 |
| p.R713C | STAD | 1 |
| p.T578I | LIHC | 1 |
| p.R602X | SKCM | 1 |
| p.A276T | STAD | 1 |
| p.G435E | LGG | 1 |
| p.T746S | SKCM | 1 |
| p.T616S | ESCA | 1 |
| p.E603* | UCEC | 1 |
| p.R544Q | LGG | 1 |
| p.S773F | SKCM | 1 |
| p.P161S | SKCM | 1 |
| p.S595C | LUSC | 1 |
| p.D247Y | COAD | 1 |
| p.P134S | SKCM | 1 |
| p.A276T | UCEC | 1 |
| p.K457* | SKCM | 1 |
| p.H509Y | SKCM | 1 |
| p.S554C | LUAD | 1 |
| p.A224S | LUAD | 1 |
| p.F454L | LIHC | 1 |
| p.R641Q | SKCM | 1 |
| p.L445S | LUAD | 1 |
| p.G774D | STAD | 1 |
| p.F315V | STAD | 1 |
| p.V704L | LUAD | 1 |
| p.R713S | LUAD | 1 |
| p.R438* | BLCA | 1 |
| p.G198C | SKCM | 1 |
| p.M729I | UCEC | 1 |
| p.G701R | HNSC | 1 |
| Top |
| TissGeneCNV for SLC9A2 |
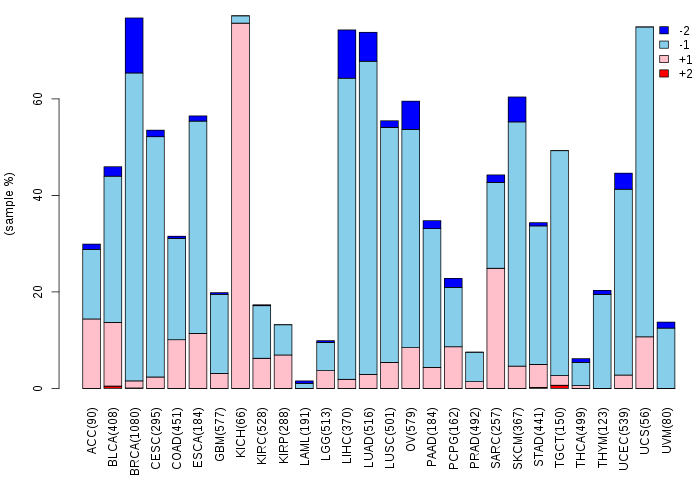
| Copy number variations of TissGene across 28 cancer types (X-axis: cancer type and Y-axis: % of CNV samples) (TCGA Gistic2_CopyNumber_Gistic2_all_data_by_genes, Gistic2 copy number data, version 2016-08-16) |
 |
| Top |
| TissGeneFusions for SLC9A2 |
| Fusion genes including TissGene (ChimerDB 3.0, 2016-12-01 and TCGA fusion Portal 2015-12-01) |
| Database | Src | Cancer type | Sample | Fusion gene | ORF | 5'-gene BP | 3'-gene BP |
| Top |
| TissGeneNet for SLC9A2 |
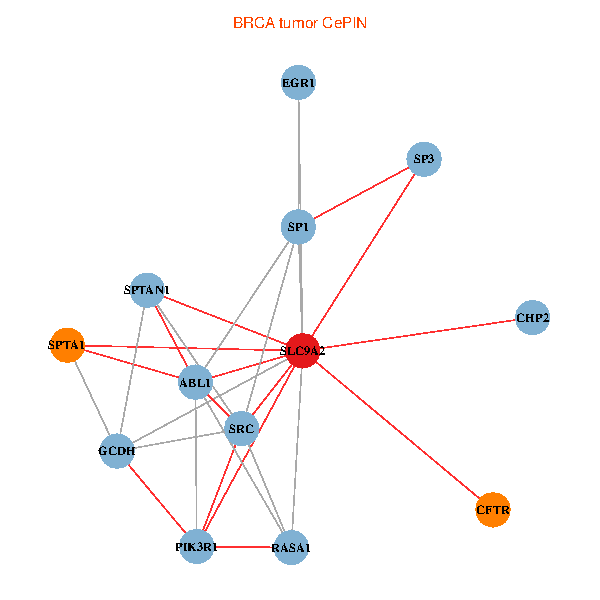
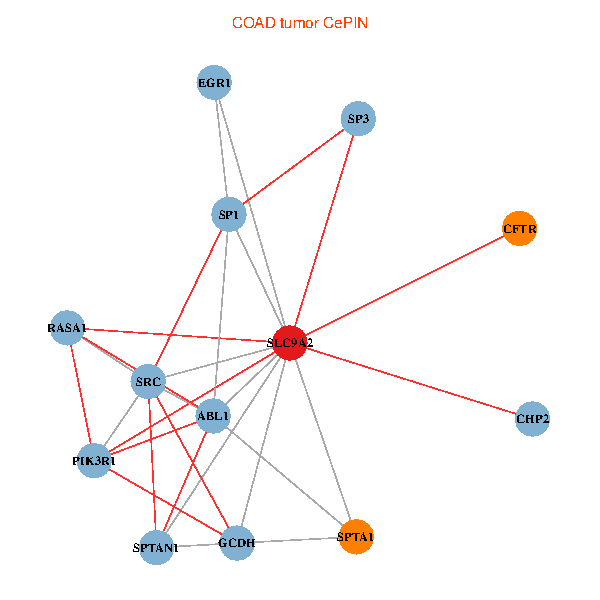
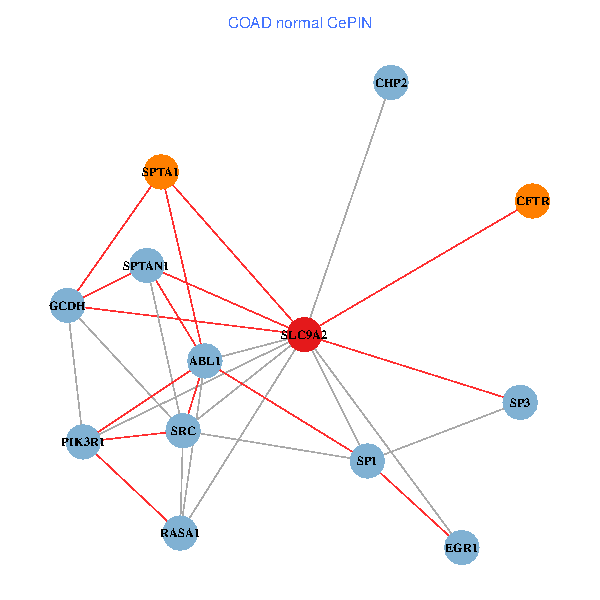
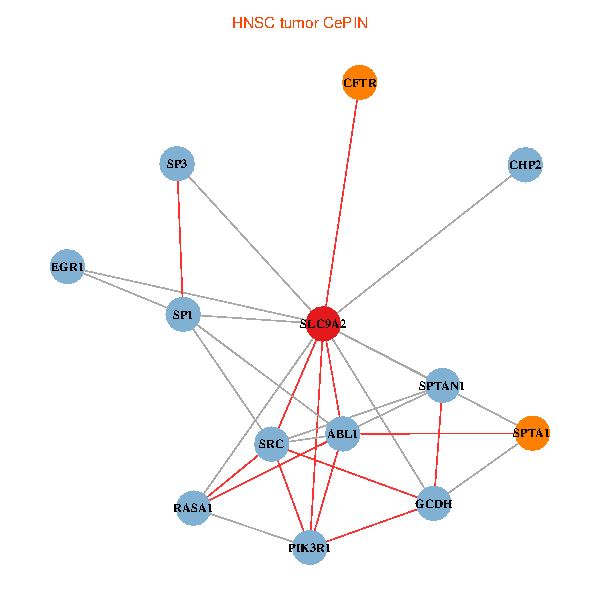
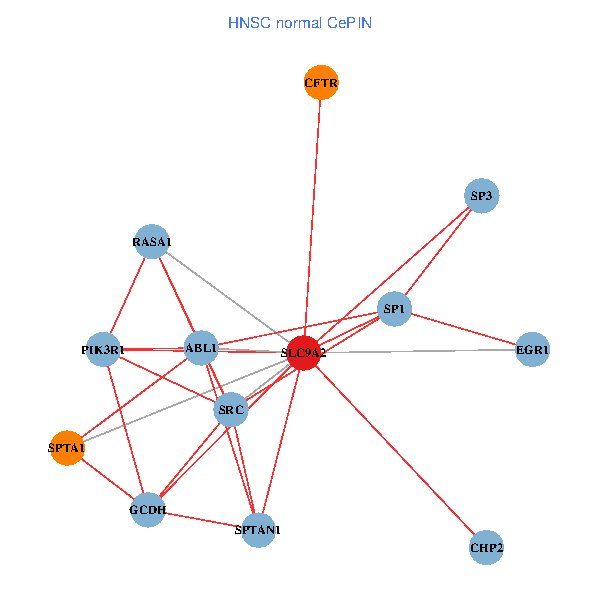
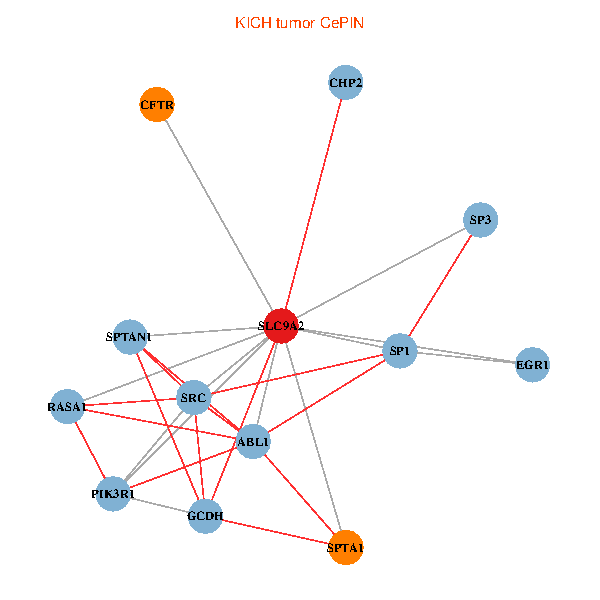
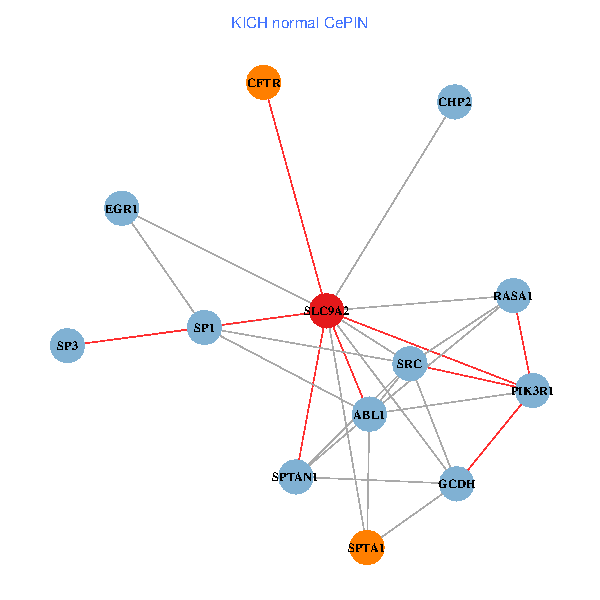
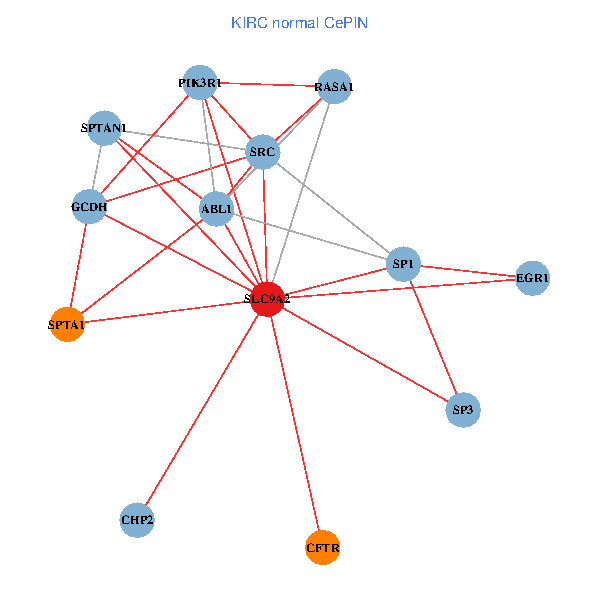
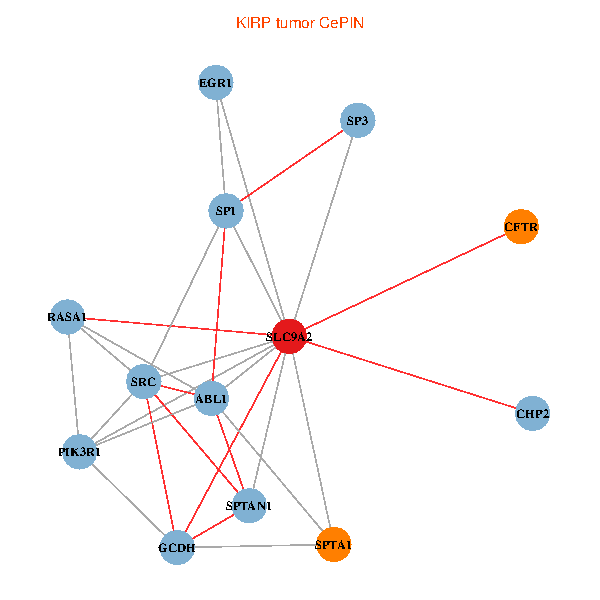
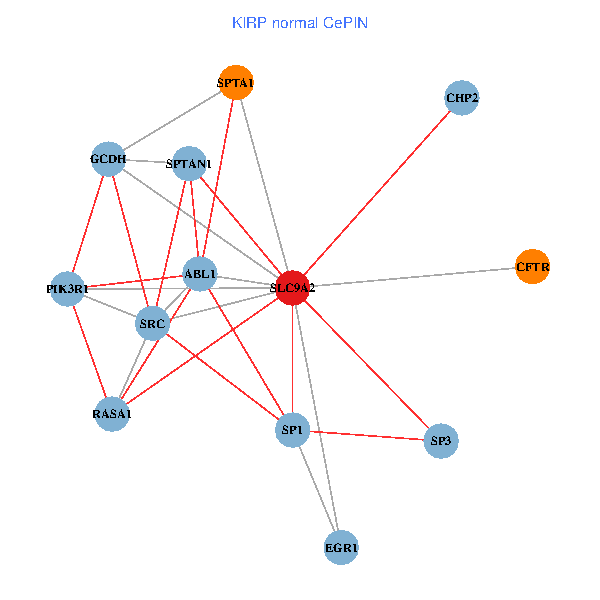
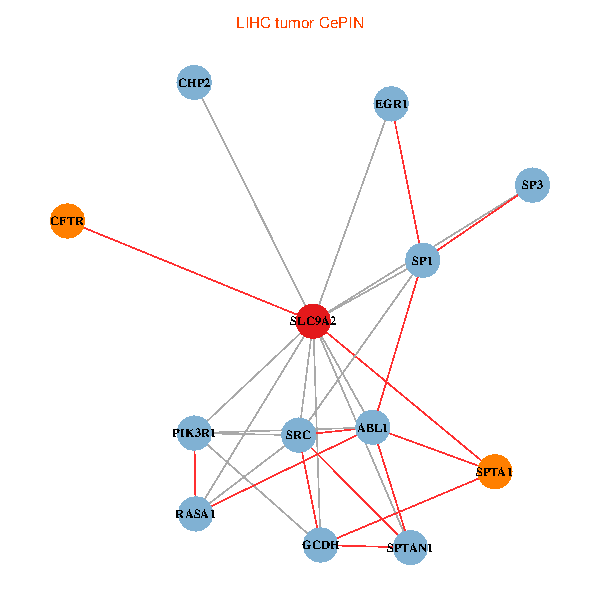
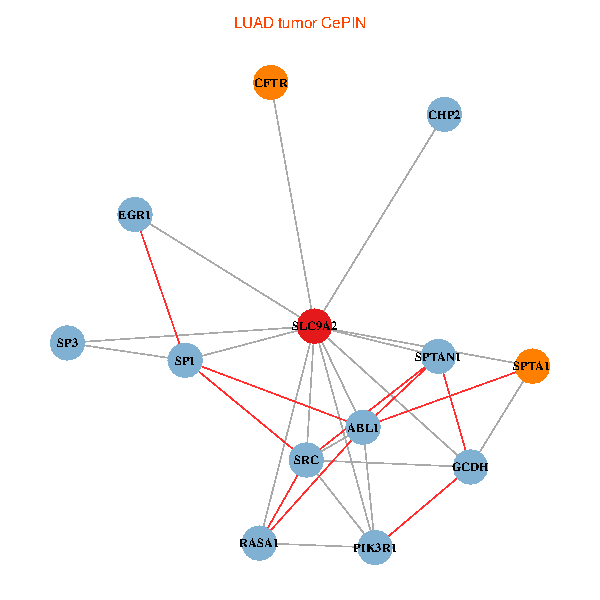
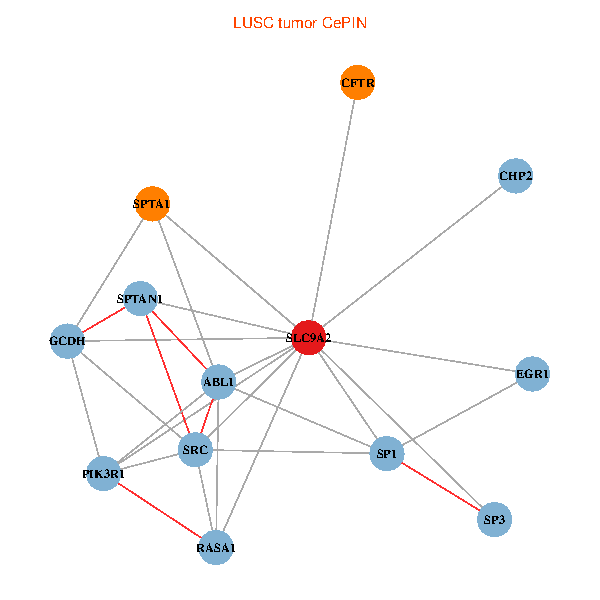
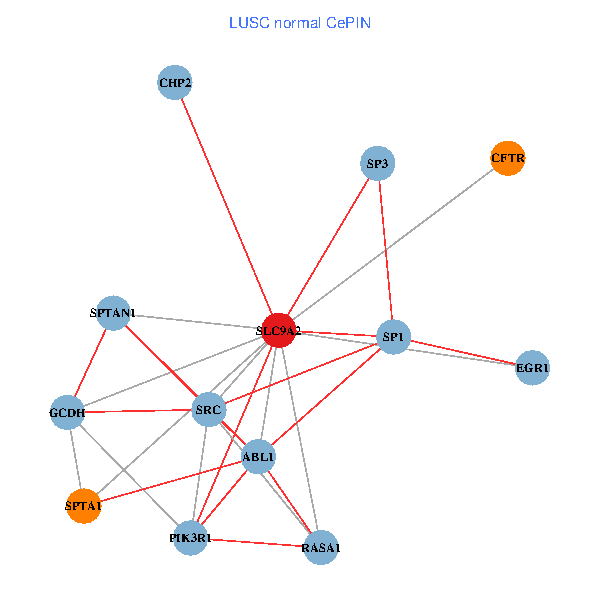
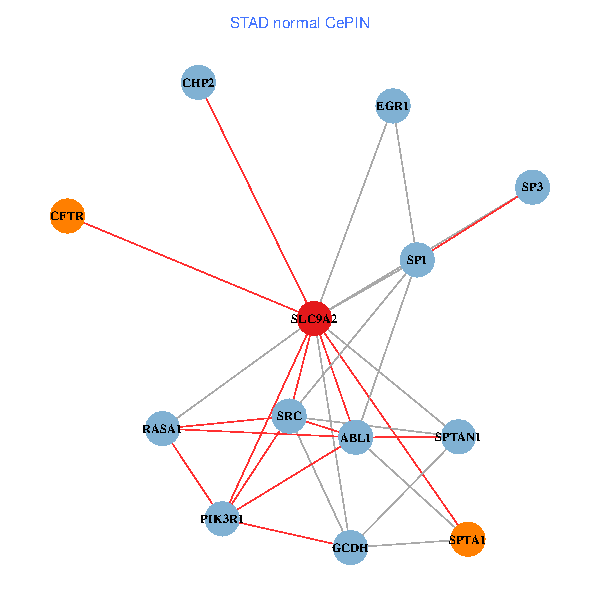
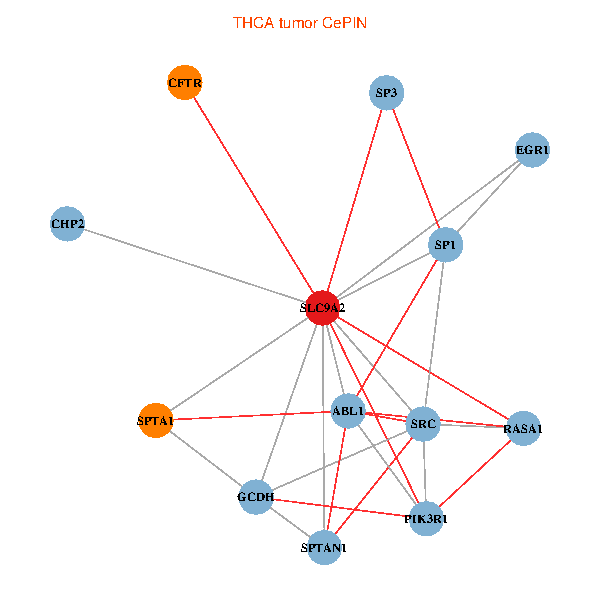
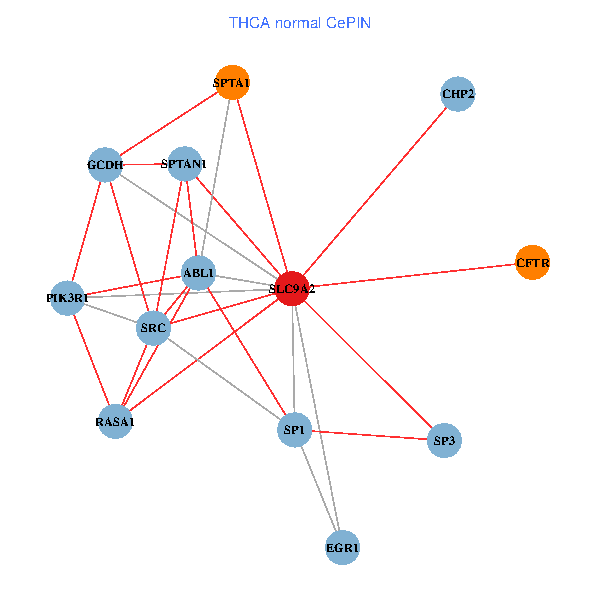
| Co-expressed gene networks based on protein-protein interaction data (CePIN) (TCGA IlluminaHiSeq_RNASeqV2, pan-cancer normalized log2(norm_counts+1) data, version 2016-08-16) (PINA2 ppi data) |
| BRCA (tumor) | BRCA (normal) |
| SLC9A2, CFTR, SP1, SRC, EGR1, PIK3R1, ABL1, SPTAN1, SPTA1, SP3, RASA1, GCDH, CHP2 (tumor) | SLC9A2, CFTR, SP1, SRC, EGR1, PIK3R1, ABL1, SPTAN1, SPTA1, SP3, RASA1, GCDH, CHP2 (normal) |
 |  |
| COAD (tumor) | COAD (normal) |
| SLC9A2, CFTR, SP1, SRC, EGR1, PIK3R1, ABL1, SPTAN1, SPTA1, SP3, RASA1, GCDH, CHP2 (tumor) | SLC9A2, CFTR, SP1, SRC, EGR1, PIK3R1, ABL1, SPTAN1, SPTA1, SP3, RASA1, GCDH, CHP2 (normal) |
 |  |
| HNSC (tumor) | HNSC (normal) |
| SLC9A2, CFTR, SP1, SRC, EGR1, PIK3R1, ABL1, SPTAN1, SPTA1, SP3, RASA1, GCDH, CHP2 (tumor) | SLC9A2, CFTR, SP1, SRC, EGR1, PIK3R1, ABL1, SPTAN1, SPTA1, SP3, RASA1, GCDH, CHP2 (normal) |
 |  |
| KICH (tumor) | KICH (normal) |
| SLC9A2, CFTR, SP1, SRC, EGR1, PIK3R1, ABL1, SPTAN1, SPTA1, SP3, RASA1, GCDH, CHP2 (tumor) | SLC9A2, CFTR, SP1, SRC, EGR1, PIK3R1, ABL1, SPTAN1, SPTA1, SP3, RASA1, GCDH, CHP2 (normal) |
 |  |
| KIRC (tumor) | KIRC (normal) |
| SLC9A2, CFTR, SP1, SRC, EGR1, PIK3R1, ABL1, SPTAN1, SPTA1, SP3, RASA1, GCDH, CHP2 (tumor) | SLC9A2, CFTR, SP1, SRC, EGR1, PIK3R1, ABL1, SPTAN1, SPTA1, SP3, RASA1, GCDH, CHP2 (normal) |
 |  |
| KIRP (tumor) | KIRP (normal) |
| SLC9A2, CFTR, SP1, SRC, EGR1, PIK3R1, ABL1, SPTAN1, SPTA1, SP3, RASA1, GCDH, CHP2 (tumor) | SLC9A2, CFTR, SP1, SRC, EGR1, PIK3R1, ABL1, SPTAN1, SPTA1, SP3, RASA1, GCDH, CHP2 (normal) |
 |  |
| LIHC (tumor) | LIHC (normal) |
| SLC9A2, CFTR, SP1, SRC, EGR1, PIK3R1, ABL1, SPTAN1, SPTA1, SP3, RASA1, GCDH, CHP2 (tumor) | SLC9A2, CFTR, SP1, SRC, EGR1, PIK3R1, ABL1, SPTAN1, SPTA1, SP3, RASA1, GCDH, CHP2 (normal) |
 |  |
| LUAD (tumor) | LUAD (normal) |
| SLC9A2, CFTR, SP1, SRC, EGR1, PIK3R1, ABL1, SPTAN1, SPTA1, SP3, RASA1, GCDH, CHP2 (tumor) | SLC9A2, CFTR, SP1, SRC, EGR1, PIK3R1, ABL1, SPTAN1, SPTA1, SP3, RASA1, GCDH, CHP2 (normal) |
 |  |
| LUSC (tumor) | LUSC (normal) |
| SLC9A2, CFTR, SP1, SRC, EGR1, PIK3R1, ABL1, SPTAN1, SPTA1, SP3, RASA1, GCDH, CHP2 (tumor) | SLC9A2, CFTR, SP1, SRC, EGR1, PIK3R1, ABL1, SPTAN1, SPTA1, SP3, RASA1, GCDH, CHP2 (normal) |
 |  |
| PRAD (tumor) | PRAD (normal) |
| SLC9A2, CFTR, SP1, SRC, EGR1, PIK3R1, ABL1, SPTAN1, SPTA1, SP3, RASA1, GCDH, CHP2 (tumor) | SLC9A2, CFTR, SP1, SRC, EGR1, PIK3R1, ABL1, SPTAN1, SPTA1, SP3, RASA1, GCDH, CHP2 (normal) |
 |  |
| STAD (tumor) | STAD (normal) |
| SLC9A2, CFTR, SP1, SRC, EGR1, PIK3R1, ABL1, SPTAN1, SPTA1, SP3, RASA1, GCDH, CHP2 (tumor) | SLC9A2, CFTR, SP1, SRC, EGR1, PIK3R1, ABL1, SPTAN1, SPTA1, SP3, RASA1, GCDH, CHP2 (normal) |
 |  |
| THCA (tumor) | THCA (normal) |
| SLC9A2, CFTR, SP1, SRC, EGR1, PIK3R1, ABL1, SPTAN1, SPTA1, SP3, RASA1, GCDH, CHP2 (tumor) | SLC9A2, CFTR, SP1, SRC, EGR1, PIK3R1, ABL1, SPTAN1, SPTA1, SP3, RASA1, GCDH, CHP2 (normal) |
 |  |
| Top |
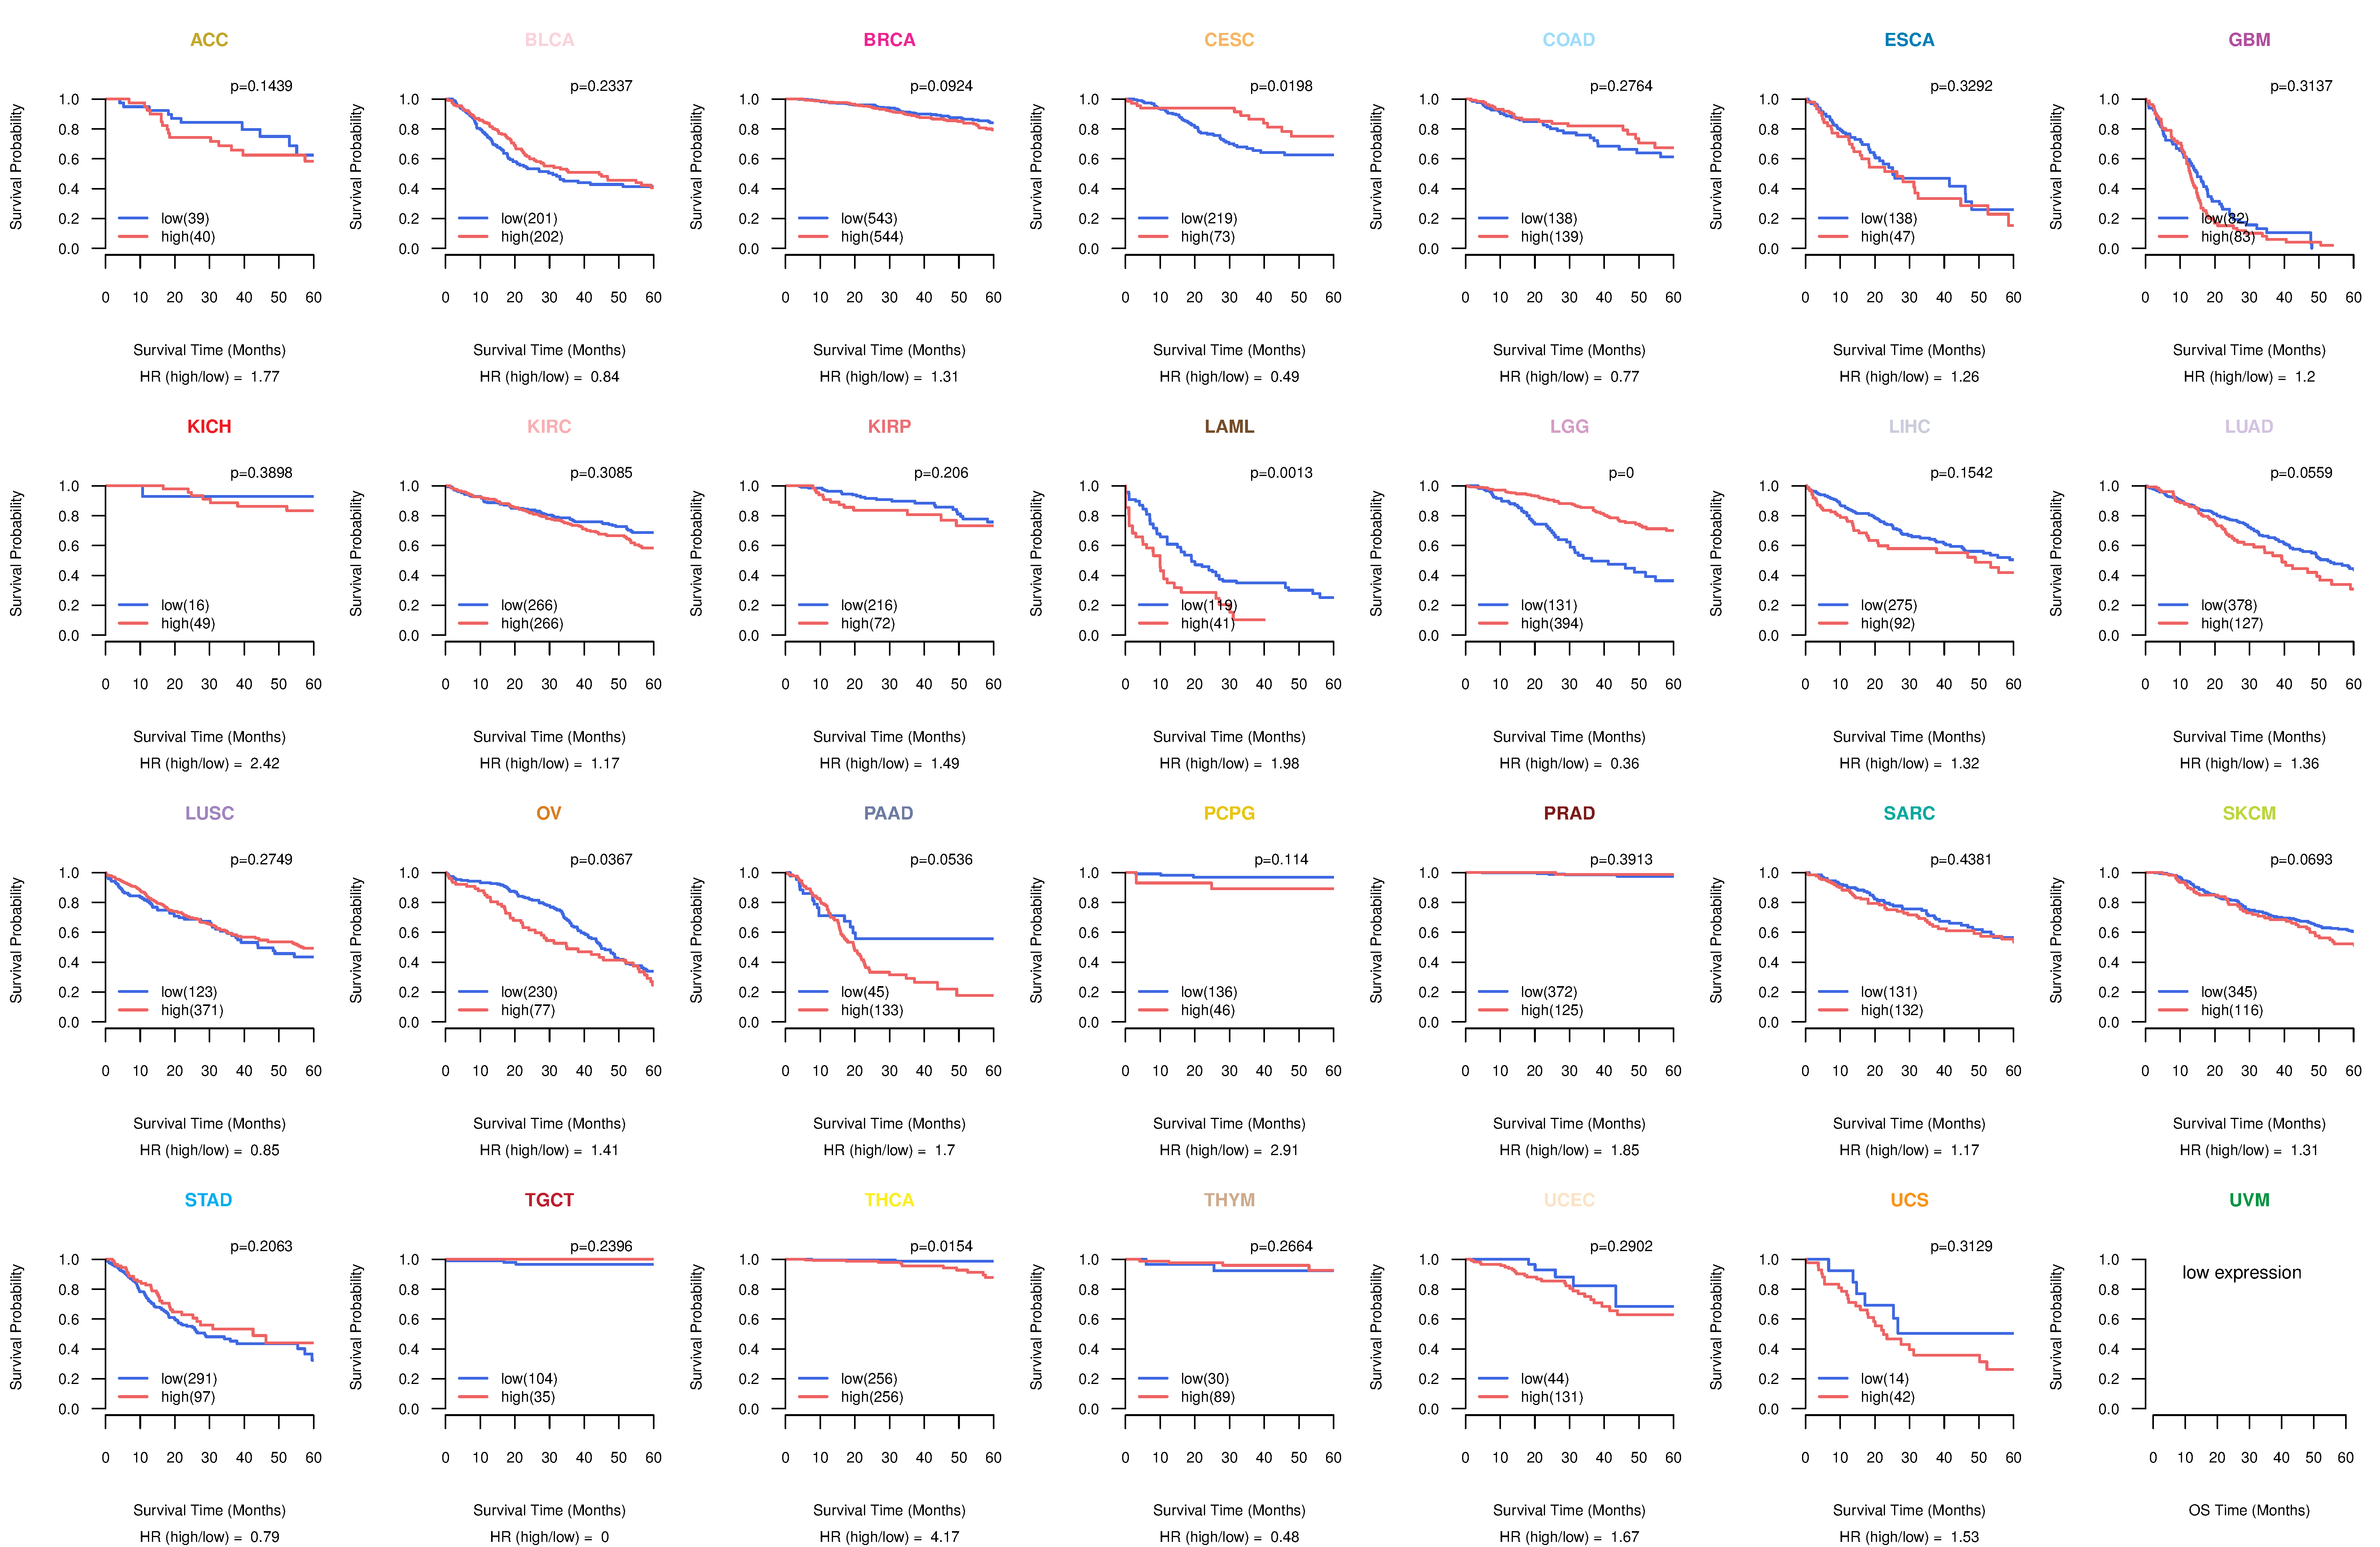
| TissGeneProg for SLC9A2 |
| Kaplan-Meier plots with logrank tests of overall survival (OS) using 28 cancer types (TCGA IlluminaHiSeq_RNASeqV2, pan-cancer normalized log2(norm_counts+1) data, version 2016-08-16) (TCGA clinicalMatrix, phenotype data, version 2016-04-27) * Click on the image to enlarge it in a new window. |
 |
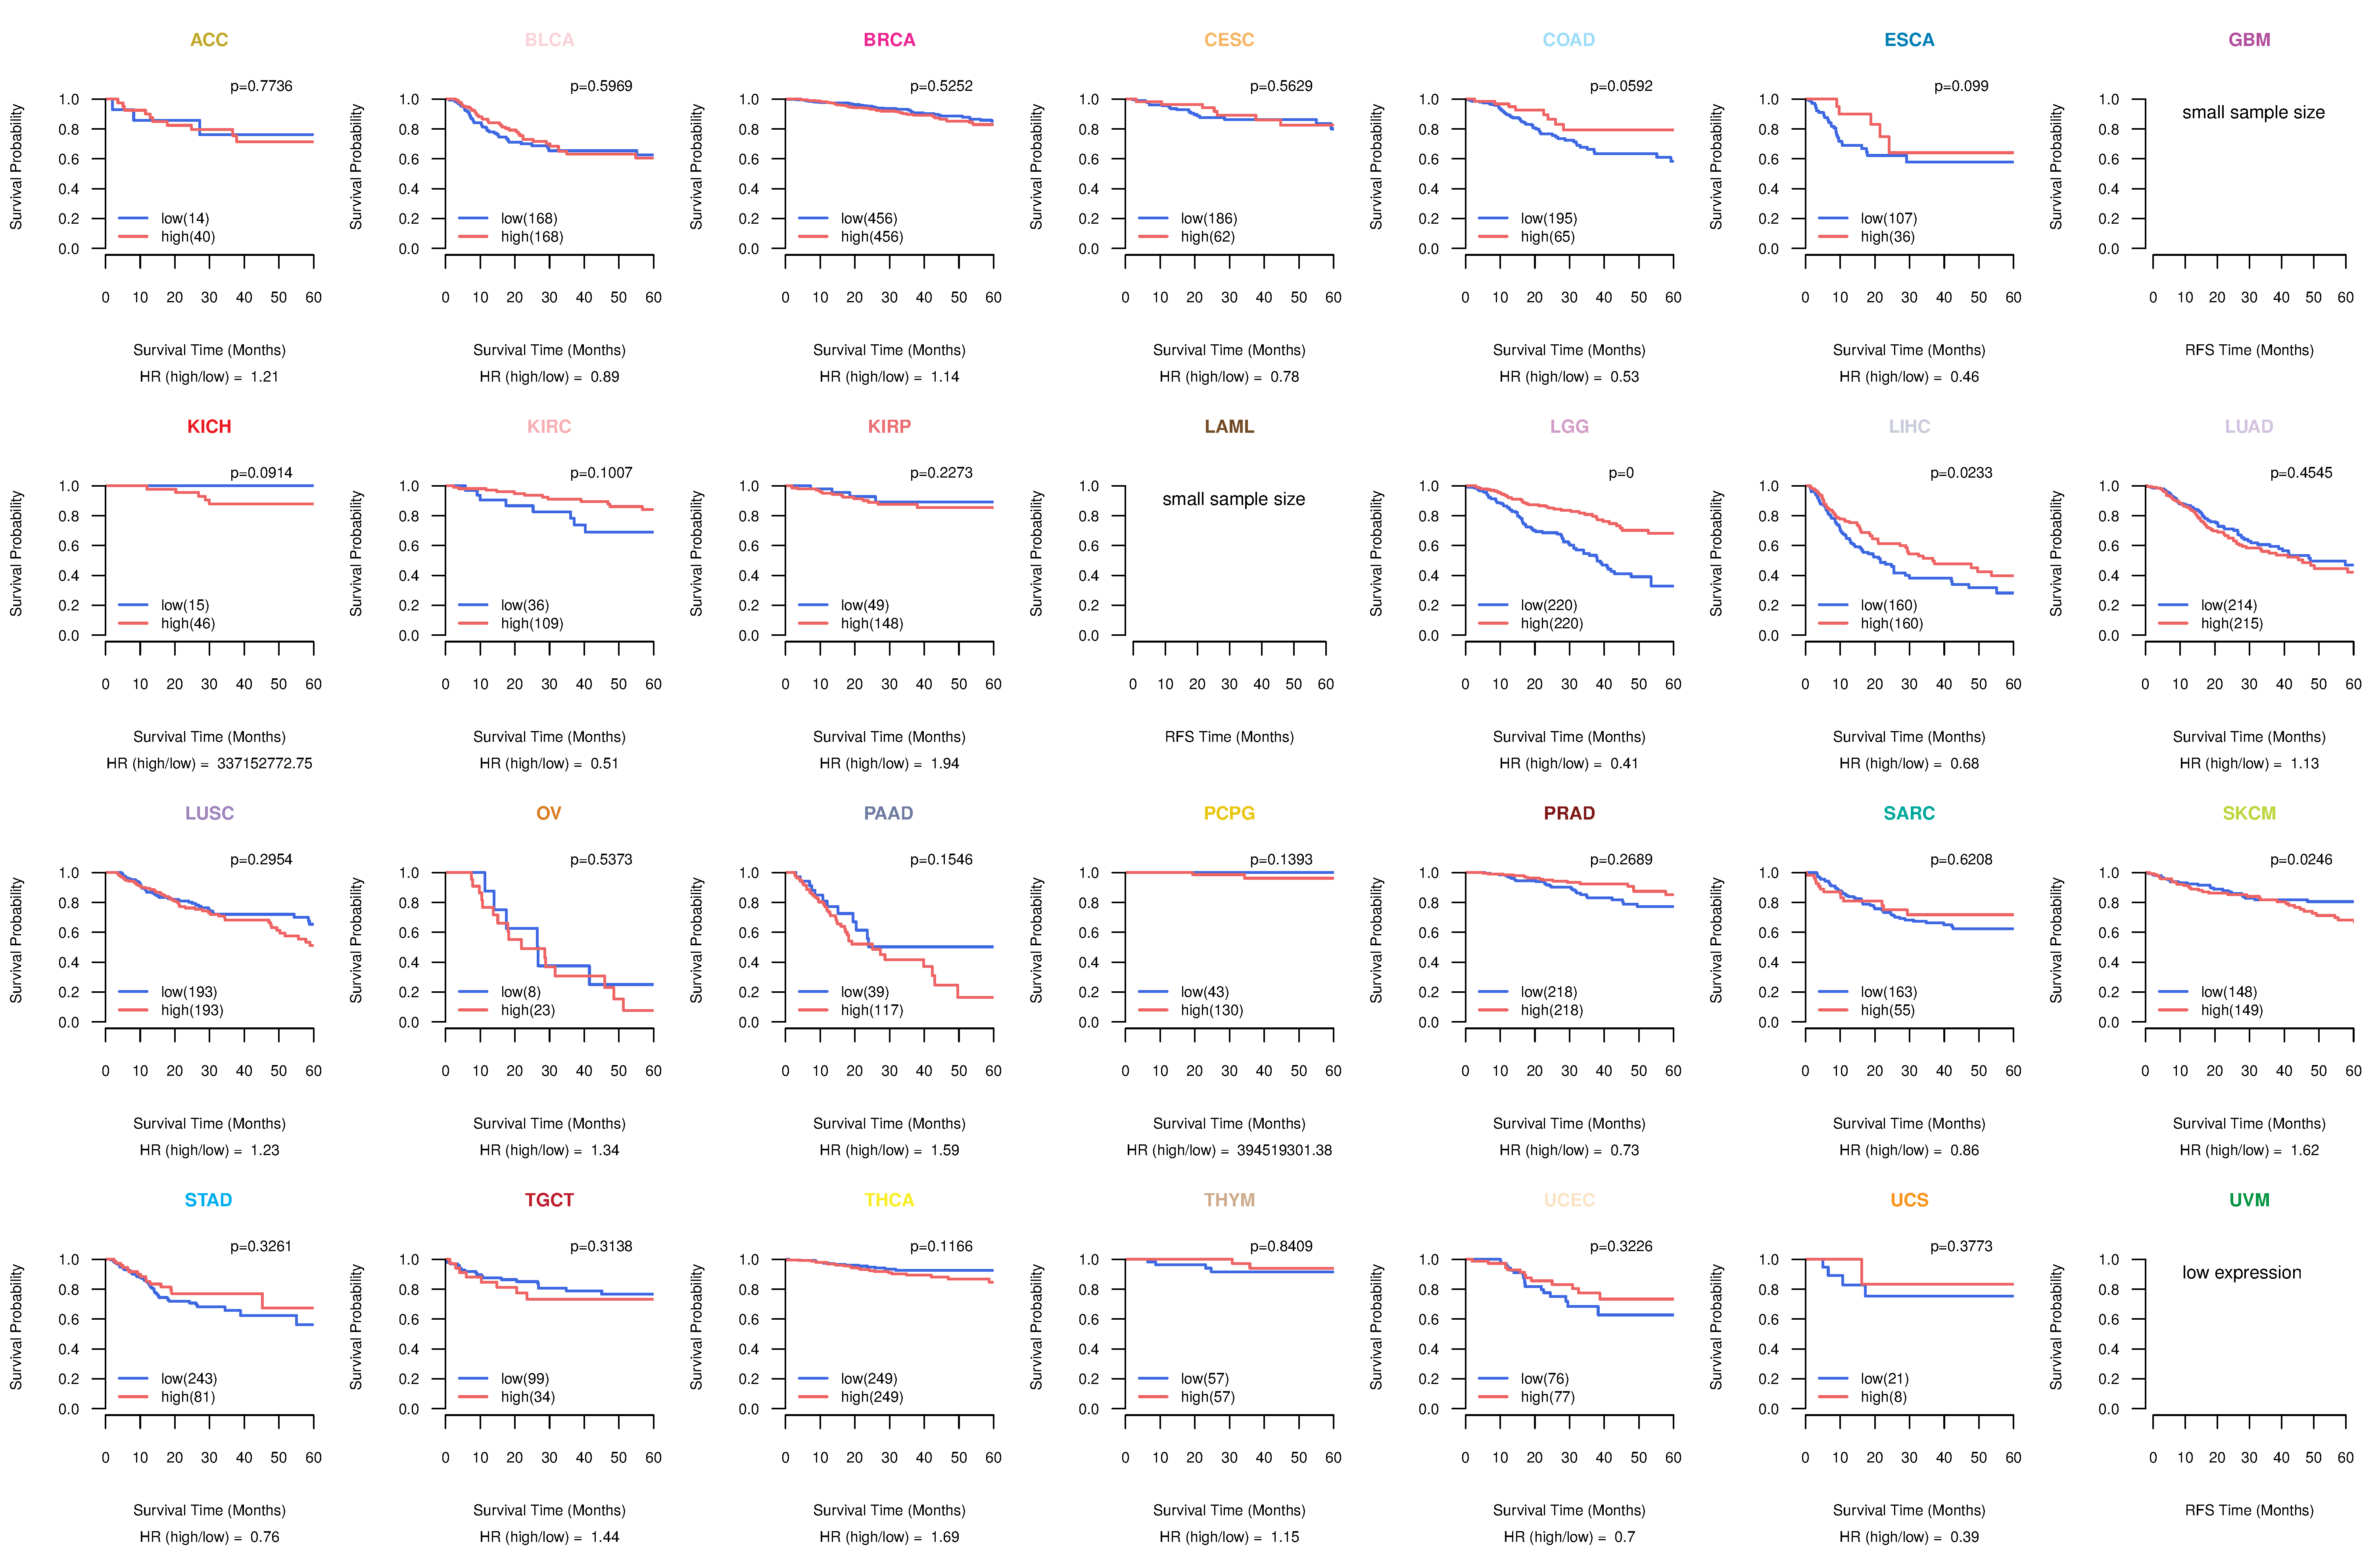
| Kaplan-Meier plots with logrank test of relapse free survival (RFS) using 28 cancer types (TCGA IlluminaHiSeq_RNASeqV2, pan-cancer normalized log2(norm_counts+1) data, version 2016-08-16) (TCGA clinicalMatrix, phenotype data, version 2016-04-27) * Click on the image enlarge it in a new window. |
 |
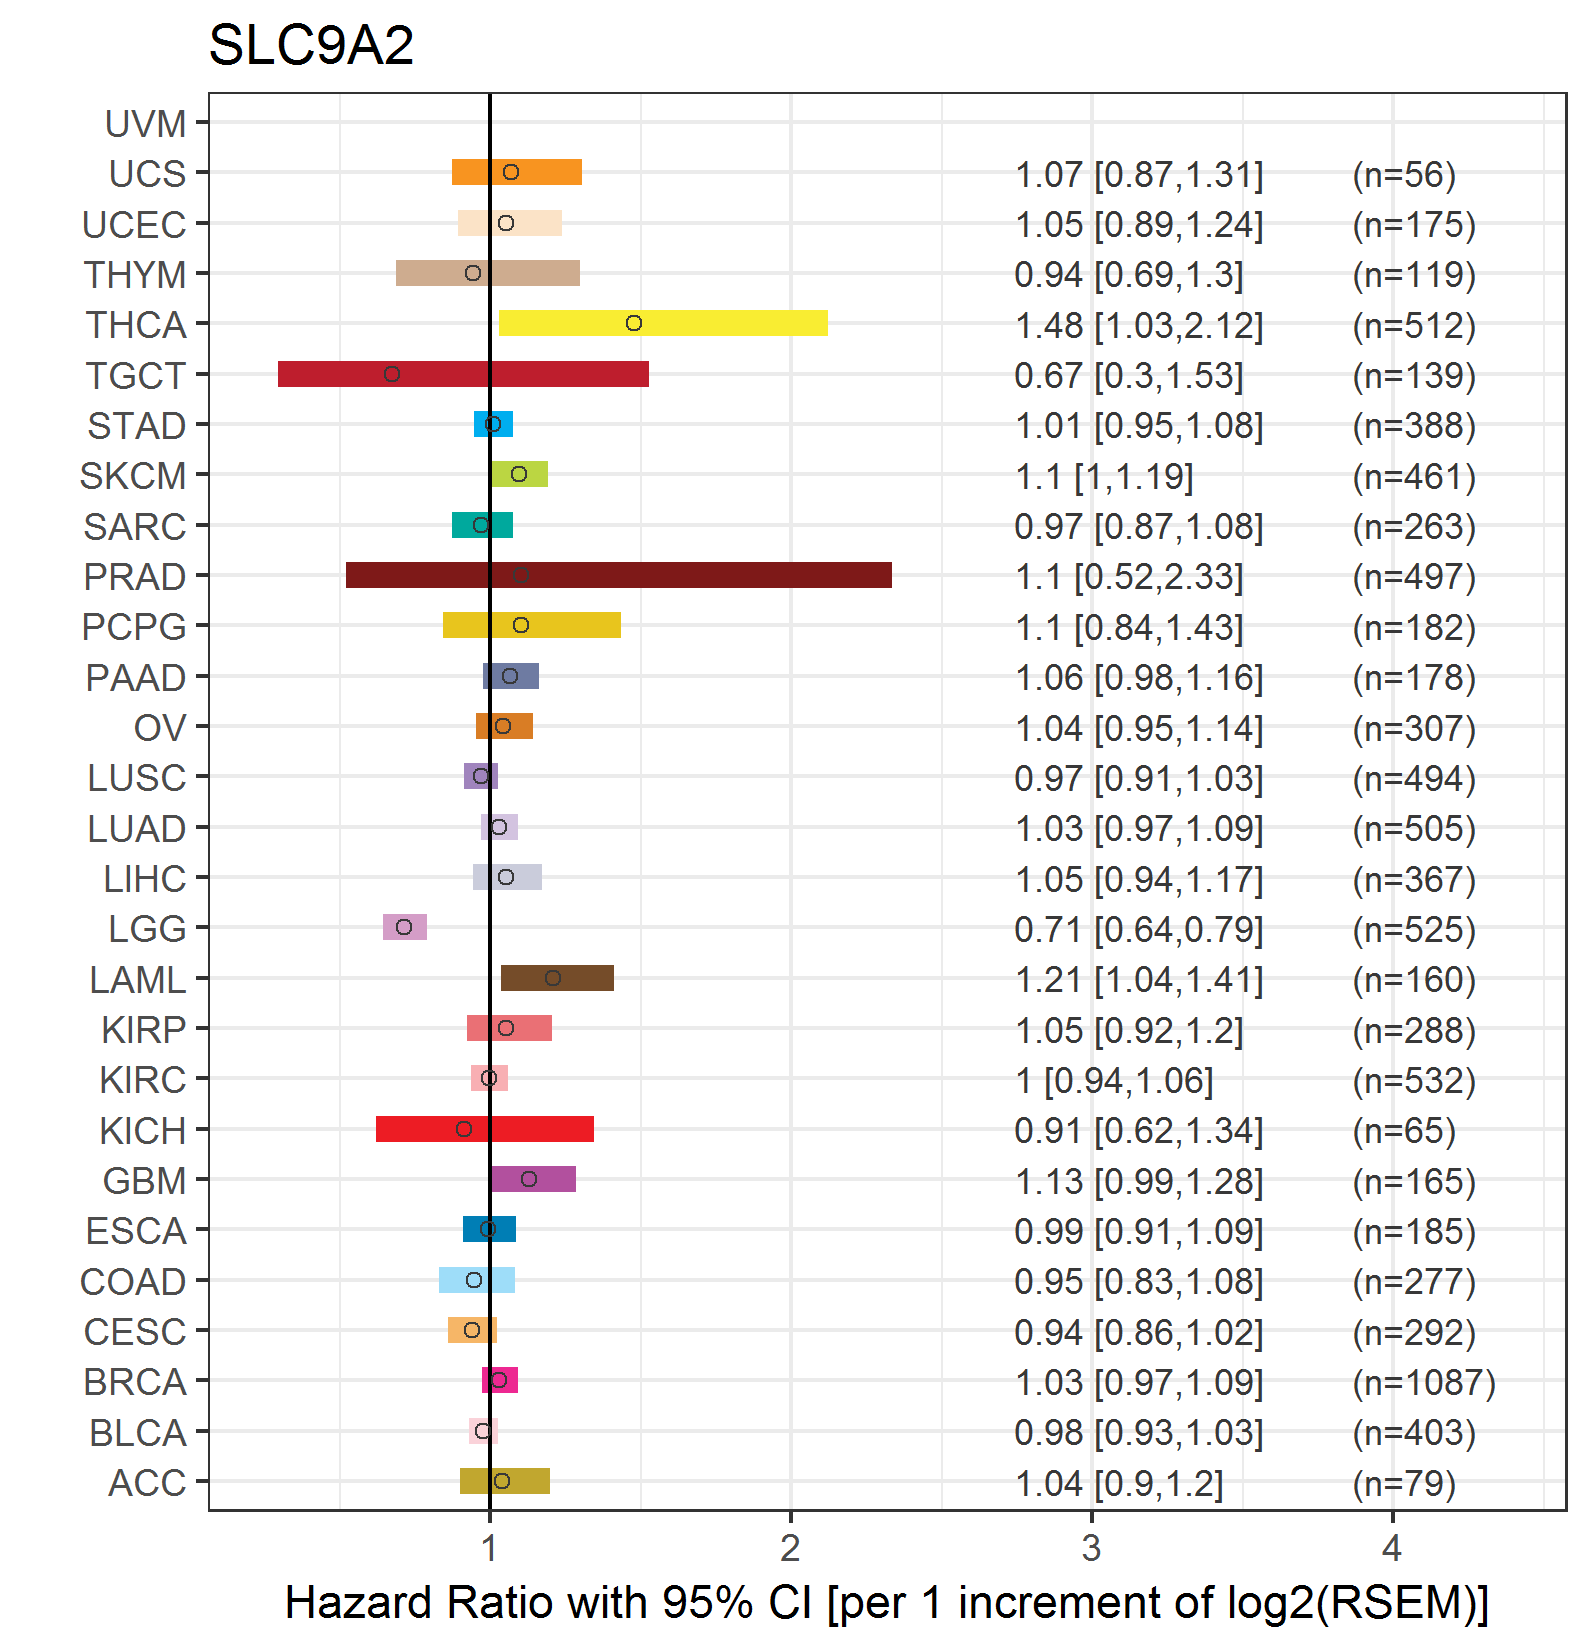
| Forest plot of Cox proportional hazard ratio (HR) and 95% CI of overall survival (OS) using 28 cancer types (TCGA IlluminaHiSeq_RNASeqV2, pan-cancer normalized log2(norm_counts+1) data, version 2016-08-16) (TCGA clinicalMatrix, phenotype data, version 2016-04-27) * Click on the image enlarge it in a new window. |
 |
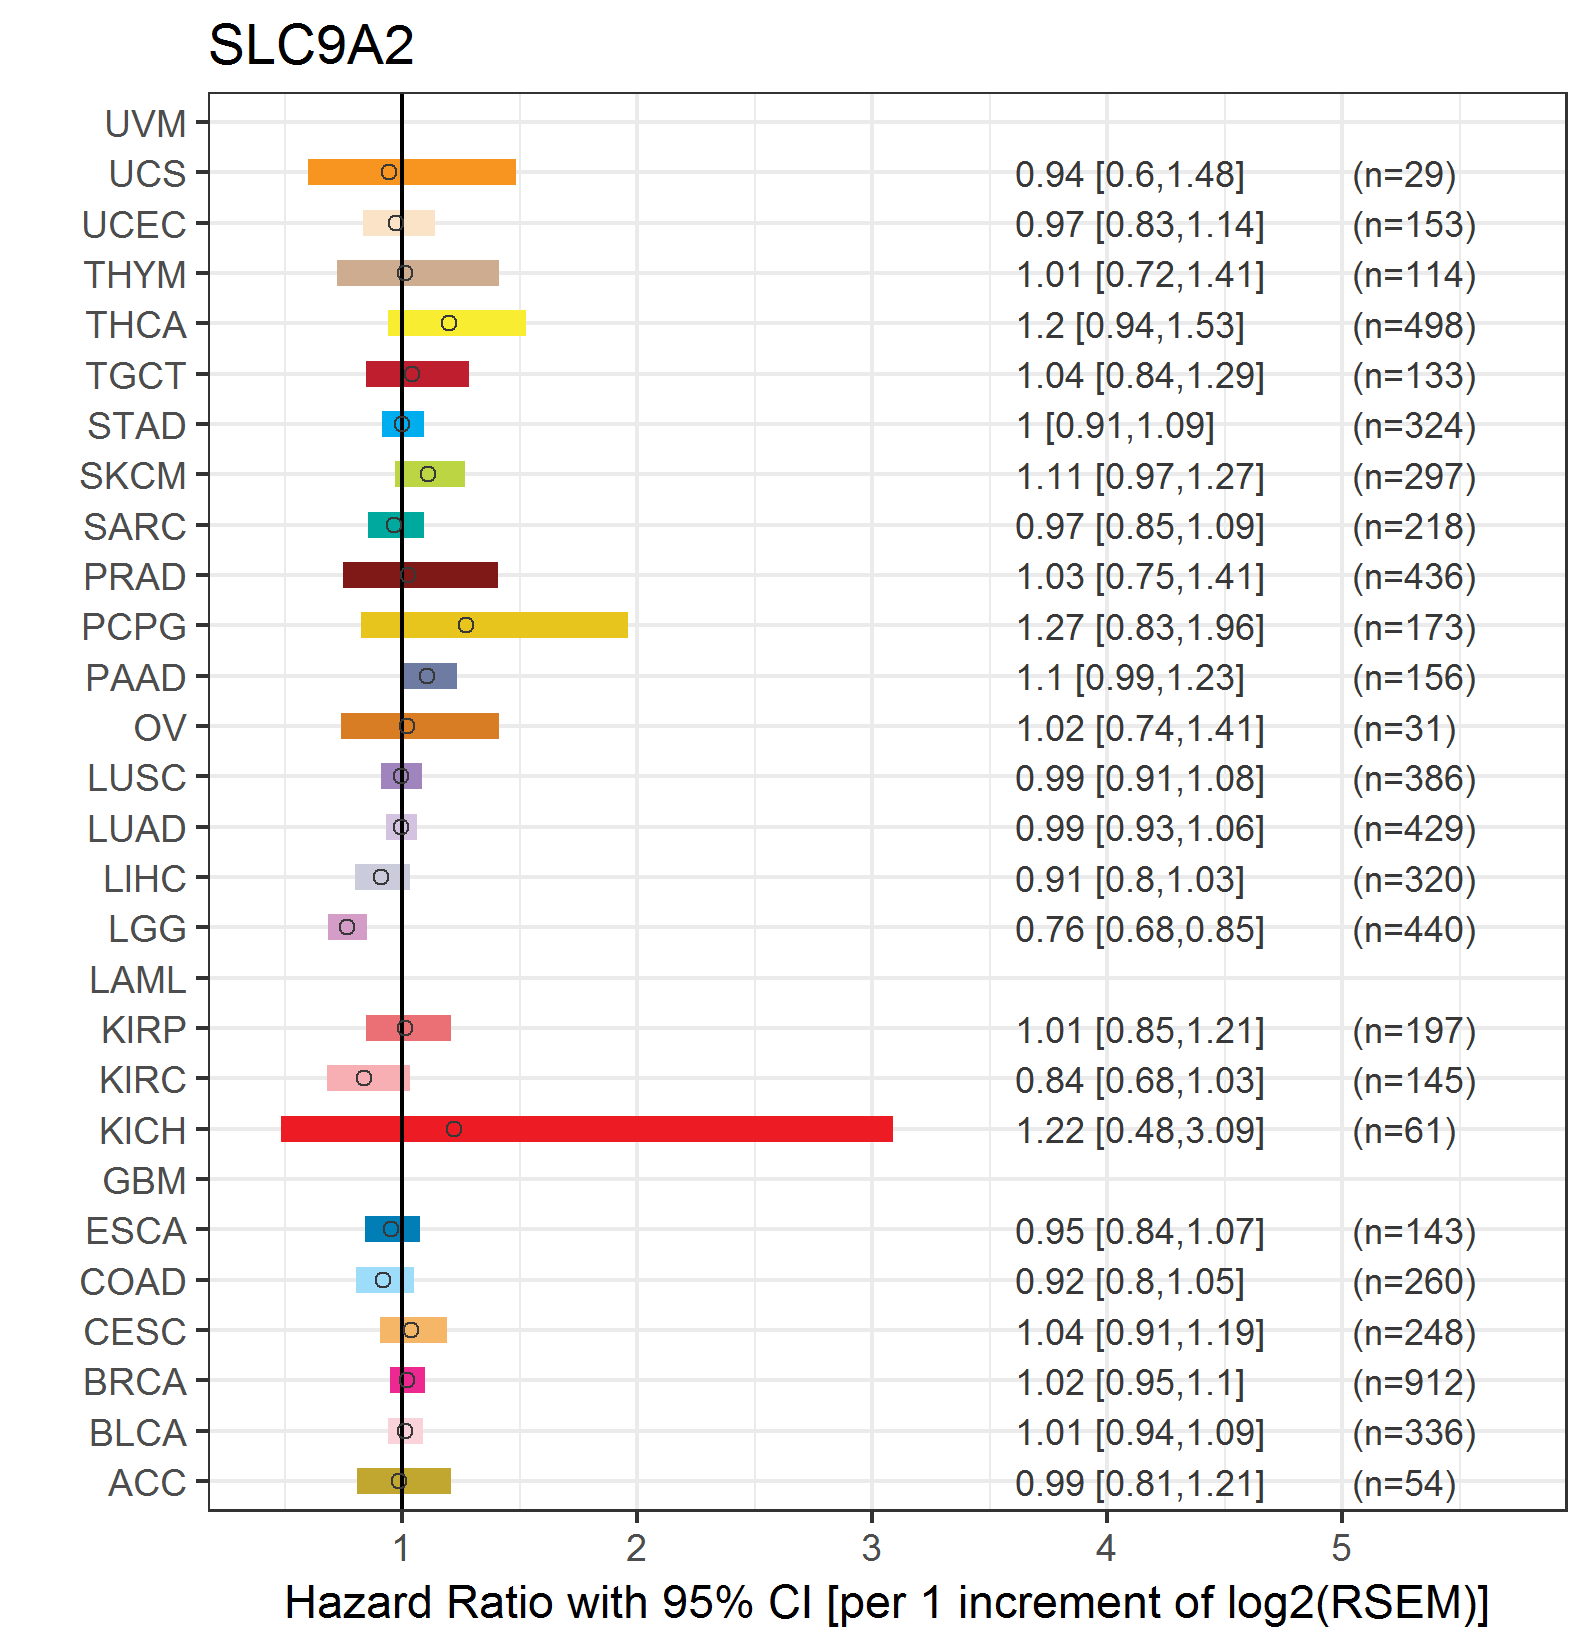
| Forest plot of Cox proportional hazard ratio (HR) and 95% CI of relapse free survival (RFS) using 28 cancer types (TCGA IlluminaHiSeq_RNASeqV2, pan-cancer normalized log2(norm_counts+1) data, version 2016-08-16) (TCGA clinicalMatrix, phenotype data, version 2016-04-27) * Click on the image enlarge it in a new window. |
 |
| Top |
| TissGeneClin for SLC9A2 |
| TissGeneDrug for SLC9A2 |
| Drug information targeting TissGene (DrugBank Version 5.0.6, 2017-04-01) |
| DrugBank ID | Drug name | Drug activity | Drug type | Drug status |
| Top |
| TissGeneDisease for SLC9A2 |
| Disease information associated with TissGene (DisGeNet, 2016-06-01) |
| Disease ID | Disease name | # pubmeds | Source |
| umls:C0001430 | Adenoma | 1 | LHGDN |
| umls:C0007361 | Cat-Scratch Disease | 1 | BeFree |
| umls:C0013604 | Edema | 1 | CTD_human |
| umls:C0020538 | Hypertensive disease | 1 | GAD |
| umls:C0040336 | Tobacco Use Disorder | 1 | GAD |
| umls:C0332853 | Anastomosis | 1 | BeFree |
|
Copyright 2016-Present - The University of Texas Health Science Center at Houston (UTHealth) Web File Viewing | How to Report, Fraud, Waste and Abuse | State of Texas | Statewide Search | Texas Homeland Security | Site Policies |