 |
| |
| |
| |
| |
| |
| |
|

| TissGeneSummary for BOLL |
 Gene summary Gene summary |
| Basic gene information | Gene symbol | BOLL |
| Gene name | boule-like RNA-binding protein | |
| Synonyms | BOULE | |
| Cytomap | UCSC genome browser: 2q33 | |
| Type of gene | protein-coding | |
| RefGenes | NM_001284358.1, NM_001284361.1,NM_001284362.1,NM_033030.5,NM_197970.2, | |
| Description | bol, boule-likeprotein boule-like | |
| Modification date | 20141207 | |
| dbXrefs | MIM : 606165 | |
| HGNC : HGNC | ||
| Ensembl : ENSG00000152430 | ||
| Vega : OTTHUMG00000132747 | ||
| Protein | UniProt: go to UniProt's Cross Reference DB Table | |
| Expression | CleanEX: HS_BOLL | |
| BioGPS: 66037 | ||
| Pathway | NCI Pathway Interaction Database: BOLL | |
| KEGG: BOLL | ||
| REACTOME: BOLL | ||
| Pathway Commons: BOLL | ||
| Context | iHOP: BOLL | |
| ligand binding site mutation search in PubMed: BOLL | ||
| UCL Cancer Institute: BOLL | ||
| Assigned class in TissGDB* | B | |
| Included tissue-specific gene expression resources | HPA,TiGER,GTEx | |
| Specific-tissues in normal samples (assigned by TissGDB using HPA, TiGER, and GTEx) | Testis | |
| Cancer types related to the specific-tissues in cancer samples (assigned by TissGDB using TCGA) | TGCT | |
| Reference showing the relevant tissue of BOLL | ||
| Description by TissGene annotations | ||
| * Class A consists of genes with literature evidence and is part of the cTissGenes. Class B consists of only cTissGenes without additional evidence. The remaining genes belong to Class C. |
| Gene ontology having evidence of Inferred from Direct Assay (IDA) from Entrez |
| GO ID | GO term | PubMed ID | GO:0007126 | meiotic nuclear division | 12499397 | GO:0045948 | positive regulation of translational initiation | 16001084 | GO:0007126 | meiotic nuclear division | 12499397 | GO:0045948 | positive regulation of translational initiation | 16001084 |
| Top |
| TissGeneExp for BOLL |
| Gene expressions across 28 cancer types (X-axis: cancer type and Y-axis: log2(norm_counts+1)) (TCGA IlluminaHiSeq_RNASeqV2, pan-cancer normalized log2(norm_counts+1) data, version 2016-08-16) |
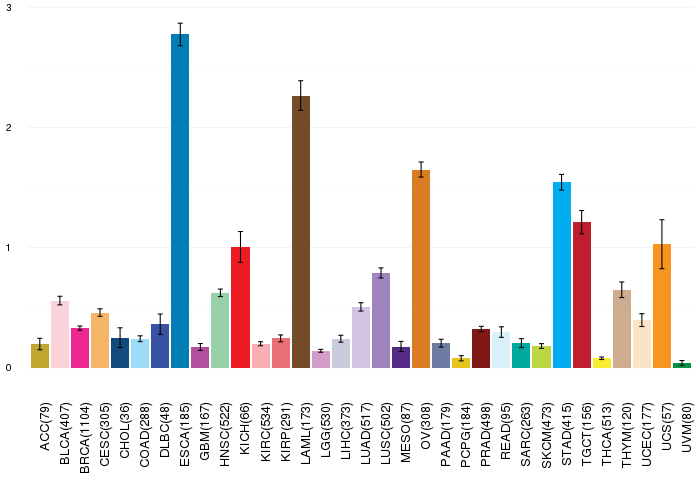 |
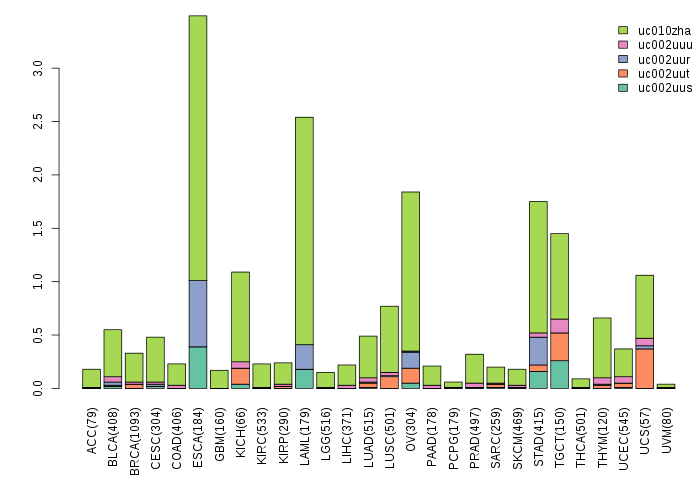
| Gene isoform expressions across 28 cancer types (X-axis: cancer type and Y-axis: log2(norm_counts+1)) (TCGA pan-cancer tcga_rsem_isoform_tpm, version 2016-09-01) |
 |
| Gene expressions across normal tissues of GTEx data (GTEx GTEx_Analysis_v6_RNA-seq_RNA-SeQCv1.1.8_gene_rpkm.gct) - Here, we shows the matched tissue types only among our 28 cancer types. |
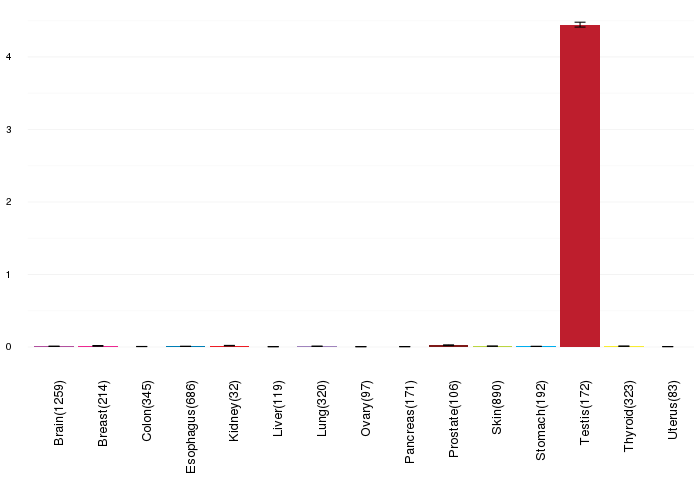 |
| Different expressions across 14 cancer types with more than 10 samples between matched tumors and normals (X-axis: cancer type and Y-axis: log2(norm_counts+1)) (TCGA IlluminaHiSeq_RNASeqV2, pan-cancer normalized log2(norm_counts+1) data, version 2016-08-16) |
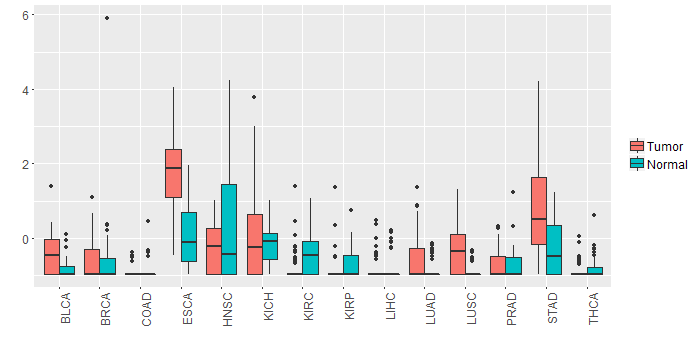 |
| - Significantly differentially expressed cancer types and information. (|Fold change|>1 and FDR<0.05) |
| Cancer type | Mean(exp) in tumor | Mean(exp) in matched normal | Log2FC | P-val. | FDR |
| ESCA | 1.833492103 | 0.137246648 | 1.696245455 | 0.00245 | 0.025314654 |
| Top |
| TissGene-miRNA for BOLL |
| Significantly anti-correlated miRNAs of TissGene across 28 cancer types (Gene-miRNA relations from TargetScanHuman Relsease 7.1, Conserved_Site_Context_Scores.txt.zip, 06.01.2016) (TCGA IlluminaHiSeq_miRNASeq, log2(RPM+1) data, version 2016-11-21) (TCGA IlluminaHiSeq_RNASeqV2, log2(normalized_count+1) data, version 2016-08-16) (Spearman’s Rank Correlation (p-value<0.05 and coefficient<-0.25)) |
| Cancer type | miRNA id | miRNA accession | P-val. | Coeff. | # samples |
| Top |
| TissGeneMut for BOLL |
| TissGeneSNV for BOLL |
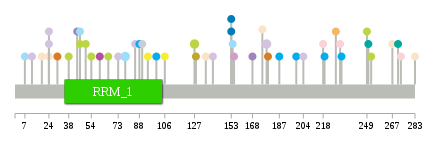
| nsSNV counts per each loci. Different colors of circles represent different cancer types. Circle size denotes number of samples. (TCGA somatic mutation (SNPs and small INDELs) data, version 2016-04-25) * Click on the image to enlarge it in a new window. |
 |
 |
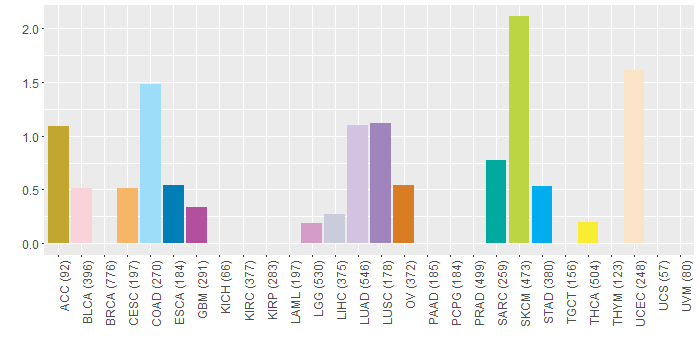
| Somatic nucleotide variants of TissGene across 28 cancer types (X-axis: cancer type and Y-axis: % of mutated samples) The numbers in parentheses are numbers of samples with mutation (nsSNVs). (TCGA somatic mutation (SNPs and small INDELs) data, version 2016-04-25) |
 |
| - nsSNVs sorted by frequency. |
| AAchange | Cancer type | # samples |
| p.G127E | SKCM | 2 |
| p.V78I | COAD | 2 |
| p.S178I | LUAD | 2 |
| p.S66F | SKCM | 1 |
| p.R34C | HNSC | 1 |
| p.H267N | UCEC | 1 |
| p.S252L | SKCM | 1 |
| p.P24H | LUAD | 1 |
| p.P322S | SKCM | 1 |
| p.H153R | ESCA | 1 |
| p.P24S | UCEC | 1 |
| p.M249I | SKCM | 1 |
| p.G204A | LUAD | 1 |
| p.P135S | UCEC | 1 |
| p.E106Q | THCA | 1 |
| p.G155S | LGG | 1 |
| p.G50E | SKCM | 1 |
| p.H153N | ESCA | 1 |
| p.P24T | LUAD | 1 |
| p.S179A | OV | 1 |
| p.E46K | COAD | 1 |
| p.I128S | ACC | 1 |
| p.S19A | UCEC | 1 |
| p.Y230N | BLCA | 1 |
| p.S175F | UCEC | 1 |
| p.E94Q | THCA | 1 |
| p.H283N | UCEC | 1 |
| p.V90I | LIHC | 1 |
| p.S7F | COAD | 1 |
| p.E273Q | BLCA | 1 |
| p.K73E | LUAD | 1 |
| p.Q231R | STAD | 1 |
| p.G38E | SKCM | 1 |
| p.M140I | LUAD | 1 |
| p.S154L | COAD | 1 |
| p.R331Q | SKCM | 1 |
| p.S54F | SKCM | 1 |
| p.S60F | GBM | 1 |
| p.Q219R | STAD | 1 |
| p.K88N | STAD | 1 |
| p.R46C | SKCM | 1 |
| p.R168S | LUSC | 1 |
| p.E250K | SARC | 1 |
| p.T199A | STAD | 1 |
| p.A271V | SARC | 1 |
| p.K85E | LUAD | 1 |
| p.R46C | HNSC | 1 |
| p.D321N | SKCM | 1 |
| p.L30S | OV | 1 |
| p.E227K | CESC | 1 |
| p.G44A | LUSC | 1 |
| p.K100N | STAD | 1 |
| p.P12N | LUAD | 1 |
| p.T187A | STAD | 1 |
| p.Y218N | BLCA | 1 |
| Top |
| TissGeneCNV for BOLL |
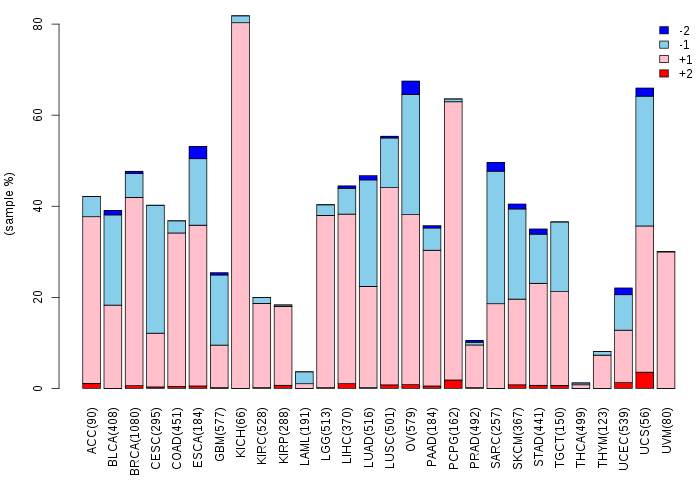
| Copy number variations of TissGene across 28 cancer types (X-axis: cancer type and Y-axis: % of CNV samples) (TCGA Gistic2_CopyNumber_Gistic2_all_data_by_genes, Gistic2 copy number data, version 2016-08-16) |
 |
| Top |
| TissGeneFusions for BOLL |
| Fusion genes including TissGene (ChimerDB 3.0, 2016-12-01 and TCGA fusion Portal 2015-12-01) |
| Database | Src | Cancer type | Sample | Fusion gene | ORF | 5'-gene BP | 3'-gene BP |
| Top |
| TissGeneNet for BOLL |
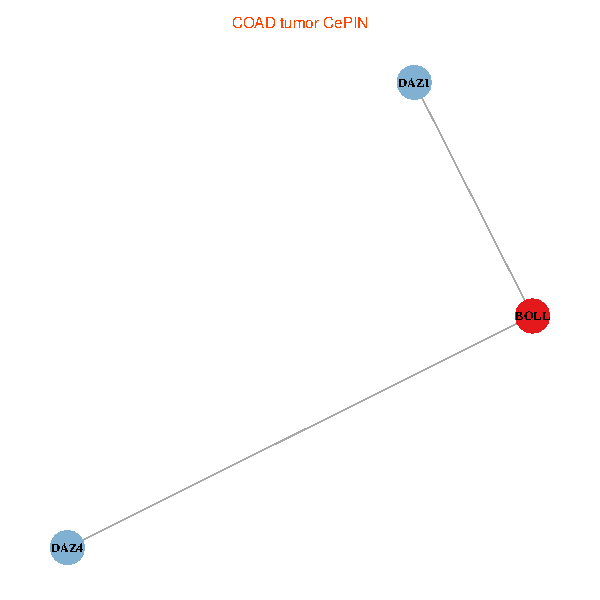
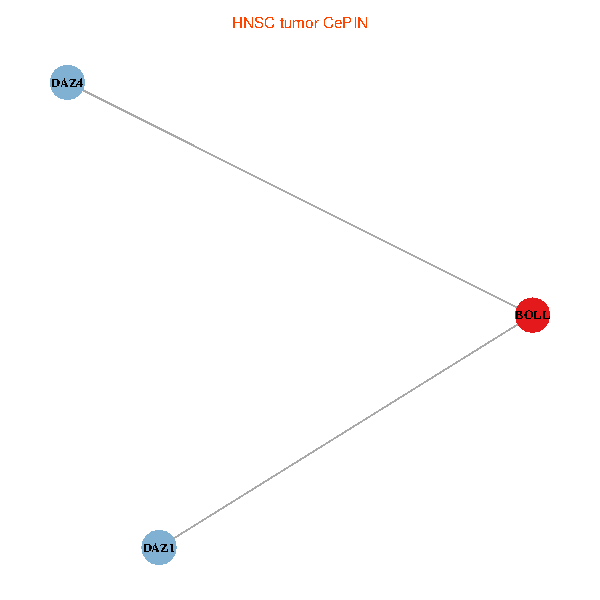
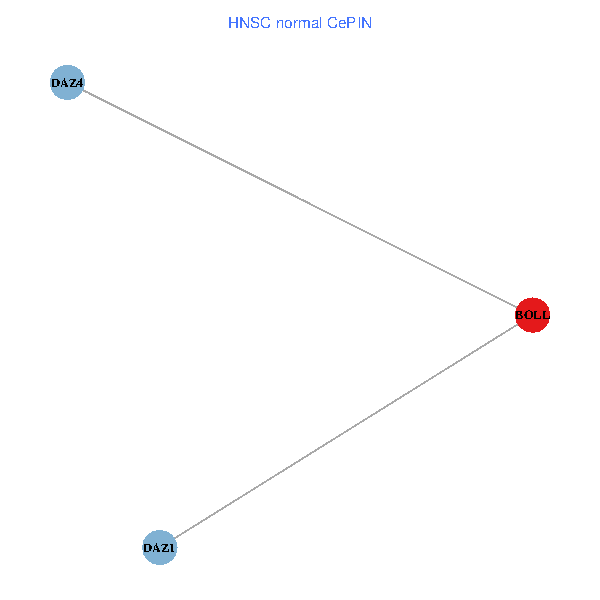
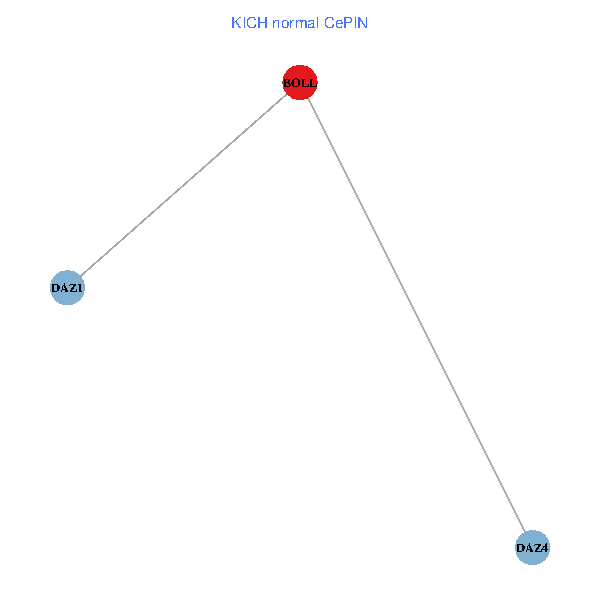
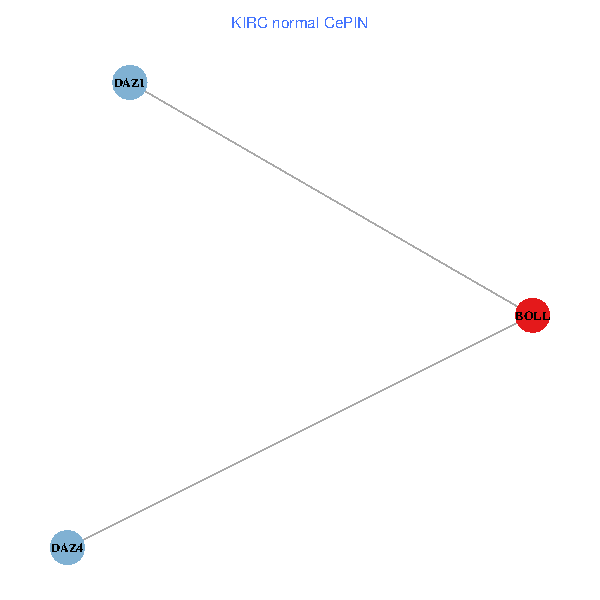
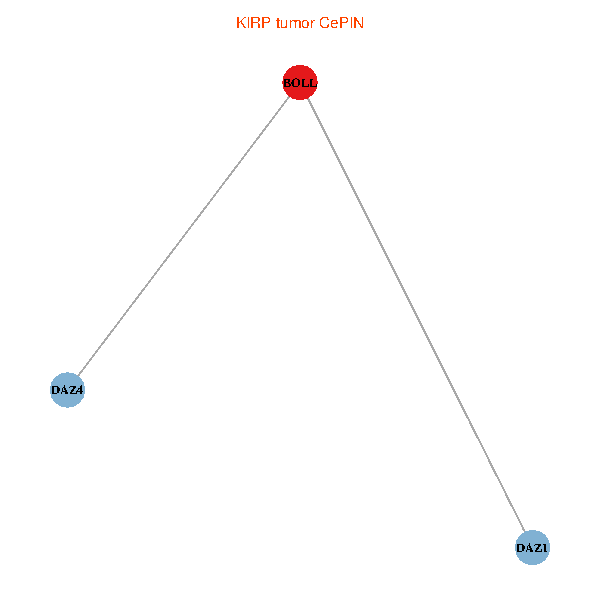
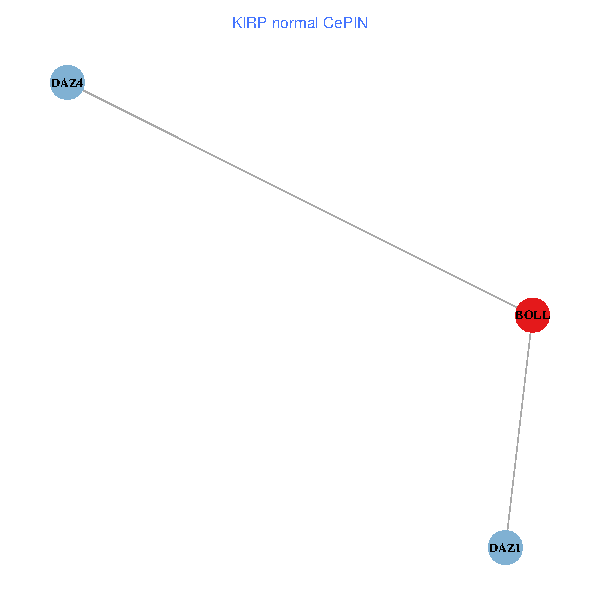
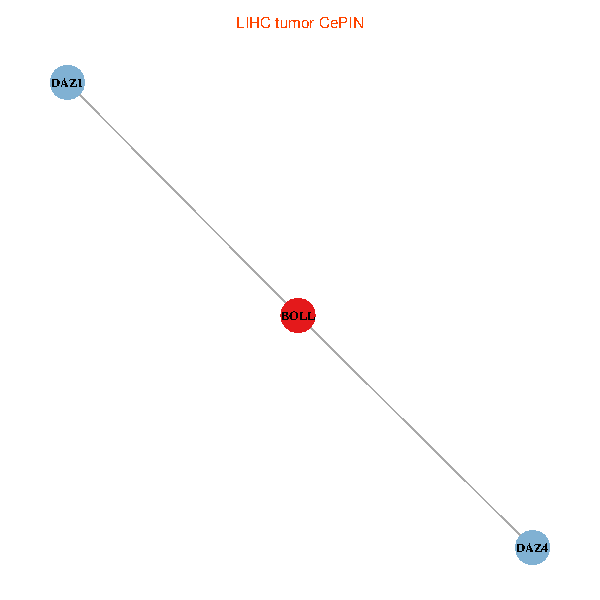
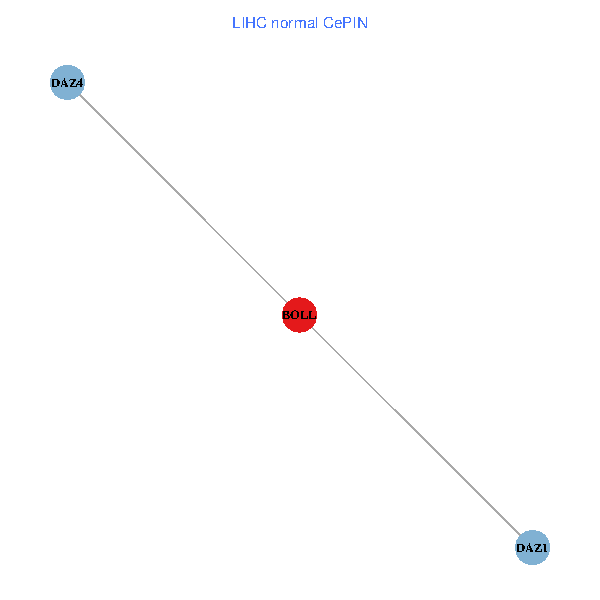
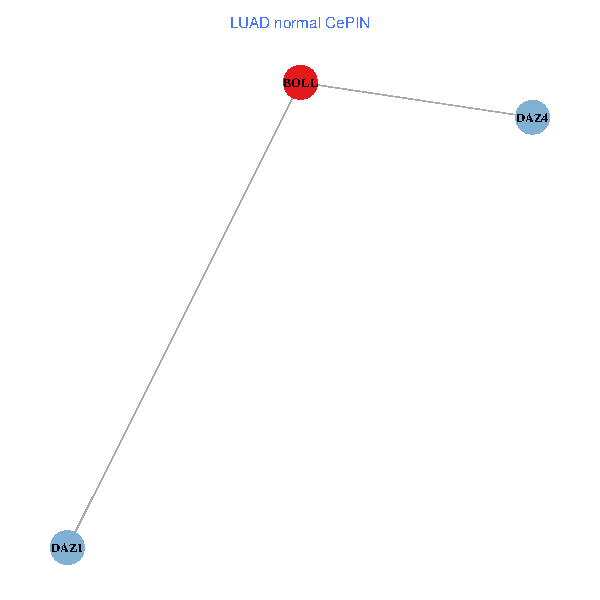
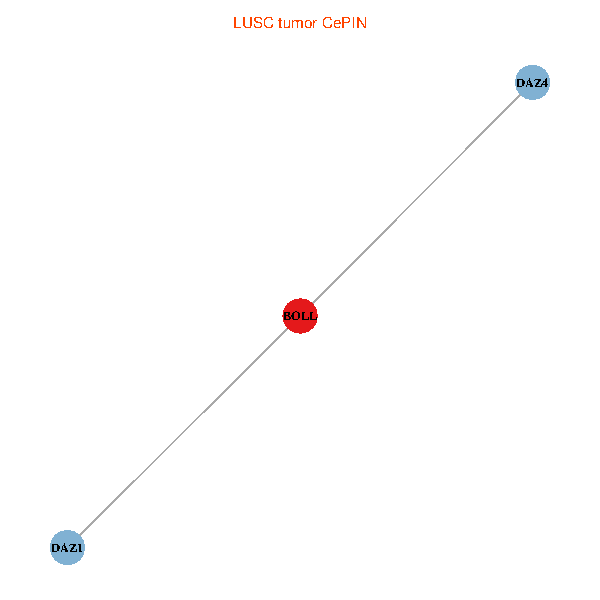
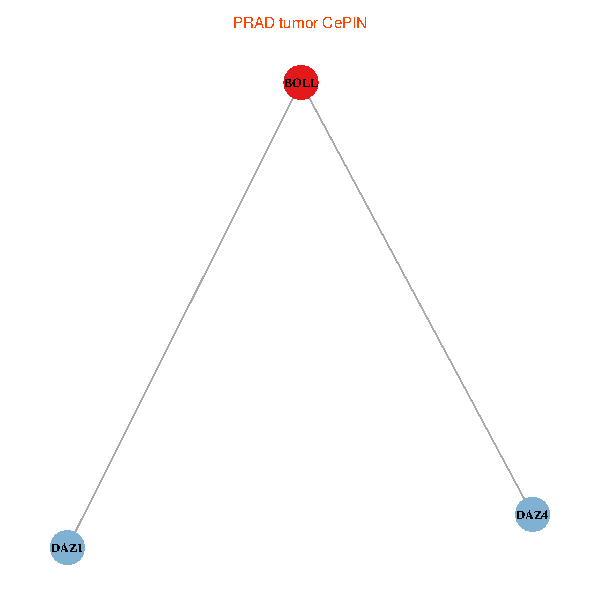
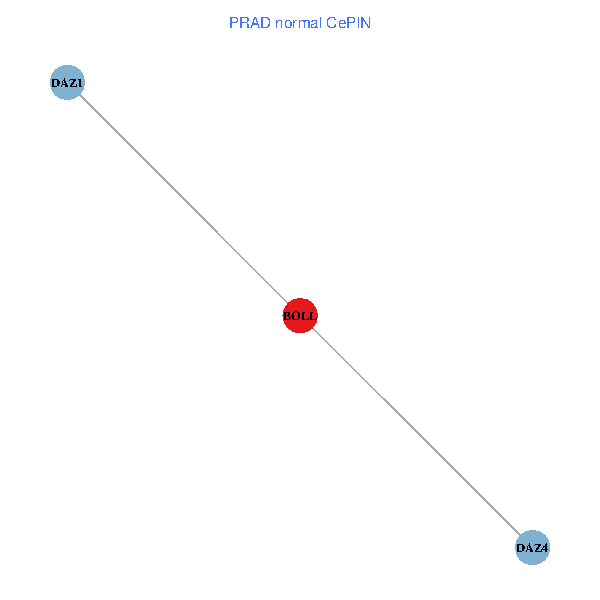
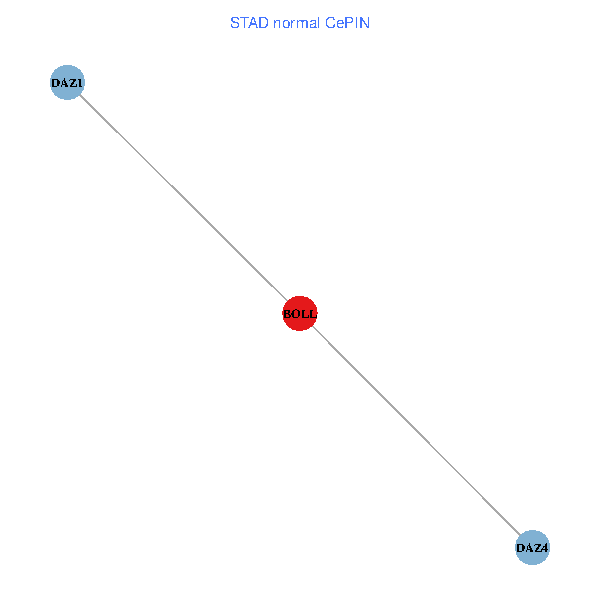
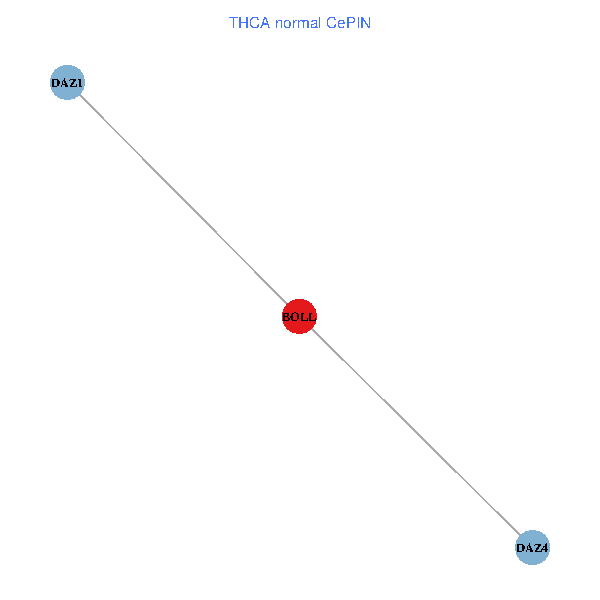
| Co-expressed gene networks based on protein-protein interaction data (CePIN) (TCGA IlluminaHiSeq_RNASeqV2, pan-cancer normalized log2(norm_counts+1) data, version 2016-08-16) (PINA2 ppi data) |
| BRCA (tumor) | BRCA (normal) |
| BOLL, DAZ1, DAZ4 (tumor) | BOLL, DAZ1, DAZ4 (normal) |
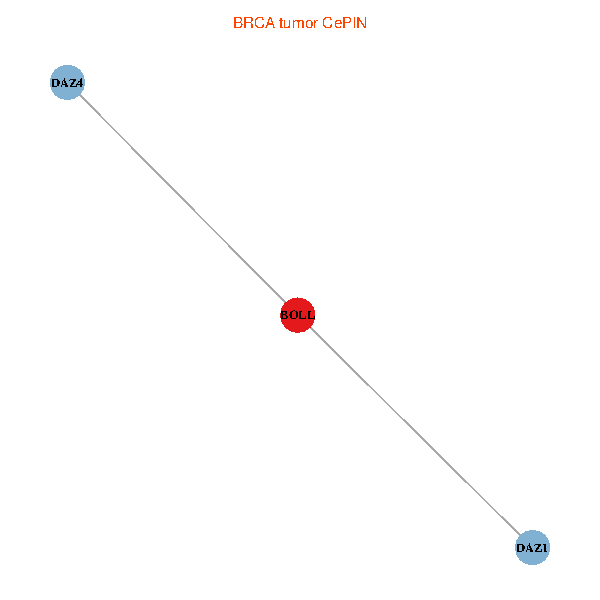 |  |
| COAD (tumor) | COAD (normal) |
| BOLL, DAZ1, DAZ4 (tumor) | BOLL, DAZ1, DAZ4 (normal) |
 |  |
| HNSC (tumor) | HNSC (normal) |
| BOLL, DAZ1, DAZ4 (tumor) | BOLL, DAZ1, DAZ4 (normal) |
 |  |
| KICH (tumor) | KICH (normal) |
| BOLL, DAZ1, DAZ4 (tumor) | BOLL, DAZ1, DAZ4 (normal) |
 |  |
| KIRC (tumor) | KIRC (normal) |
| BOLL, DAZ1, DAZ4 (tumor) | BOLL, DAZ1, DAZ4 (normal) |
 |  |
| KIRP (tumor) | KIRP (normal) |
| BOLL, DAZ1, DAZ4 (tumor) | BOLL, DAZ1, DAZ4 (normal) |
 |  |
| LIHC (tumor) | LIHC (normal) |
| BOLL, DAZ1, DAZ4 (tumor) | BOLL, DAZ1, DAZ4 (normal) |
 |  |
| LUAD (tumor) | LUAD (normal) |
| BOLL, DAZ1, DAZ4 (tumor) | BOLL, DAZ1, DAZ4 (normal) |
 |  |
| LUSC (tumor) | LUSC (normal) |
| BOLL, DAZ1, DAZ4 (tumor) | BOLL, DAZ1, DAZ4 (normal) |
 |  |
| PRAD (tumor) | PRAD (normal) |
| BOLL, DAZ1, DAZ4 (tumor) | BOLL, DAZ1, DAZ4 (normal) |
 |  |
| STAD (tumor) | STAD (normal) |
| BOLL, DAZ1, DAZ4 (tumor) | BOLL, DAZ1, DAZ4 (normal) |
 |  |
| THCA (tumor) | THCA (normal) |
| BOLL, DAZ1, DAZ4 (tumor) | BOLL, DAZ1, DAZ4 (normal) |
 |  |
| Top |
| TissGeneProg for BOLL |
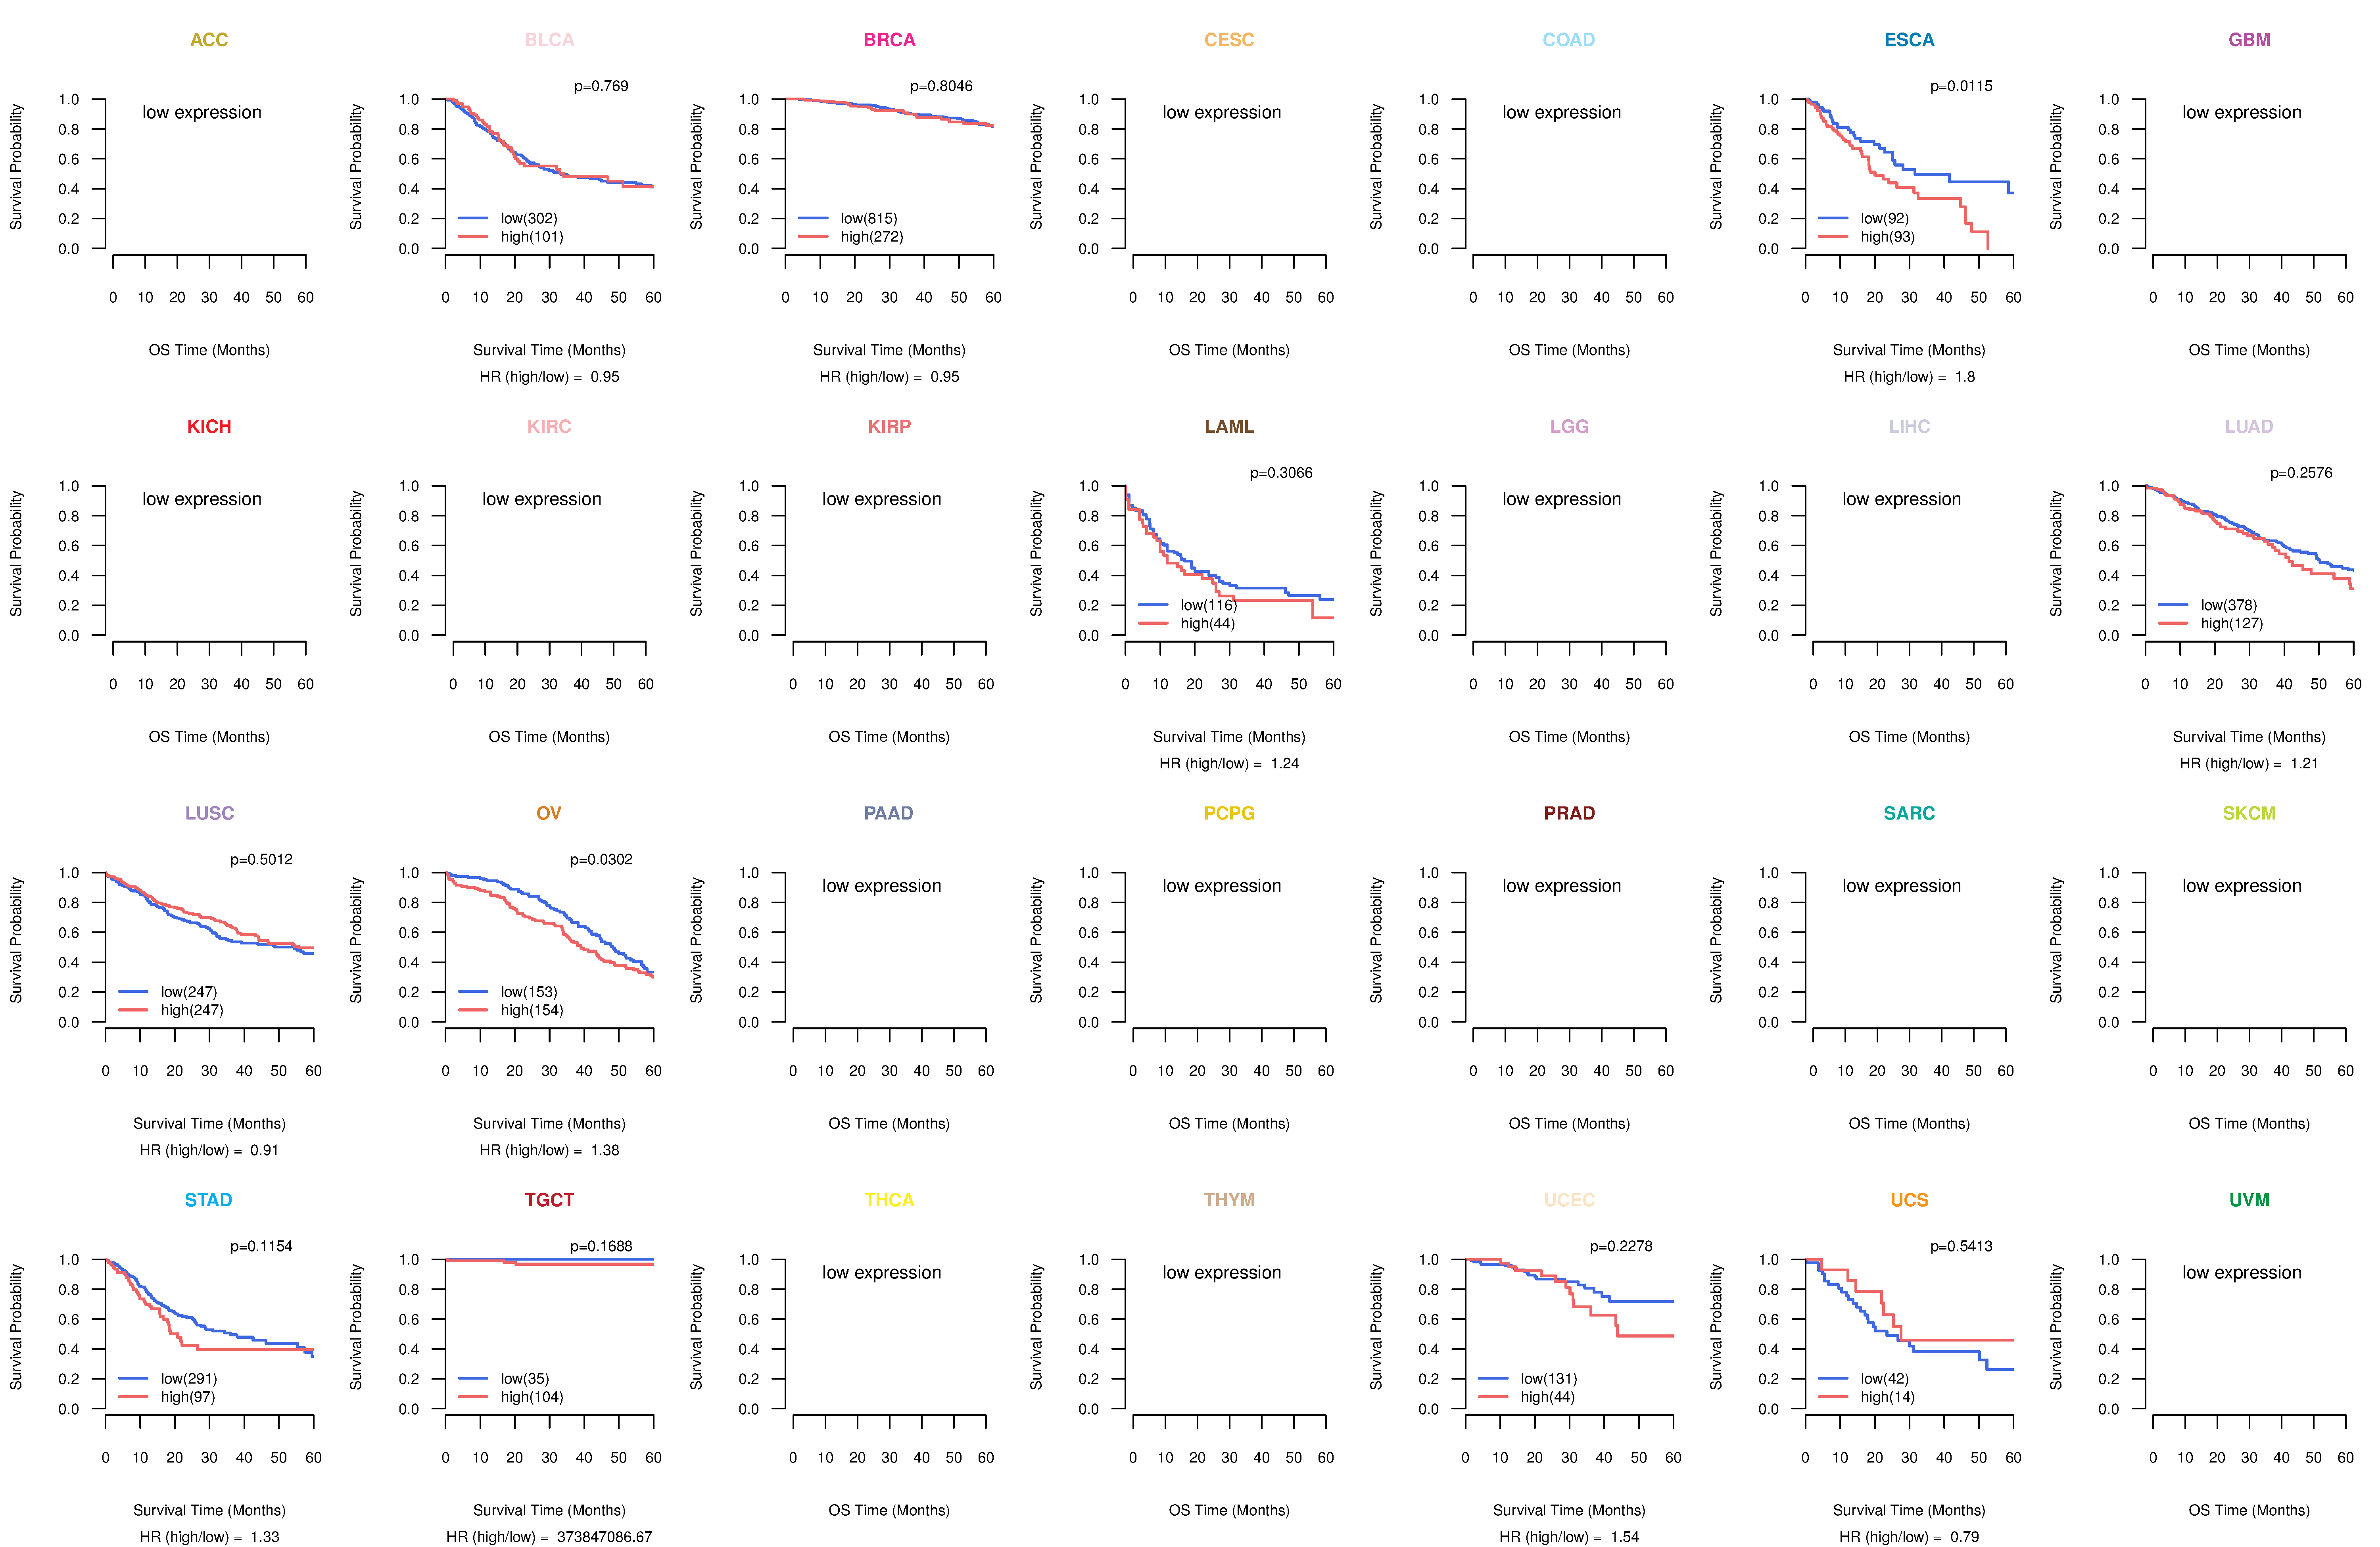
| Kaplan-Meier plots with logrank tests of overall survival (OS) using 28 cancer types (TCGA IlluminaHiSeq_RNASeqV2, pan-cancer normalized log2(norm_counts+1) data, version 2016-08-16) (TCGA clinicalMatrix, phenotype data, version 2016-04-27) * Click on the image to enlarge it in a new window. |
 |
| Kaplan-Meier plots with logrank test of relapse free survival (RFS) using 28 cancer types (TCGA IlluminaHiSeq_RNASeqV2, pan-cancer normalized log2(norm_counts+1) data, version 2016-08-16) (TCGA clinicalMatrix, phenotype data, version 2016-04-27) * Click on the image enlarge it in a new window. |
 |
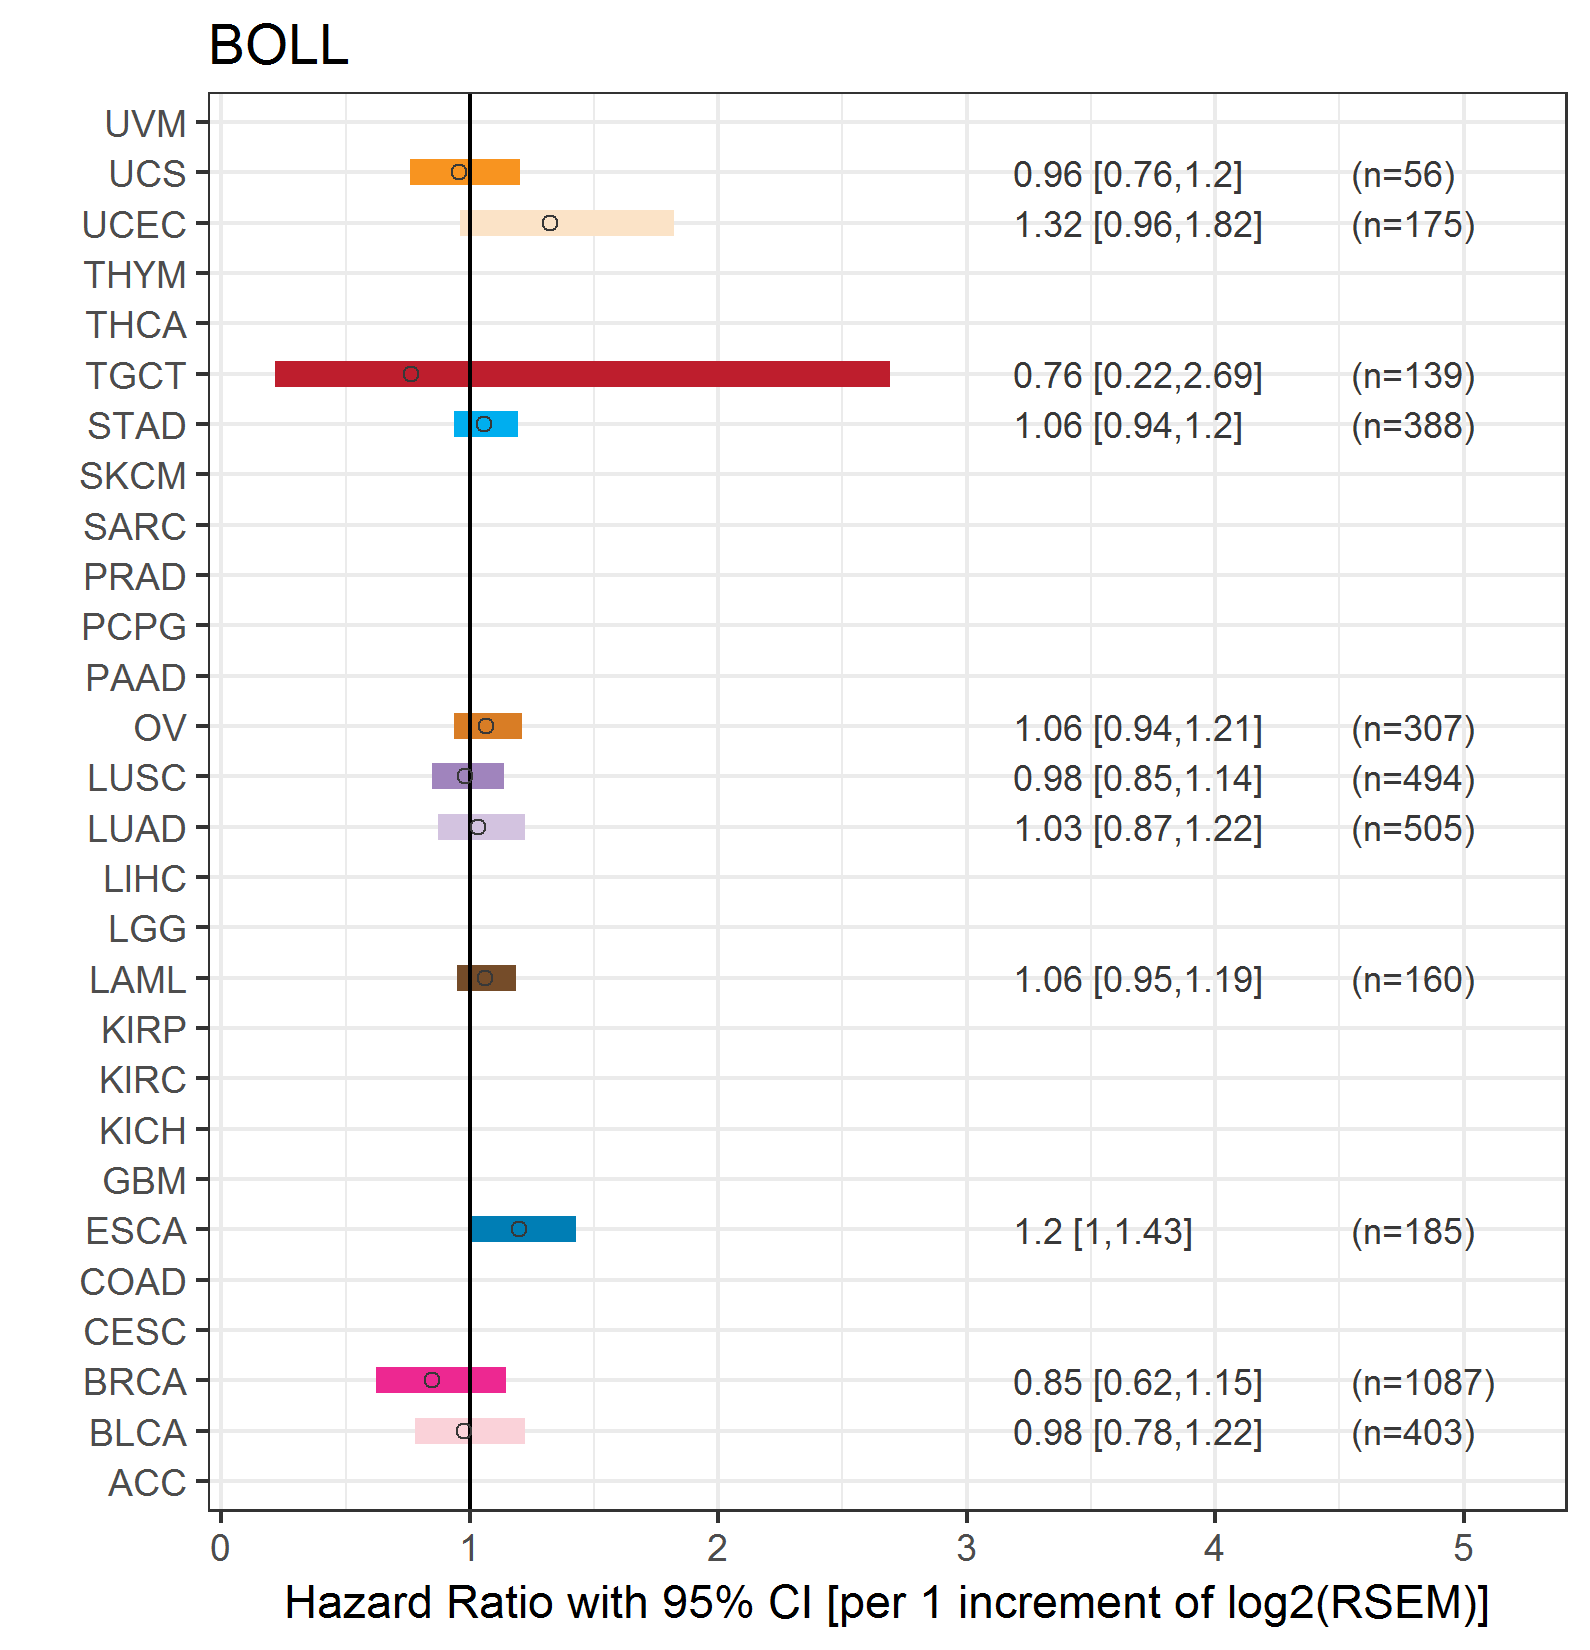
| Forest plot of Cox proportional hazard ratio (HR) and 95% CI of overall survival (OS) using 28 cancer types (TCGA IlluminaHiSeq_RNASeqV2, pan-cancer normalized log2(norm_counts+1) data, version 2016-08-16) (TCGA clinicalMatrix, phenotype data, version 2016-04-27) * Click on the image enlarge it in a new window. |
 |
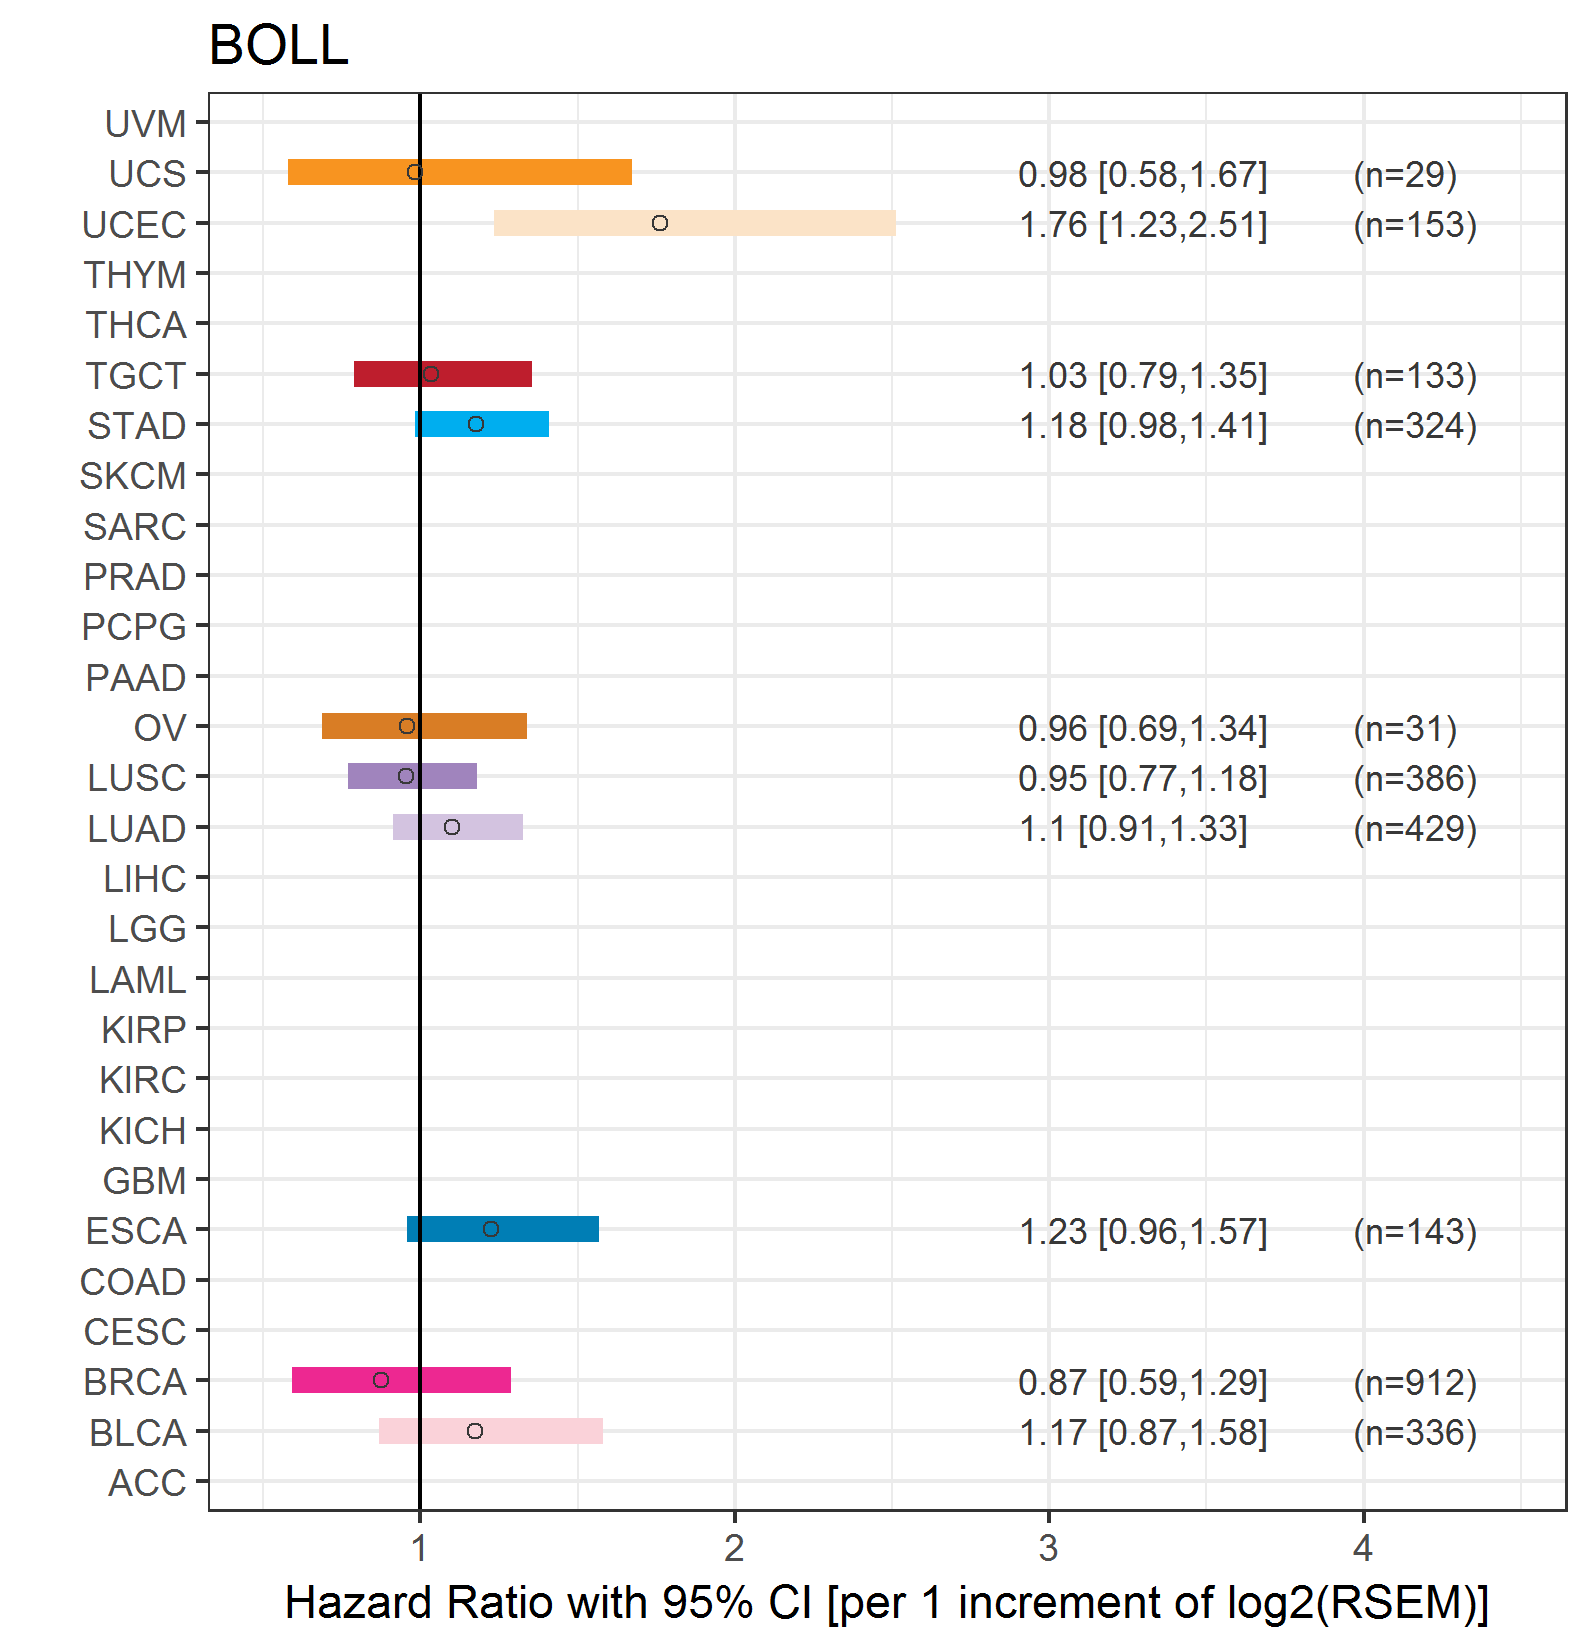
| Forest plot of Cox proportional hazard ratio (HR) and 95% CI of relapse free survival (RFS) using 28 cancer types (TCGA IlluminaHiSeq_RNASeqV2, pan-cancer normalized log2(norm_counts+1) data, version 2016-08-16) (TCGA clinicalMatrix, phenotype data, version 2016-04-27) * Click on the image enlarge it in a new window. |
 |
| Top |
| TissGeneClin for BOLL |
| TissGeneDrug for BOLL |
| Drug information targeting TissGene (DrugBank Version 5.0.6, 2017-04-01) |
| DrugBank ID | Drug name | Drug activity | Drug type | Drug status |
| Top |
| TissGeneDisease for BOLL |
| Disease information associated with TissGene (DisGeNet, 2016-06-01) |
| Disease ID | Disease name | # pubmeds | Source |
| umls:C0021364 | Male infertility | 3 | BeFree |
| umls:C0004509 | Azoospermia | 2 | BeFree |
| umls:C0028960 | Oligospermia | 2 | BeFree |
| umls:C0001418 | Adenocarcinoma | 1 | BeFree |
| umls:C0007766 | Intracranial Aneurysm | 1 | GAD,GWASCAT |
| umls:C0009404 | Colorectal Neoplasms | 1 | CTD_human |
| umls:C0027126 | Myotonic Dystrophy | 1 | BeFree |
| umls:C0151721 | Testicular hypogonadism | 1 | BeFree |
| umls:C0410226 | Congenital Myotonic Dystrophy | 1 | BeFree |
|
Copyright 2016-Present - The University of Texas Health Science Center at Houston (UTHealth) Web File Viewing | How to Report, Fraud, Waste and Abuse | State of Texas | Statewide Search | Texas Homeland Security | Site Policies |