 |
| |
| |
| |
| |
| |
| |
|

| TissGeneSummary for SNCB |
 Gene summary Gene summary |
| Basic gene information | Gene symbol | SNCB |
| Gene name | synuclein, beta | |
| Synonyms | - | |
| Cytomap | UCSC genome browser: 5q35 | |
| Type of gene | protein-coding | |
| RefGenes | NM_001001502.1, NM_003085.3, | |
| Description | beta-synuclein | |
| Modification date | 20141207 | |
| dbXrefs | MIM : 602569 | |
| HGNC : HGNC | ||
| Ensembl : ENSG00000074317 | ||
| HPRD : 03980 | ||
| Vega : OTTHUMG00000130661 | ||
| Protein | UniProt: go to UniProt's Cross Reference DB Table | |
| Expression | CleanEX: HS_SNCB | |
| BioGPS: 6620 | ||
| Pathway | NCI Pathway Interaction Database: SNCB | |
| KEGG: SNCB | ||
| REACTOME: SNCB | ||
| Pathway Commons: SNCB | ||
| Context | iHOP: SNCB | |
| ligand binding site mutation search in PubMed: SNCB | ||
| UCL Cancer Institute: SNCB | ||
| Assigned class in TissGDB* | C | |
| Included tissue-specific gene expression resources | HPA,TiGER | |
| Specific-tissues in normal samples (assigned by TissGDB using HPA, TiGER, and GTEx) | BrainEye | |
| Cancer types related to the specific-tissues in cancer samples (assigned by TissGDB using TCGA) | GBM,LGGUVM | |
| Reference showing the relevant tissue of SNCB | ||
| Description by TissGene annotations | ||
| * Class A consists of genes with literature evidence and is part of the cTissGenes. Class B consists of only cTissGenes without additional evidence. The remaining genes belong to Class C. |
| Gene ontology having evidence of Inferred from Direct Assay (IDA) from Entrez |
| GO ID | GO term | PubMed ID |
| Top |
| TissGeneExp for SNCB |
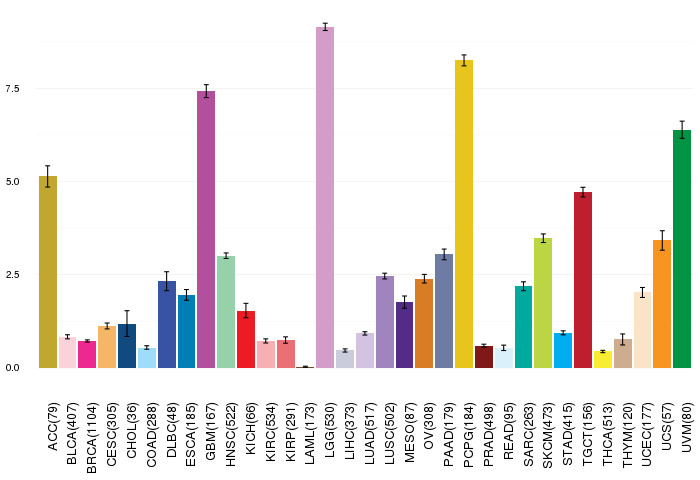
| Gene expressions across 28 cancer types (X-axis: cancer type and Y-axis: log2(norm_counts+1)) (TCGA IlluminaHiSeq_RNASeqV2, pan-cancer normalized log2(norm_counts+1) data, version 2016-08-16) |
 |
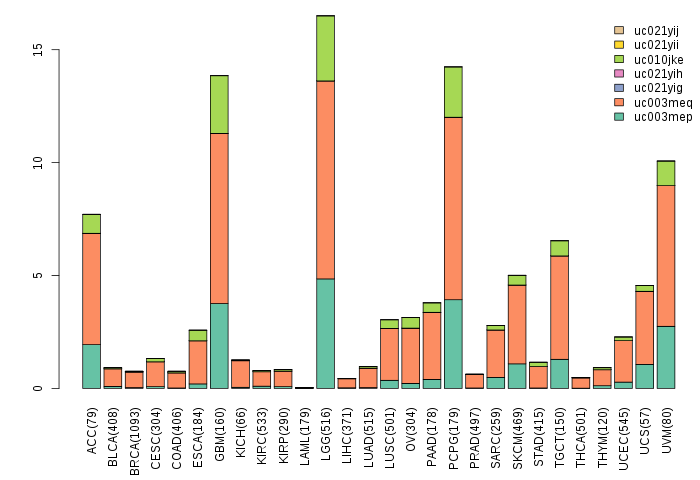
| Gene isoform expressions across 28 cancer types (X-axis: cancer type and Y-axis: log2(norm_counts+1)) (TCGA pan-cancer tcga_rsem_isoform_tpm, version 2016-09-01) |
 |
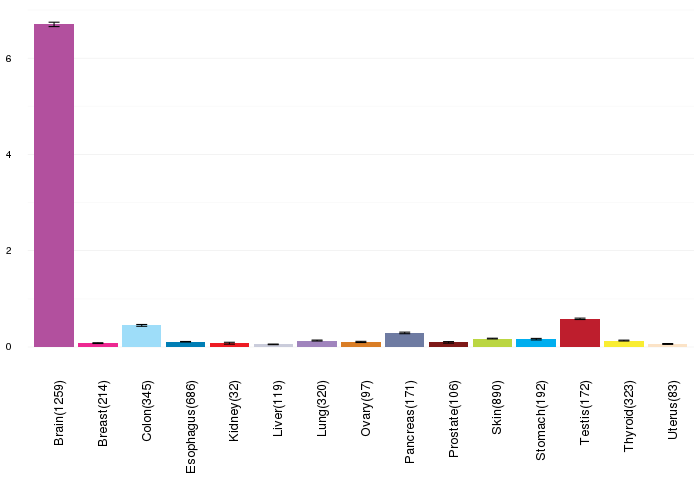
| Gene expressions across normal tissues of GTEx data (GTEx GTEx_Analysis_v6_RNA-seq_RNA-SeQCv1.1.8_gene_rpkm.gct) - Here, we shows the matched tissue types only among our 28 cancer types. |
 |
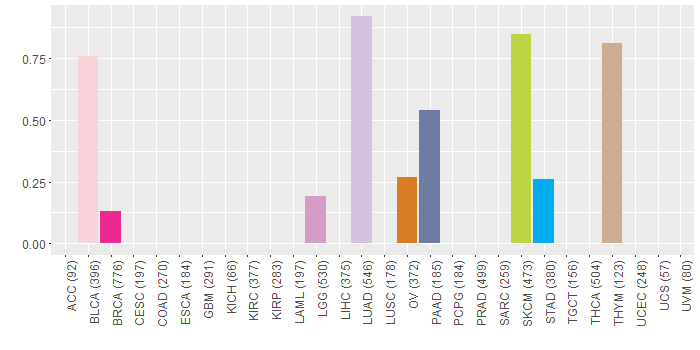
| Different expressions across 14 cancer types with more than 10 samples between matched tumors and normals (X-axis: cancer type and Y-axis: log2(norm_counts+1)) (TCGA IlluminaHiSeq_RNASeqV2, pan-cancer normalized log2(norm_counts+1) data, version 2016-08-16) |
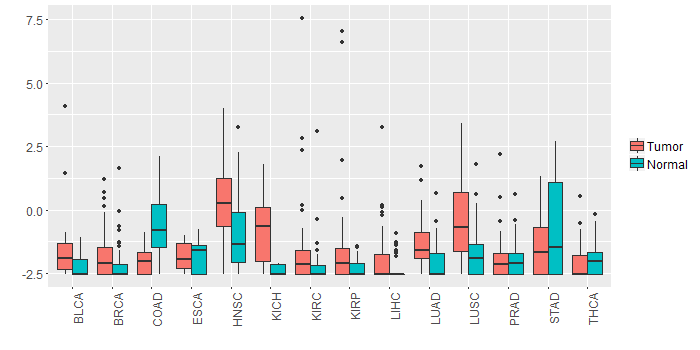 |
| - Significantly differentially expressed cancer types and information. (|Fold change|>1 and FDR<0.05) |
| Cancer type | Mean(exp) in tumor | Mean(exp) in matched normal | Log2FC | P-val. | FDR |
| LUSC | -0.34766942 | -1.736381185 | 1.388711765 | 2.09E-07 | 5.67E-07 |
| KICH | -0.712648165 | -2.408684165 | 1.696036 | 3.04E-06 | 1.05E-05 |
| KIRP | -1.26162279 | -2.28904154 | 1.02741875 | 0.0205 | 0.041481047 |
| HNSC | 0.344581788 | -0.970515886 | 1.315097674 | 9.19E-05 | 0.000416885 |
| COAD | -1.96439755 | -0.657509089 | -1.306888462 | 3.66E-05 | 0.000147681 |
| Top |
| TissGene-miRNA for SNCB |
| Significantly anti-correlated miRNAs of TissGene across 28 cancer types (Gene-miRNA relations from TargetScanHuman Relsease 7.1, Conserved_Site_Context_Scores.txt.zip, 06.01.2016) (TCGA IlluminaHiSeq_miRNASeq, log2(RPM+1) data, version 2016-11-21) (TCGA IlluminaHiSeq_RNASeqV2, log2(normalized_count+1) data, version 2016-08-16) (Spearman’s Rank Correlation (p-value<0.05 and coefficient<-0.25)) |
| Cancer type | miRNA id | miRNA accession | P-val. | Coeff. | # samples |
| Top |
| TissGeneMut for SNCB |
| TissGeneSNV for SNCB |
| nsSNV counts per each loci. Different colors of circles represent different cancer types. Circle size denotes number of samples. (TCGA somatic mutation (SNPs and small INDELs) data, version 2016-04-25) * Click on the image to enlarge it in a new window. |
 |
 |
| Somatic nucleotide variants of TissGene across 28 cancer types (X-axis: cancer type and Y-axis: % of mutated samples) The numbers in parentheses are numbers of samples with mutation (nsSNVs). (TCGA somatic mutation (SNPs and small INDELs) data, version 2016-04-25) |
 |
| - nsSNVs sorted by frequency. |
| AAchange | Cancer type | # samples |
| p.E61K | SKCM | 2 |
| p.A18D | LUAD | 1 |
| p.A19V | LGG | 1 |
| p.V48L | LUAD | 1 |
| p.E125K | BLCA | 1 |
| p.E46K | BLCA | 1 |
| p.R45Q | BLCA | 1 |
| p.E104K | BRCA | 1 |
| p.G25V | LUAD | 1 |
| p.V49L | OV | 1 |
| p.G67E | BLCA | 1 |
| p.T59N | LUAD | 1 |
| p.E35K | SKCM | 1 |
| p.A30T | SKCM | 1 |
| p.A69V | PAAD | 1 |
| p.V37A | HNSC | 1 |
| p.G25E | STAD | 1 |
| p.G14D | THYM | 1 |
| p.A63D | LUAD | 1 |
| Top |
| TissGeneCNV for SNCB |
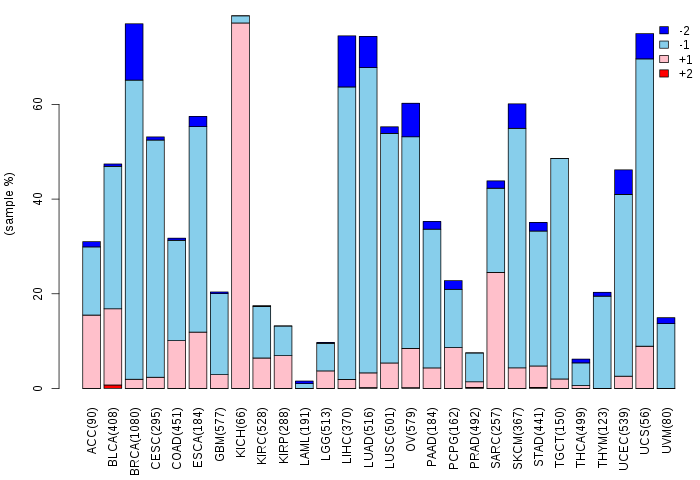
| Copy number variations of TissGene across 28 cancer types (X-axis: cancer type and Y-axis: % of CNV samples) (TCGA Gistic2_CopyNumber_Gistic2_all_data_by_genes, Gistic2 copy number data, version 2016-08-16) |
 |
| Top |
| TissGeneFusions for SNCB |
| Fusion genes including TissGene (ChimerDB 3.0, 2016-12-01 and TCGA fusion Portal 2015-12-01) |
| Database | Src | Cancer type | Sample | Fusion gene | ORF | 5'-gene BP | 3'-gene BP |
| Chimerdb3.0 | ChiTaRs | NA | BM702669 | ATP1B2-SNCB | chr17:7560616 | chr5:176047692 |
| Top |
| TissGeneNet for SNCB |
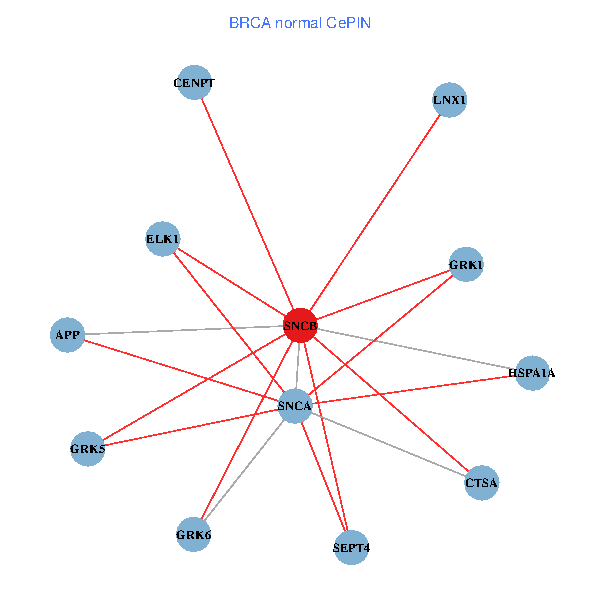
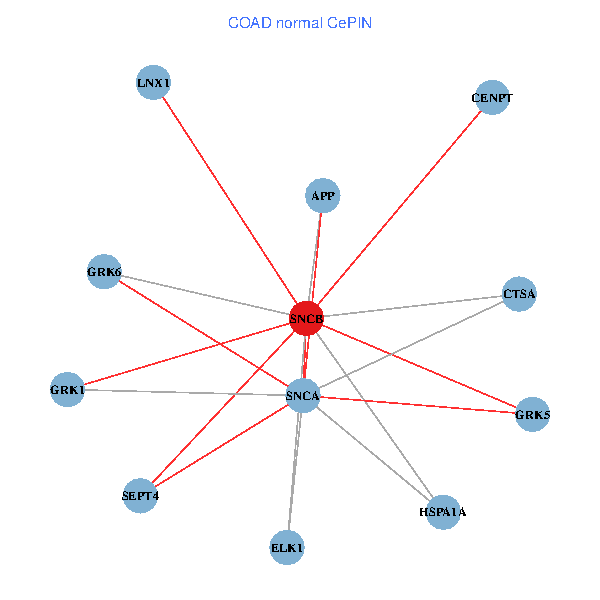
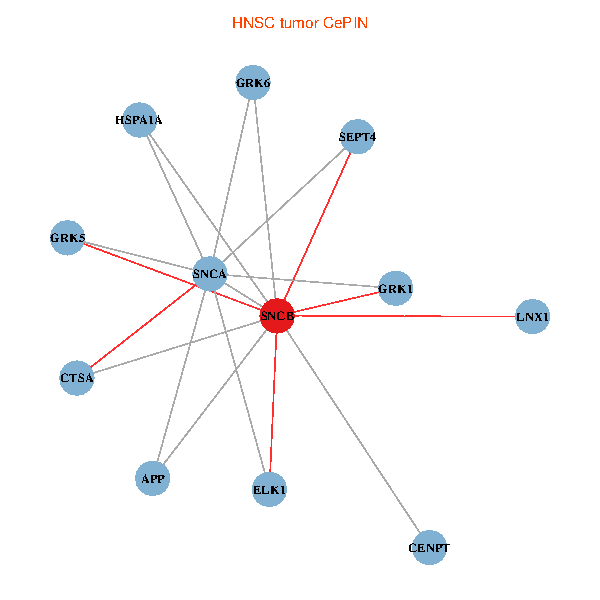
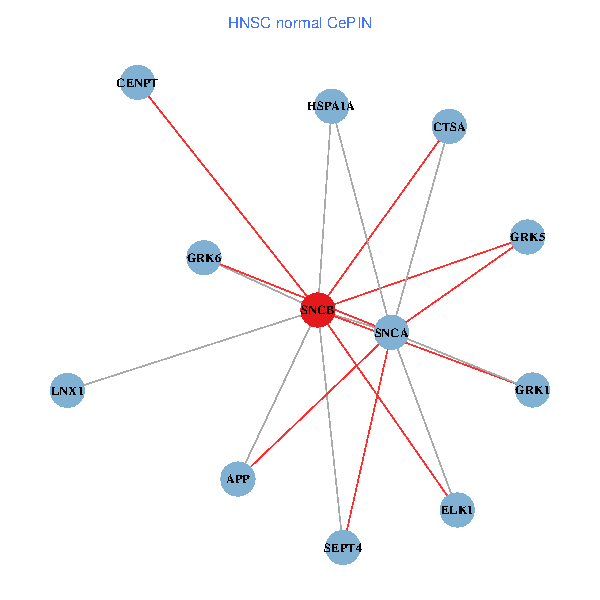
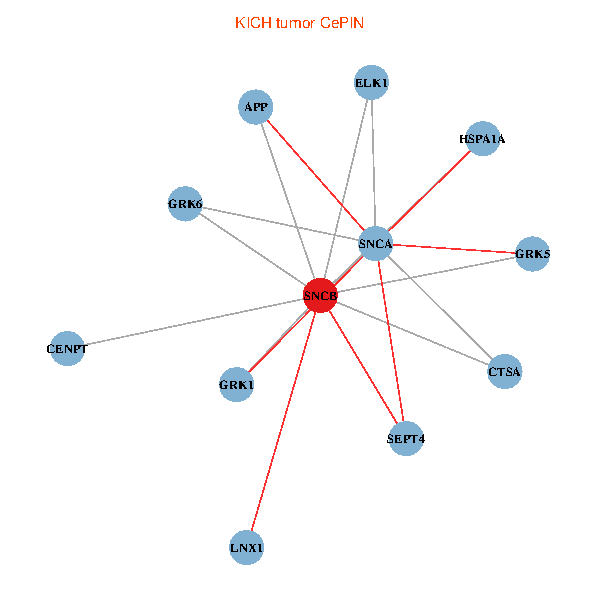
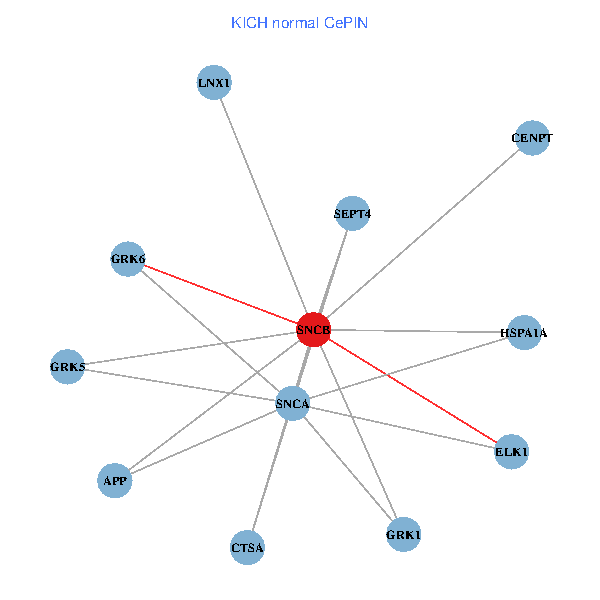
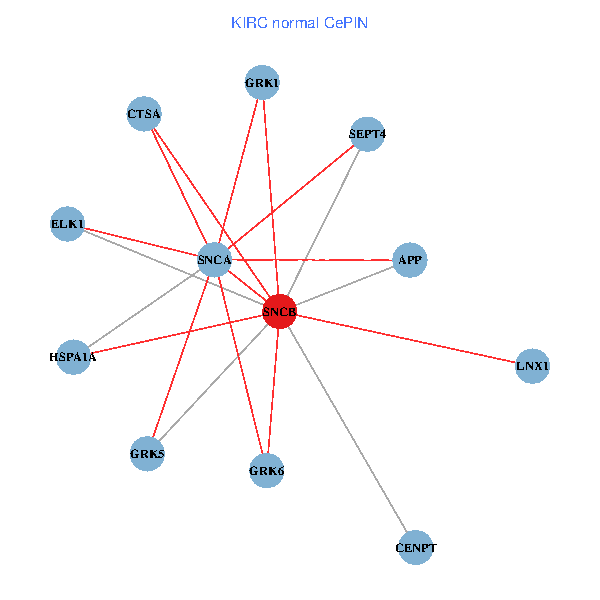
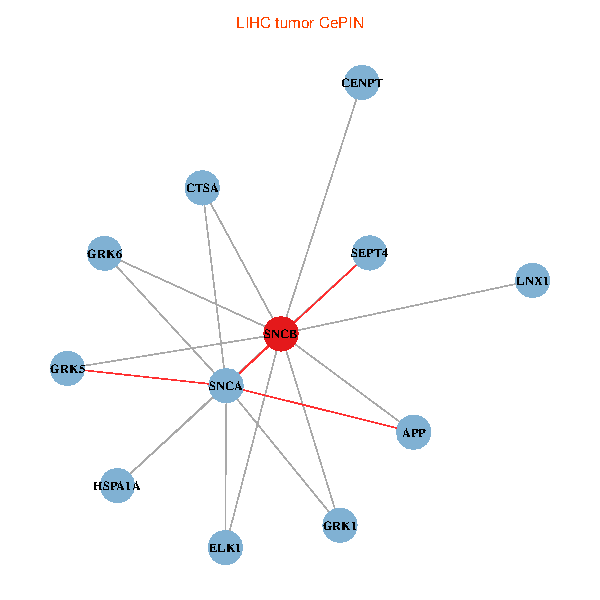
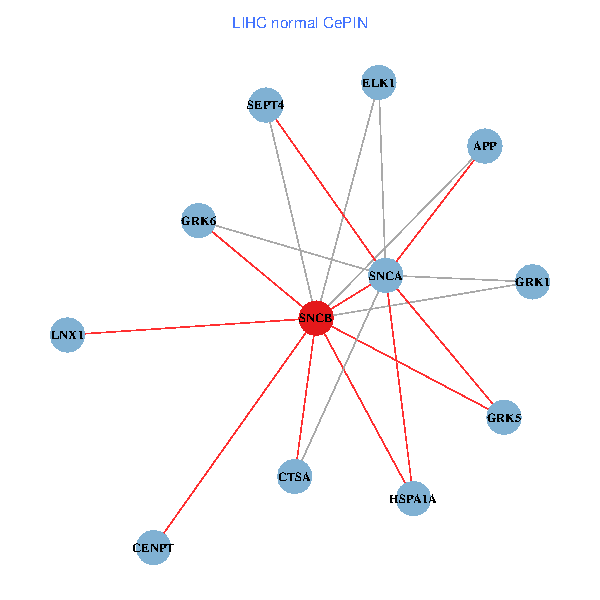
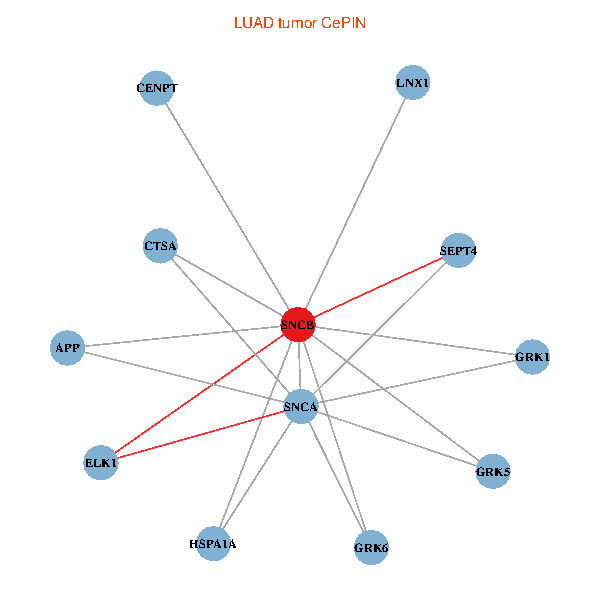
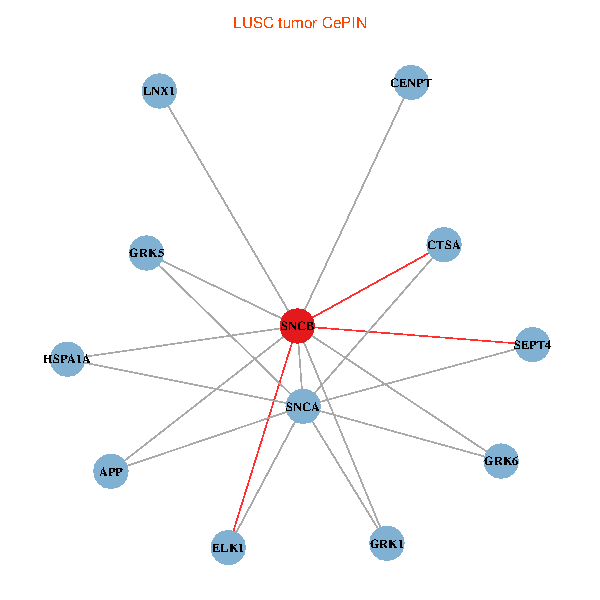
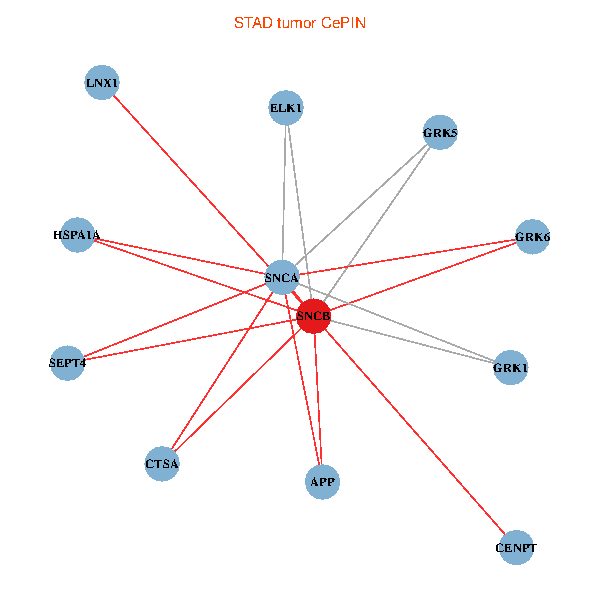
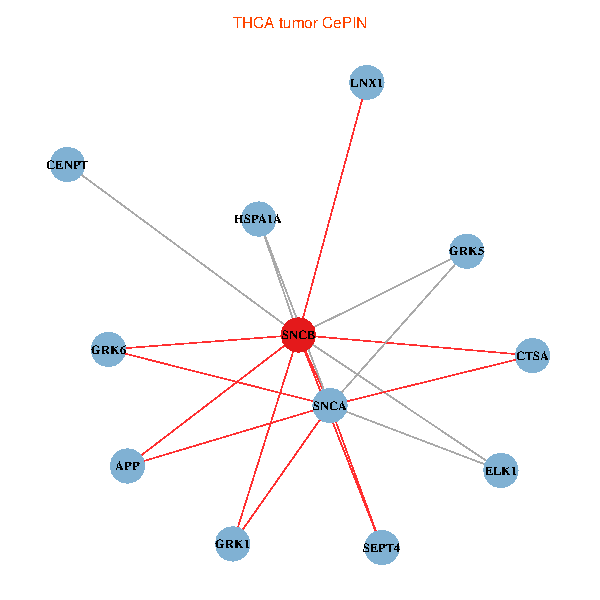
| Co-expressed gene networks based on protein-protein interaction data (CePIN) (TCGA IlluminaHiSeq_RNASeqV2, pan-cancer normalized log2(norm_counts+1) data, version 2016-08-16) (PINA2 ppi data) |
| BRCA (tumor) | BRCA (normal) |
| SNCB, GRK6, APP, HSPA1A, SNCA, ELK1, LNX1, CTSA, GRK1, GRK5, CENPT, SEPT4 (tumor) | SNCB, GRK6, APP, HSPA1A, SNCA, ELK1, LNX1, CTSA, GRK1, GRK5, CENPT, SEPT4 (normal) |
 |  |
| COAD (tumor) | COAD (normal) |
| SNCB, GRK6, APP, HSPA1A, SNCA, ELK1, LNX1, CTSA, GRK1, GRK5, CENPT, SEPT4 (tumor) | SNCB, GRK6, APP, HSPA1A, SNCA, ELK1, LNX1, CTSA, GRK1, GRK5, CENPT, SEPT4 (normal) |
 |  |
| HNSC (tumor) | HNSC (normal) |
| SNCB, GRK6, APP, HSPA1A, SNCA, ELK1, LNX1, CTSA, GRK1, GRK5, CENPT, SEPT4 (tumor) | SNCB, GRK6, APP, HSPA1A, SNCA, ELK1, LNX1, CTSA, GRK1, GRK5, CENPT, SEPT4 (normal) |
 |  |
| KICH (tumor) | KICH (normal) |
| SNCB, GRK6, APP, HSPA1A, SNCA, ELK1, LNX1, CTSA, GRK1, GRK5, CENPT, SEPT4 (tumor) | SNCB, GRK6, APP, HSPA1A, SNCA, ELK1, LNX1, CTSA, GRK1, GRK5, CENPT, SEPT4 (normal) |
 |  |
| KIRC (tumor) | KIRC (normal) |
| SNCB, GRK6, APP, HSPA1A, SNCA, ELK1, LNX1, CTSA, GRK1, GRK5, CENPT, SEPT4 (tumor) | SNCB, GRK6, APP, HSPA1A, SNCA, ELK1, LNX1, CTSA, GRK1, GRK5, CENPT, SEPT4 (normal) |
 |  |
| KIRP (tumor) | KIRP (normal) |
| SNCB, GRK6, APP, HSPA1A, SNCA, ELK1, LNX1, CTSA, GRK1, GRK5, CENPT, SEPT4 (tumor) | SNCB, GRK6, APP, HSPA1A, SNCA, ELK1, LNX1, CTSA, GRK1, GRK5, CENPT, SEPT4 (normal) |
 |  |
| LIHC (tumor) | LIHC (normal) |
| SNCB, GRK6, APP, HSPA1A, SNCA, ELK1, LNX1, CTSA, GRK1, GRK5, CENPT, SEPT4 (tumor) | SNCB, GRK6, APP, HSPA1A, SNCA, ELK1, LNX1, CTSA, GRK1, GRK5, CENPT, SEPT4 (normal) |
 |  |
| LUAD (tumor) | LUAD (normal) |
| SNCB, GRK6, APP, HSPA1A, SNCA, ELK1, LNX1, CTSA, GRK1, GRK5, CENPT, SEPT4 (tumor) | SNCB, GRK6, APP, HSPA1A, SNCA, ELK1, LNX1, CTSA, GRK1, GRK5, CENPT, SEPT4 (normal) |
 |  |
| LUSC (tumor) | LUSC (normal) |
| SNCB, GRK6, APP, HSPA1A, SNCA, ELK1, LNX1, CTSA, GRK1, GRK5, CENPT, SEPT4 (tumor) | SNCB, GRK6, APP, HSPA1A, SNCA, ELK1, LNX1, CTSA, GRK1, GRK5, CENPT, SEPT4 (normal) |
 |  |
| PRAD (tumor) | PRAD (normal) |
| SNCB, GRK6, APP, HSPA1A, SNCA, ELK1, LNX1, CTSA, GRK1, GRK5, CENPT, SEPT4 (tumor) | SNCB, GRK6, APP, HSPA1A, SNCA, ELK1, LNX1, CTSA, GRK1, GRK5, CENPT, SEPT4 (normal) |
 |  |
| STAD (tumor) | STAD (normal) |
| SNCB, GRK6, APP, HSPA1A, SNCA, ELK1, LNX1, CTSA, GRK1, GRK5, CENPT, SEPT4 (tumor) | SNCB, GRK6, APP, HSPA1A, SNCA, ELK1, LNX1, CTSA, GRK1, GRK5, CENPT, SEPT4 (normal) |
 |  |
| THCA (tumor) | THCA (normal) |
| SNCB, GRK6, APP, HSPA1A, SNCA, ELK1, LNX1, CTSA, GRK1, GRK5, CENPT, SEPT4 (tumor) | SNCB, GRK6, APP, HSPA1A, SNCA, ELK1, LNX1, CTSA, GRK1, GRK5, CENPT, SEPT4 (normal) |
 |  |
| Top |
| TissGeneProg for SNCB |
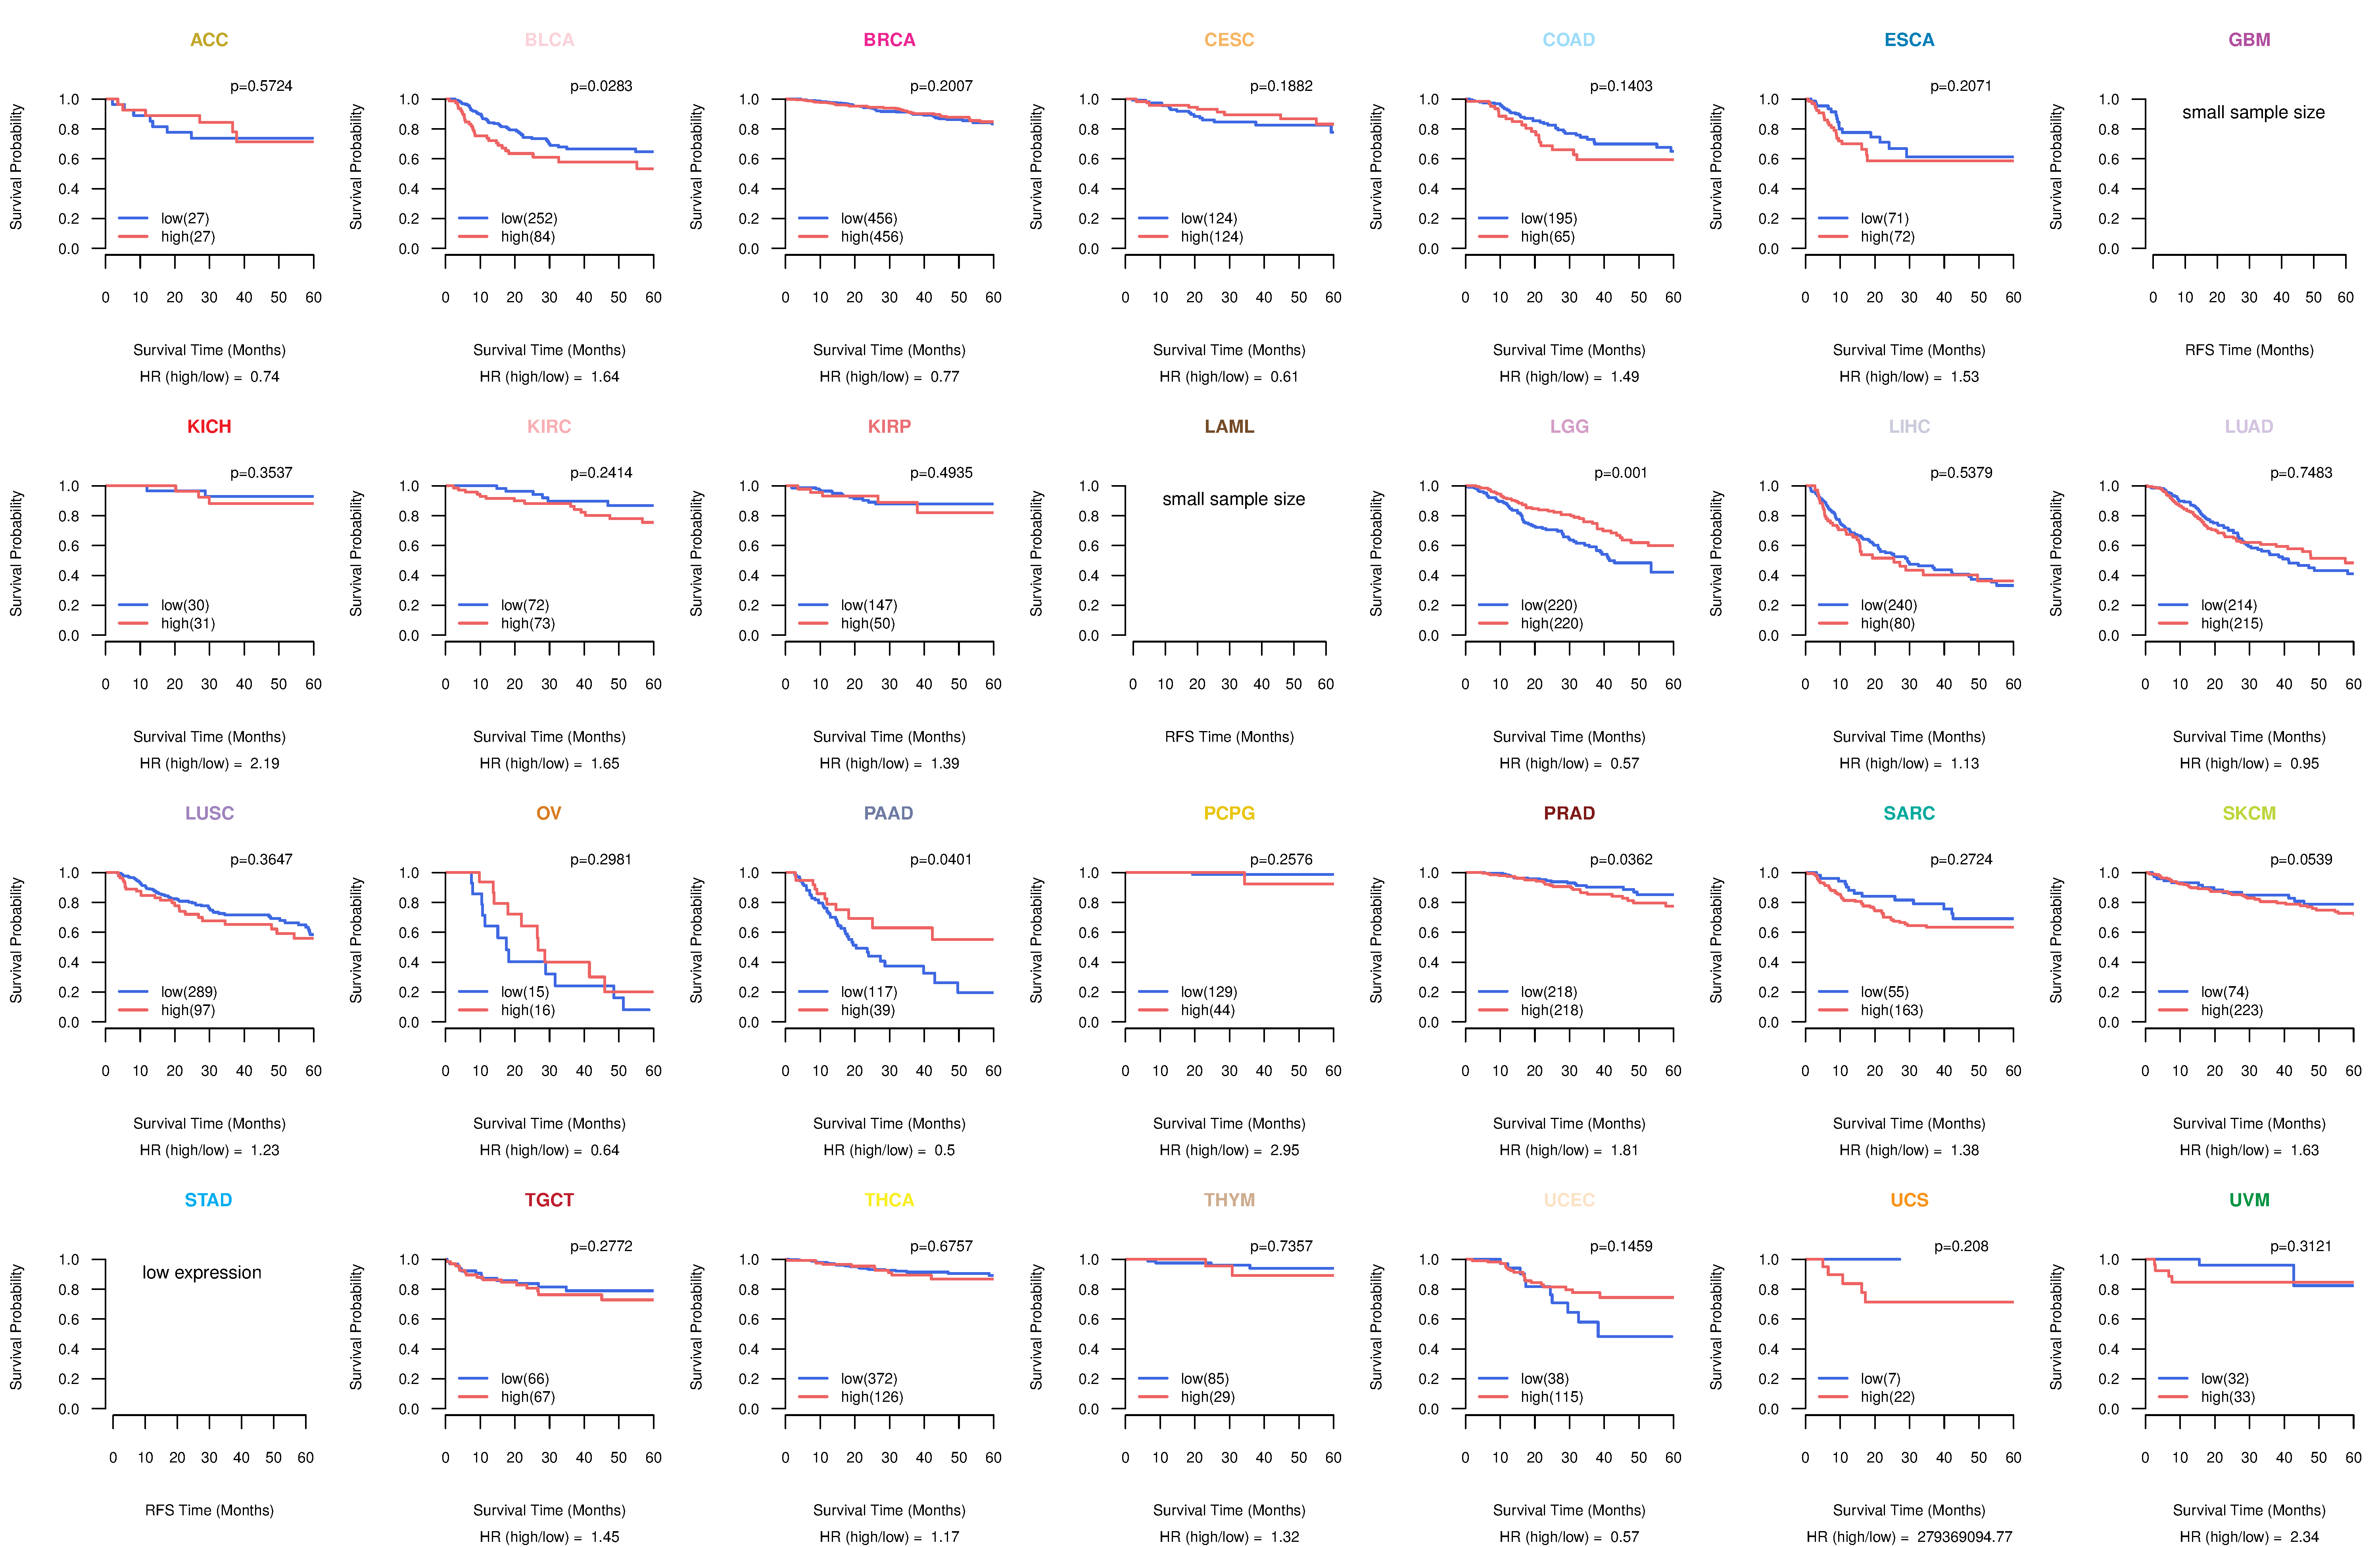
| Kaplan-Meier plots with logrank tests of overall survival (OS) using 28 cancer types (TCGA IlluminaHiSeq_RNASeqV2, pan-cancer normalized log2(norm_counts+1) data, version 2016-08-16) (TCGA clinicalMatrix, phenotype data, version 2016-04-27) * Click on the image to enlarge it in a new window. |
 |
| Kaplan-Meier plots with logrank test of relapse free survival (RFS) using 28 cancer types (TCGA IlluminaHiSeq_RNASeqV2, pan-cancer normalized log2(norm_counts+1) data, version 2016-08-16) (TCGA clinicalMatrix, phenotype data, version 2016-04-27) * Click on the image enlarge it in a new window. |
 |
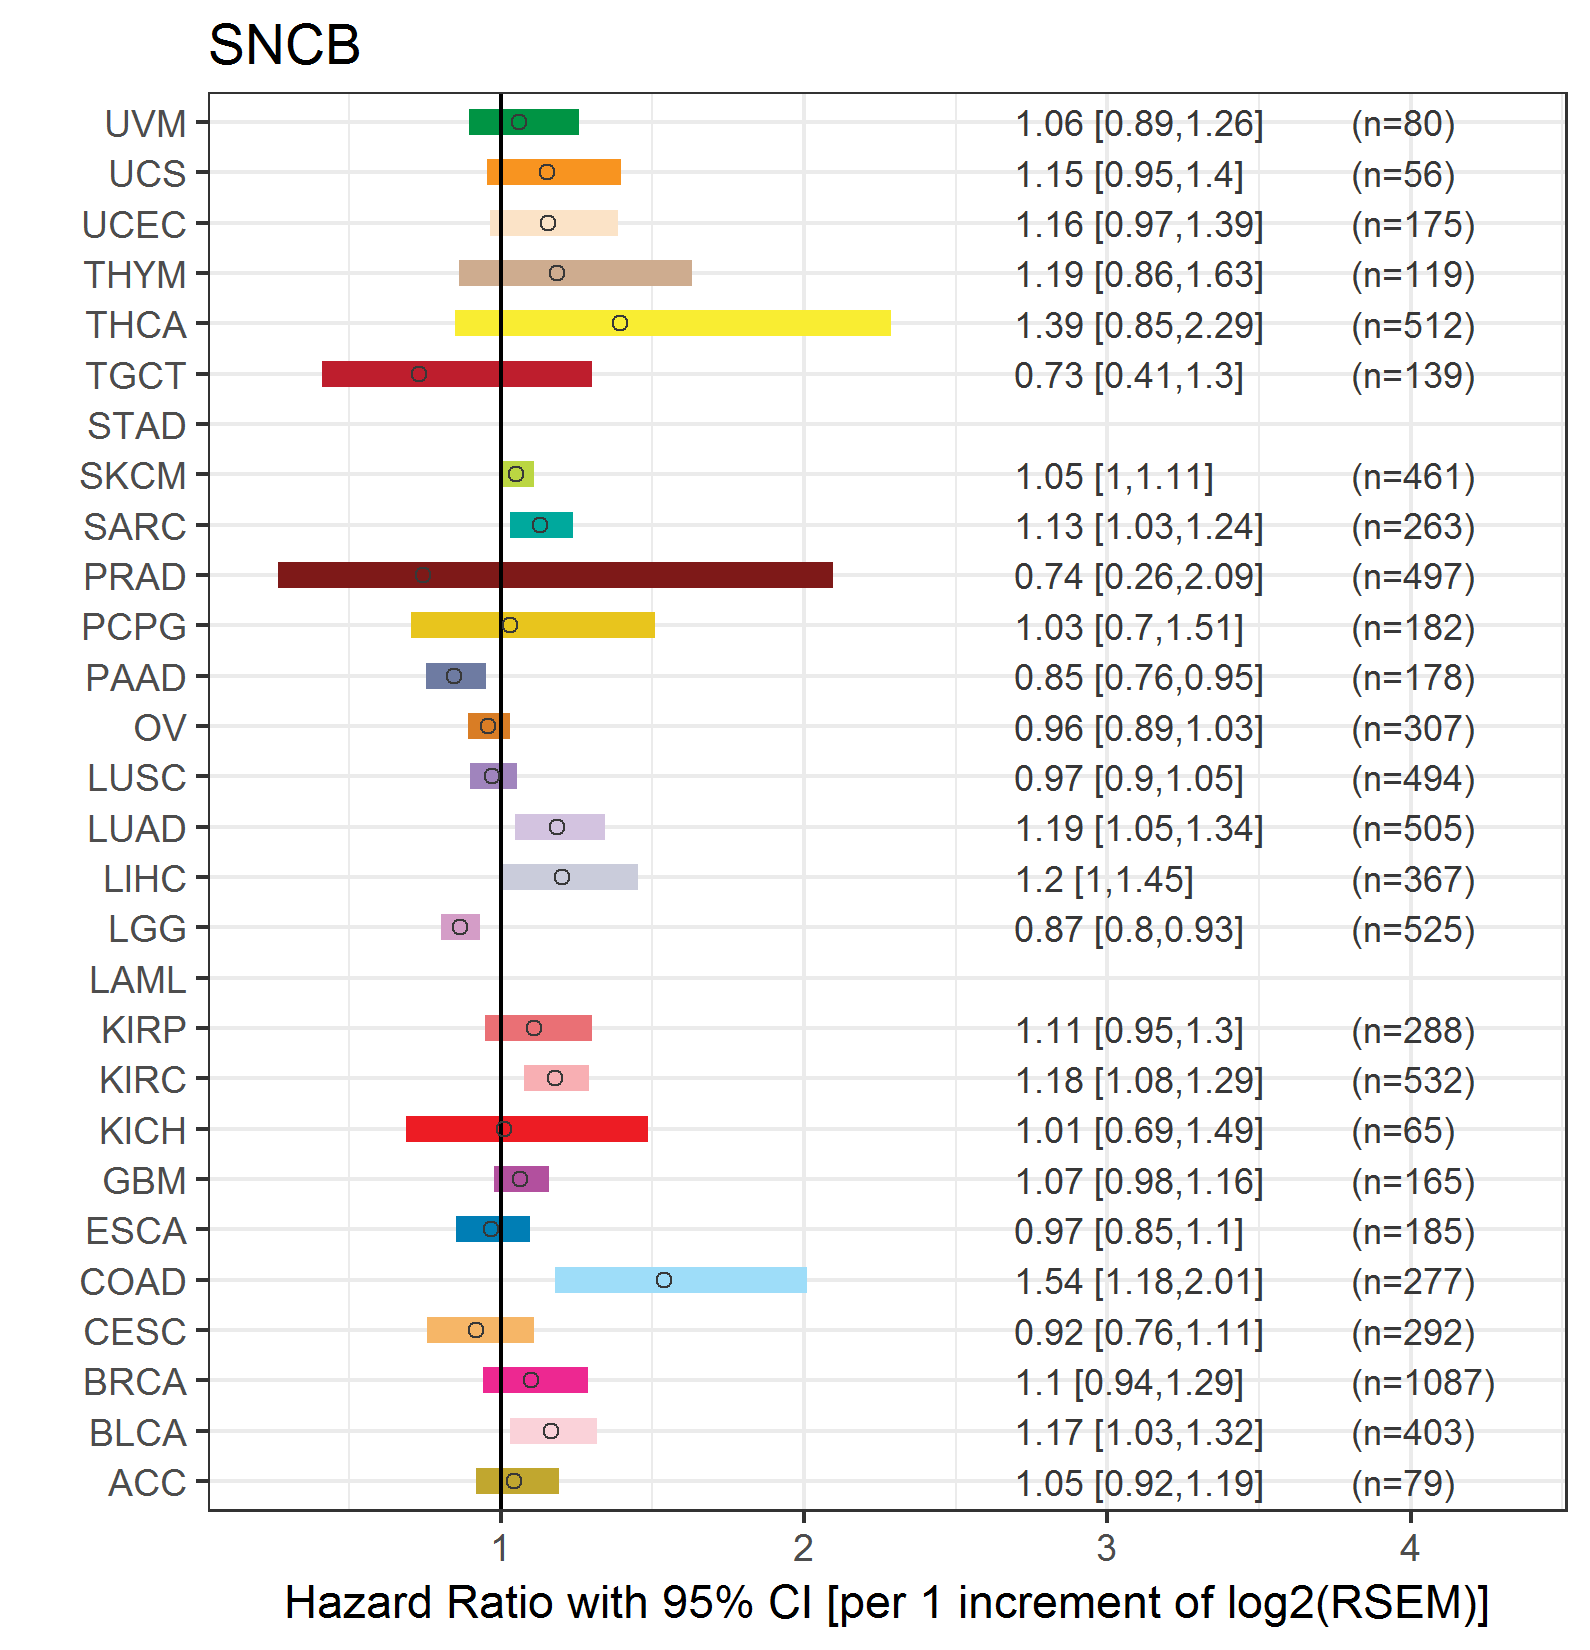
| Forest plot of Cox proportional hazard ratio (HR) and 95% CI of overall survival (OS) using 28 cancer types (TCGA IlluminaHiSeq_RNASeqV2, pan-cancer normalized log2(norm_counts+1) data, version 2016-08-16) (TCGA clinicalMatrix, phenotype data, version 2016-04-27) * Click on the image enlarge it in a new window. |
 |
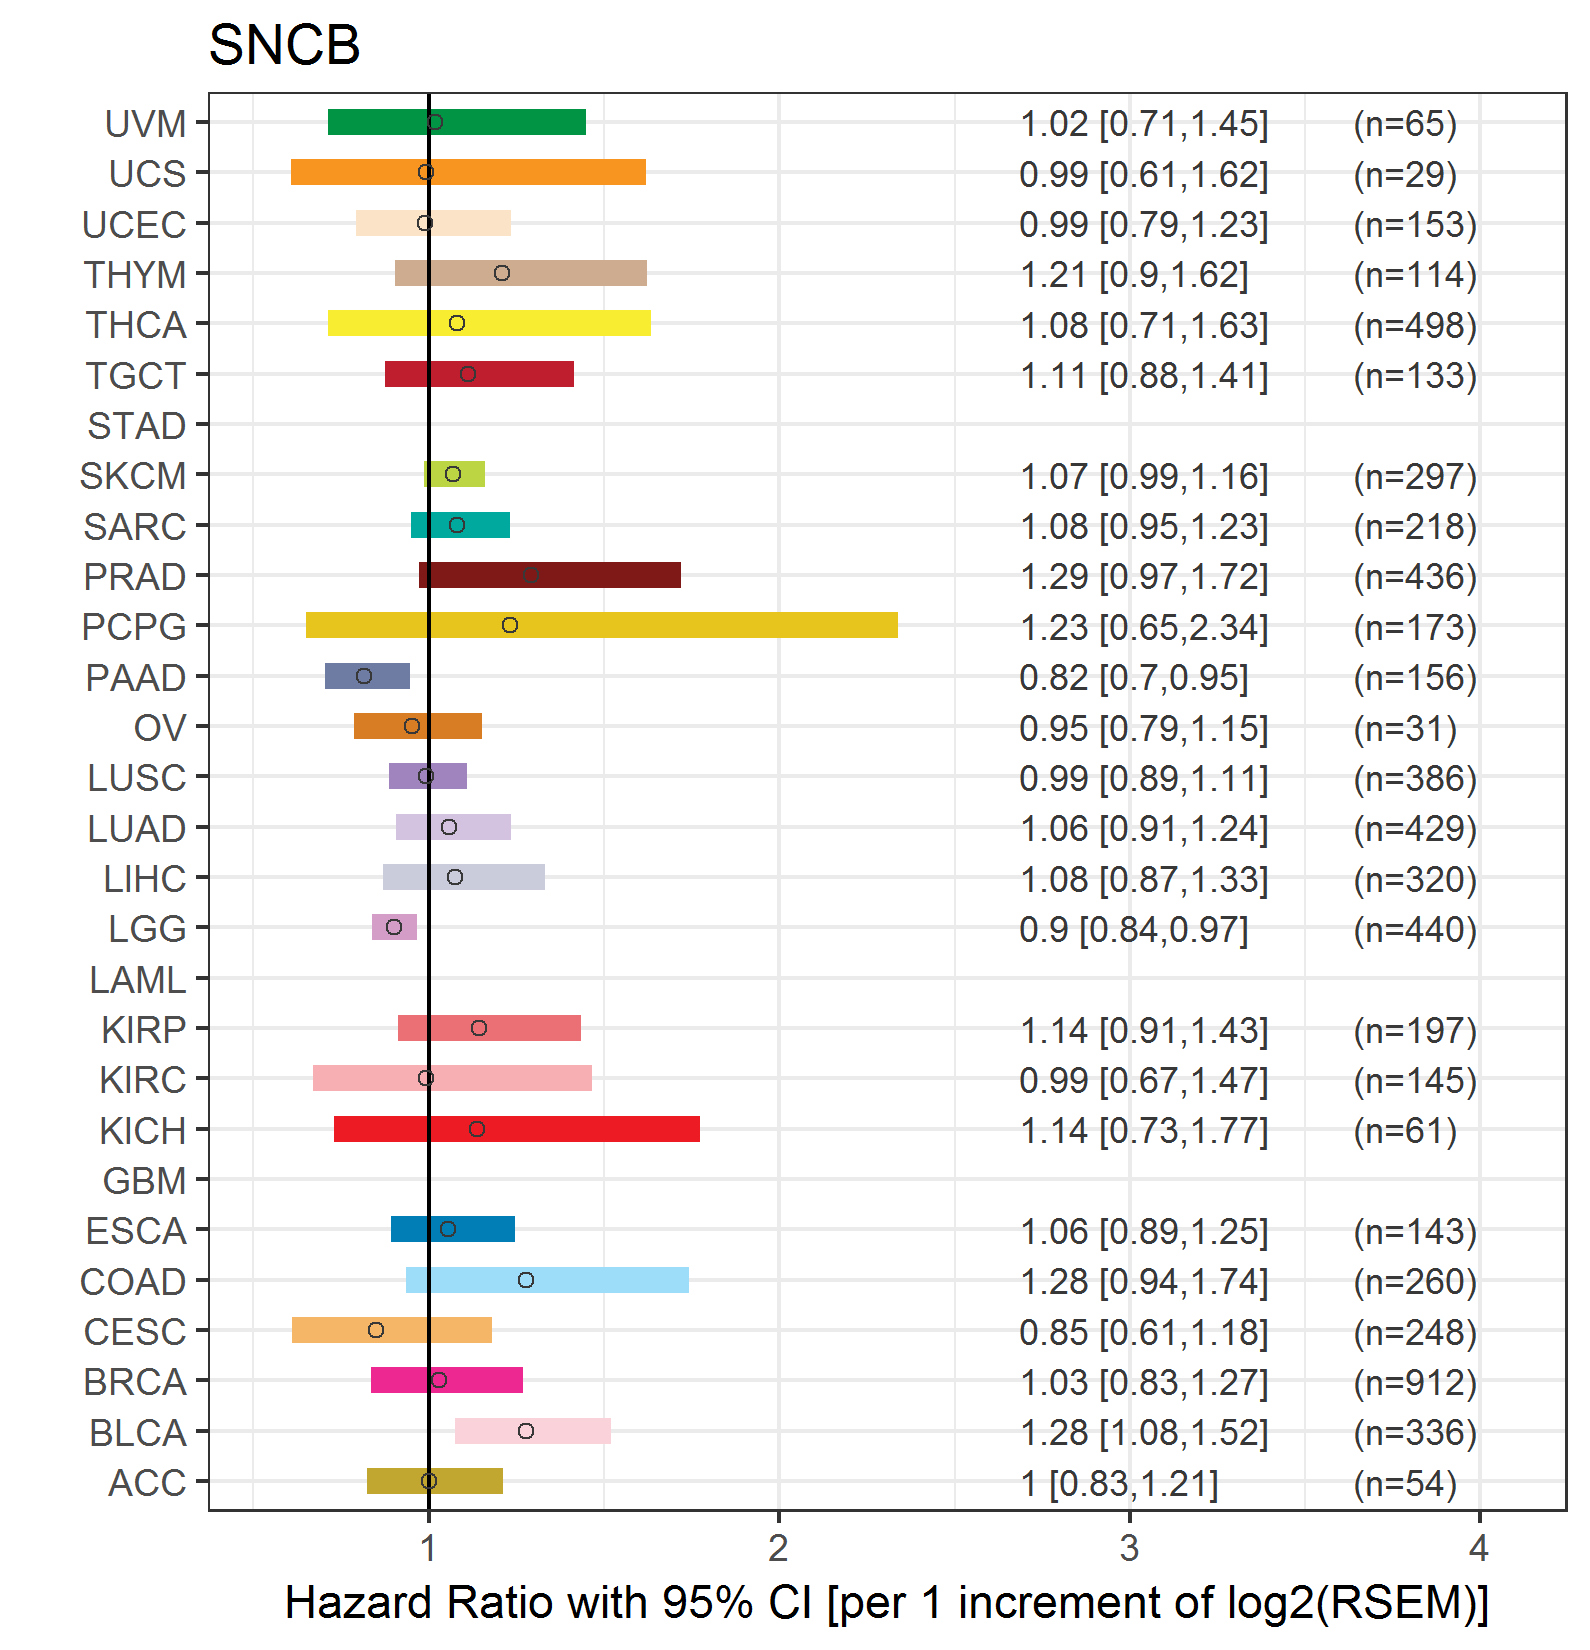
| Forest plot of Cox proportional hazard ratio (HR) and 95% CI of relapse free survival (RFS) using 28 cancer types (TCGA IlluminaHiSeq_RNASeqV2, pan-cancer normalized log2(norm_counts+1) data, version 2016-08-16) (TCGA clinicalMatrix, phenotype data, version 2016-04-27) * Click on the image enlarge it in a new window. |
 |
| Top |
| TissGeneClin for SNCB |
| TissGeneDrug for SNCB |
| Drug information targeting TissGene (DrugBank Version 5.0.6, 2017-04-01) |
| DrugBank ID | Drug name | Drug activity | Drug type | Drug status |
| Top |
| TissGeneDisease for SNCB |
| Disease information associated with TissGene (DisGeNet, 2016-06-01) |
| Disease ID | Disease name | # pubmeds | Source |
| umls:C0752347 | Lewy Body Disease | 8 | BeFree,CLINVAR,CTD_human |
| umls:C0524851 | Neurodegenerative Disorders | 6 | BeFree |
| umls:C0030567 | Parkinson Disease | 4 | BeFree,GAD,LHGDN |
| umls:C0011265 | Presenile dementia | 3 | BeFree |
| umls:C0497327 | Dementia | 3 | BeFree |
| umls:C0014072 | Experimental Autoimmune Encephalomyelitis | 2 | BeFree,RGD |
| umls:C0025149 | Medulloblastoma | 1 | LHGDN |
| umls:C0027819 | Neuroblastoma | 1 | BeFree |
| umls:C0028945 | oligodendroglioma | 1 | BeFree |
| umls:C0036161 | Sandhoff Disease | 1 | BeFree,LHGDN |
| umls:C0042164 | Uveitis | 1 | RGD |
| umls:C0334590 | Anaplastic Oligodendroglioma | 1 | BeFree |
| umls:C0700095 | Central neuroblastoma | 1 | BeFree |
| umls:C0751396 | Well Differentiated Oligodendroglioma | 1 | BeFree |
| umls:C1176475 | Ductal Carcinoma | 1 | BeFree |
|
Copyright 2016-Present - The University of Texas Health Science Center at Houston (UTHealth) Web File Viewing | How to Report, Fraud, Waste and Abuse | State of Texas | Statewide Search | Texas Homeland Security | Site Policies |