 |
| |
| |
| |
| |
| |
| |
|

| TissGeneSummary for SSTR1 |
 Gene summary Gene summary |
| Basic gene information | Gene symbol | SSTR1 |
| Gene name | somatostatin receptor 1 | |
| Synonyms | SRIF-2|SS-1-R|SS1-R|SS1R | |
| Cytomap | UCSC genome browser: 14q13 | |
| Type of gene | protein-coding | |
| RefGenes | NM_001049.2, | |
| Description | somatostatin receptor type 1 | |
| Modification date | 20141222 | |
| dbXrefs | MIM : 182451 | |
| HGNC : HGNC | ||
| Ensembl : ENSG00000139874 | ||
| HPRD : 01673 | ||
| Vega : OTTHUMG00000140249 | ||
| Protein | UniProt: go to UniProt's Cross Reference DB Table | |
| Expression | CleanEX: HS_SSTR1 | |
| BioGPS: 6751 | ||
| Pathway | NCI Pathway Interaction Database: SSTR1 | |
| KEGG: SSTR1 | ||
| REACTOME: SSTR1 | ||
| Pathway Commons: SSTR1 | ||
| Context | iHOP: SSTR1 | |
| ligand binding site mutation search in PubMed: SSTR1 | ||
| UCL Cancer Institute: SSTR1 | ||
| Assigned class in TissGDB* | C | |
| Included tissue-specific gene expression resources | TiGER,GTEx | |
| Specific-tissues in normal samples (assigned by TissGDB using HPA, TiGER, and GTEx) | CervixStomach | |
| Cancer types related to the specific-tissues in cancer samples (assigned by TissGDB using TCGA) | CESCSTAD | |
| Reference showing the relevant tissue of SSTR1 | ||
| Description by TissGene annotations | ||
| * Class A consists of genes with literature evidence and is part of the cTissGenes. Class B consists of only cTissGenes without additional evidence. The remaining genes belong to Class C. |
| Gene ontology having evidence of Inferred from Direct Assay (IDA) from Entrez |
| GO ID | GO term | PubMed ID |
| Top |
| TissGeneExp for SSTR1 |
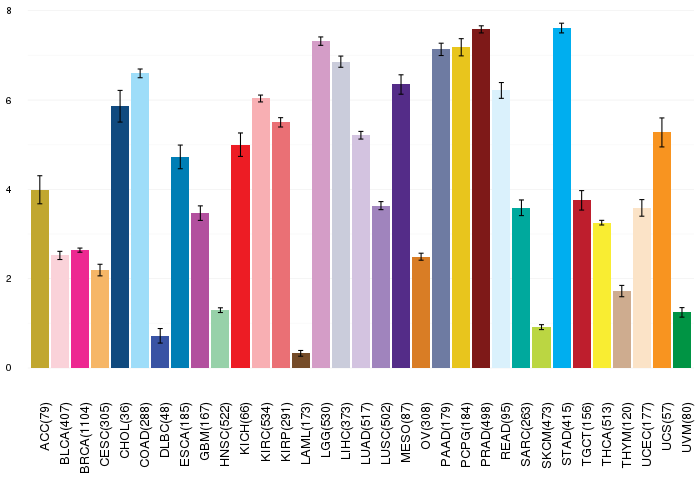
| Gene expressions across 28 cancer types (X-axis: cancer type and Y-axis: log2(norm_counts+1)) (TCGA IlluminaHiSeq_RNASeqV2, pan-cancer normalized log2(norm_counts+1) data, version 2016-08-16) |
 |
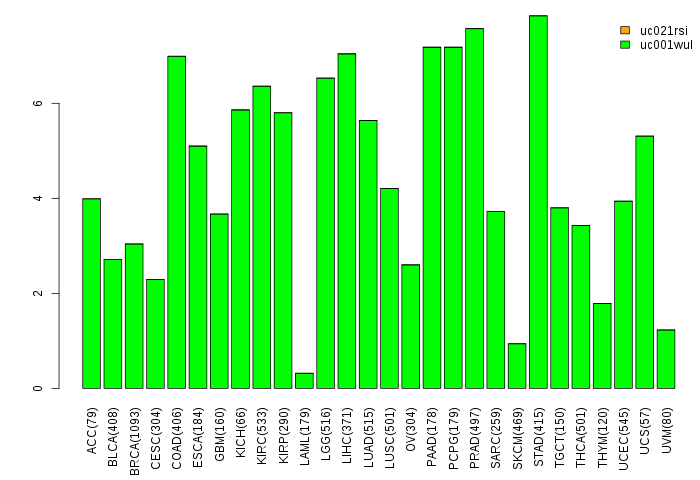
| Gene isoform expressions across 28 cancer types (X-axis: cancer type and Y-axis: log2(norm_counts+1)) (TCGA pan-cancer tcga_rsem_isoform_tpm, version 2016-09-01) |
 |
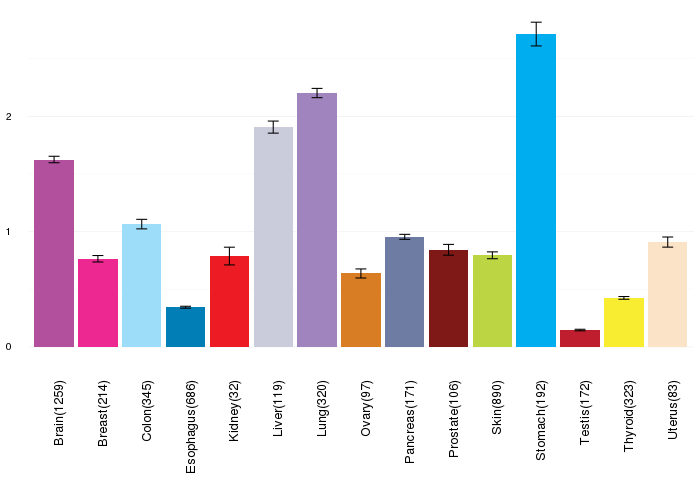
| Gene expressions across normal tissues of GTEx data (GTEx GTEx_Analysis_v6_RNA-seq_RNA-SeQCv1.1.8_gene_rpkm.gct) - Here, we shows the matched tissue types only among our 28 cancer types. |
 |
| Different expressions across 14 cancer types with more than 10 samples between matched tumors and normals (X-axis: cancer type and Y-axis: log2(norm_counts+1)) (TCGA IlluminaHiSeq_RNASeqV2, pan-cancer normalized log2(norm_counts+1) data, version 2016-08-16) |
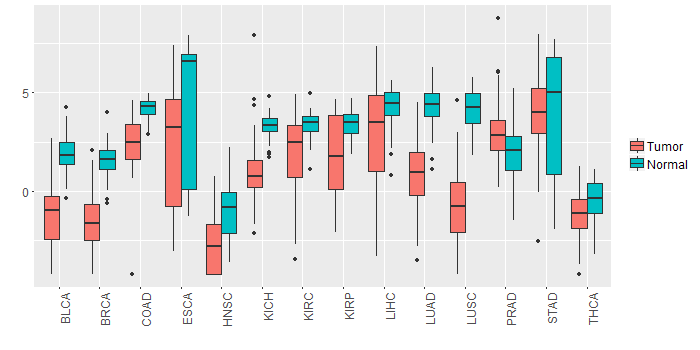 |
| - Significantly differentially expressed cancer types and information. (|Fold change|>1 and FDR<0.05) |
| Cancer type | Mean(exp) in tumor | Mean(exp) in matched normal | Log2FC | P-val. | FDR |
| KIRC | 2.022932521 | 3.38145891 | -1.358526389 | 3.03E-08 | 8.77E-08 |
| COAD | 2.327207628 | 4.198549936 | -1.871342308 | 1.45E-05 | 6.43E-05 |
| LUAD | 0.901075002 | 4.295885347 | -3.394810345 | 1.94E-21 | 4.73E-20 |
| HNSC | -2.702807757 | -0.933010082 | -1.769797674 | 3.08E-07 | 2.67E-06 |
| LUSC | -0.696152855 | 4.154902047 | -4.851054902 | 9.74E-25 | 2.01E-23 |
| BRCA | -1.544192844 | 1.555801015 | -3.09999386 | 1.39E-52 | 1.57E-50 |
| BLCA | -1.143044599 | 1.920392243 | -3.063436842 | 2.38E-07 | 1.08E-05 |
| LIHC | 2.982508243 | 4.227318243 | -1.24481 | 0.00188 | 0.004838331 |
| PRAD | 3.039967243 | 2.011213397 | 1.028753846 | 0.000559 | 0.001918406 |
| KIRP | 1.693367243 | 3.428148493 | -1.73478125 | 9.46E-05 | 0.000325296 |
| KICH | 1.172460243 | 3.284548243 | -2.112088 | 6.63E-05 | 0.000179957 |
| Top |
| TissGene-miRNA for SSTR1 |
| Significantly anti-correlated miRNAs of TissGene across 28 cancer types (Gene-miRNA relations from TargetScanHuman Relsease 7.1, Conserved_Site_Context_Scores.txt.zip, 06.01.2016) (TCGA IlluminaHiSeq_miRNASeq, log2(RPM+1) data, version 2016-11-21) (TCGA IlluminaHiSeq_RNASeqV2, log2(normalized_count+1) data, version 2016-08-16) (Spearman’s Rank Correlation (p-value<0.05 and coefficient<-0.25)) |
| Cancer type | miRNA id | miRNA accession | P-val. | Coeff. | # samples |
| Top |
| TissGeneMut for SSTR1 |
| TissGeneSNV for SSTR1 |
| nsSNV counts per each loci. Different colors of circles represent different cancer types. Circle size denotes number of samples. (TCGA somatic mutation (SNPs and small INDELs) data, version 2016-04-25) * Click on the image to enlarge it in a new window. |
 |
 |
| Somatic nucleotide variants of TissGene across 28 cancer types (X-axis: cancer type and Y-axis: % of mutated samples) The numbers in parentheses are numbers of samples with mutation (nsSNVs). (TCGA somatic mutation (SNPs and small INDELs) data, version 2016-04-25) |
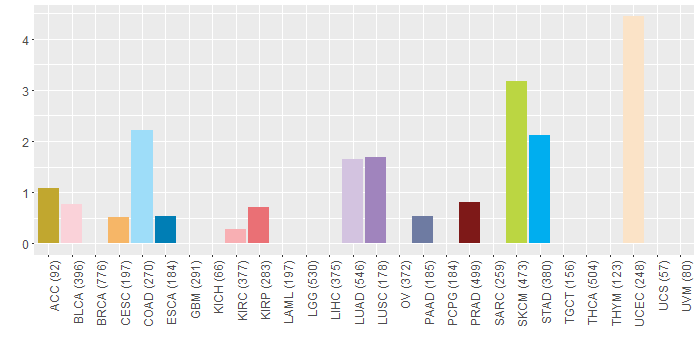 |
| - nsSNVs sorted by frequency. |
| AAchange | Cancer type | # samples |
| p.M89I | SKCM | 2 |
| p.A35E | HNSC | 1 |
| p.A165V | STAD | 1 |
| p.V157M | BLCA | 1 |
| p.S375F | SKCM | 1 |
| p.Y363H | BLCA | 1 |
| p.R85H | STAD | 1 |
| p.S12F | SKCM | 1 |
| p.V365M | STAD | 1 |
| p.L245I | UCEC | 1 |
| p.Y96* | LUAD | 1 |
| p.R170W | LUAD | 1 |
| p.V139G | STAD | 1 |
| p.T205K | UCEC | 1 |
| p.R197L | LUAD | 1 |
| p.V173M | UCEC | 1 |
| p.E40K | SKCM | 1 |
| p.A158V | LUAD | 1 |
| p.F330L | LUAD | 1 |
| p.W284* | CESC | 1 |
| p.L234Q | HNSC | 1 |
| p.S308W | HNSC | 1 |
| p.L190M | LUSC | 1 |
| p.L179P | PAAD | 1 |
| p.S13C | HNSC | 1 |
| p.T389M | DLBC | 1 |
| p.L338I | STAD | 1 |
| p.A165E | UCEC | 1 |
| p.E348K | SKCM | 1 |
| p.A92T | COAD | 1 |
| p.T118M | UCEC | 1 |
| p.L114P | ESCA | 1 |
| p.E266G | UCEC | 1 |
| p.E349* | LUAD | 1 |
| p.V276M | HNSC | 1 |
| p.R167H | PRAD | 1 |
| p.C130G | SKCM | 1 |
| p.A302T | COAD | 1 |
| p.A318T | PRAD | 1 |
| p.G204A | COAD | 1 |
| p.A87T | COAD | 1 |
| p.R251H | STAD | 1 |
| p.R197H | SKCM | 1 |
| p.C21W | KIRP | 1 |
| p.W284* | SKCM | 1 |
| p.F228S | STAD | 1 |
| p.R336H | STAD | 1 |
| p.S9F | SKCM | 1 |
| p.G54S | SKCM | 1 |
| p.P16H | KIRC | 1 |
| p.S360I | UCEC | 1 |
| p.A166T | LUSC | 1 |
| p.C147* | PRAD | 1 |
| p.R197C | SKCM | 1 |
| p.Q299X | COAD | 1 |
| p.G180V | LUSC | 1 |
| p.R169C | HNSC | 1 |
| p.R121H | UCEC | 1 |
| p.S144N | SKCM | 1 |
| p.L326F | PRAD | 1 |
| p.G382S | LUAD | 1 |
| p.S46P | STAD | 1 |
| p.D344G | COAD | 1 |
| p.A174V | SKCM | 1 |
| p.L108I | UCEC | 1 |
| p.A357T | UCEC | 1 |
| p.A355V | SKCM | 1 |
| p.S117Y | SKCM | 1 |
| p.W123* | PAAD | 1 |
| p.V221L | LUAD | 1 |
| p.A216T | ACC | 1 |
| p.Y86N | STAD | 1 |
| p.R85L | HNSC | 1 |
| p.V71A | KIRP | 1 |
| p.A238T | BLCA | 1 |
| p.L391F | LUAD | 1 |
| p.R169H | COAD | 1 |
| p.A127V | STAD | 1 |
| p.R155C | UCEC | 1 |
| p.V244M | PRAD | 1 |
| Top |
| TissGeneCNV for SSTR1 |
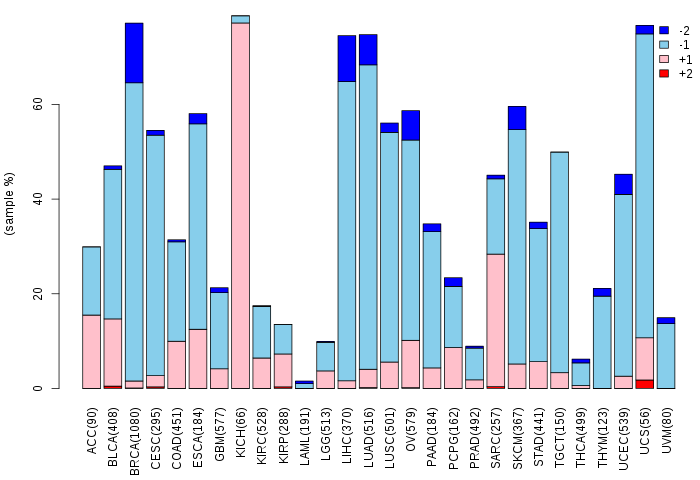
| Copy number variations of TissGene across 28 cancer types (X-axis: cancer type and Y-axis: % of CNV samples) (TCGA Gistic2_CopyNumber_Gistic2_all_data_by_genes, Gistic2 copy number data, version 2016-08-16) |
 |
| Top |
| TissGeneFusions for SSTR1 |
| Fusion genes including TissGene (ChimerDB 3.0, 2016-12-01 and TCGA fusion Portal 2015-12-01) |
| Database | Src | Cancer type | Sample | Fusion gene | ORF | 5'-gene BP | 3'-gene BP |
| Top |
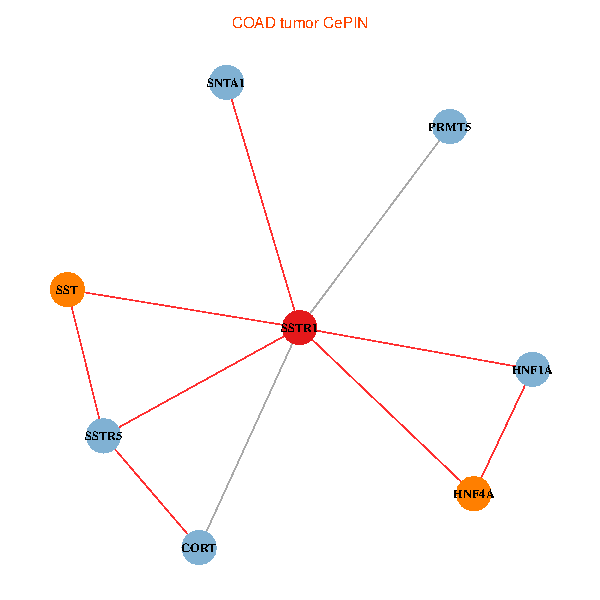
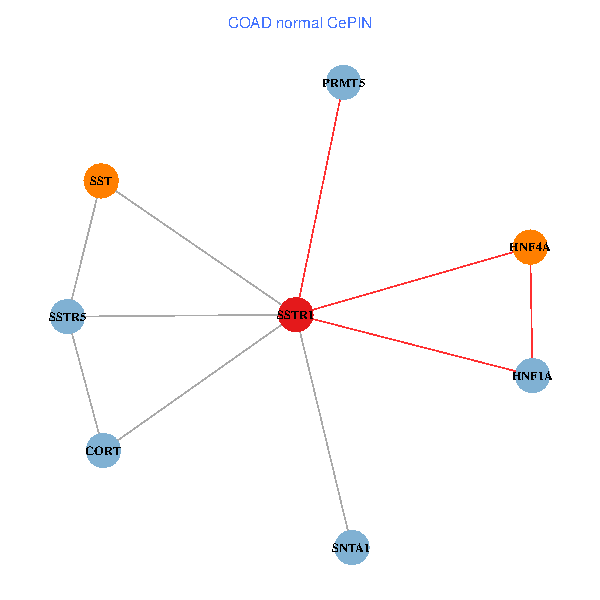
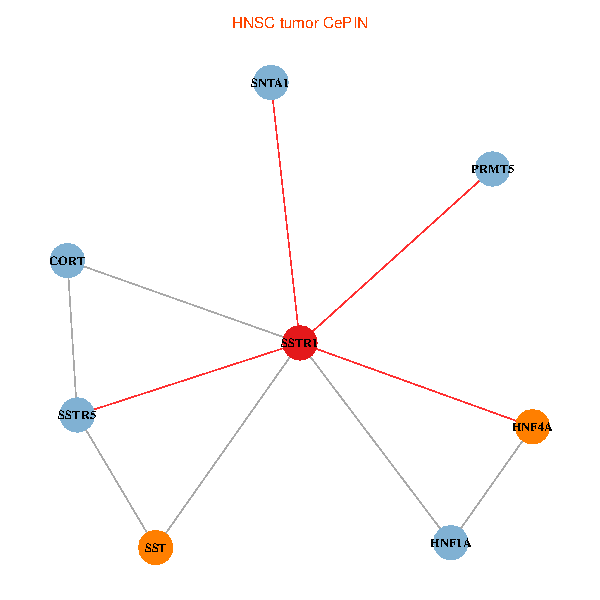
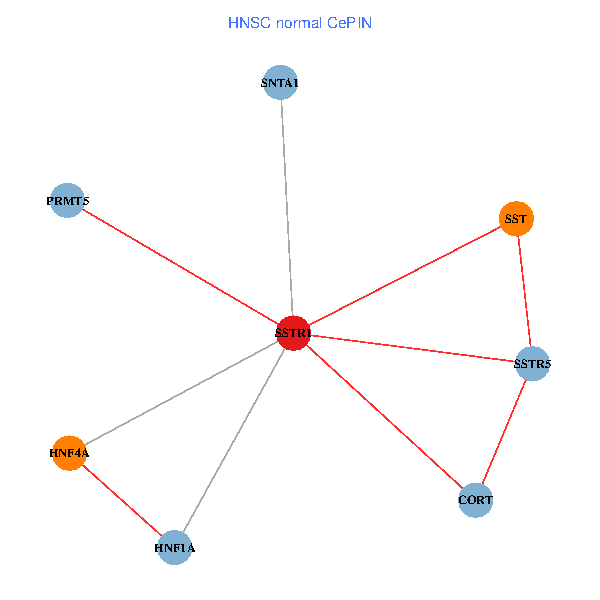
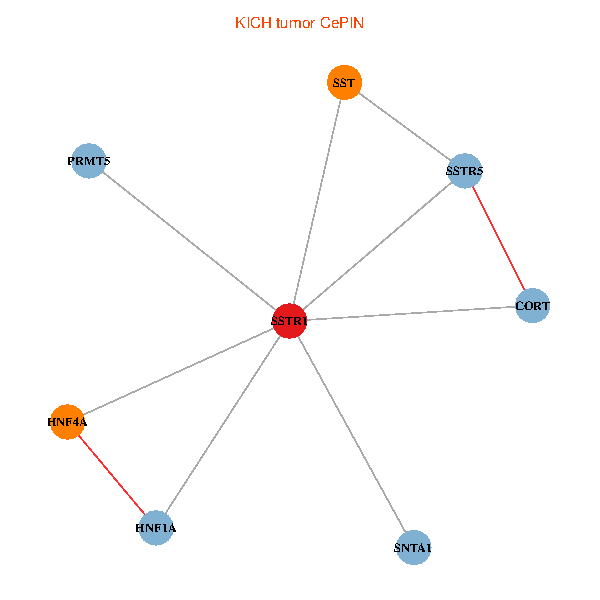
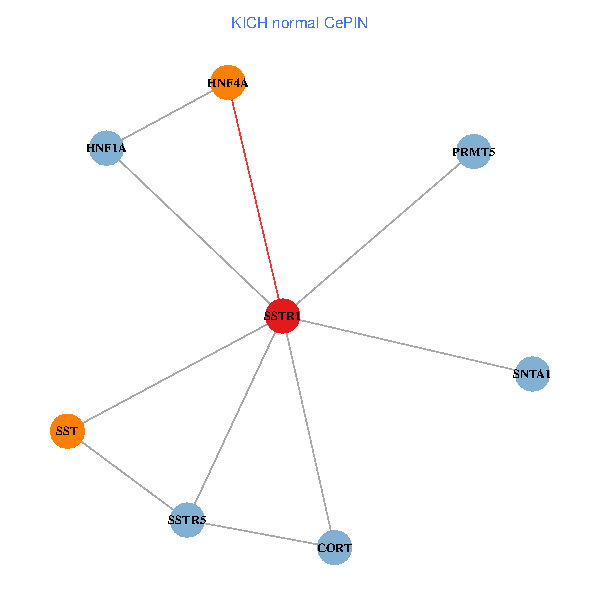
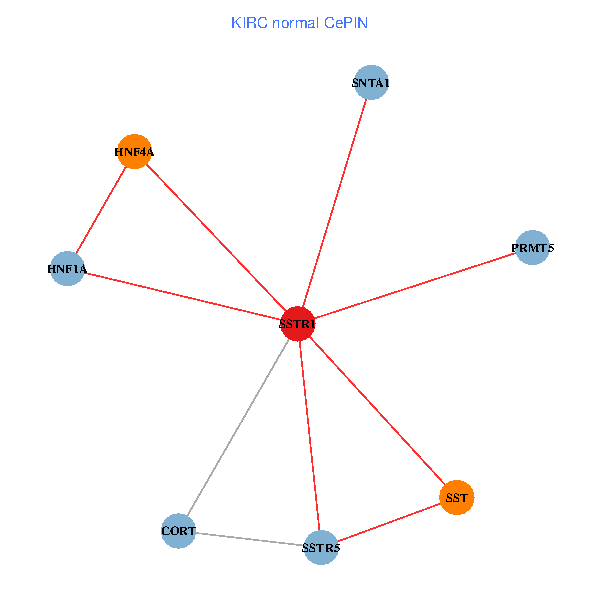
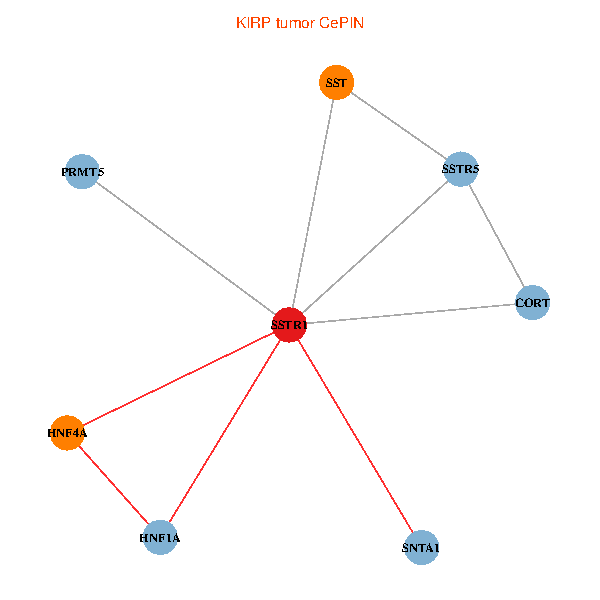
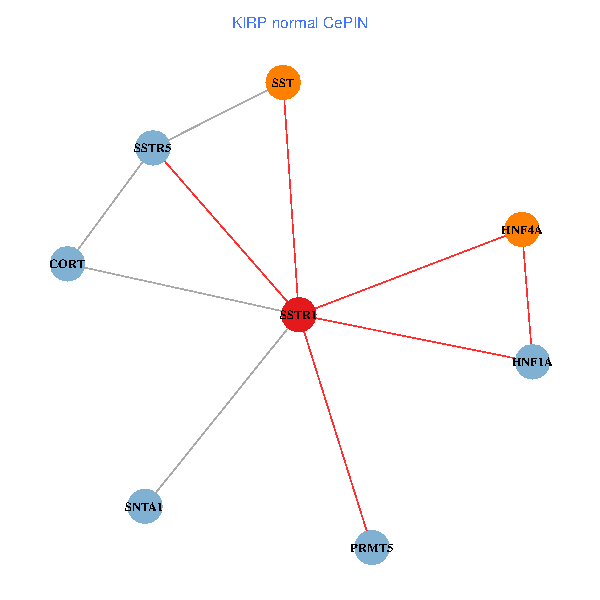
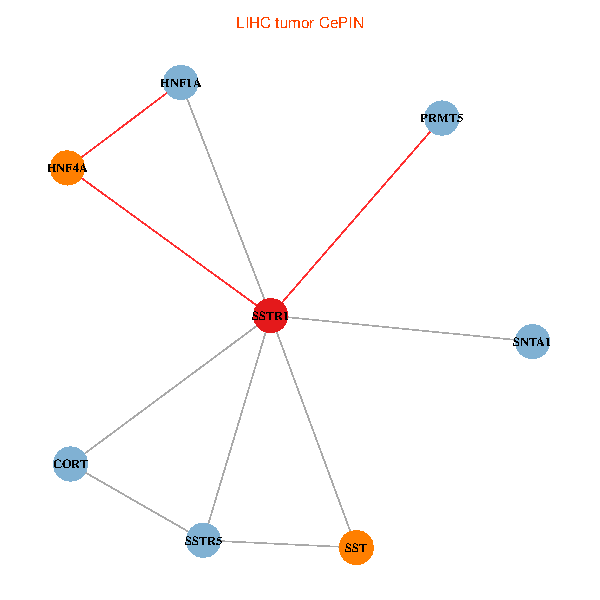
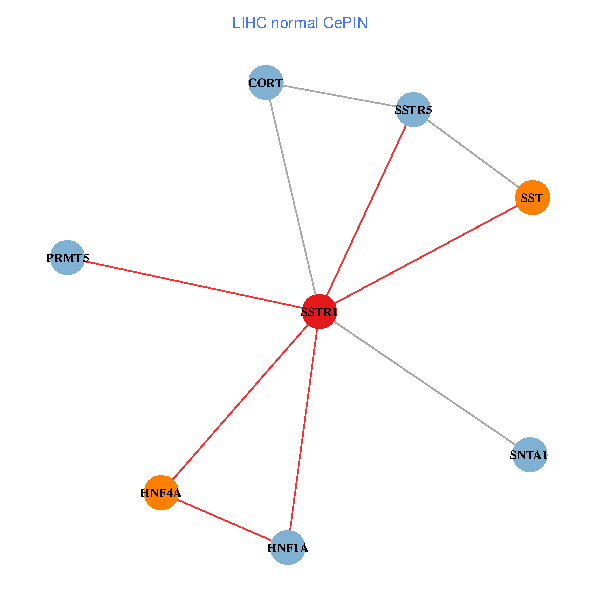
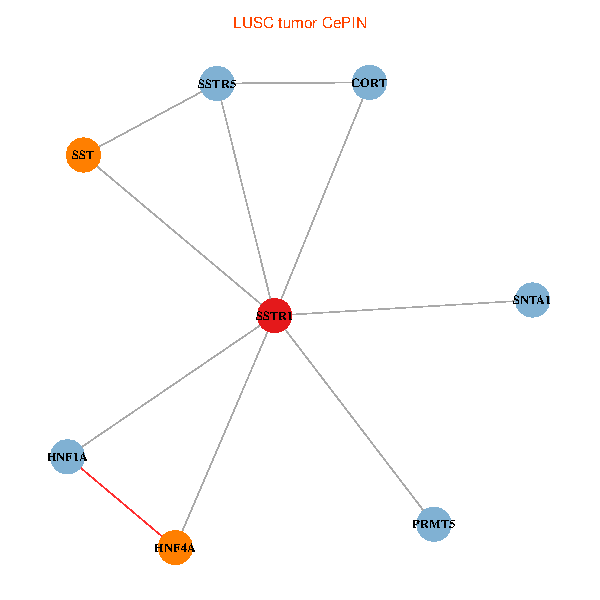
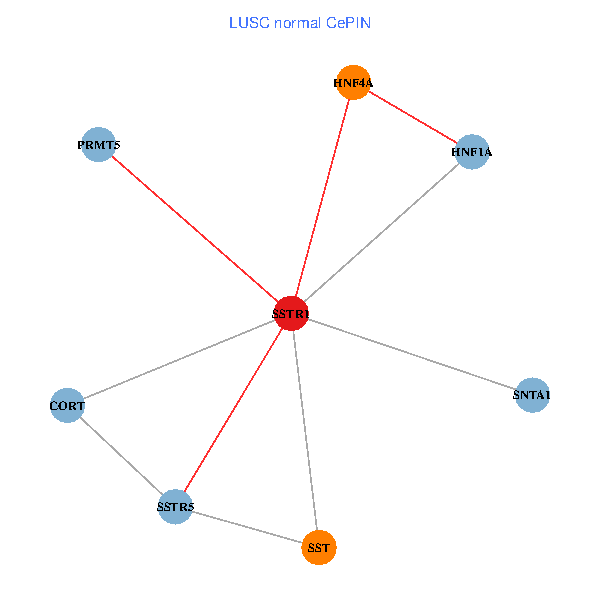
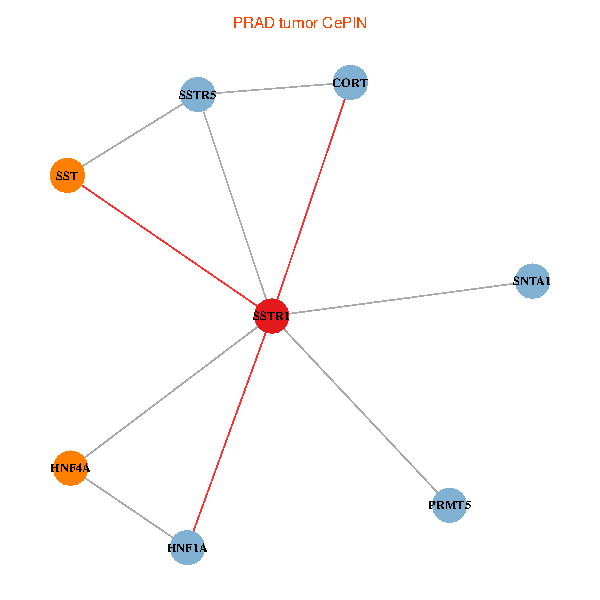
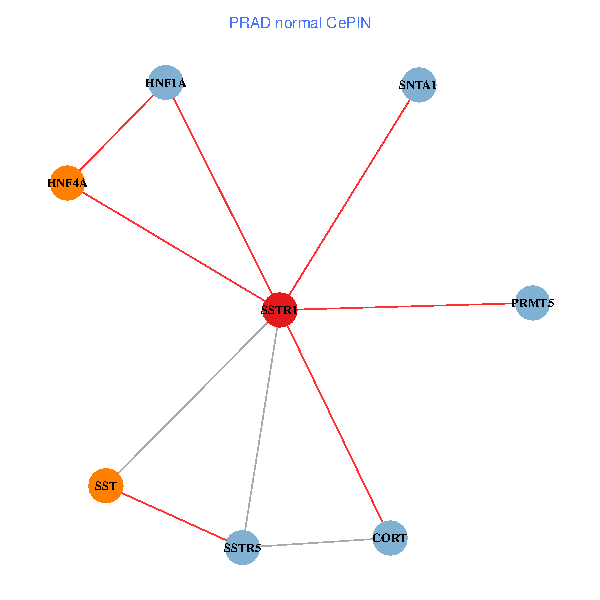
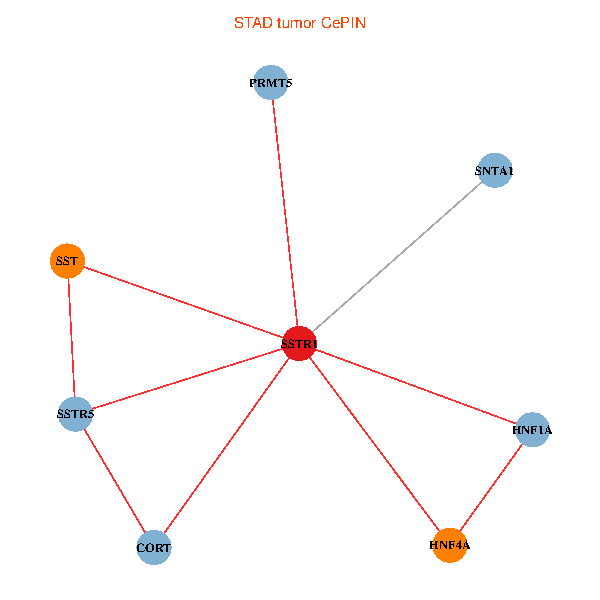
| TissGeneNet for SSTR1 |
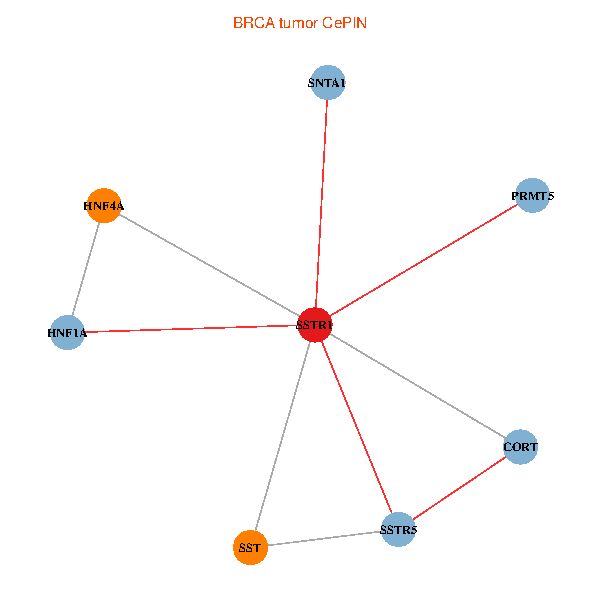
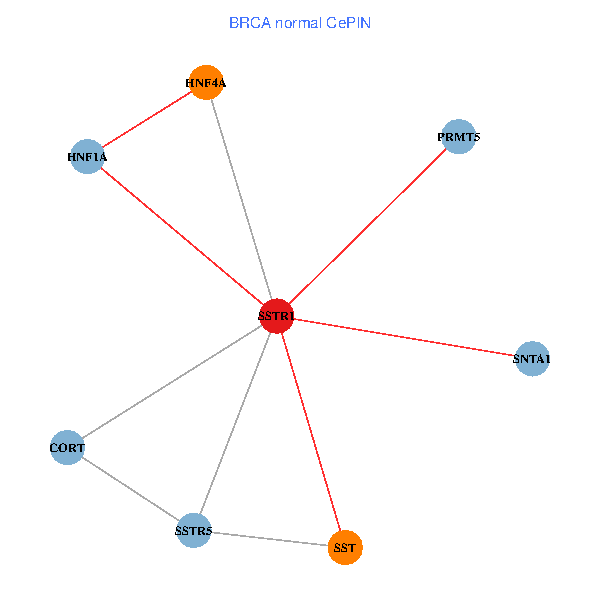
| Co-expressed gene networks based on protein-protein interaction data (CePIN) (TCGA IlluminaHiSeq_RNASeqV2, pan-cancer normalized log2(norm_counts+1) data, version 2016-08-16) (PINA2 ppi data) |
| BRCA (tumor) | BRCA (normal) |
| SSTR1, HNF4A, PRMT5, CORT, HNF1A, SNTA1, SSTR5, SST (tumor) | SSTR1, HNF4A, PRMT5, CORT, HNF1A, SNTA1, SSTR5, SST (normal) |
 |  |
| COAD (tumor) | COAD (normal) |
| SSTR1, HNF4A, PRMT5, CORT, HNF1A, SNTA1, SSTR5, SST (tumor) | SSTR1, HNF4A, PRMT5, CORT, HNF1A, SNTA1, SSTR5, SST (normal) |
 |  |
| HNSC (tumor) | HNSC (normal) |
| SSTR1, HNF4A, PRMT5, CORT, HNF1A, SNTA1, SSTR5, SST (tumor) | SSTR1, HNF4A, PRMT5, CORT, HNF1A, SNTA1, SSTR5, SST (normal) |
 |  |
| KICH (tumor) | KICH (normal) |
| SSTR1, HNF4A, PRMT5, CORT, HNF1A, SNTA1, SSTR5, SST (tumor) | SSTR1, HNF4A, PRMT5, CORT, HNF1A, SNTA1, SSTR5, SST (normal) |
 |  |
| KIRC (tumor) | KIRC (normal) |
| SSTR1, HNF4A, PRMT5, CORT, HNF1A, SNTA1, SSTR5, SST (tumor) | SSTR1, HNF4A, PRMT5, CORT, HNF1A, SNTA1, SSTR5, SST (normal) |
 |  |
| KIRP (tumor) | KIRP (normal) |
| SSTR1, HNF4A, PRMT5, CORT, HNF1A, SNTA1, SSTR5, SST (tumor) | SSTR1, HNF4A, PRMT5, CORT, HNF1A, SNTA1, SSTR5, SST (normal) |
 |  |
| LIHC (tumor) | LIHC (normal) |
| SSTR1, HNF4A, PRMT5, CORT, HNF1A, SNTA1, SSTR5, SST (tumor) | SSTR1, HNF4A, PRMT5, CORT, HNF1A, SNTA1, SSTR5, SST (normal) |
 |  |
| LUAD (tumor) | LUAD (normal) |
| SSTR1, HNF4A, PRMT5, CORT, HNF1A, SNTA1, SSTR5, SST (tumor) | SSTR1, HNF4A, PRMT5, CORT, HNF1A, SNTA1, SSTR5, SST (normal) |
 |  |
| LUSC (tumor) | LUSC (normal) |
| SSTR1, HNF4A, PRMT5, CORT, HNF1A, SNTA1, SSTR5, SST (tumor) | SSTR1, HNF4A, PRMT5, CORT, HNF1A, SNTA1, SSTR5, SST (normal) |
 |  |
| PRAD (tumor) | PRAD (normal) |
| SSTR1, HNF4A, PRMT5, CORT, HNF1A, SNTA1, SSTR5, SST (tumor) | SSTR1, HNF4A, PRMT5, CORT, HNF1A, SNTA1, SSTR5, SST (normal) |
 |  |
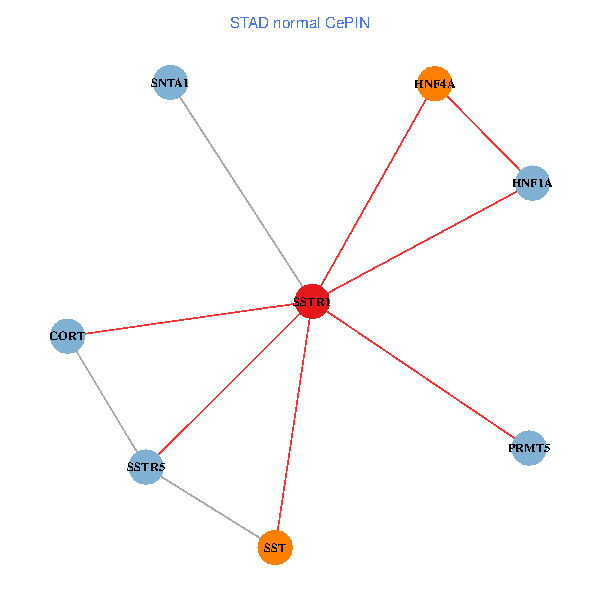
| STAD (tumor) | STAD (normal) |
| SSTR1, HNF4A, PRMT5, CORT, HNF1A, SNTA1, SSTR5, SST (tumor) | SSTR1, HNF4A, PRMT5, CORT, HNF1A, SNTA1, SSTR5, SST (normal) |
 |  |
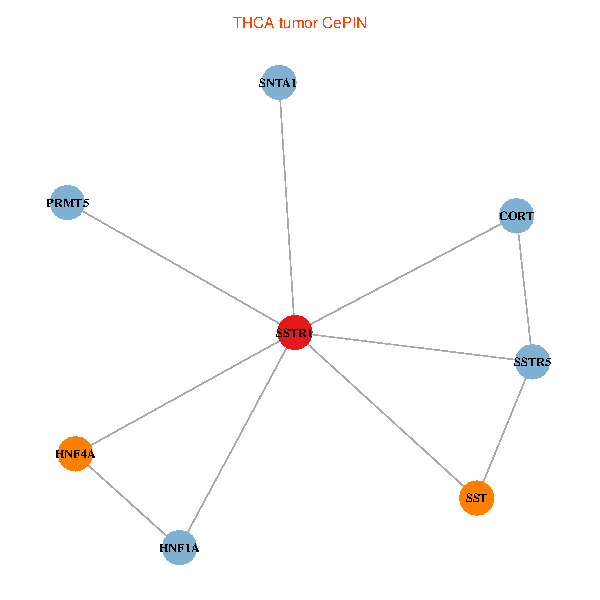
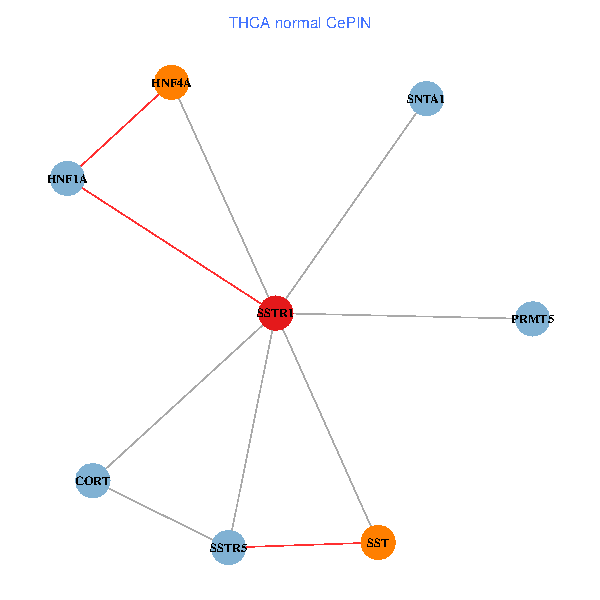
| THCA (tumor) | THCA (normal) |
| SSTR1, HNF4A, PRMT5, CORT, HNF1A, SNTA1, SSTR5, SST (tumor) | SSTR1, HNF4A, PRMT5, CORT, HNF1A, SNTA1, SSTR5, SST (normal) |
 |  |
| Top |
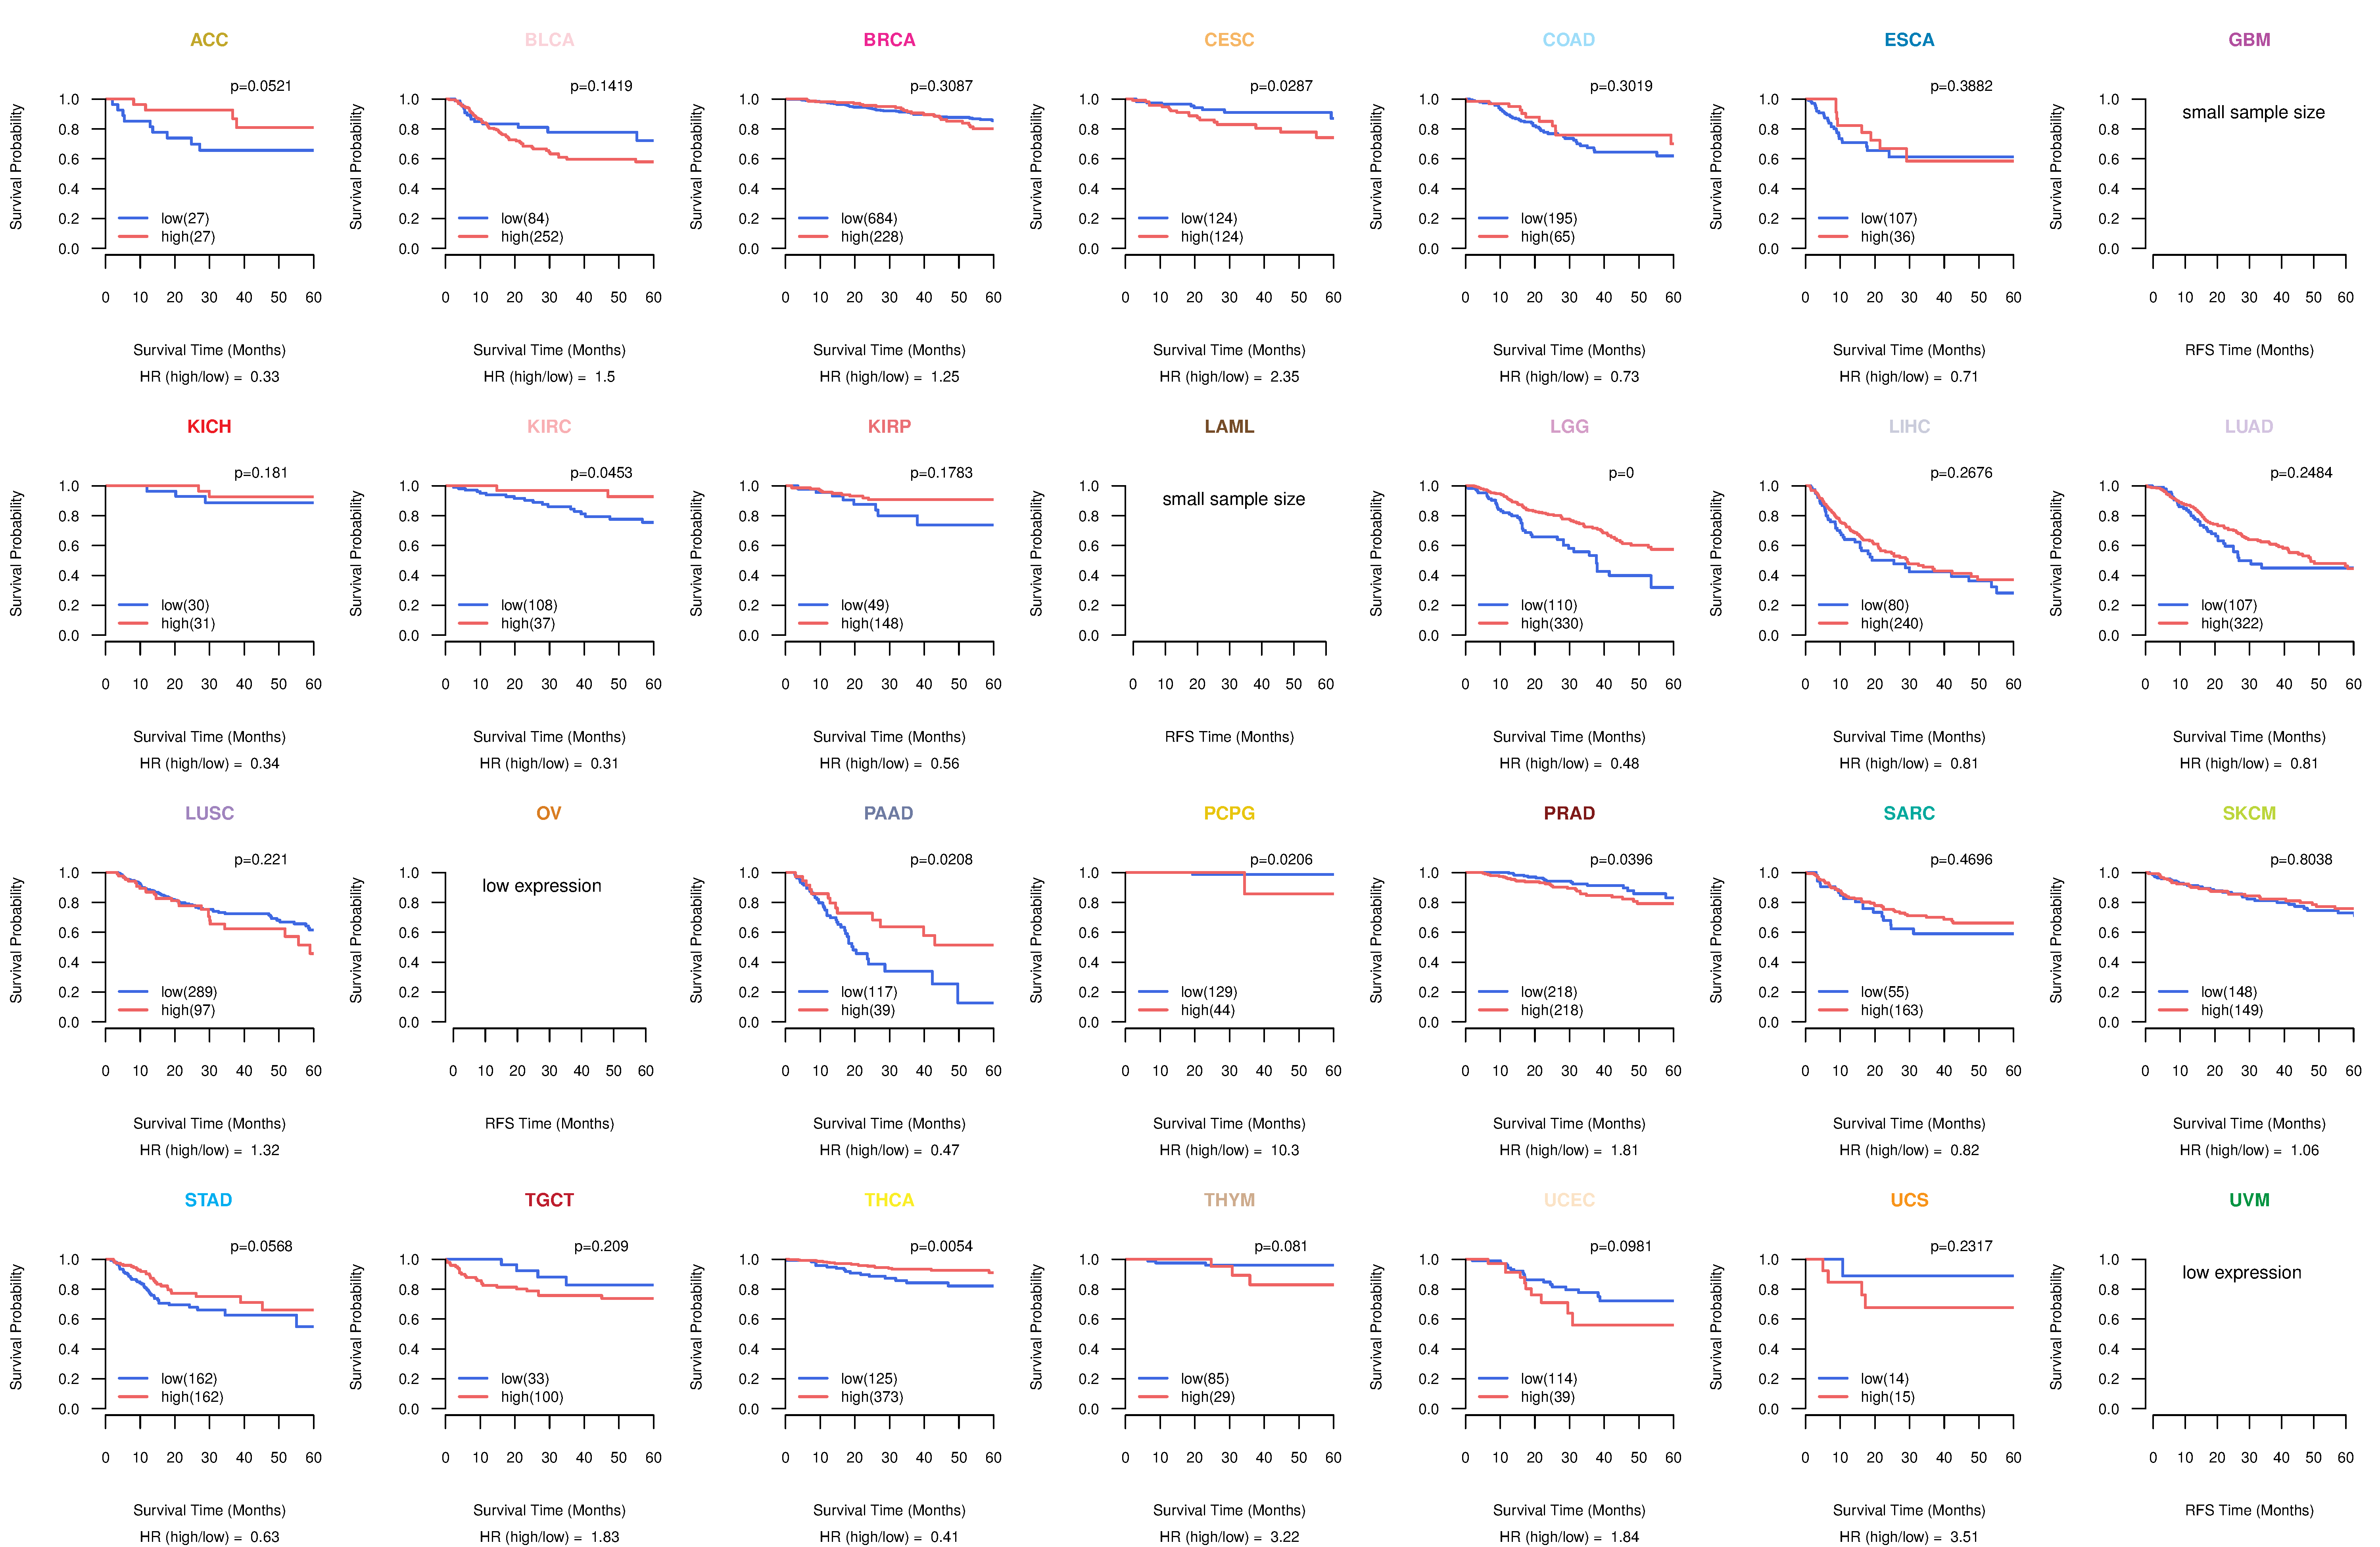
| TissGeneProg for SSTR1 |
| Kaplan-Meier plots with logrank tests of overall survival (OS) using 28 cancer types (TCGA IlluminaHiSeq_RNASeqV2, pan-cancer normalized log2(norm_counts+1) data, version 2016-08-16) (TCGA clinicalMatrix, phenotype data, version 2016-04-27) * Click on the image to enlarge it in a new window. |
 |
| Kaplan-Meier plots with logrank test of relapse free survival (RFS) using 28 cancer types (TCGA IlluminaHiSeq_RNASeqV2, pan-cancer normalized log2(norm_counts+1) data, version 2016-08-16) (TCGA clinicalMatrix, phenotype data, version 2016-04-27) * Click on the image enlarge it in a new window. |
 |
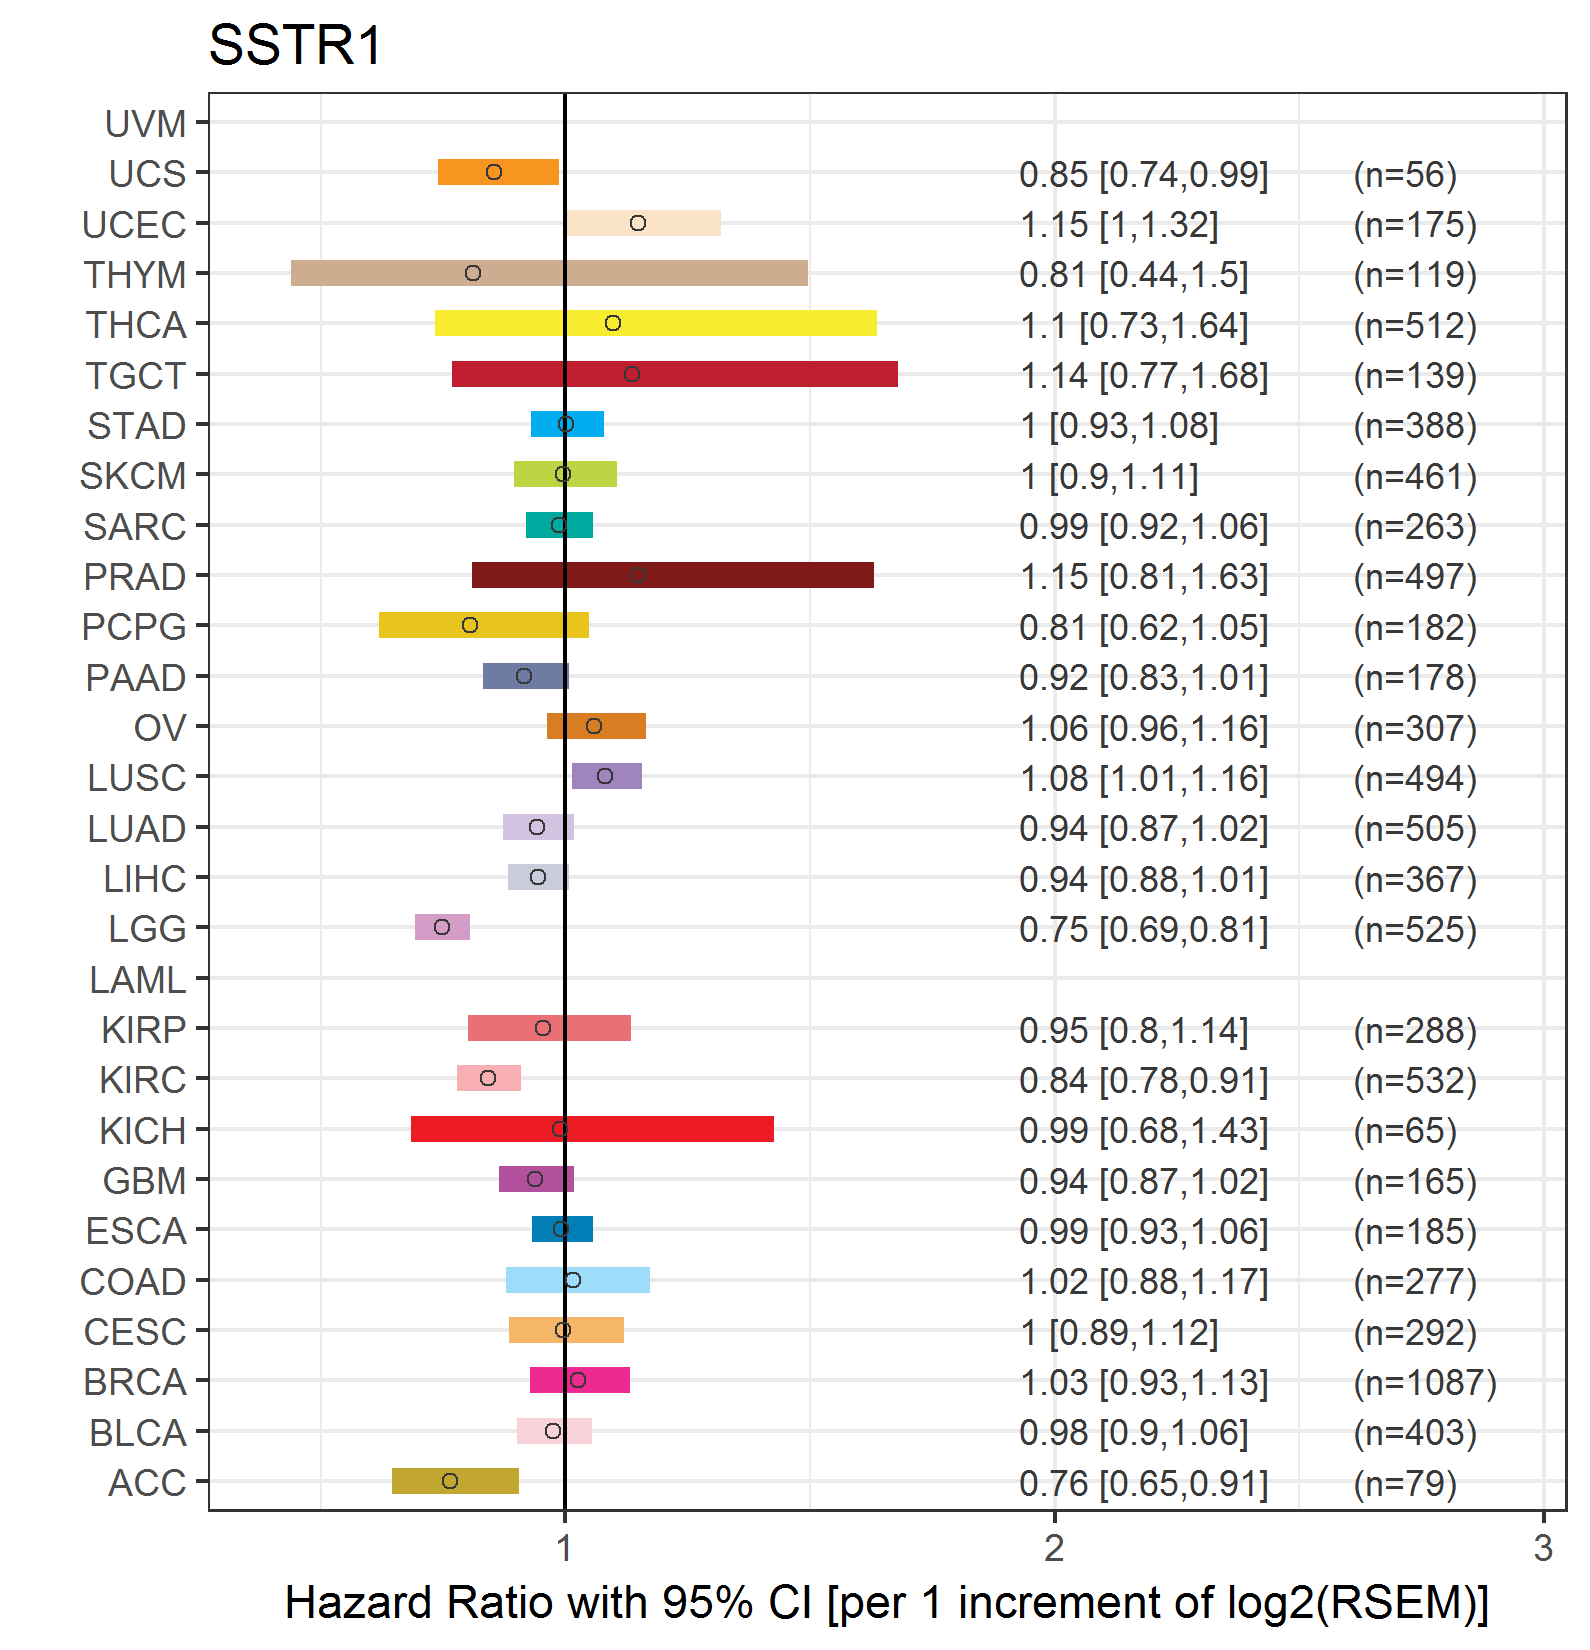
| Forest plot of Cox proportional hazard ratio (HR) and 95% CI of overall survival (OS) using 28 cancer types (TCGA IlluminaHiSeq_RNASeqV2, pan-cancer normalized log2(norm_counts+1) data, version 2016-08-16) (TCGA clinicalMatrix, phenotype data, version 2016-04-27) * Click on the image enlarge it in a new window. |
 |
| Forest plot of Cox proportional hazard ratio (HR) and 95% CI of relapse free survival (RFS) using 28 cancer types (TCGA IlluminaHiSeq_RNASeqV2, pan-cancer normalized log2(norm_counts+1) data, version 2016-08-16) (TCGA clinicalMatrix, phenotype data, version 2016-04-27) * Click on the image enlarge it in a new window. |
 |
| Top |
| TissGeneClin for SSTR1 |
| TissGeneDrug for SSTR1 |
| Drug information targeting TissGene (DrugBank Version 5.0.6, 2017-04-01) |
| DrugBank ID | Drug name | Drug activity | Drug type | Drug status |
| DB06663 | Pasireotide | Small molecule | Approved | |
| DB00104 | Octreotide | Small molecule | Approved|Investigational |
| Top |
| TissGeneDisease for SSTR1 |
| Disease information associated with TissGene (DisGeNet, 2016-06-01) |
| Disease ID | Disease name | # pubmeds | Source |
| umls:C0032000 | Pituitary Adenoma | 5 | BeFree |
| umls:C0006142 | Malignant neoplasm of breast | 4 | BeFree,GAD |
| umls:C0235974 | Pancreatic carcinoma | 4 | BeFree |
| umls:C0346647 | Malignant neoplasm of pancreas | 4 | BeFree |
| umls:C0376358 | Malignant neoplasm of prostate | 3 | BeFree,GAD |
| umls:C0001430 | Adenoma | 2 | BeFree,LHGDN |
| umls:C0030297 | Pancreatic Neoplasm | 2 | CTD_human,LHGDN |
| umls:C0032019 | Pituitary Neoplasms | 2 | BeFree,LHGDN |
| umls:C0033375 | Prolactinoma | 2 | BeFree |
| umls:C0033578 | Prostatic Neoplasms | 2 | LHGDN |
| umls:C0040136 | Thyroid Neoplasm | 2 | BeFree,LHGDN |
| umls:C0149925 | Small cell carcinoma of lung | 2 | BeFree |
| umls:C0206754 | Neuroendocrine Tumors | 2 | BeFree,CTD_human |
| umls:C0334299 | Carcinoid tumor no ICD-O subtype | 2 | BeFree |
| umls:C0600139 | Prostate carcinoma | 2 | BeFree |
| umls:C0007095 | Carcinoid Tumor | 1 | BeFree |
| umls:C0011853 | Diabetes Mellitus, Experimental | 1 | RGD |
| umls:C0014132 | Endocrine Gland Neoplasms | 1 | BeFree |
| umls:C0014544 | Epilepsy | 1 | BeFree |
| umls:C0017638 | Glioma | 1 | BeFree |
| umls:C0018671 | Head and Neck Neoplasms | 1 | GAD |
| umls:C0021670 | insulinoma | 1 | BeFree |
| umls:C0022602 | Actinic keratosis | 1 | BeFree |
| umls:C0024623 | Malignant neoplasm of stomach | 1 | BeFree |
| umls:C0027643 | Neoplasm Recurrence, Local | 1 | GAD |
| umls:C0031511 | Pheochromocytoma | 1 | BeFree |
| umls:C0032002 | Pituitary Diseases | 1 | BeFree |
| umls:C0038220 | Status Epilepticus | 1 | CTD_human |
| umls:C0085183 | Neoplasms, Second Primary | 1 | GAD |
| umls:C0149678 | Epstein-Barr Virus Infections | 1 | BeFree |
| umls:C0238198 | Gastrointestinal Stromal Tumors | 1 | BeFree |
| umls:C0339143 | Thyroid associated opthalmopathies | 1 | BeFree |
| umls:C0596263 | Carcinogenesis | 1 | BeFree |
| umls:C0678222 | Breast Carcinoma | 1 | BeFree |
| umls:C0699791 | Stomach Carcinoma | 1 | BeFree |
| umls:C0850666 | Helicobacter pylori infection | 1 | BeFree |
| umls:C1168401 | Squamous cell carcinoma of the head and neck | 1 | BeFree |
| umls:C1458155 | Mammary Neoplasms | 1 | BeFree |
| umls:C1704272 | Benign Prostatic Hyperplasia | 1 | BeFree |
|
Copyright 2016-Present - The University of Texas Health Science Center at Houston (UTHealth) Web File Viewing | How to Report, Fraud, Waste and Abuse | State of Texas | Statewide Search | Texas Homeland Security | Site Policies |