 |
| |
| |
| |
| |
| |
| |
|

| TissGeneSummary for SSX1 |
 Gene summary Gene summary |
| Basic gene information | Gene symbol | SSX1 |
| Gene name | synovial sarcoma, X breakpoint 1 | |
| Synonyms | CT5.1|SSRC | |
| Cytomap | UCSC genome browser: Xp11.23 | |
| Type of gene | protein-coding | |
| RefGenes | NM_001278691.1, NM_005635.3, | |
| Description | cancer/testis antigen 5.1cancer/testis antigen family 5, member 1protein SSX1sarcoma, synovial, X-chromosome-related 1 | |
| Modification date | 20141222 | |
| dbXrefs | MIM : 312820 | |
| HGNC : HGNC | ||
| Ensembl : ENSG00000126752 | ||
| HPRD : 02428 | ||
| Vega : OTTHUMG00000021488 | ||
| Protein | UniProt: go to UniProt's Cross Reference DB Table | |
| Expression | CleanEX: HS_SSX1 | |
| BioGPS: 6756 | ||
| Pathway | NCI Pathway Interaction Database: SSX1 | |
| KEGG: SSX1 | ||
| REACTOME: SSX1 | ||
| Pathway Commons: SSX1 | ||
| Context | iHOP: SSX1 | |
| ligand binding site mutation search in PubMed: SSX1 | ||
| UCL Cancer Institute: SSX1 | ||
| Assigned class in TissGDB* | A | |
| Included tissue-specific gene expression resources | HPA,TiGER,GTEx | |
| Specific-tissues in normal samples (assigned by TissGDB using HPA, TiGER, and GTEx) | Bone marrowSkinTestis | |
| Cancer types related to the specific-tissues in cancer samples (assigned by TissGDB using TCGA) | LAMLSKCMTGCT | |
| Reference showing the relevant tissue of SSX1 | Expression and immunotherapeutic targeting of the SSX family of cancer-testis antigens in prostate cancer.Cancer Res. 2011 Nov 1;71(21):6785-95. doi: 10.1158/0008-5472.CAN-11-2127. (pmid:21880588) go to article | |
| Description by TissGene annotations | Cancer gene Fused withOncogene | |
| * Class A consists of genes with literature evidence and is part of the cTissGenes. Class B consists of only cTissGenes without additional evidence. The remaining genes belong to Class C. |
| Gene ontology having evidence of Inferred from Direct Assay (IDA) from Entrez |
| GO ID | GO term | PubMed ID |
| Top |
| TissGeneExp for SSX1 |
| Gene expressions across 28 cancer types (X-axis: cancer type and Y-axis: log2(norm_counts+1)) (TCGA IlluminaHiSeq_RNASeqV2, pan-cancer normalized log2(norm_counts+1) data, version 2016-08-16) |
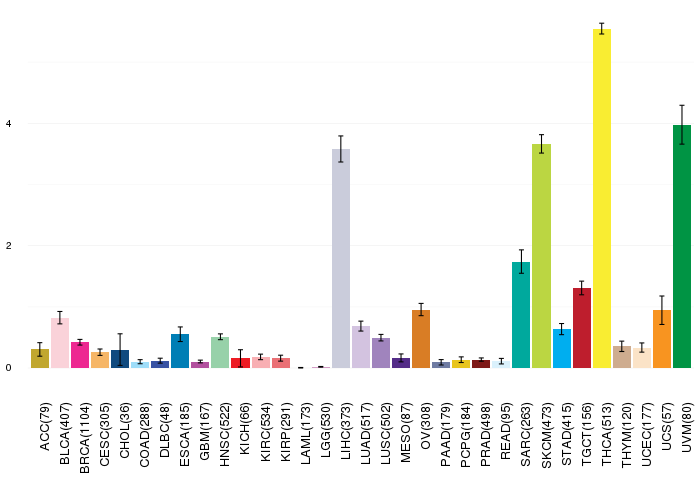 |
| Gene isoform expressions across 28 cancer types (X-axis: cancer type and Y-axis: log2(norm_counts+1)) (TCGA pan-cancer tcga_rsem_isoform_tpm, version 2016-09-01) |
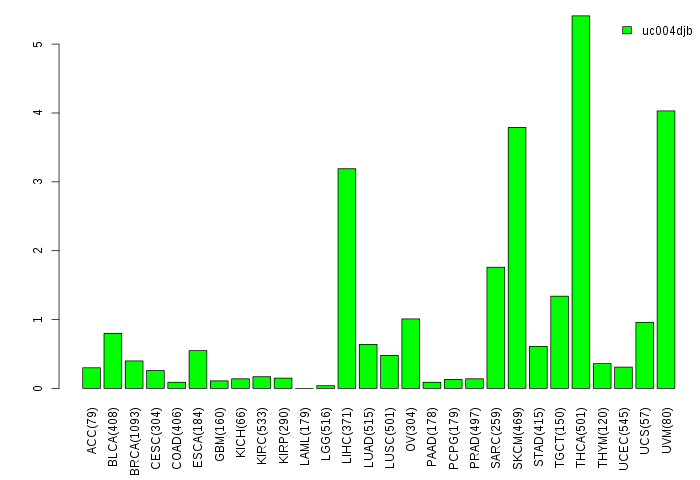 |
| Gene expressions across normal tissues of GTEx data (GTEx GTEx_Analysis_v6_RNA-seq_RNA-SeQCv1.1.8_gene_rpkm.gct) - Here, we shows the matched tissue types only among our 28 cancer types. |
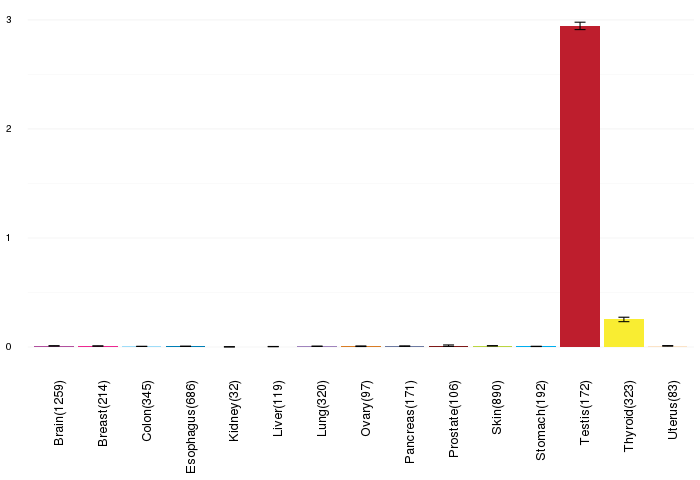 |
| Different expressions across 14 cancer types with more than 10 samples between matched tumors and normals (X-axis: cancer type and Y-axis: log2(norm_counts+1)) (TCGA IlluminaHiSeq_RNASeqV2, pan-cancer normalized log2(norm_counts+1) data, version 2016-08-16) |
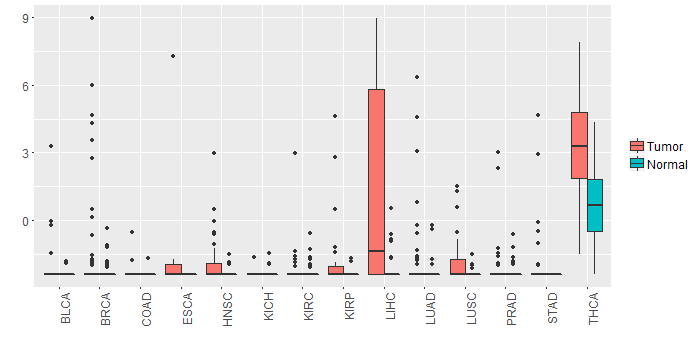 |
| - Significantly differentially expressed cancer types and information. (|Fold change|>1 and FDR<0.05) |
| Cancer type | Mean(exp) in tumor | Mean(exp) in matched normal | Log2FC | P-val. | FDR |
| THCA | 3.430160845 | 0.711623557 | 2.718537288 | 6.36E-13 | 5.99E-12 |
| LIHC | 1.663834303 | -2.151469697 | 3.815304 | 1.89E-07 | 1.24E-06 |
| Top |
| TissGene-miRNA for SSX1 |
| Significantly anti-correlated miRNAs of TissGene across 28 cancer types (Gene-miRNA relations from TargetScanHuman Relsease 7.1, Conserved_Site_Context_Scores.txt.zip, 06.01.2016) (TCGA IlluminaHiSeq_miRNASeq, log2(RPM+1) data, version 2016-11-21) (TCGA IlluminaHiSeq_RNASeqV2, log2(normalized_count+1) data, version 2016-08-16) (Spearman’s Rank Correlation (p-value<0.05 and coefficient<-0.25)) |
| Cancer type | miRNA id | miRNA accession | P-val. | Coeff. | # samples |
| Top |
| TissGeneMut for SSX1 |
| TissGeneSNV for SSX1 |
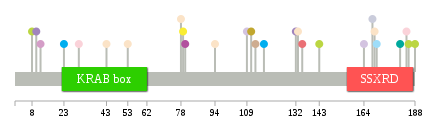
| nsSNV counts per each loci. Different colors of circles represent different cancer types. Circle size denotes number of samples. (TCGA somatic mutation (SNPs and small INDELs) data, version 2016-04-25) * Click on the image to enlarge it in a new window. |
 |
 |
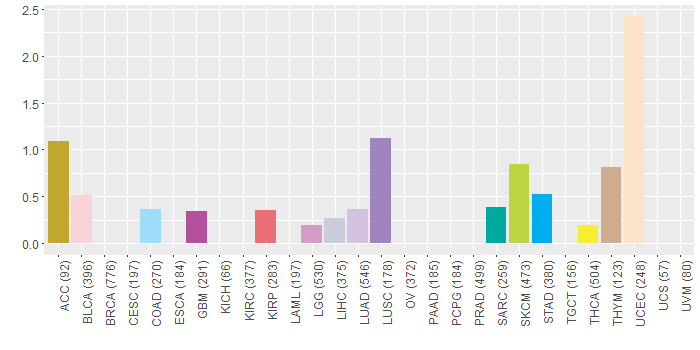
| Somatic nucleotide variants of TissGene across 28 cancer types (X-axis: cancer type and Y-axis: % of mutated samples) The numbers in parentheses are numbers of samples with mutation (nsSNVs). (TCGA somatic mutation (SNPs and small INDELs) data, version 2016-04-25) |
 |
| - nsSNVs sorted by frequency. |
| AAchange | Cancer type | # samples |
| p.A8E | SKCM | 1 |
| p.D78N | UCEC | 1 |
| p.E188K | SKCM | 1 |
| p.E184K | BLCA | 1 |
| p.Q133L | UCEC | 1 |
| p.S181I | SARC | 1 |
| p.R169H | UCEC | 1 |
| p.I111F | ACC | 1 |
| p.E185K | SKCM | 1 |
| p.P113H | THYM | 1 |
| p.V94I | UCEC | 1 |
| p.R10I | LUSC | 1 |
| p.R53I | UCEC | 1 |
| p.D27Y | HNSC | 1 |
| p.Q80L | GBM | 1 |
| p.D135N | KIRP | 1 |
| p.G143E | SKCM | 1 |
| p.P109T | LUAD | 1 |
| p.A117V | STAD | 1 |
| p.K23N | STAD | 1 |
| p.W164C | LUAD | 1 |
| p.E170D | COAD | 1 |
| p.F79I | THCA | 1 |
| p.S43L | UCEC | 1 |
| p.M40I | HNSC | 1 |
| p.L168M | LIHC | 1 |
| p.T30K | BLCA | 1 |
| p.P132Q | LUSC | 1 |
| p.R12M | LGG | 1 |
| Top |
| TissGeneCNV for SSX1 |
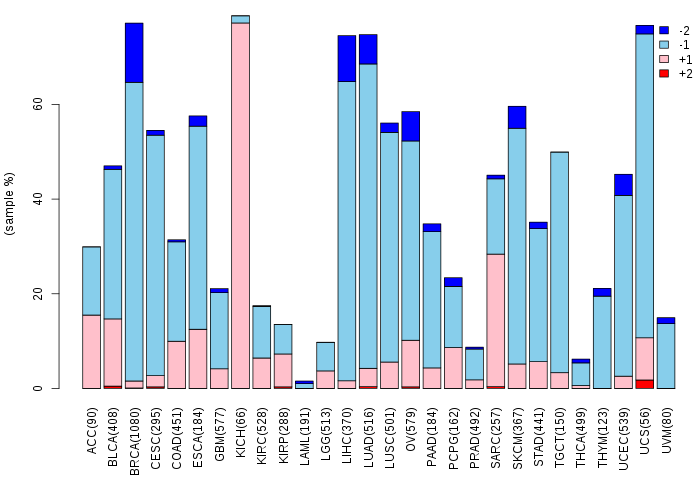
| Copy number variations of TissGene across 28 cancer types (X-axis: cancer type and Y-axis: % of CNV samples) (TCGA Gistic2_CopyNumber_Gistic2_all_data_by_genes, Gistic2 copy number data, version 2016-08-16) |
 |
| Top |
| TissGeneFusions for SSX1 |
| Fusion genes including TissGene (ChimerDB 3.0, 2016-12-01 and TCGA fusion Portal 2015-12-01) |
| Database | Src | Cancer type | Sample | Fusion gene | ORF | 5'-gene BP | 3'-gene BP |
| Chimerdb3.0 | ChiTaRs | NA | S79325 | SS18-SSX1 | chr18:23615074 | chrX:48123215 | |
| Chimerdb3.0 | ChiTaRs | NA | AB300355 | SS18-SSX1 | chr18:23670542 | chrX:48123215 | |
| Chimerdb3.0 | ChiTaRs | NA | AF402618 | SS18-SSX1 | chr18:23615029 | chrX:48123278 | |
| Chimerdb3.0 | FusionScan | SARC | TCGA-X6-A8C7-01A | SS18-SSX1 | In-Frame | chr18:23612362 | chrX:48123216 |
| Chimerdb3.0 | FusionScan | SARC | TCGA-DX-A7ER-01A | SS18-SSX1 | In-Frame | chr18:23612362 | chrX:48123216 |
| Chimerdb3.0 | FusionScan | SARC | TCGA-DX-A7EO-01A | SS18-SSX1 | In-Frame | chr18:23612362 | chrX:48123216 |
| Chimerdb3.0 | FusionScan | SARC | TCGA-FX-A8OO-01A | SS18-SSX1 | In-Frame | chr18:23612362 | chrX:48123216 |
| Top |
| TissGeneNet for SSX1 |
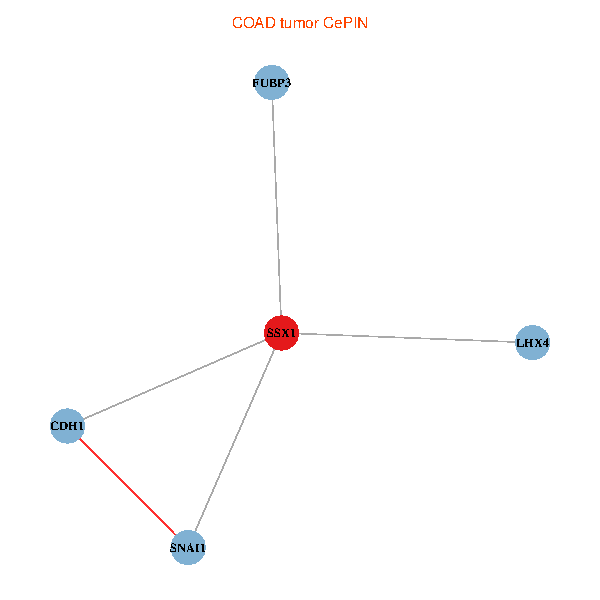
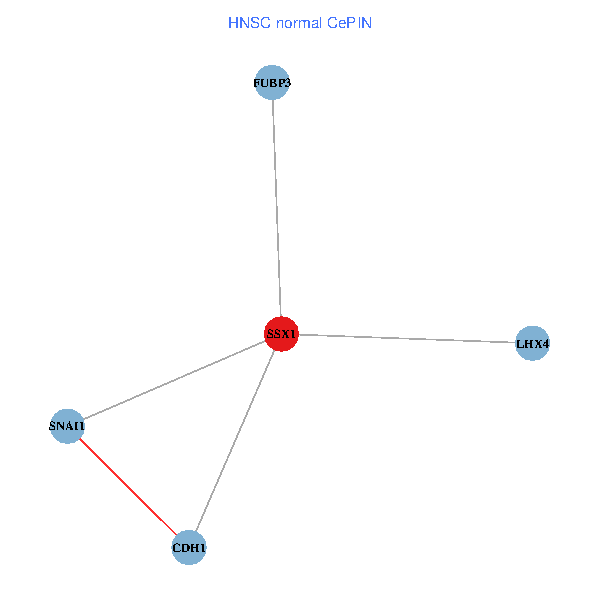
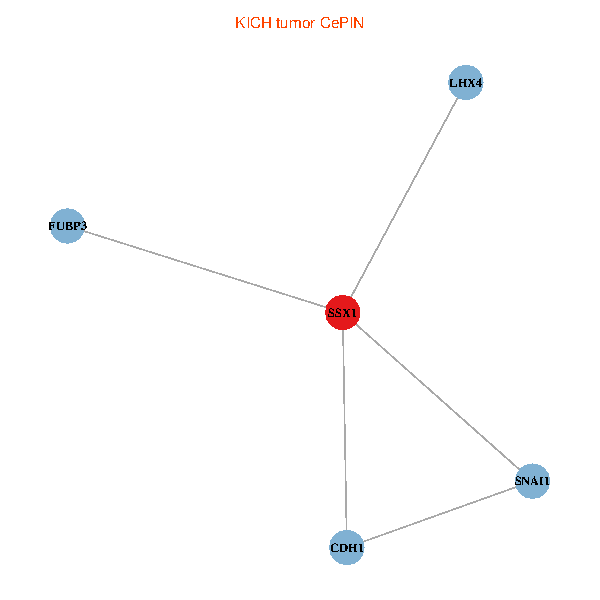
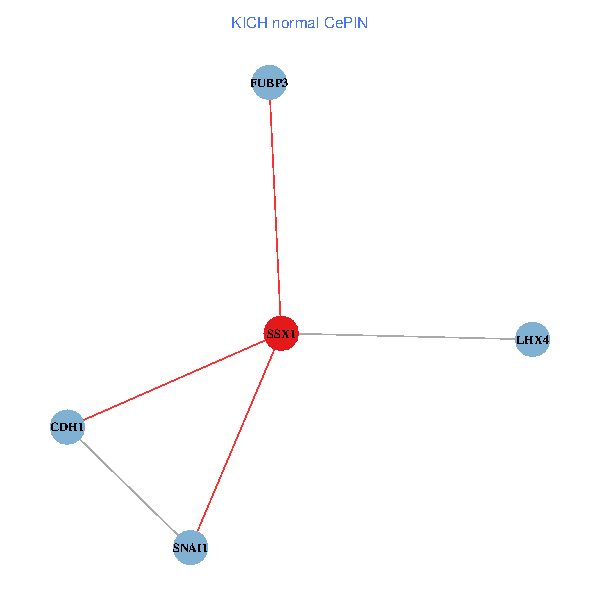
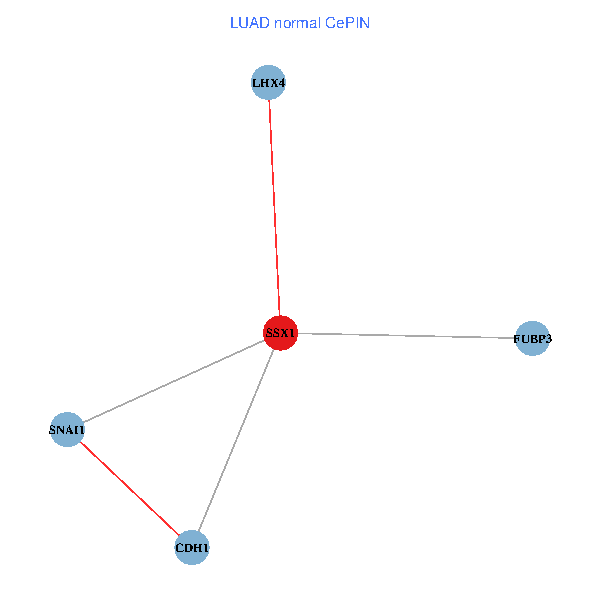
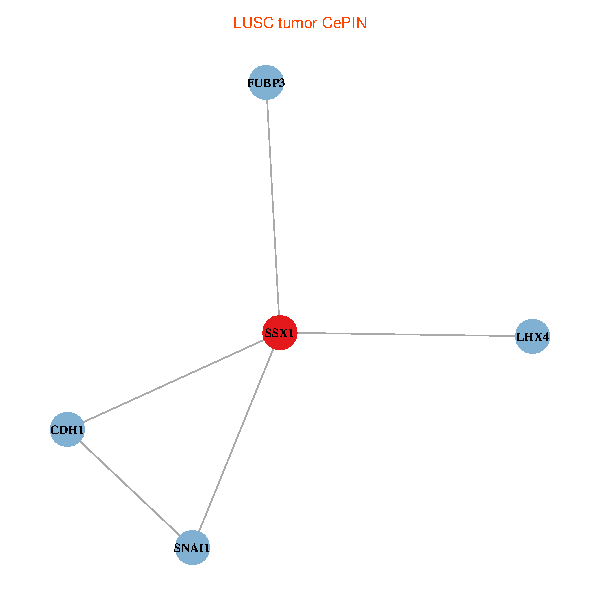
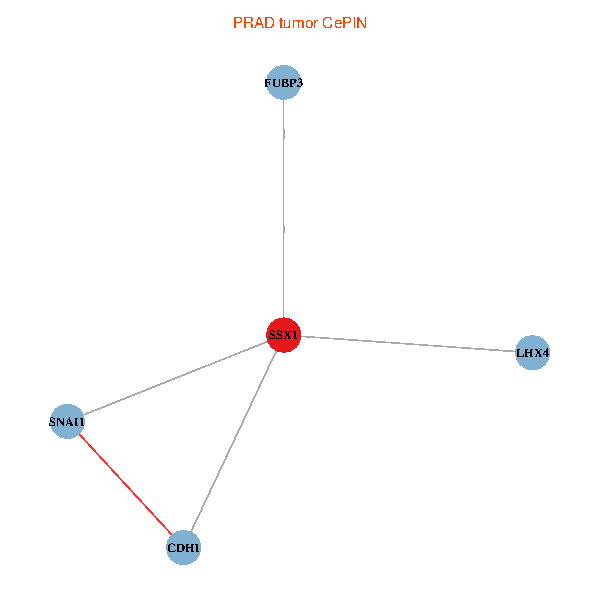
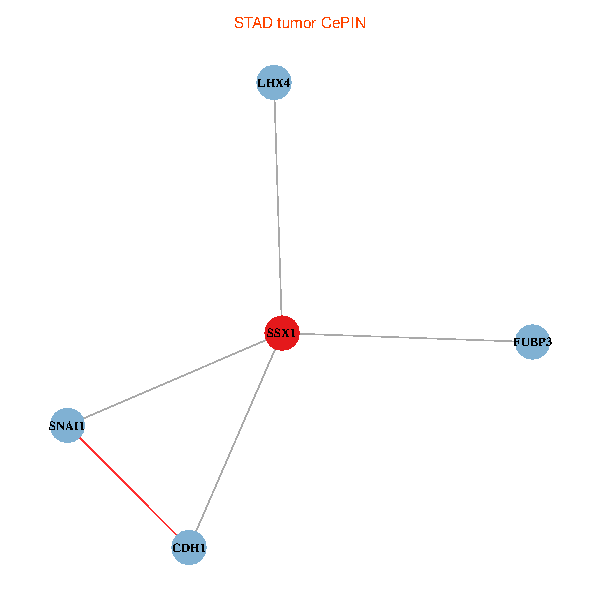
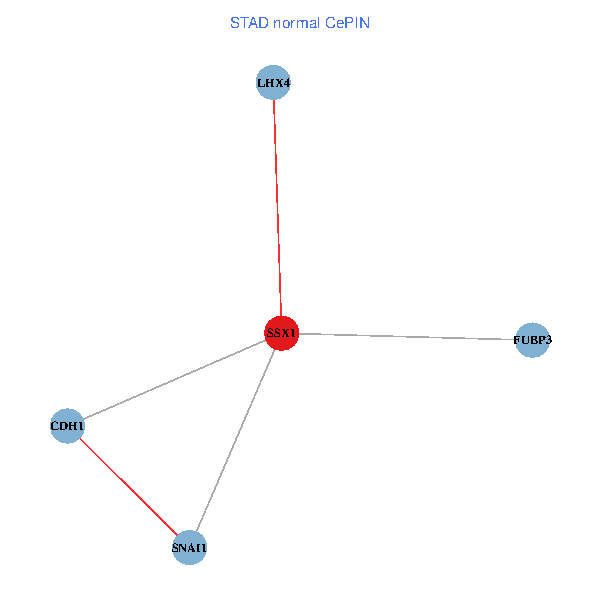
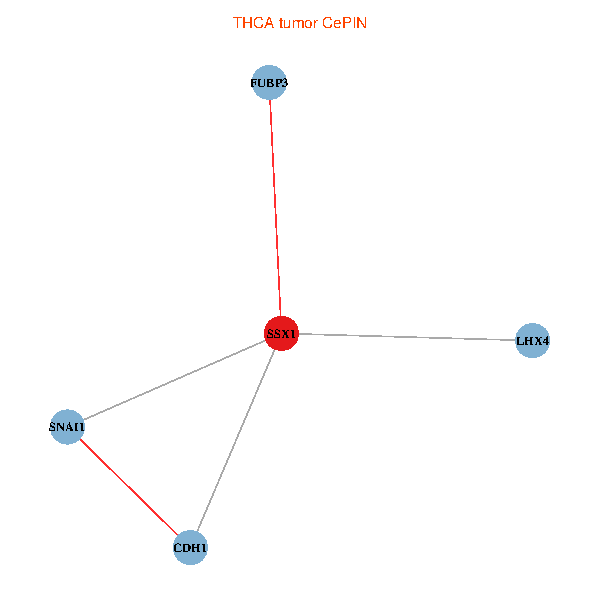
| Co-expressed gene networks based on protein-protein interaction data (CePIN) (TCGA IlluminaHiSeq_RNASeqV2, pan-cancer normalized log2(norm_counts+1) data, version 2016-08-16) (PINA2 ppi data) |
| BRCA (tumor) | BRCA (normal) |
| SSX1, SNAI1, CDH1, FUBP3, LHX4 (tumor) | SSX1, SNAI1, CDH1, FUBP3, LHX4 (normal) |
 |  |
| COAD (tumor) | COAD (normal) |
| SSX1, SNAI1, CDH1, FUBP3, LHX4 (tumor) | SSX1, SNAI1, CDH1, FUBP3, LHX4 (normal) |
 |  |
| HNSC (tumor) | HNSC (normal) |
| SSX1, SNAI1, CDH1, FUBP3, LHX4 (tumor) | SSX1, SNAI1, CDH1, FUBP3, LHX4 (normal) |
 |  |
| KICH (tumor) | KICH (normal) |
| SSX1, SNAI1, CDH1, FUBP3, LHX4 (tumor) | SSX1, SNAI1, CDH1, FUBP3, LHX4 (normal) |
 |  |
| KIRC (tumor) | KIRC (normal) |
| SSX1, SNAI1, CDH1, FUBP3, LHX4 (tumor) | SSX1, SNAI1, CDH1, FUBP3, LHX4 (normal) |
 |  |
| KIRP (tumor) | KIRP (normal) |
| SSX1, SNAI1, CDH1, FUBP3, LHX4 (tumor) | SSX1, SNAI1, CDH1, FUBP3, LHX4 (normal) |
 |  |
| LIHC (tumor) | LIHC (normal) |
| SSX1, SNAI1, CDH1, FUBP3, LHX4 (tumor) | SSX1, SNAI1, CDH1, FUBP3, LHX4 (normal) |
 |  |
| LUAD (tumor) | LUAD (normal) |
| SSX1, SNAI1, CDH1, FUBP3, LHX4 (tumor) | SSX1, SNAI1, CDH1, FUBP3, LHX4 (normal) |
 |  |
| LUSC (tumor) | LUSC (normal) |
| SSX1, SNAI1, CDH1, FUBP3, LHX4 (tumor) | SSX1, SNAI1, CDH1, FUBP3, LHX4 (normal) |
 |  |
| PRAD (tumor) | PRAD (normal) |
| SSX1, SNAI1, CDH1, FUBP3, LHX4 (tumor) | SSX1, SNAI1, CDH1, FUBP3, LHX4 (normal) |
 |  |
| STAD (tumor) | STAD (normal) |
| SSX1, SNAI1, CDH1, FUBP3, LHX4 (tumor) | SSX1, SNAI1, CDH1, FUBP3, LHX4 (normal) |
 |  |
| THCA (tumor) | THCA (normal) |
| SSX1, SNAI1, CDH1, FUBP3, LHX4 (tumor) | SSX1, SNAI1, CDH1, FUBP3, LHX4 (normal) |
 |  |
| Top |
| TissGeneProg for SSX1 |
| Kaplan-Meier plots with logrank tests of overall survival (OS) using 28 cancer types (TCGA IlluminaHiSeq_RNASeqV2, pan-cancer normalized log2(norm_counts+1) data, version 2016-08-16) (TCGA clinicalMatrix, phenotype data, version 2016-04-27) * Click on the image to enlarge it in a new window. |
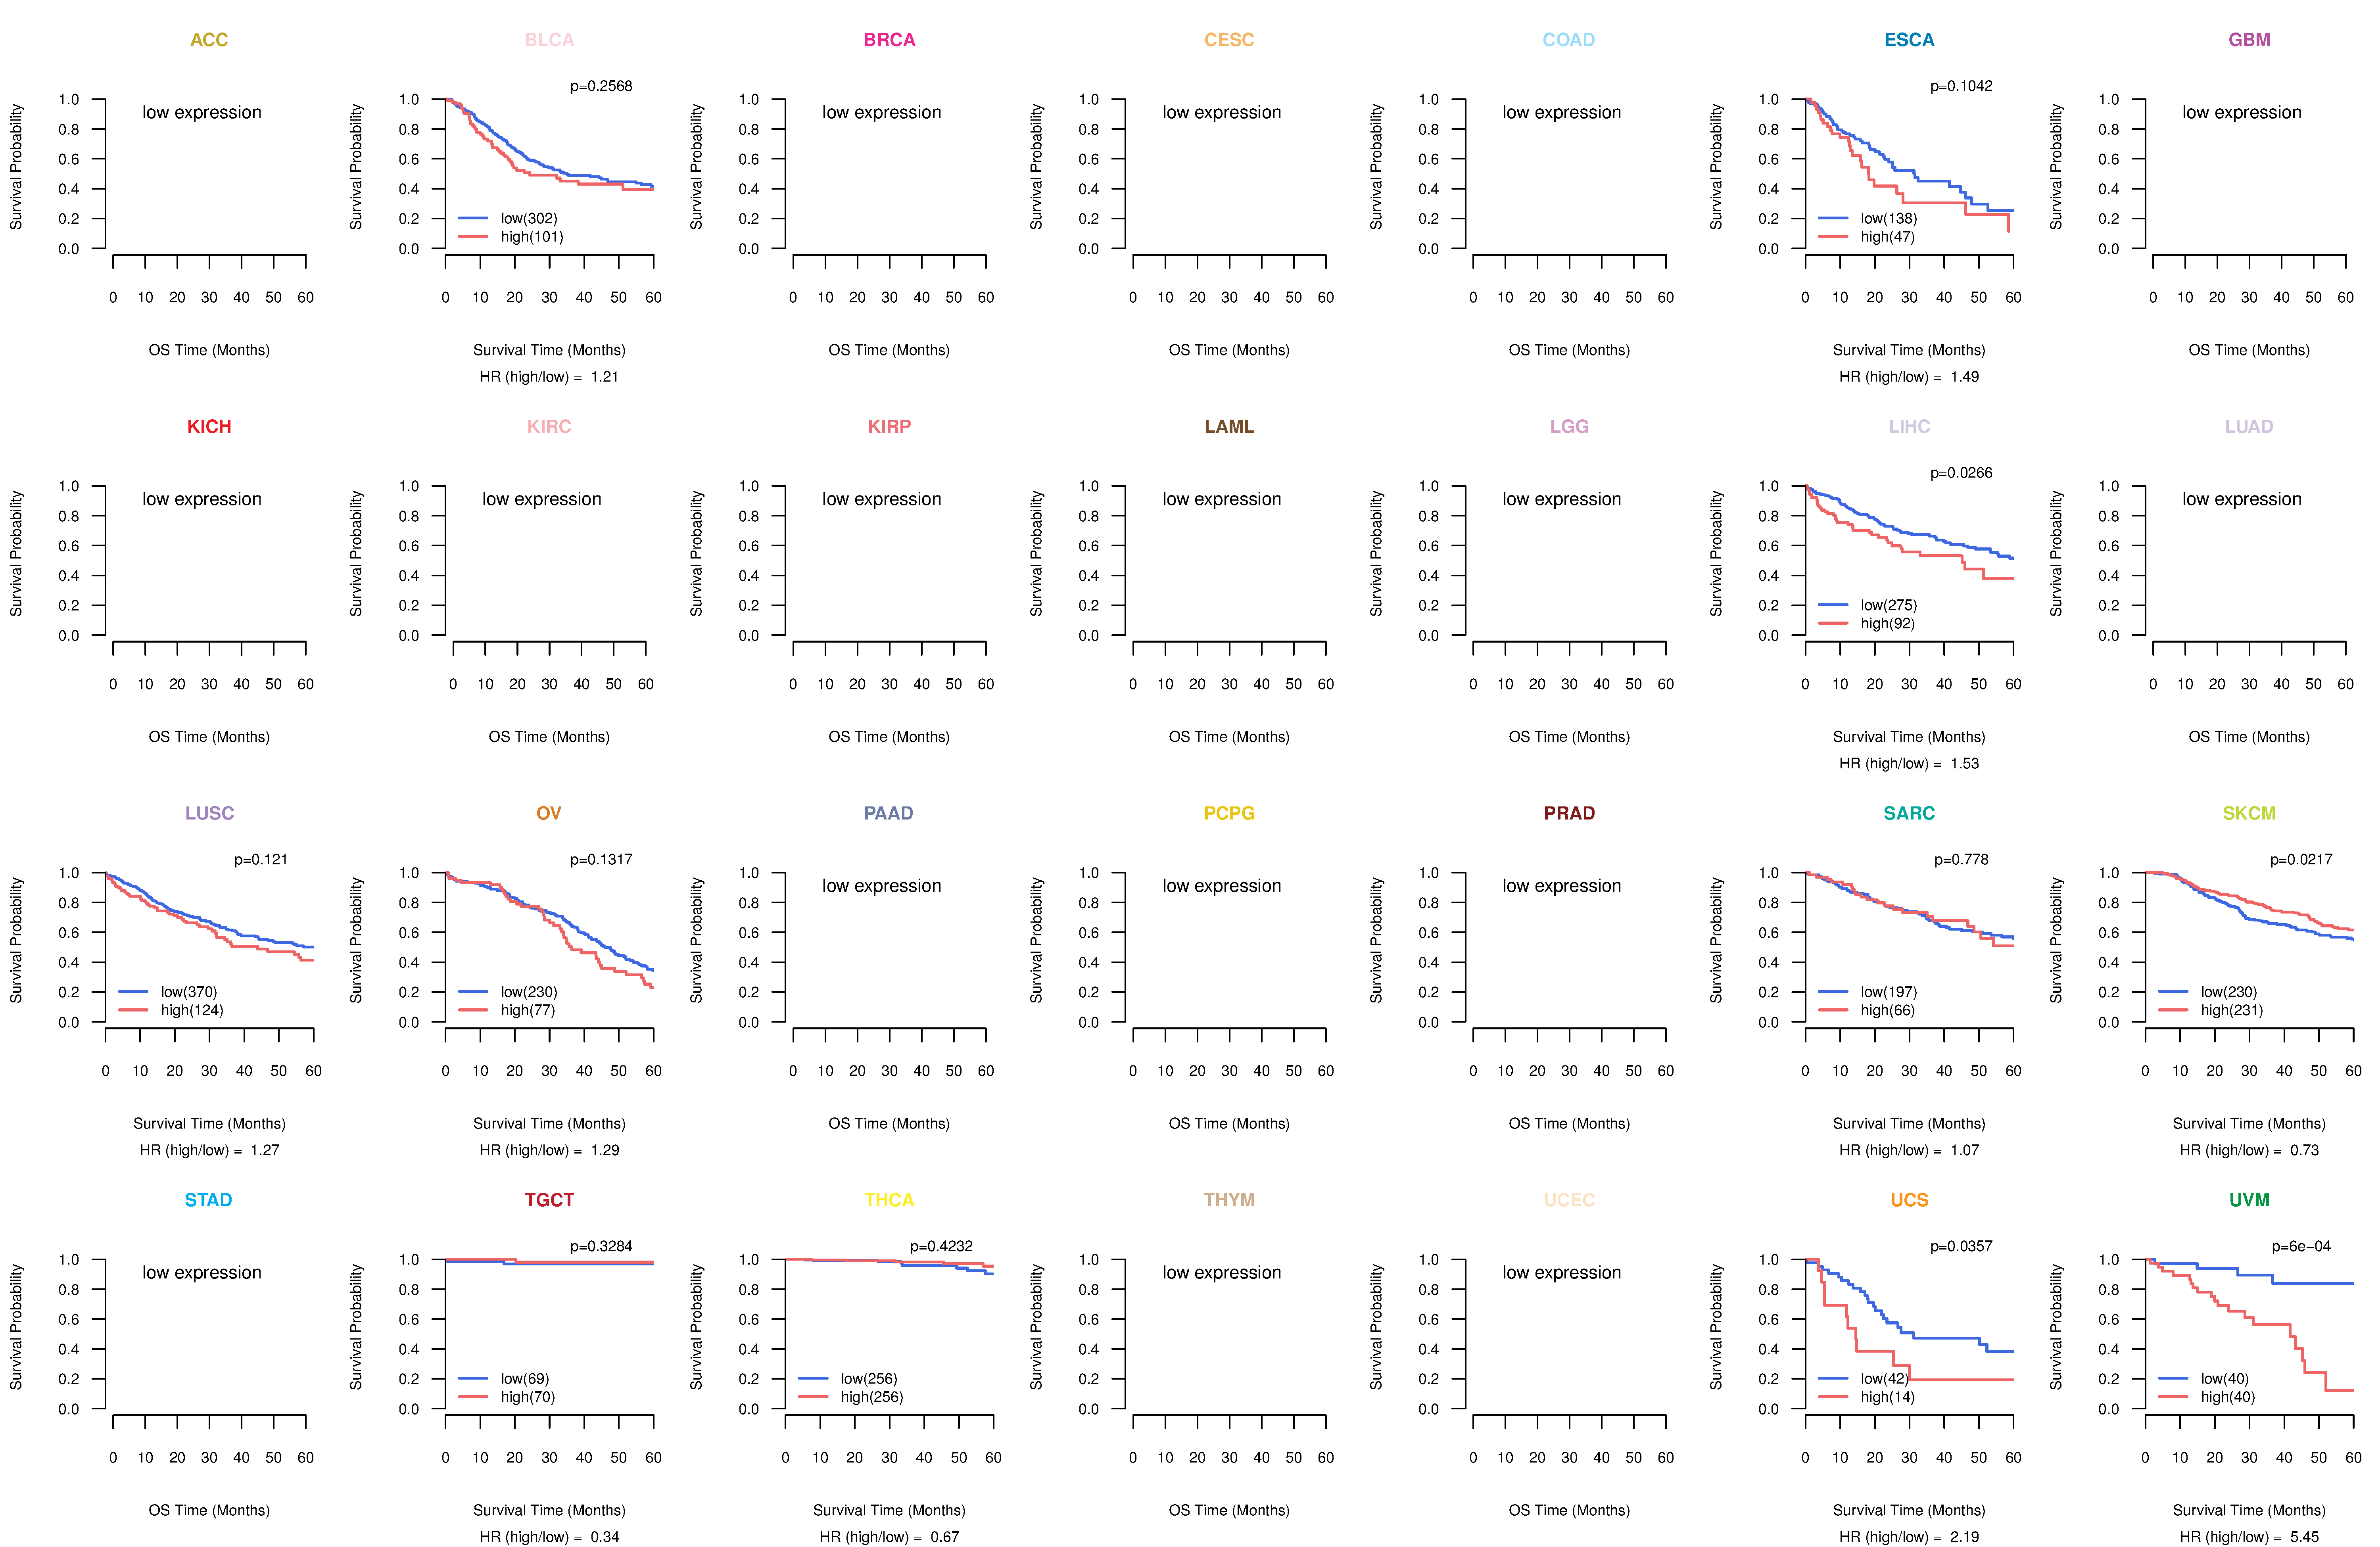 |
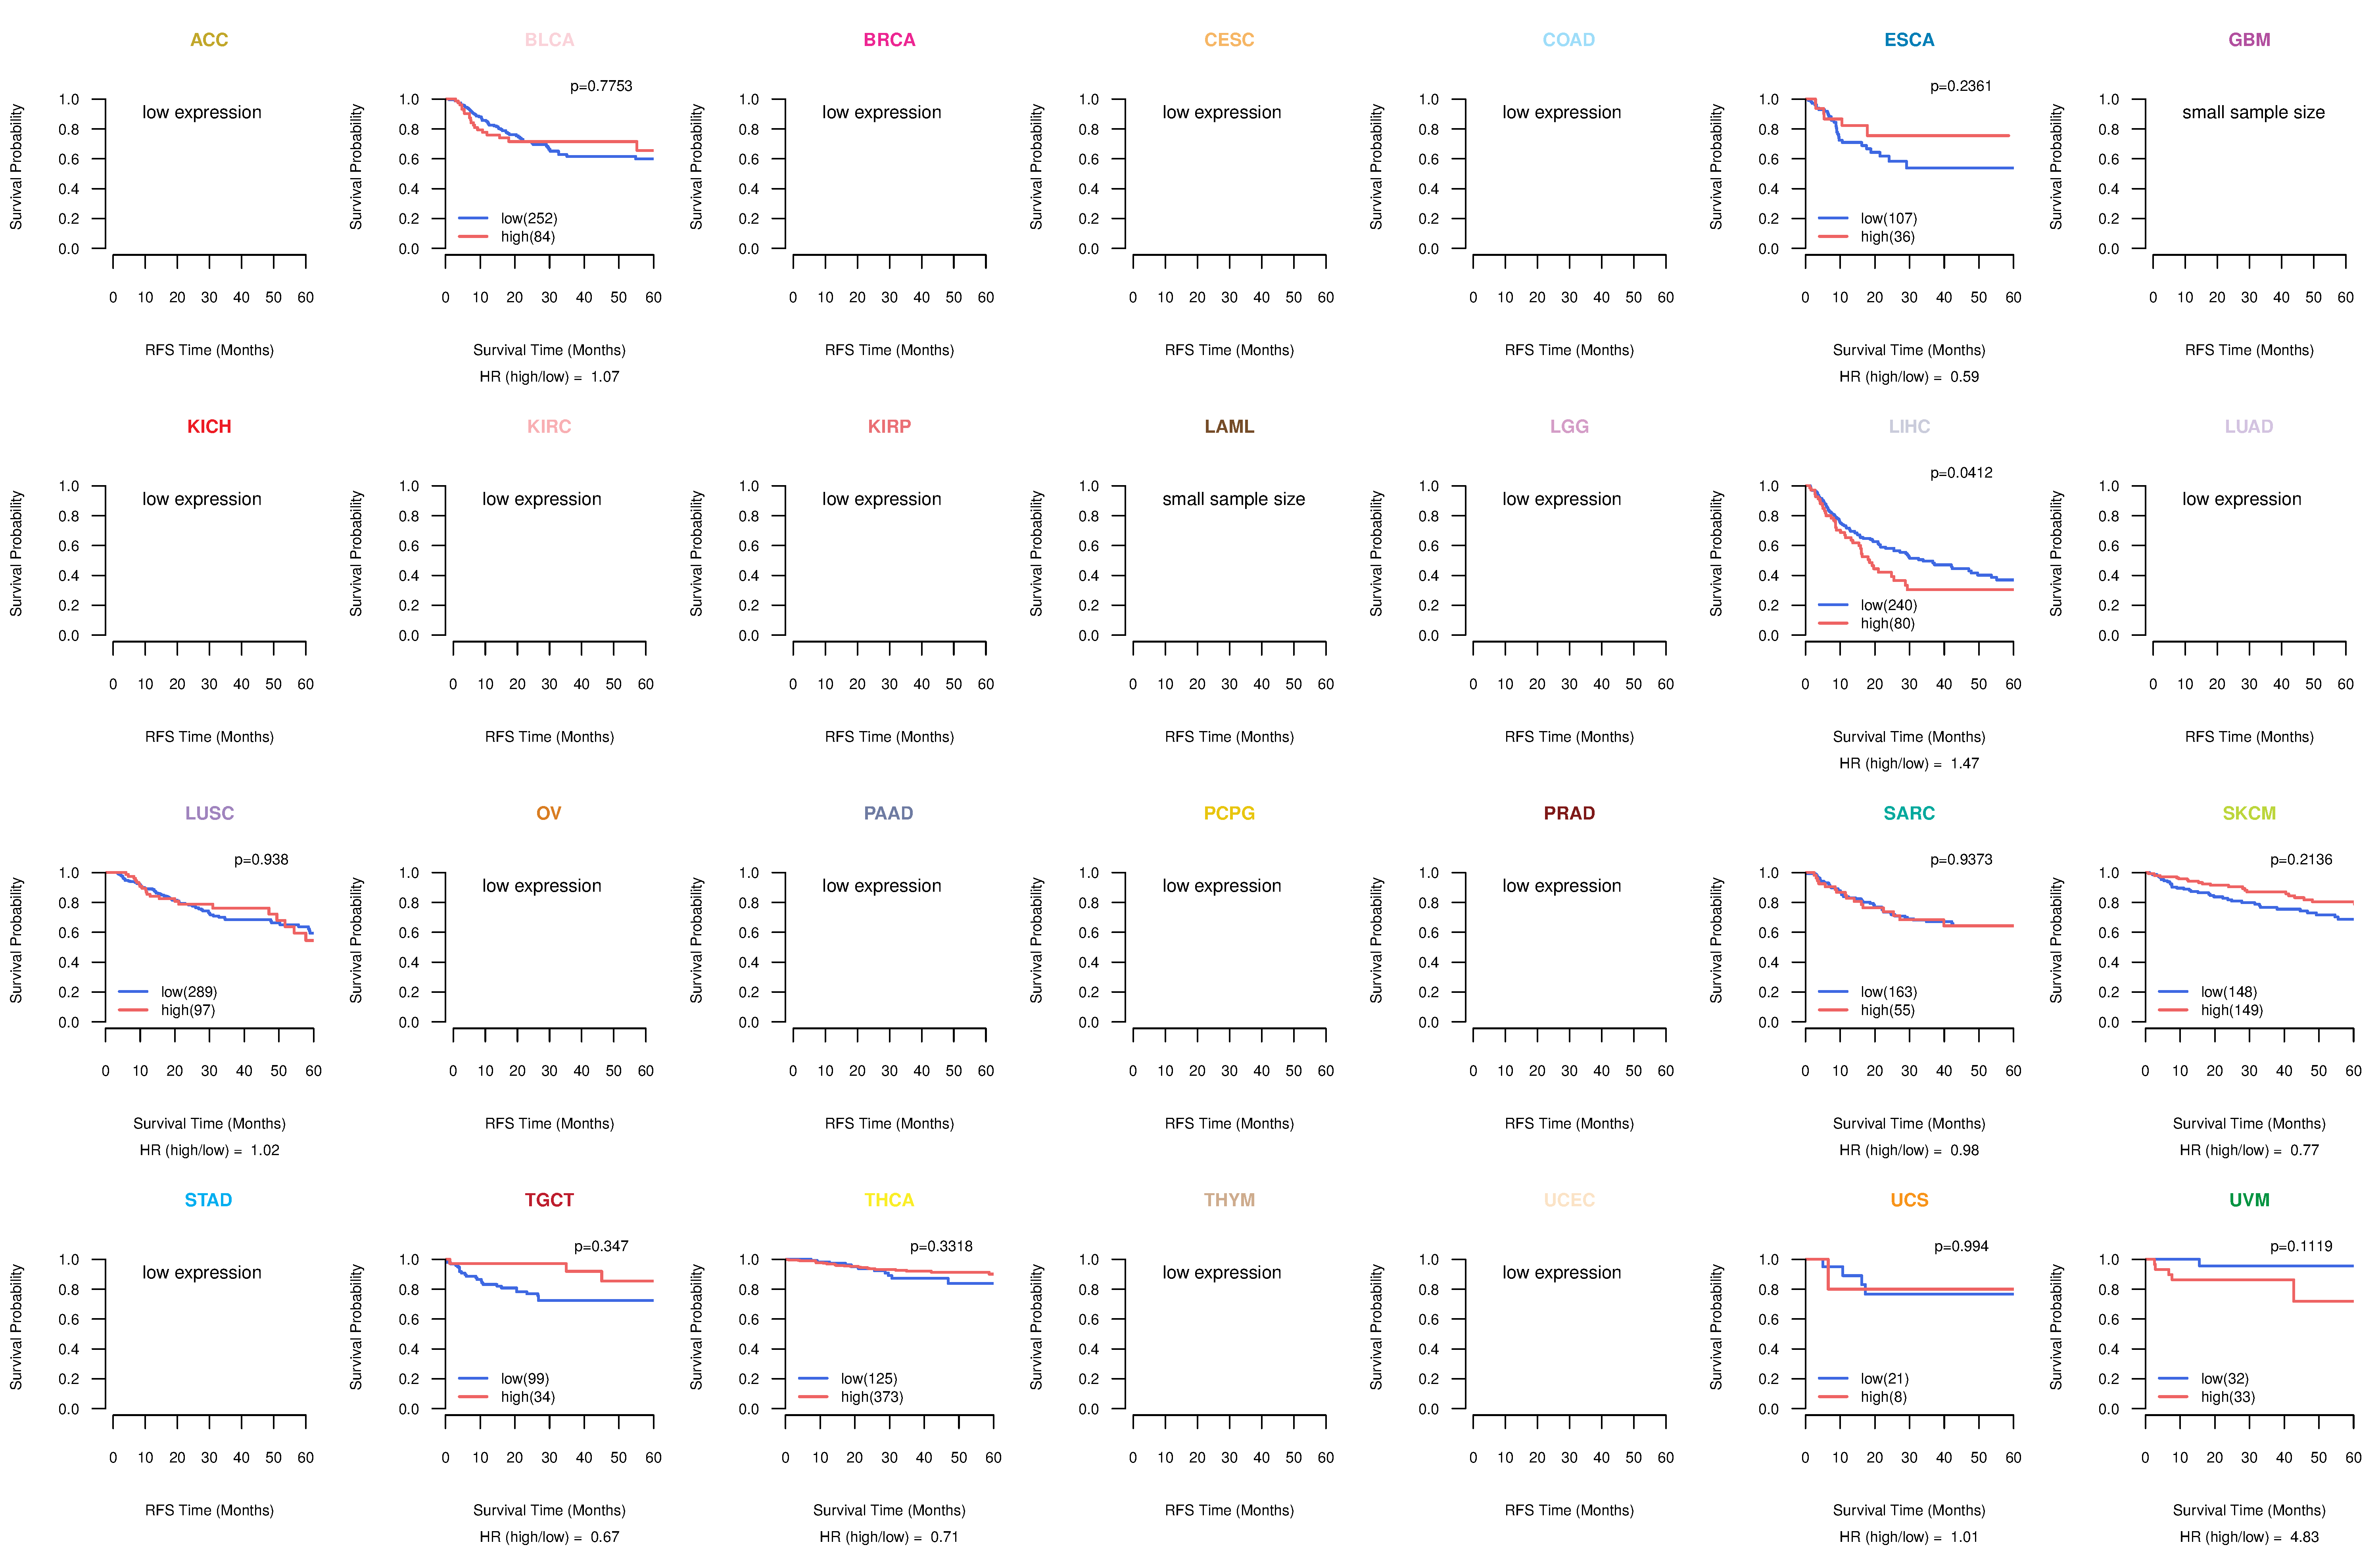
| Kaplan-Meier plots with logrank test of relapse free survival (RFS) using 28 cancer types (TCGA IlluminaHiSeq_RNASeqV2, pan-cancer normalized log2(norm_counts+1) data, version 2016-08-16) (TCGA clinicalMatrix, phenotype data, version 2016-04-27) * Click on the image enlarge it in a new window. |
 |
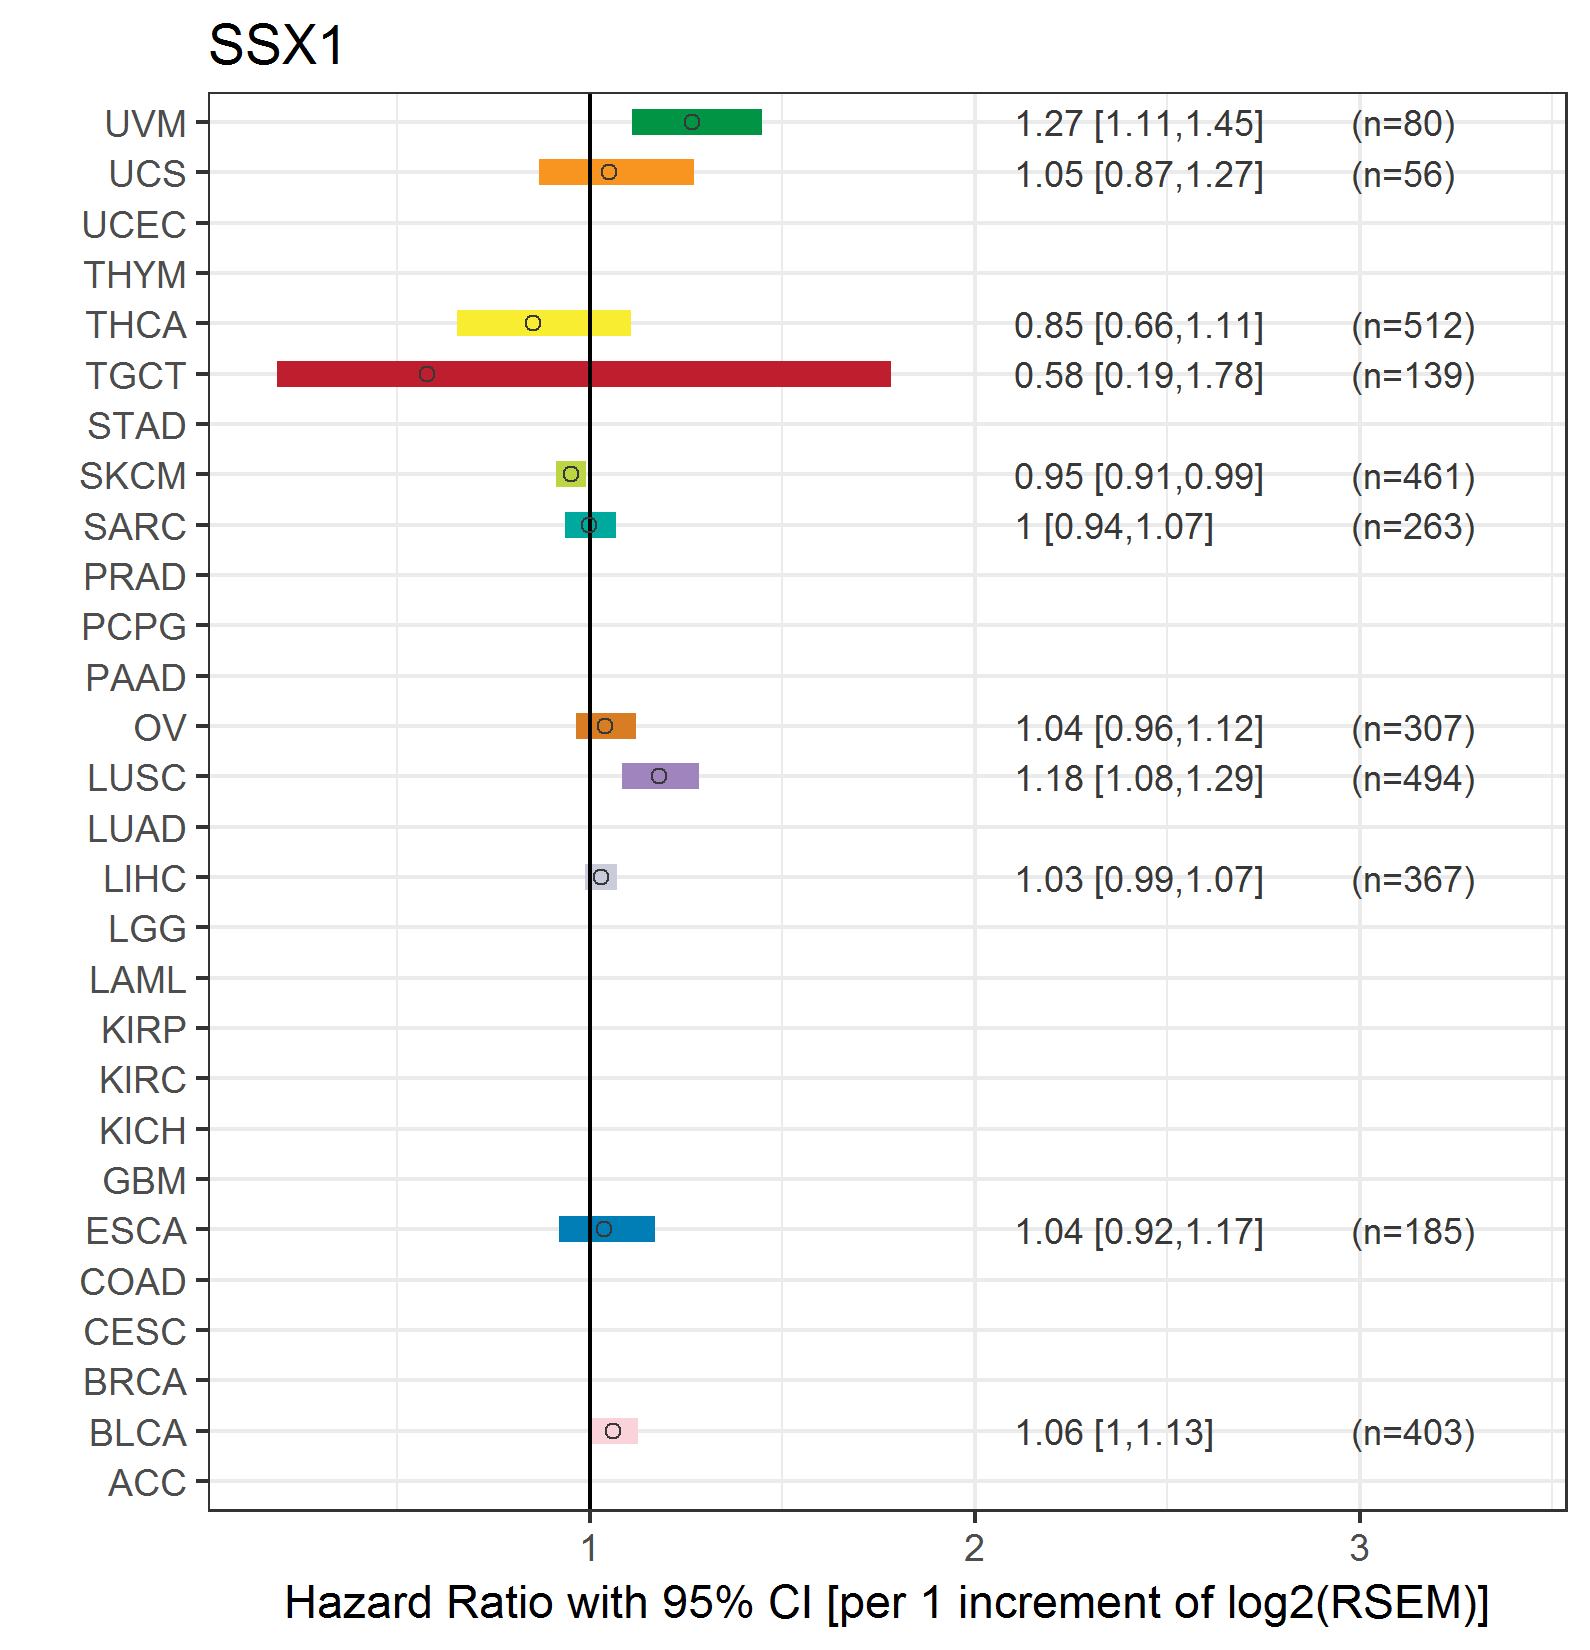
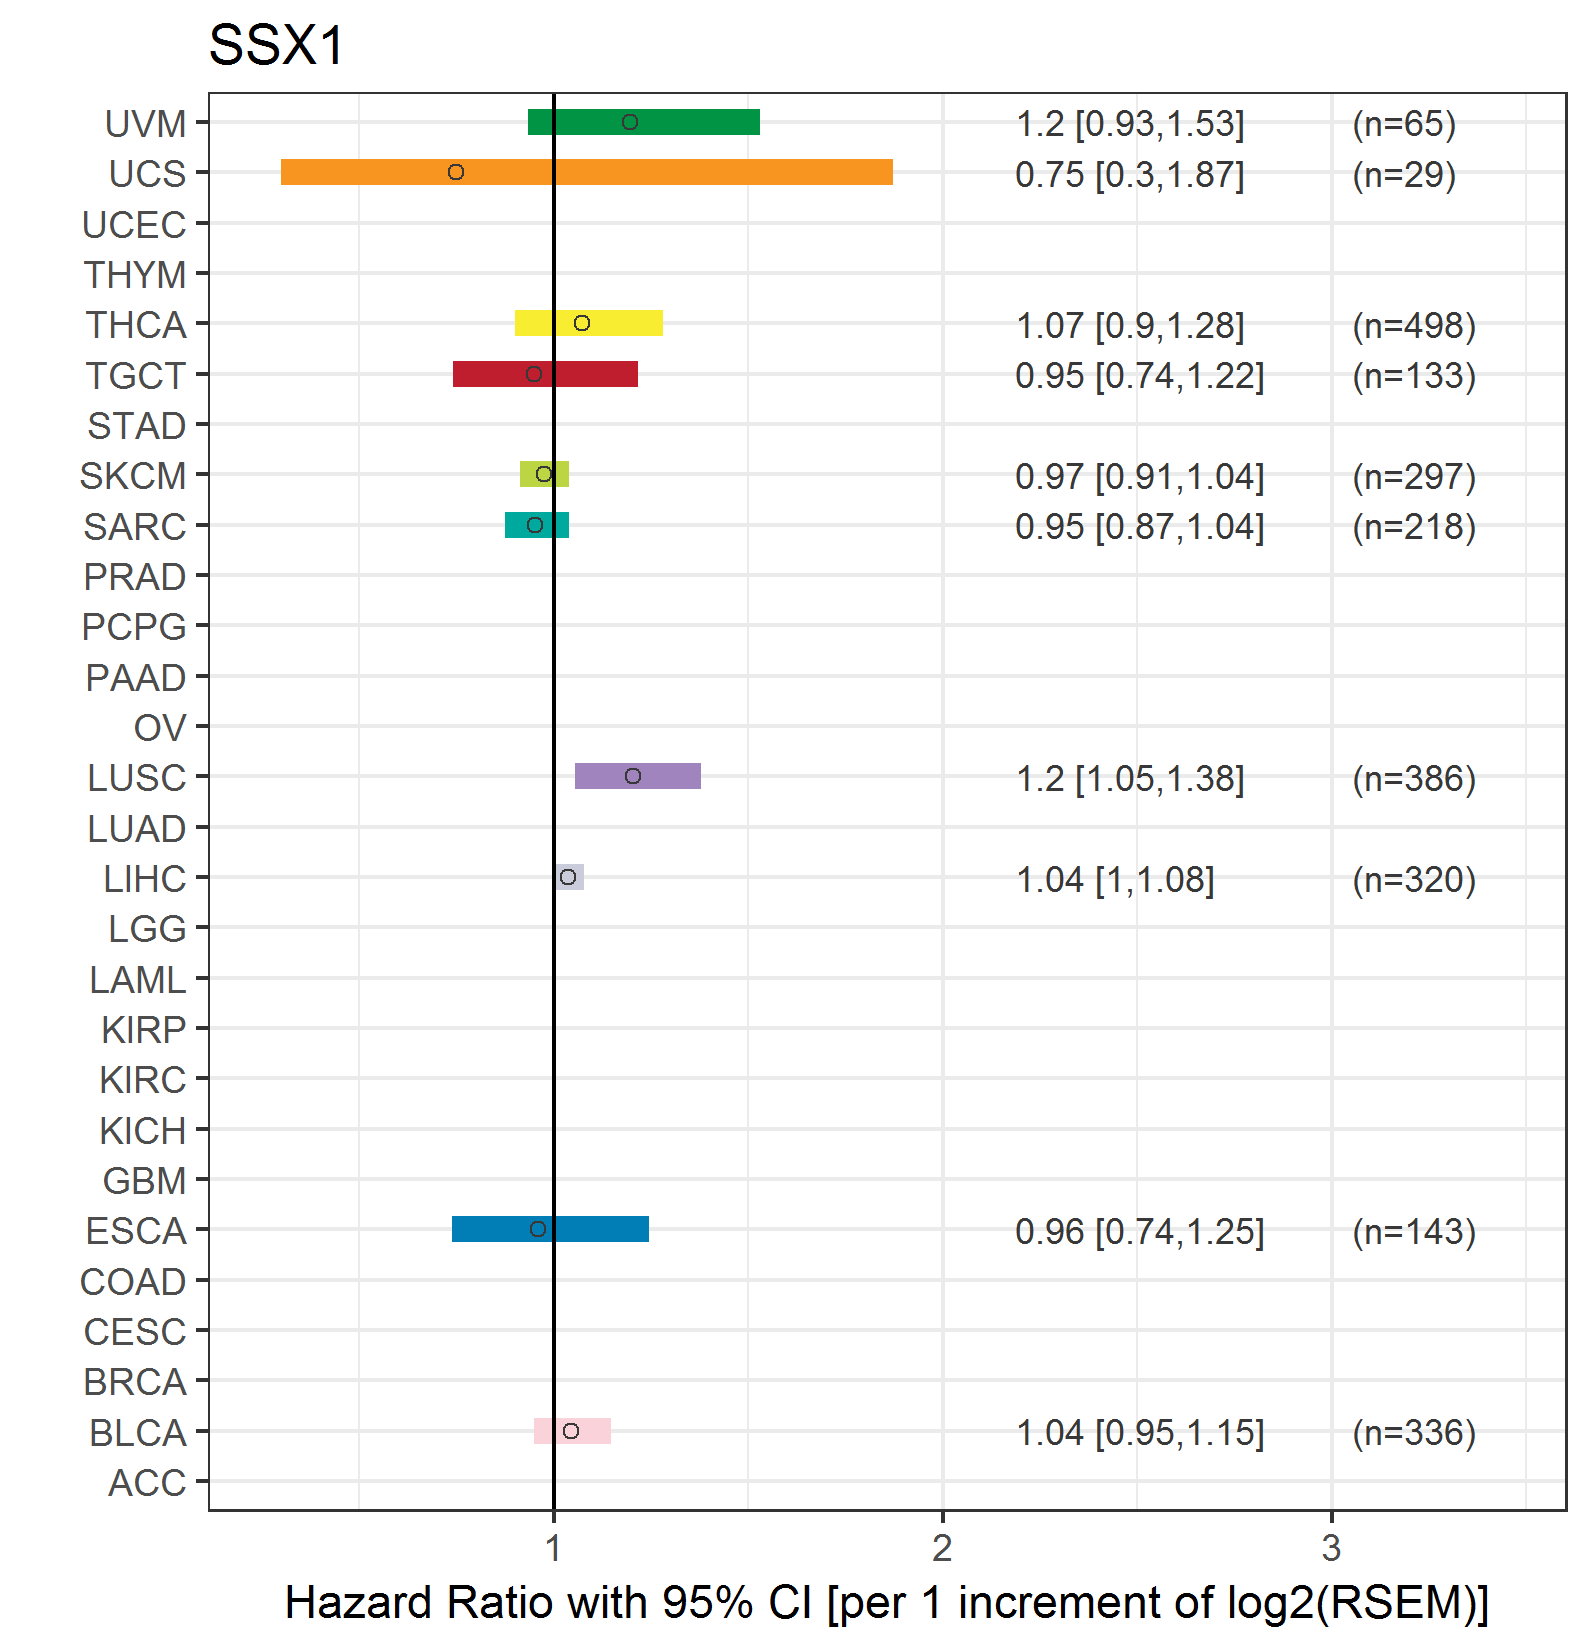
| Forest plot of Cox proportional hazard ratio (HR) and 95% CI of overall survival (OS) using 28 cancer types (TCGA IlluminaHiSeq_RNASeqV2, pan-cancer normalized log2(norm_counts+1) data, version 2016-08-16) (TCGA clinicalMatrix, phenotype data, version 2016-04-27) * Click on the image enlarge it in a new window. |
 |
| Forest plot of Cox proportional hazard ratio (HR) and 95% CI of relapse free survival (RFS) using 28 cancer types (TCGA IlluminaHiSeq_RNASeqV2, pan-cancer normalized log2(norm_counts+1) data, version 2016-08-16) (TCGA clinicalMatrix, phenotype data, version 2016-04-27) * Click on the image enlarge it in a new window. |
 |
| Top |
| TissGeneClin for SSX1 |
| TissGeneDrug for SSX1 |
| Drug information targeting TissGene (DrugBank Version 5.0.6, 2017-04-01) |
| DrugBank ID | Drug name | Drug activity | Drug type | Drug status |
| Top |
| TissGeneDisease for SSX1 |
| Disease information associated with TissGene (DisGeNet, 2016-06-01) |
| Disease ID | Disease name | # pubmeds | Source |
| umls:C0039101 | synovial sarcoma | 57 | BeFree,CTD_human,LHGDN,ORPHANET |
| umls:C0027627 | Neoplasm Metastasis | 8 | BeFree |
| umls:C2239176 | Liver carcinoma | 5 | BeFree |
| umls:C0153594 | Malignant neoplasm of testis | 4 | BeFree |
| umls:C1261473 | Sarcoma | 4 | BeFree |
| umls:C0025202 | melanoma | 3 | BeFree |
| umls:C0026764 | Multiple Myeloma | 2 | BeFree |
| umls:C0002395 | Alzheimer's Disease | 1 | GAD |
| umls:C0023418 | leukemia | 1 | BeFree |
| umls:C0026470 | Monoclonal Gammopathy of Undetermined Significance | 1 | BeFree |
| umls:C0031117 | Peripheral Neuropathy | 1 | CTD_human |
| umls:C0334507 | Synovial sarcoma, biphasic | 1 | BeFree |
| umls:C0596263 | Carcinogenesis | 1 | BeFree |
| umls:C1334699 | Mesenchymal Cell Neoplasm | 1 | BeFree |
| umls:C1520166 | Xenograft Model | 1 | BeFree |
|
Copyright 2016-Present - The University of Texas Health Science Center at Houston (UTHealth) Web File Viewing | How to Report, Fraud, Waste and Abuse | State of Texas | Statewide Search | Texas Homeland Security | Site Policies |