 |
| |
| |
| |
| |
| |
| |
|

| TissGeneSummary for TFF2 |
 Gene summary Gene summary |
| Basic gene information | Gene symbol | TFF2 |
| Gene name | trefoil factor 2 | |
| Synonyms | SML1|SP | |
| Cytomap | UCSC genome browser: 21q22.3 | |
| Type of gene | protein-coding | |
| RefGenes | NM_005423.4, | |
| Description | spasmolysinspasmolytic polypeptidespasmolytic protein 1 | |
| Modification date | 20141222 | |
| dbXrefs | MIM : 182590 | |
| HGNC : HGNC | ||
| Ensembl : ENSG00000160181 | ||
| HPRD : 01682 | ||
| Vega : OTTHUMG00000086797 | ||
| Protein | UniProt: go to UniProt's Cross Reference DB Table | |
| Expression | CleanEX: HS_TFF2 | |
| BioGPS: 7032 | ||
| Pathway | NCI Pathway Interaction Database: TFF2 | |
| KEGG: TFF2 | ||
| REACTOME: TFF2 | ||
| Pathway Commons: TFF2 | ||
| Context | iHOP: TFF2 | |
| ligand binding site mutation search in PubMed: TFF2 | ||
| UCL Cancer Institute: TFF2 | ||
| Assigned class in TissGDB* | C | |
| Included tissue-specific gene expression resources | TiGER,GTEx | |
| Specific-tissues in normal samples (assigned by TissGDB using HPA, TiGER, and GTEx) | Stomach | |
| Cancer types related to the specific-tissues in cancer samples (assigned by TissGDB using TCGA) | STAD | |
| Reference showing the relevant tissue of TFF2 | ||
| Description by TissGene annotations | ||
| * Class A consists of genes with literature evidence and is part of the cTissGenes. Class B consists of only cTissGenes without additional evidence. The remaining genes belong to Class C. |
| Gene ontology having evidence of Inferred from Direct Assay (IDA) from Entrez |
| GO ID | GO term | PubMed ID |
| Top |
| TissGeneExp for TFF2 |
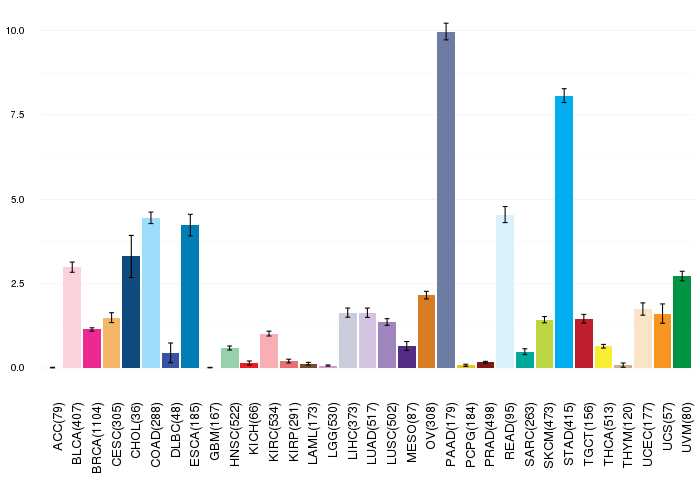
| Gene expressions across 28 cancer types (X-axis: cancer type and Y-axis: log2(norm_counts+1)) (TCGA IlluminaHiSeq_RNASeqV2, pan-cancer normalized log2(norm_counts+1) data, version 2016-08-16) |
 |
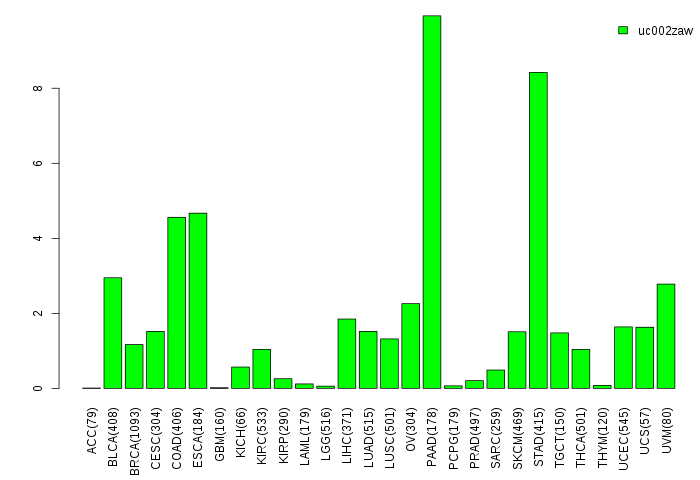
| Gene isoform expressions across 28 cancer types (X-axis: cancer type and Y-axis: log2(norm_counts+1)) (TCGA pan-cancer tcga_rsem_isoform_tpm, version 2016-09-01) |
 |
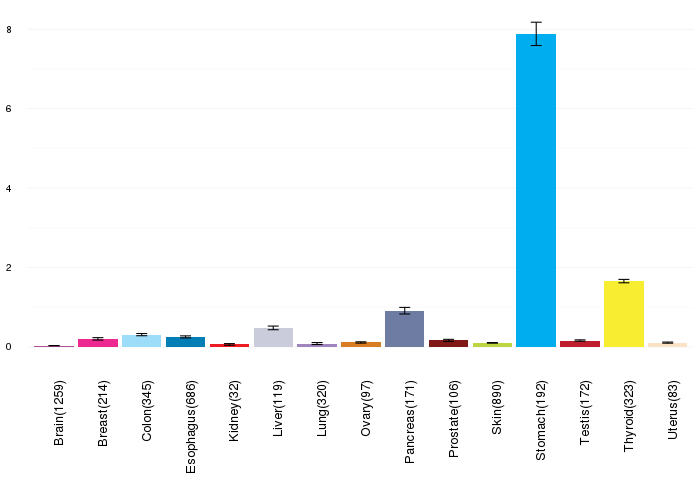
| Gene expressions across normal tissues of GTEx data (GTEx GTEx_Analysis_v6_RNA-seq_RNA-SeQCv1.1.8_gene_rpkm.gct) - Here, we shows the matched tissue types only among our 28 cancer types. |
 |
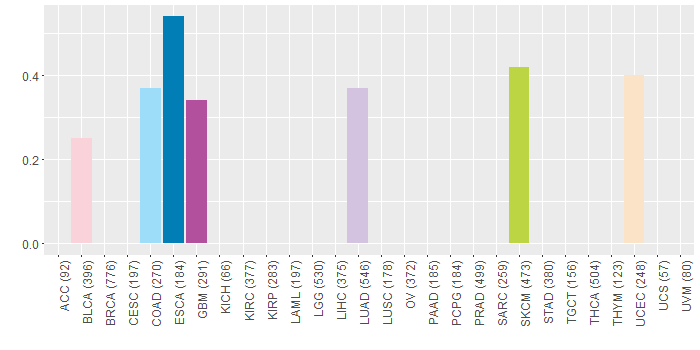
| Different expressions across 14 cancer types with more than 10 samples between matched tumors and normals (X-axis: cancer type and Y-axis: log2(norm_counts+1)) (TCGA IlluminaHiSeq_RNASeqV2, pan-cancer normalized log2(norm_counts+1) data, version 2016-08-16) |
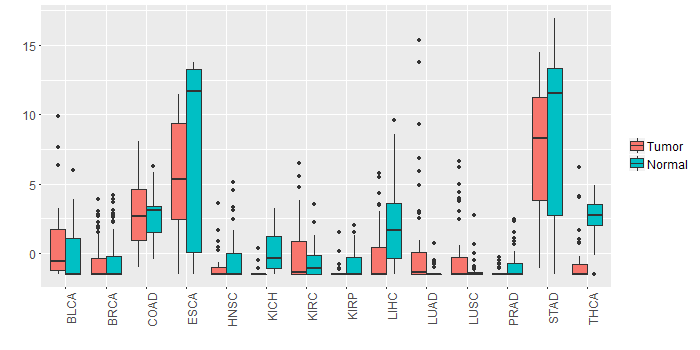 |
| - Significantly differentially expressed cancer types and information. (|Fold change|>1 and FDR<0.05) |
| Cancer type | Mean(exp) in tumor | Mean(exp) in matched normal | Log2FC | P-val. | FDR |
| THCA | -0.841905271 | 2.655776085 | -3.497681356 | 2.45E-25 | 4.17E-23 |
| LUSC | -0.238528069 | -1.245841794 | 1.007313725 | 0.00383 | 0.006544127 |
| LUAD | 0.325958172 | -1.378943552 | 1.704901724 | 0.000734 | 0.001628449 |
| LIHC | -0.139044932 | 1.920739068 | -2.059784 | 8.58E-05 | 0.000300097 |
| KICH | -1.359336932 | 0.045591068 | -1.404928 | 4.07E-05 | 0.000114709 |
| Top |
| TissGene-miRNA for TFF2 |
| Significantly anti-correlated miRNAs of TissGene across 28 cancer types (Gene-miRNA relations from TargetScanHuman Relsease 7.1, Conserved_Site_Context_Scores.txt.zip, 06.01.2016) (TCGA IlluminaHiSeq_miRNASeq, log2(RPM+1) data, version 2016-11-21) (TCGA IlluminaHiSeq_RNASeqV2, log2(normalized_count+1) data, version 2016-08-16) (Spearman’s Rank Correlation (p-value<0.05 and coefficient<-0.25)) |
| Cancer type | miRNA id | miRNA accession | P-val. | Coeff. | # samples |
| Top |
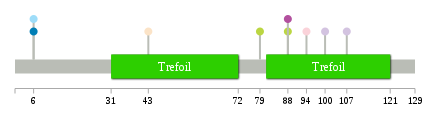
| TissGeneMut for TFF2 |
| TissGeneSNV for TFF2 |
| nsSNV counts per each loci. Different colors of circles represent different cancer types. Circle size denotes number of samples. (TCGA somatic mutation (SNPs and small INDELs) data, version 2016-04-25) * Click on the image to enlarge it in a new window. |
 |
 |
| Somatic nucleotide variants of TissGene across 28 cancer types (X-axis: cancer type and Y-axis: % of mutated samples) The numbers in parentheses are numbers of samples with mutation (nsSNVs). (TCGA somatic mutation (SNPs and small INDELs) data, version 2016-04-25) |
 |
| - nsSNVs sorted by frequency. |
| AAchange | Cancer type | # samples |
| p.P94R | BLCA | 1 |
| p.A6T | ESCA | 1 |
| p.C107F | LUAD | 1 |
| p.R88Q | SKCM | 1 |
| p.R88Q | GBM | 1 |
| p.D79N | SKCM | 1 |
| p.R4X | READ | 1 |
| p.G43S | UCEC | 1 |
| p.E100K | LUAD | 1 |
| p.A6T | COAD | 1 |
| Top |
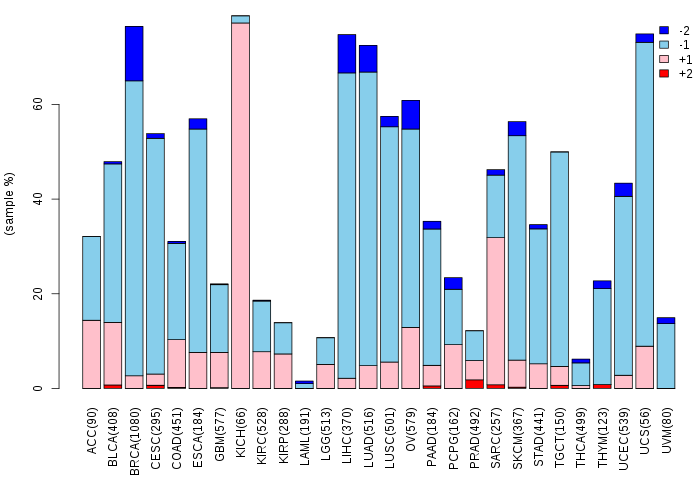
| TissGeneCNV for TFF2 |
| Copy number variations of TissGene across 28 cancer types (X-axis: cancer type and Y-axis: % of CNV samples) (TCGA Gistic2_CopyNumber_Gistic2_all_data_by_genes, Gistic2 copy number data, version 2016-08-16) |
 |
| Top |
| TissGeneFusions for TFF2 |
| Fusion genes including TissGene (ChimerDB 3.0, 2016-12-01 and TCGA fusion Portal 2015-12-01) |
| Database | Src | Cancer type | Sample | Fusion gene | ORF | 5'-gene BP | 3'-gene BP |
| Top |
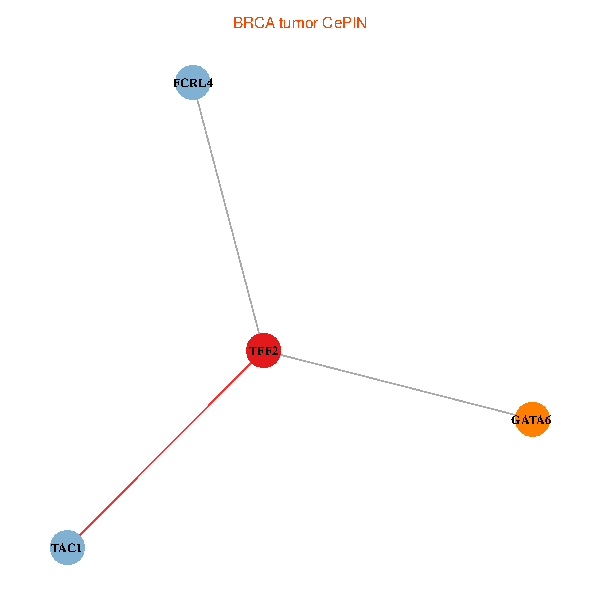
| TissGeneNet for TFF2 |
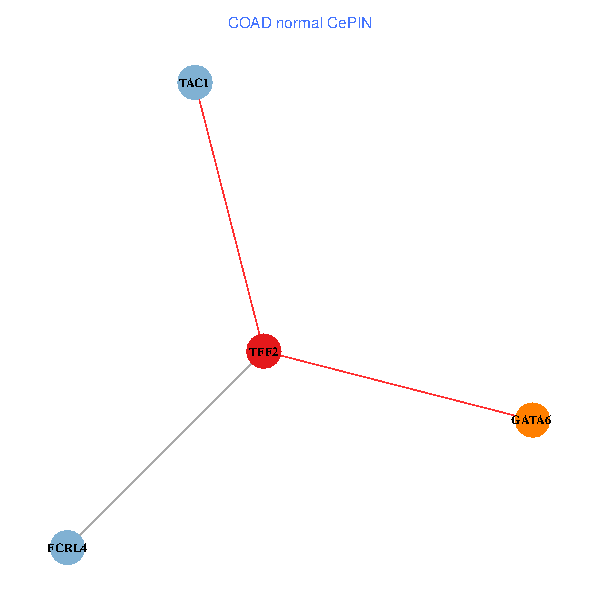
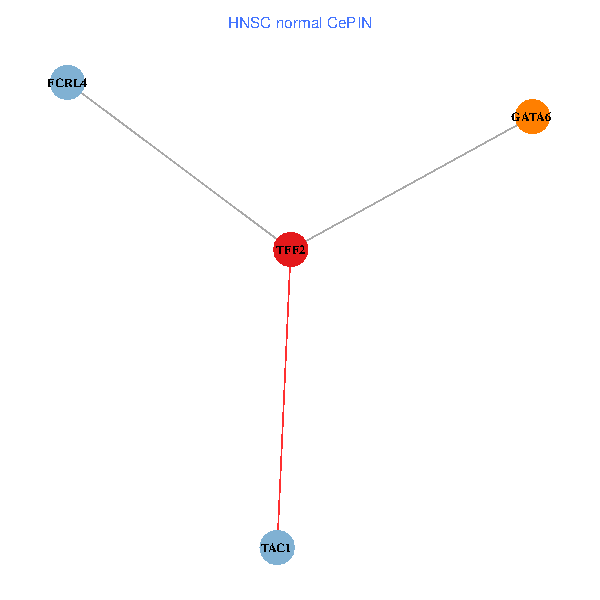
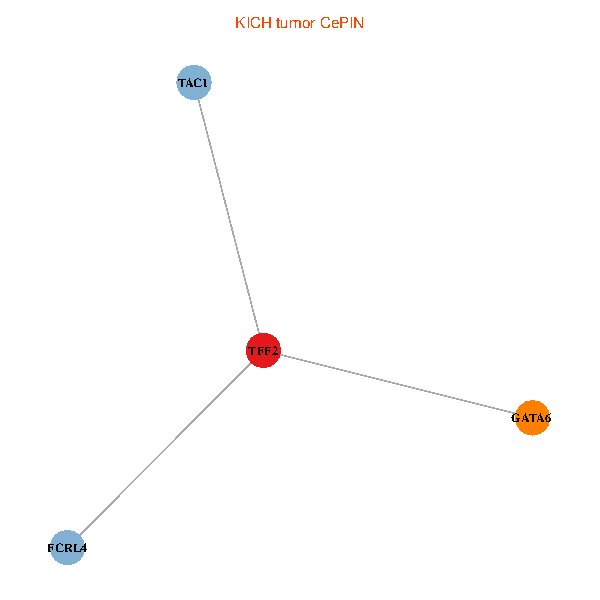
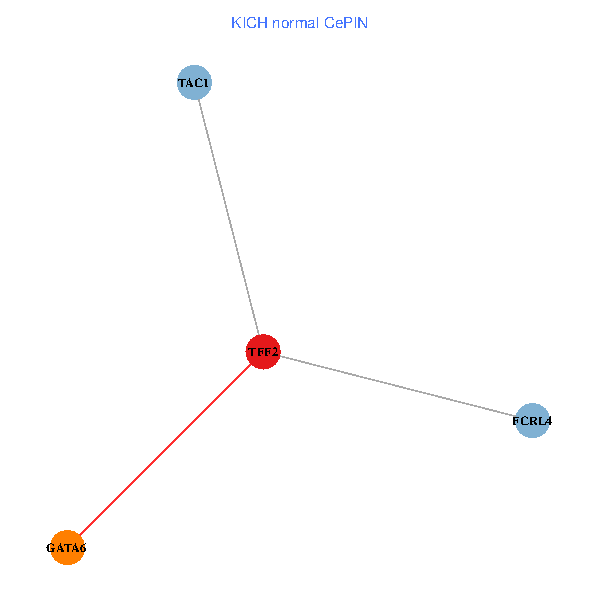
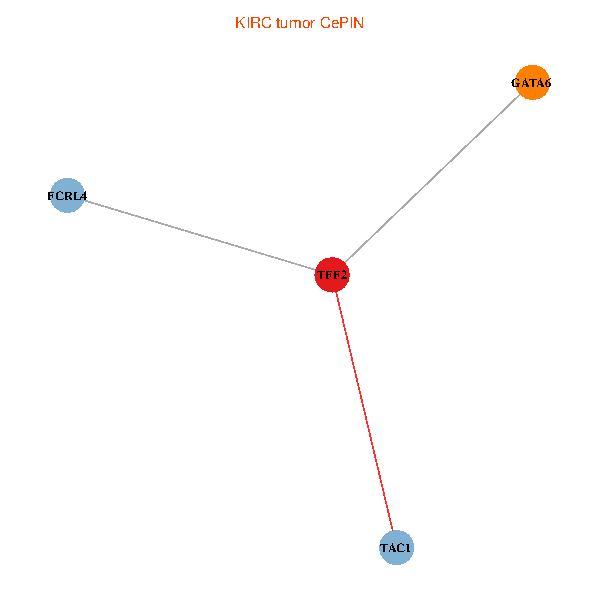
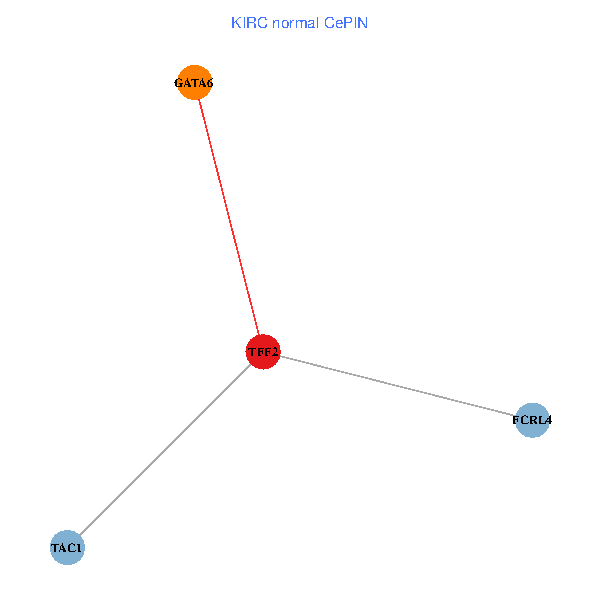
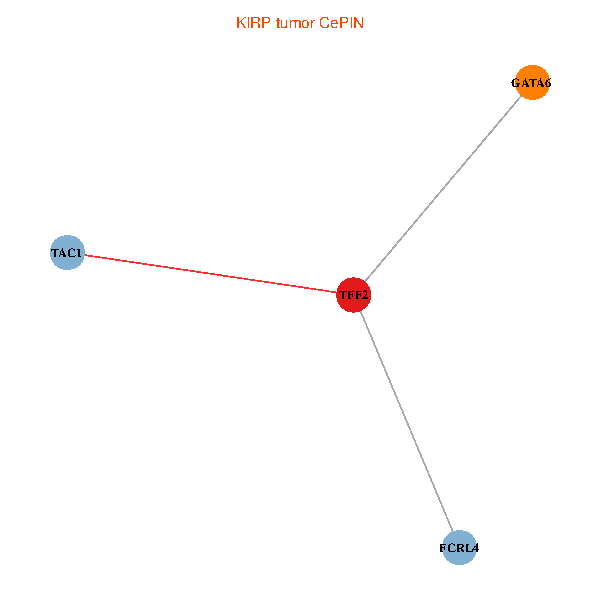
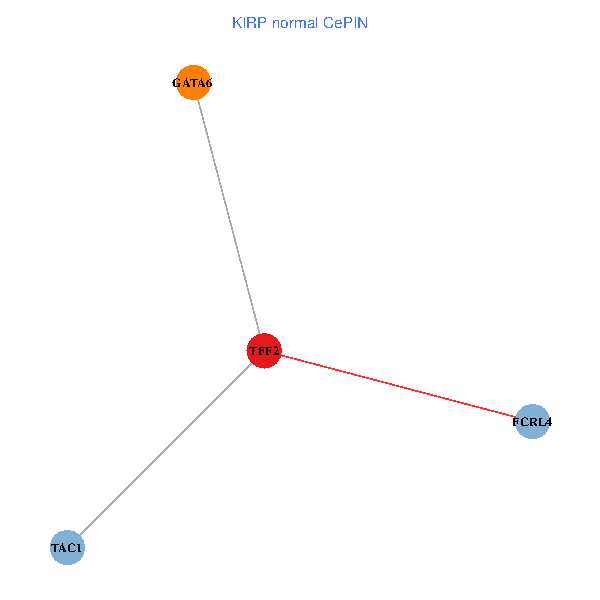
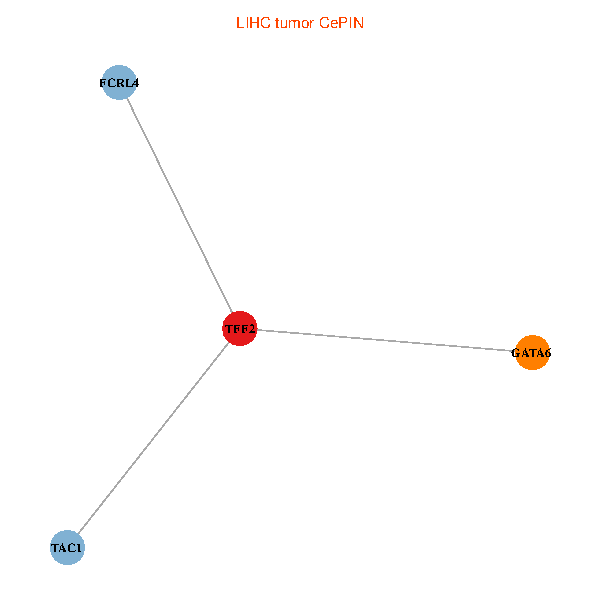
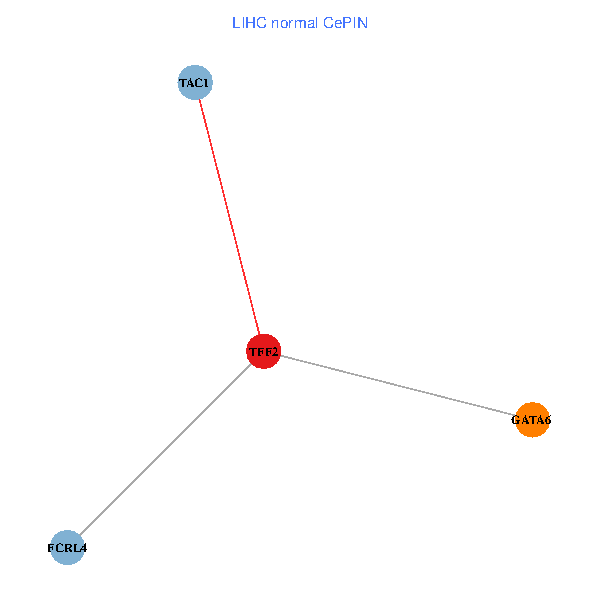
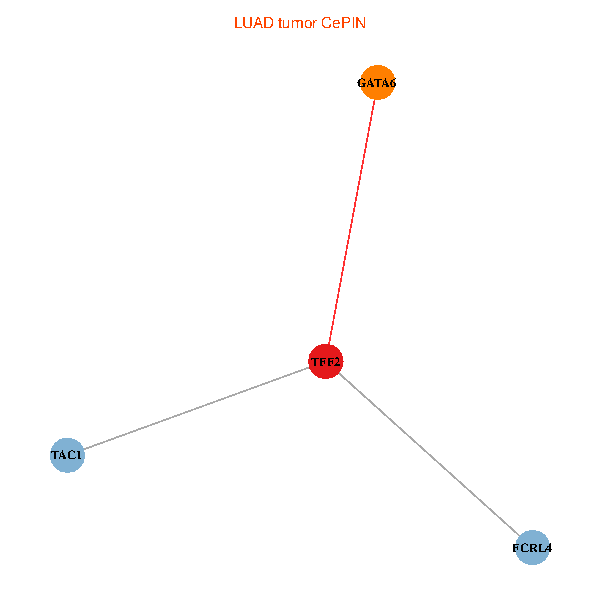
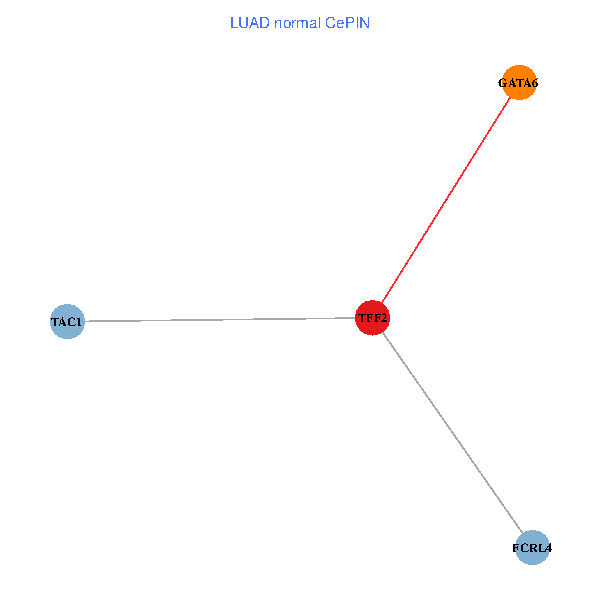
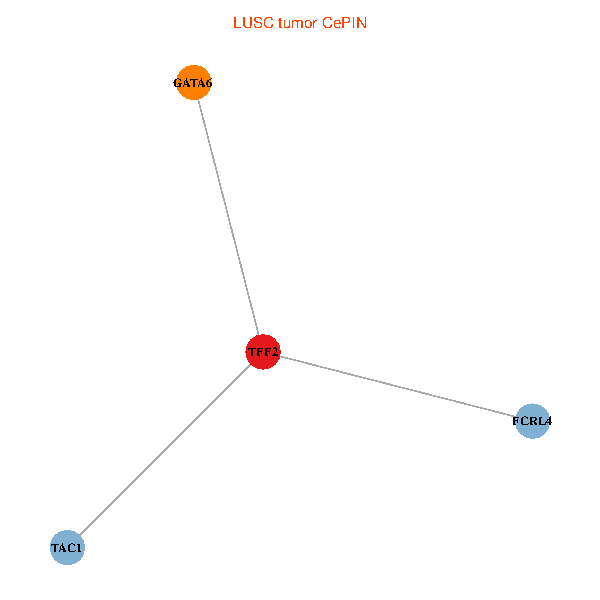
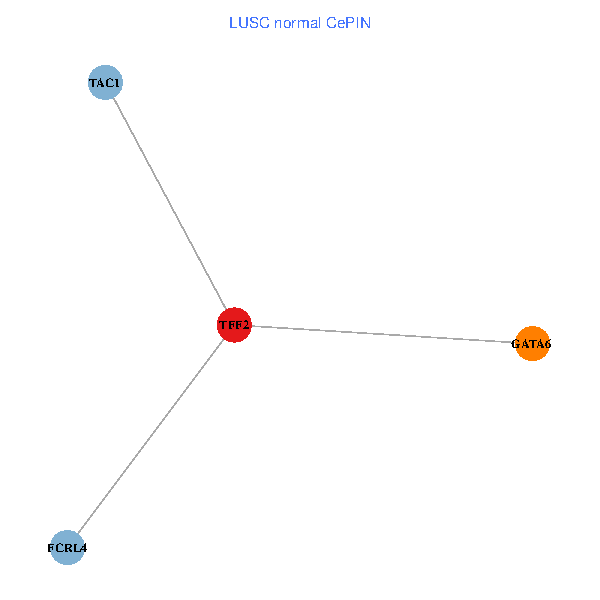
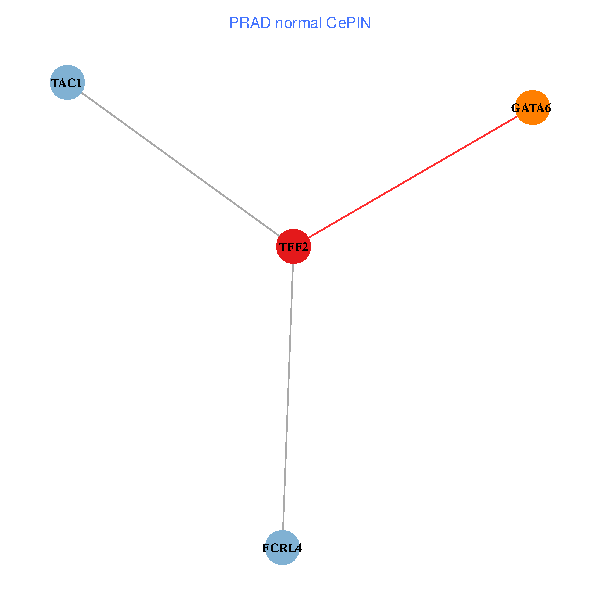
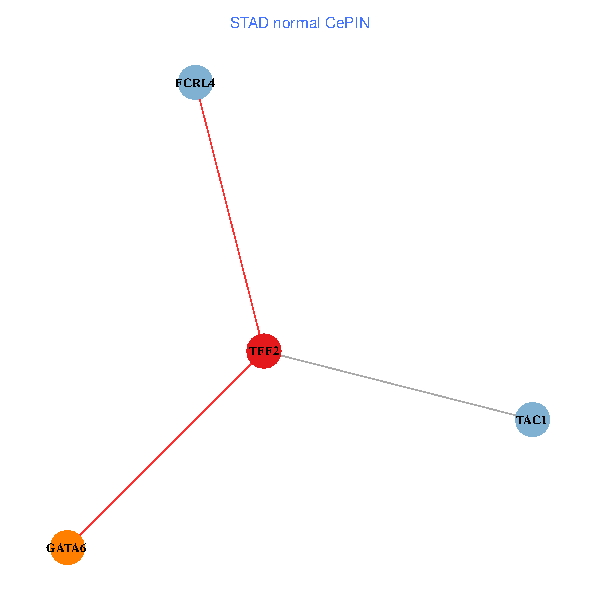
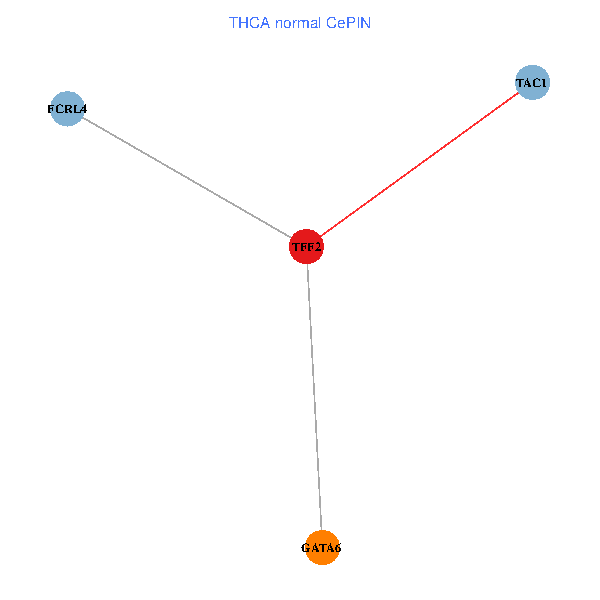
| Co-expressed gene networks based on protein-protein interaction data (CePIN) (TCGA IlluminaHiSeq_RNASeqV2, pan-cancer normalized log2(norm_counts+1) data, version 2016-08-16) (PINA2 ppi data) |
| BRCA (tumor) | BRCA (normal) |
| TFF2, TAC1, GATA6, FCRL4 (tumor) | TFF2, TAC1, GATA6, FCRL4 (normal) |
 |  |
| COAD (tumor) | COAD (normal) |
| TFF2, TAC1, GATA6, FCRL4 (tumor) | TFF2, TAC1, GATA6, FCRL4 (normal) |
 |  |
| HNSC (tumor) | HNSC (normal) |
| TFF2, TAC1, GATA6, FCRL4 (tumor) | TFF2, TAC1, GATA6, FCRL4 (normal) |
 |  |
| KICH (tumor) | KICH (normal) |
| TFF2, TAC1, GATA6, FCRL4 (tumor) | TFF2, TAC1, GATA6, FCRL4 (normal) |
 |  |
| KIRC (tumor) | KIRC (normal) |
| TFF2, TAC1, GATA6, FCRL4 (tumor) | TFF2, TAC1, GATA6, FCRL4 (normal) |
 |  |
| KIRP (tumor) | KIRP (normal) |
| TFF2, TAC1, GATA6, FCRL4 (tumor) | TFF2, TAC1, GATA6, FCRL4 (normal) |
 |  |
| LIHC (tumor) | LIHC (normal) |
| TFF2, TAC1, GATA6, FCRL4 (tumor) | TFF2, TAC1, GATA6, FCRL4 (normal) |
 |  |
| LUAD (tumor) | LUAD (normal) |
| TFF2, TAC1, GATA6, FCRL4 (tumor) | TFF2, TAC1, GATA6, FCRL4 (normal) |
 |  |
| LUSC (tumor) | LUSC (normal) |
| TFF2, TAC1, GATA6, FCRL4 (tumor) | TFF2, TAC1, GATA6, FCRL4 (normal) |
 |  |
| PRAD (tumor) | PRAD (normal) |
| TFF2, TAC1, GATA6, FCRL4 (tumor) | TFF2, TAC1, GATA6, FCRL4 (normal) |
 |  |
| STAD (tumor) | STAD (normal) |
| TFF2, TAC1, GATA6, FCRL4 (tumor) | TFF2, TAC1, GATA6, FCRL4 (normal) |
 |  |
| THCA (tumor) | THCA (normal) |
| TFF2, TAC1, GATA6, FCRL4 (tumor) | TFF2, TAC1, GATA6, FCRL4 (normal) |
 |  |
| Top |
| TissGeneProg for TFF2 |
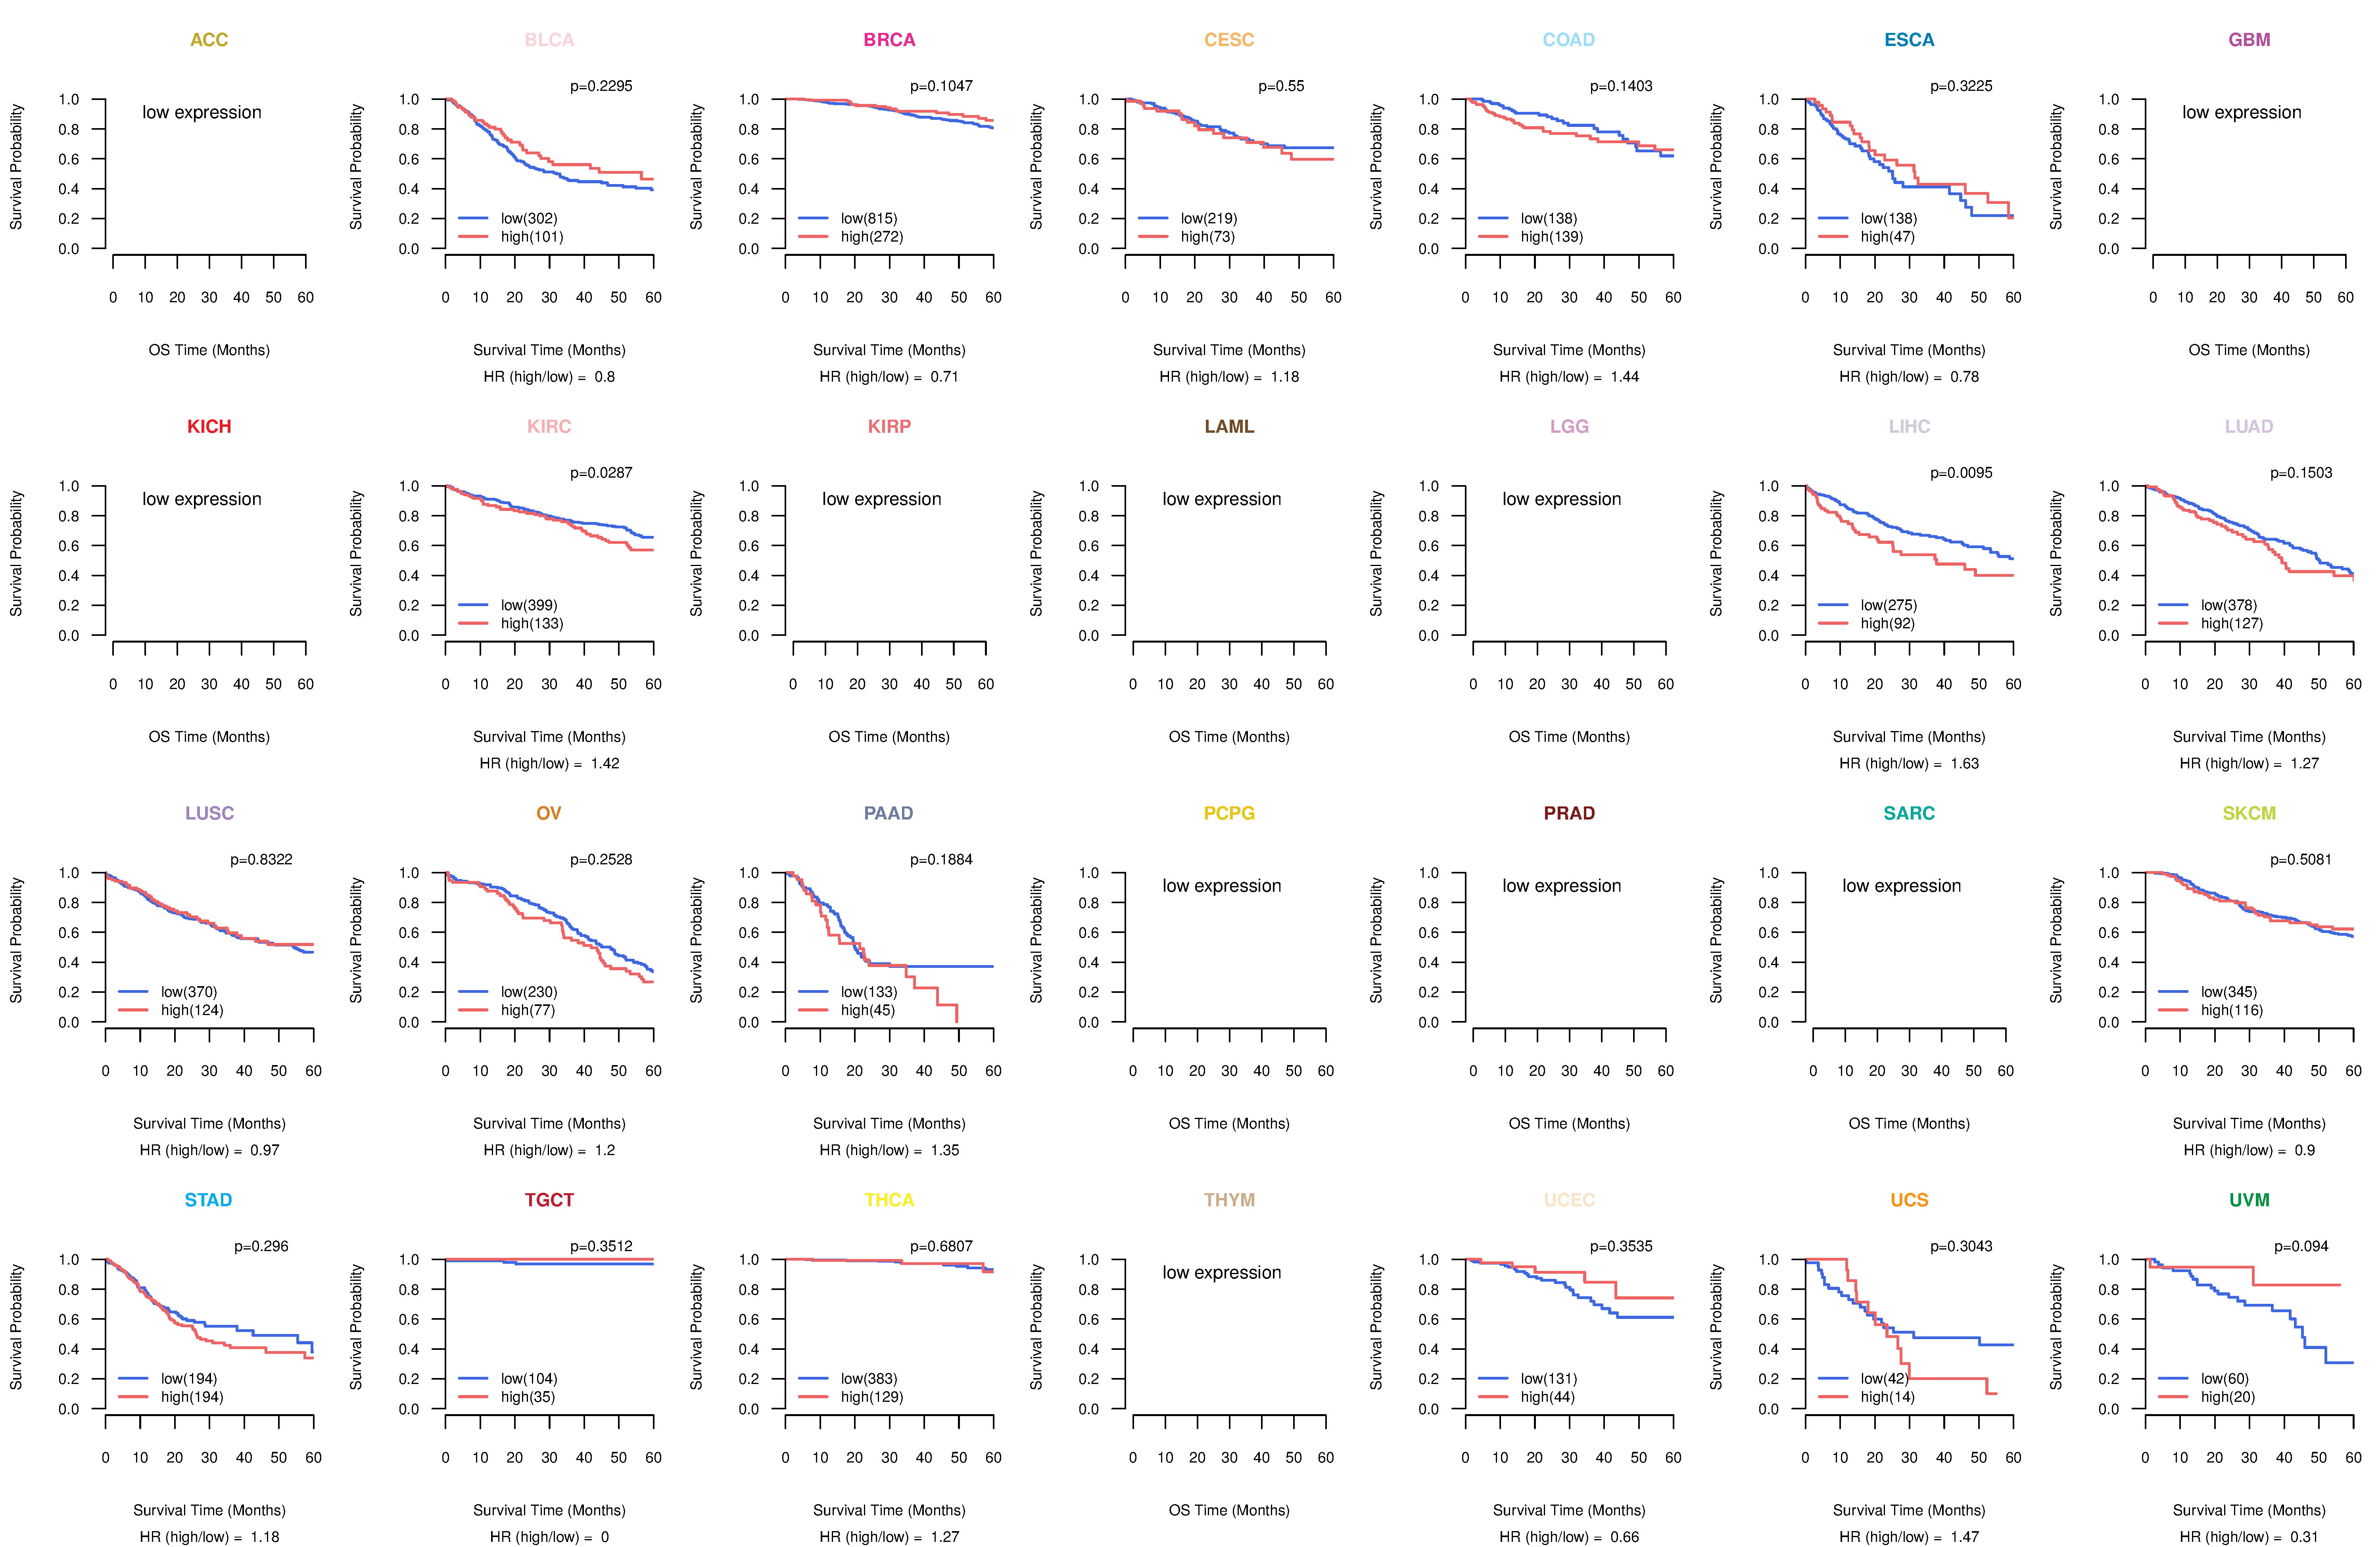
| Kaplan-Meier plots with logrank tests of overall survival (OS) using 28 cancer types (TCGA IlluminaHiSeq_RNASeqV2, pan-cancer normalized log2(norm_counts+1) data, version 2016-08-16) (TCGA clinicalMatrix, phenotype data, version 2016-04-27) * Click on the image to enlarge it in a new window. |
 |
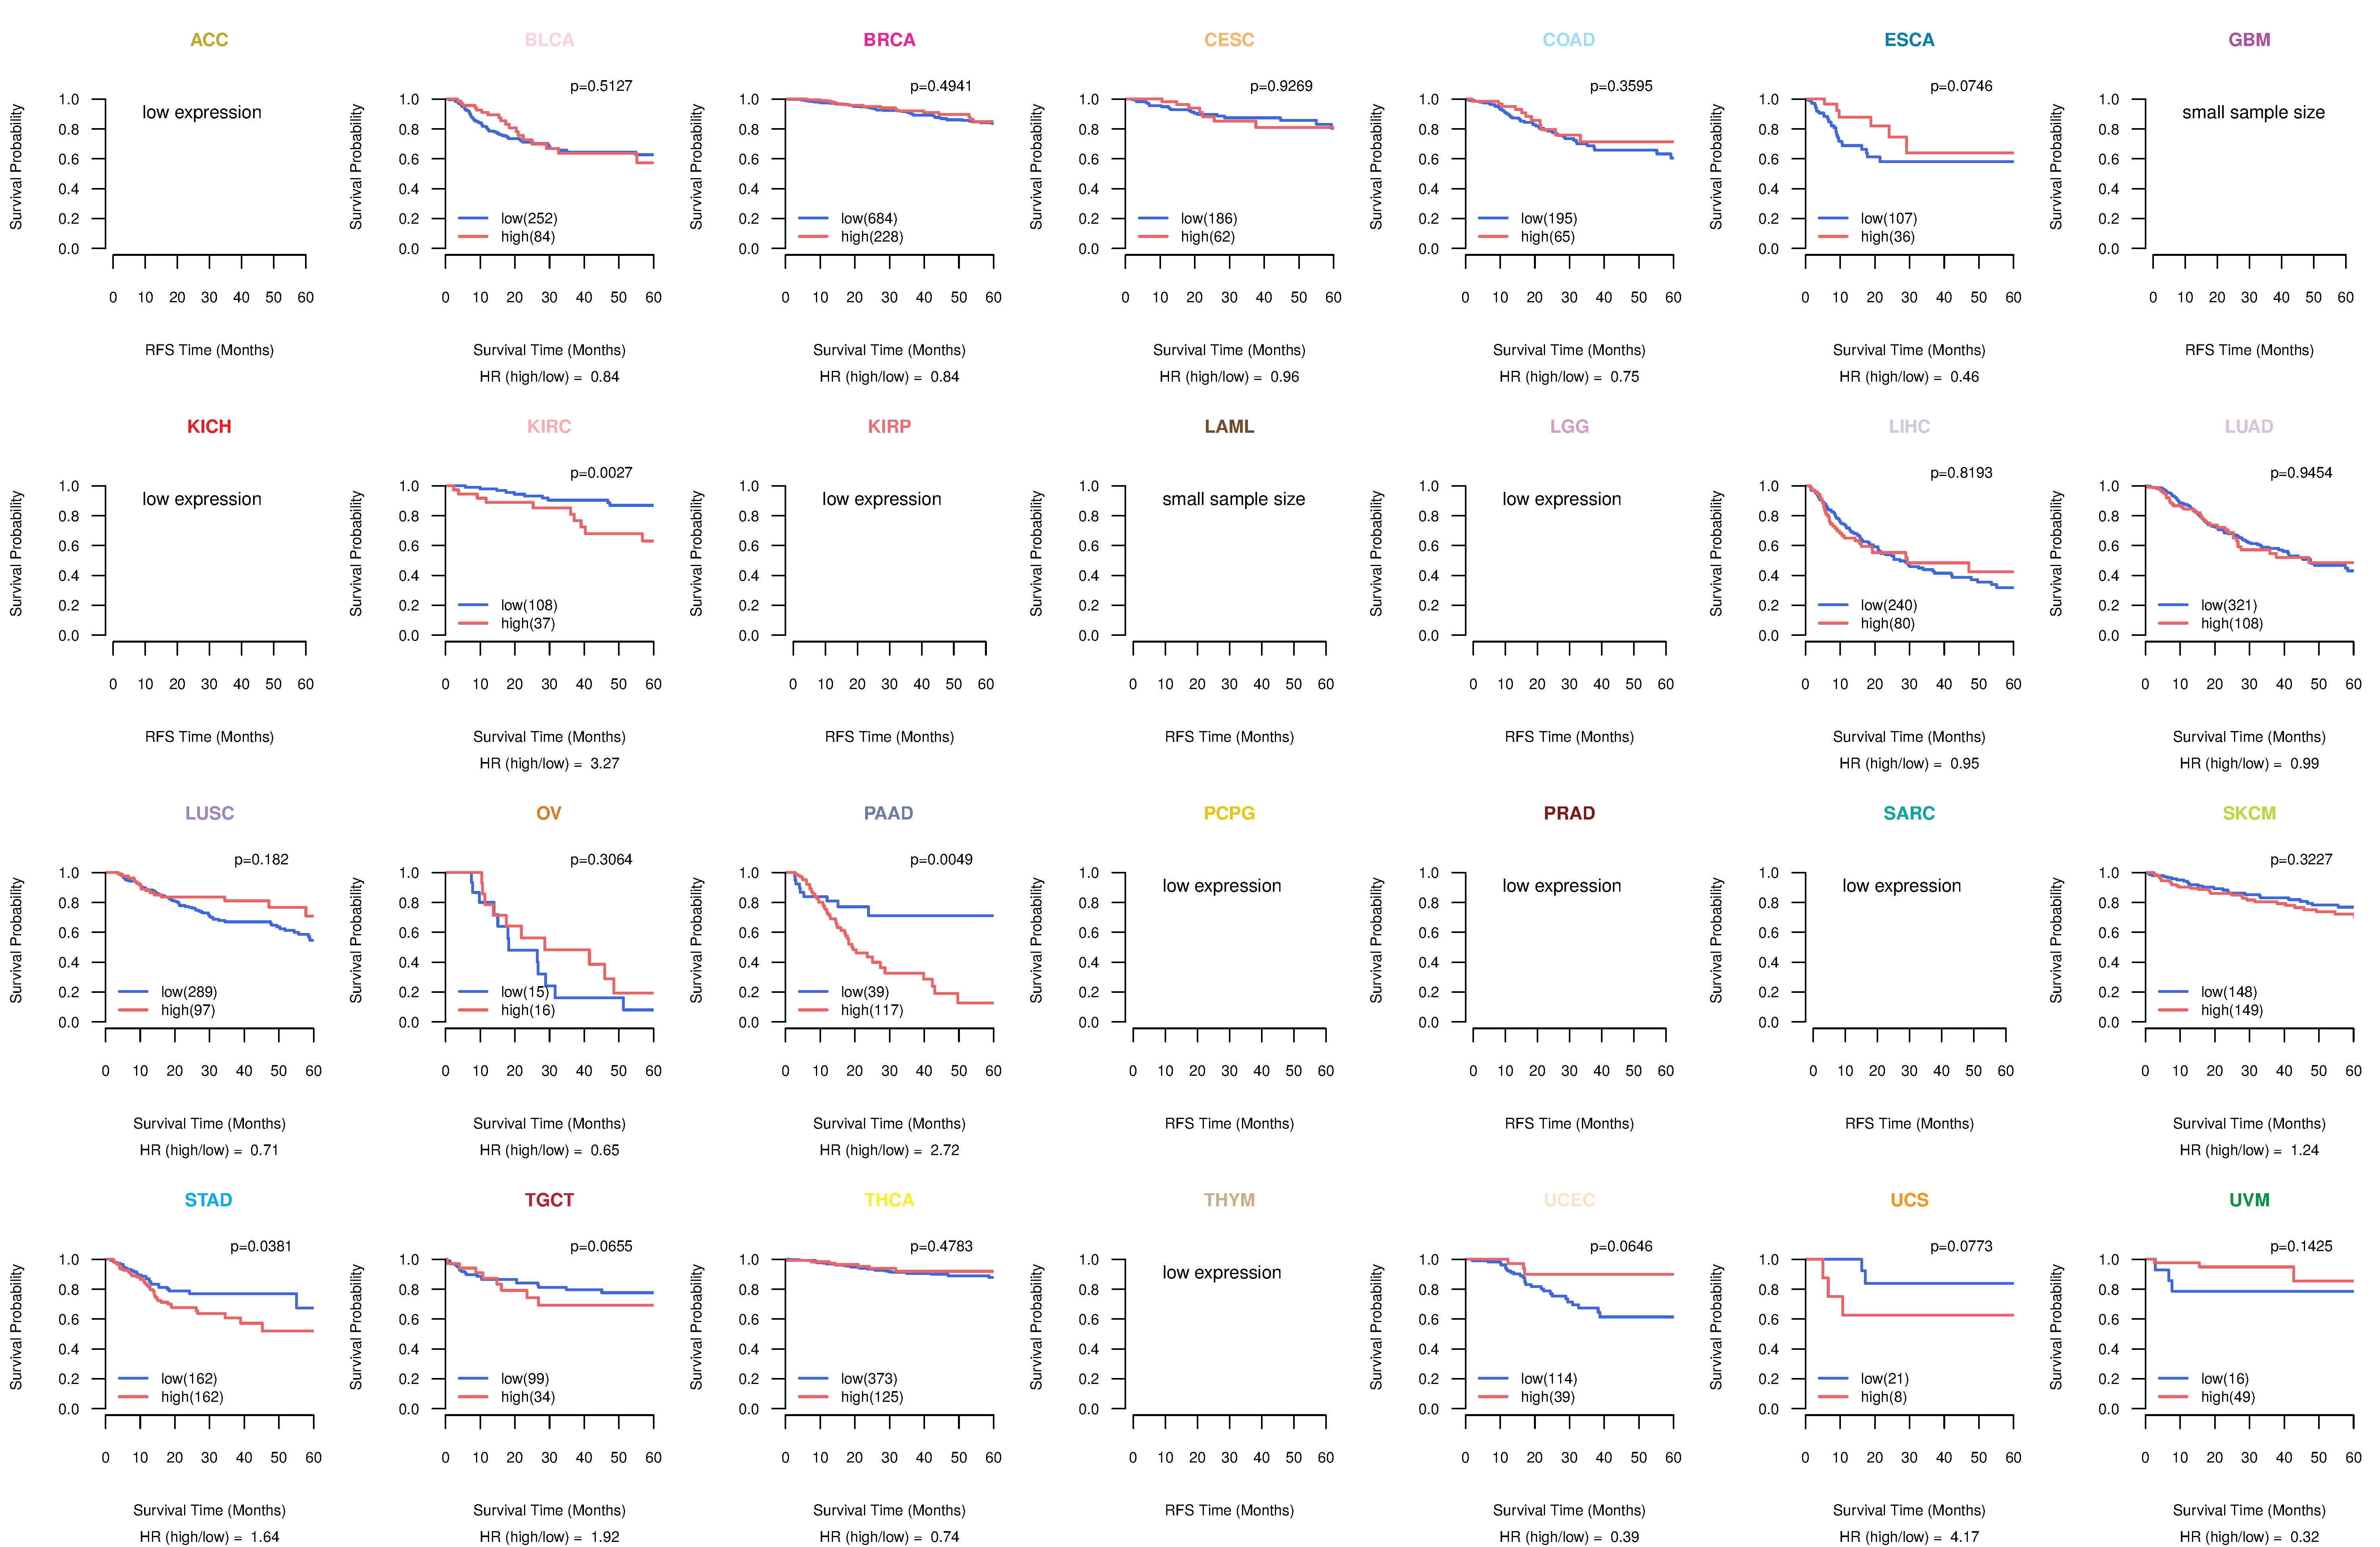
| Kaplan-Meier plots with logrank test of relapse free survival (RFS) using 28 cancer types (TCGA IlluminaHiSeq_RNASeqV2, pan-cancer normalized log2(norm_counts+1) data, version 2016-08-16) (TCGA clinicalMatrix, phenotype data, version 2016-04-27) * Click on the image enlarge it in a new window. |
 |
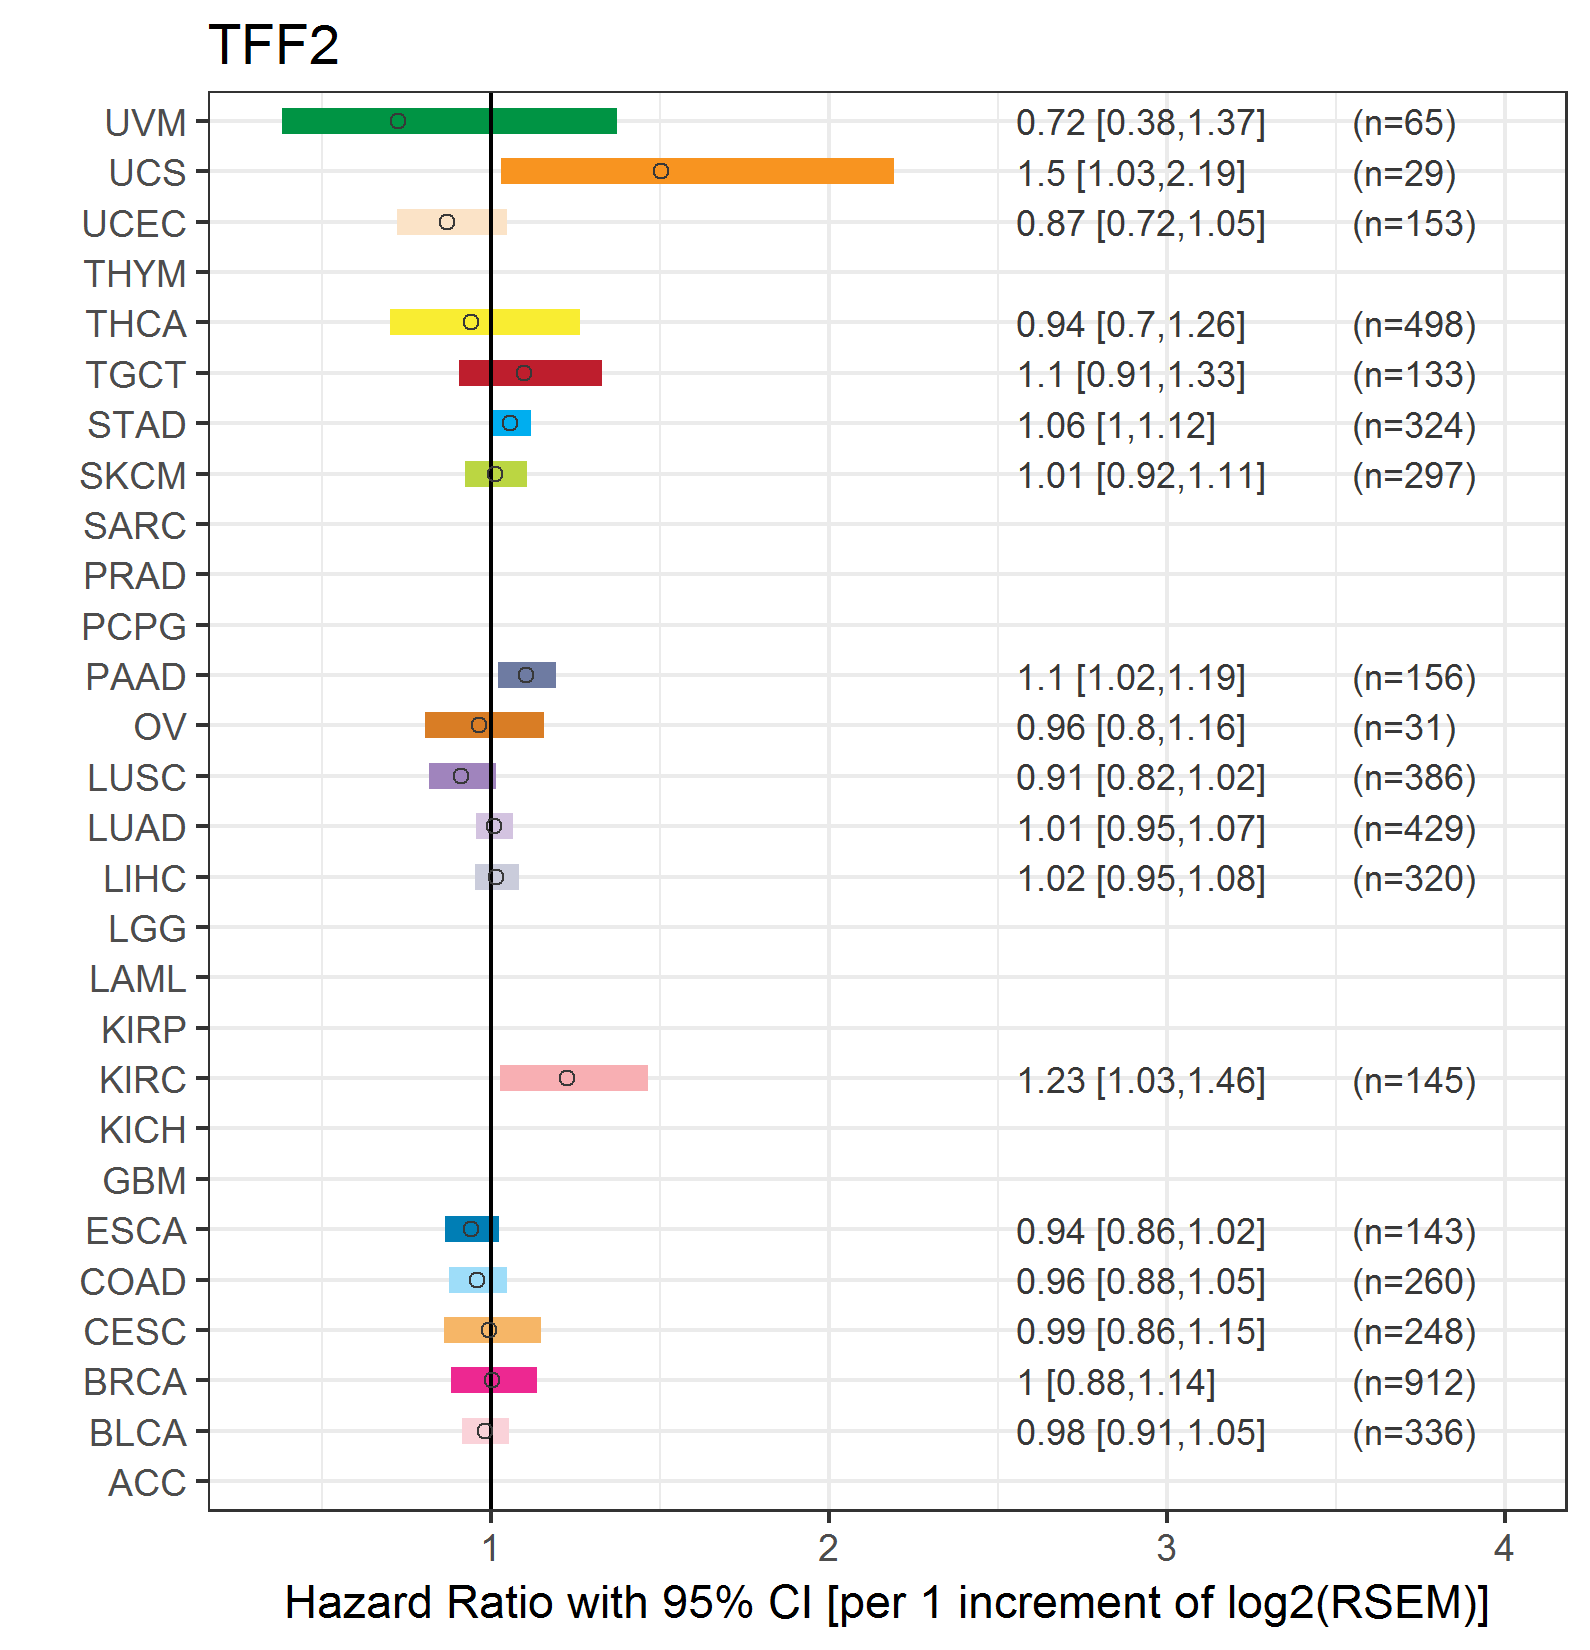
| Forest plot of Cox proportional hazard ratio (HR) and 95% CI of overall survival (OS) using 28 cancer types (TCGA IlluminaHiSeq_RNASeqV2, pan-cancer normalized log2(norm_counts+1) data, version 2016-08-16) (TCGA clinicalMatrix, phenotype data, version 2016-04-27) * Click on the image enlarge it in a new window. |
 |
| Forest plot of Cox proportional hazard ratio (HR) and 95% CI of relapse free survival (RFS) using 28 cancer types (TCGA IlluminaHiSeq_RNASeqV2, pan-cancer normalized log2(norm_counts+1) data, version 2016-08-16) (TCGA clinicalMatrix, phenotype data, version 2016-04-27) * Click on the image enlarge it in a new window. |
 |
| Top |
| TissGeneClin for TFF2 |
| TissGeneDrug for TFF2 |
| Drug information targeting TissGene (DrugBank Version 5.0.6, 2017-04-01) |
| DrugBank ID | Drug name | Drug activity | Drug type | Drug status |
| Top |
| TissGeneDisease for TFF2 |
| Disease information associated with TissGene (DisGeNet, 2016-06-01) |
| Disease ID | Disease name | # pubmeds | Source |
| umls:C0699791 | Stomach Carcinoma | 12 | BeFree |
| umls:C0024623 | Malignant neoplasm of stomach | 11 | BeFree |
| umls:C0596263 | Carcinogenesis | 6 | BeFree |
| umls:C0006142 | Malignant neoplasm of breast | 4 | BeFree |
| umls:C0678222 | Breast Carcinoma | 4 | BeFree |
| umls:C0017154 | Gastritis, Atrophic | 3 | BeFree |
| umls:C0027627 | Neoplasm Metastasis | 3 | BeFree,LHGDN |
| umls:C0038356 | Stomach Neoplasms | 3 | BeFree,LHGDN |
| umls:C0374997 | Helicobacter pylori (H. pylori) infection in conditions classified elsewhere and of unspecified site | 3 | BeFree |
| umls:C0030297 | Pancreatic Neoplasm | 2 | BeFree,GAD |
| umls:C0032927 | Precancerous Conditions | 2 | BeFree,LHGDN |
| umls:C0038358 | Gastric ulcer | 2 | BeFree |
| umls:C0206698 | Cholangiocarcinoma | 2 | BeFree |
| umls:C0235974 | Pancreatic carcinoma | 2 | BeFree,GAD |
| umls:C0685938 | Malignant neoplasm of gastrointestinal tract | 2 | BeFree |
| umls:C0001418 | Adenocarcinoma | 1 | BeFree |
| umls:C0002395 | Alzheimer's Disease | 1 | GAD |
| umls:C0004096 | Asthma | 1 | BeFree |
| umls:C0007137 | Squamous cell carcinoma | 1 | BeFree |
| umls:C0009324 | Ulcerative Colitis | 1 | BeFree |
| umls:C0009375 | Colonic Neoplasms | 1 | BeFree |
| umls:C0009402 | Colorectal Carcinoma | 1 | BeFree |
| umls:C0010346 | Crohn Disease | 1 | BeFree |
| umls:C0017152 | Gastritis | 1 | BeFree |
| umls:C0019911 | Hookworm Infections | 1 | BeFree |
| umls:C0021390 | Inflammatory Bowel Diseases | 1 | LHGDN |
| umls:C0021841 | Intestinal Neoplasms | 1 | BeFree |
| umls:C0024115 | Lung diseases | 1 | BeFree |
| umls:C0032584 | polyps | 1 | BeFree |
| umls:C0035335 | Retinoblastoma | 1 | BeFree |
| umls:C0085695 | Chronic gastritis | 1 | BeFree |
| umls:C0151514 | Atrophic condition of skin | 1 | BeFree |
| umls:C0152018 | Esophageal carcinoma | 1 | BeFree |
| umls:C0155877 | Allergic asthma | 1 | BeFree |
| umls:C0242488 | Acute Lung Injury | 1 | CTD_human |
| umls:C0267111 | Gastric dysplasia | 1 | BeFree |
| umls:C0278701 | Gastric Adenocarcinoma | 1 | BeFree |
| umls:C0333983 | Hyperplastic Polyp | 1 | BeFree |
| umls:C0699790 | Colon Carcinoma | 1 | BeFree |
| umls:C0850666 | Helicobacter pylori infection | 1 | BeFree |
| umls:C1458155 | Mammary Neoplasms | 1 | LHGDN |
| umls:C1527249 | Colorectal Cancer | 1 | BeFree |
| umls:C3714514 | Infection | 1 | LHGDN |
|
Copyright 2016-Present - The University of Texas Health Science Center at Houston (UTHealth) Web File Viewing | How to Report, Fraud, Waste and Abuse | State of Texas | Statewide Search | Texas Homeland Security | Site Policies |