 |
| |
| |
| |
| |
| |
| |
|

| TissGeneSummary for TFR2 |
 Gene summary Gene summary |
| Basic gene information | Gene symbol | TFR2 |
| Gene name | transferrin receptor 2 | |
| Synonyms | HFE3|TFRC2 | |
| Cytomap | UCSC genome browser: 7q22 | |
| Type of gene | protein-coding | |
| RefGenes | NM_001206855.1, NM_003227.3, | |
| Description | transferrin receptor protein 2 | |
| Modification date | 20141222 | |
| dbXrefs | MIM : 604720 | |
| HGNC : HGNC | ||
| Ensembl : ENSG00000106327 | ||
| HPRD : 05282 | ||
| Vega : OTTHUMG00000159598 | ||
| Protein | UniProt: go to UniProt's Cross Reference DB Table | |
| Expression | CleanEX: HS_TFR2 | |
| BioGPS: 7036 | ||
| Pathway | NCI Pathway Interaction Database: TFR2 | |
| KEGG: TFR2 | ||
| REACTOME: TFR2 | ||
| Pathway Commons: TFR2 | ||
| Context | iHOP: TFR2 | |
| ligand binding site mutation search in PubMed: TFR2 | ||
| UCL Cancer Institute: TFR2 | ||
| Assigned class in TissGDB* | A | |
| Included tissue-specific gene expression resources | HPA,TiGER,GTEx | |
| Specific-tissues in normal samples (assigned by TissGDB using HPA, TiGER, and GTEx) | Liver | |
| Cancer types related to the specific-tissues in cancer samples (assigned by TissGDB using TCGA) | LIHC | |
| Reference showing the relevant tissue of TFR2 | Transferrin receptor 2: continued expression in mouse liver in the face of iron overload and in hereditary hemochromatosis. Proc Natl Acad Sci U S A. 2000 Feb 29;97(5):2214-9. (pmid:10681454) go to article | |
| Description by TissGene annotations | ||
| * Class A consists of genes with literature evidence and is part of the cTissGenes. Class B consists of only cTissGenes without additional evidence. The remaining genes belong to Class C. |
| Gene ontology having evidence of Inferred from Direct Assay (IDA) from Entrez |
| GO ID | GO term | PubMed ID |
| Top |
| TissGeneExp for TFR2 |
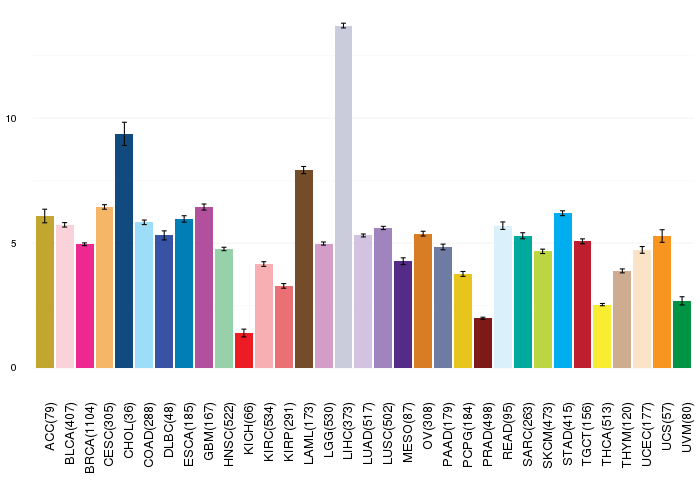
| Gene expressions across 28 cancer types (X-axis: cancer type and Y-axis: log2(norm_counts+1)) (TCGA IlluminaHiSeq_RNASeqV2, pan-cancer normalized log2(norm_counts+1) data, version 2016-08-16) |
 |
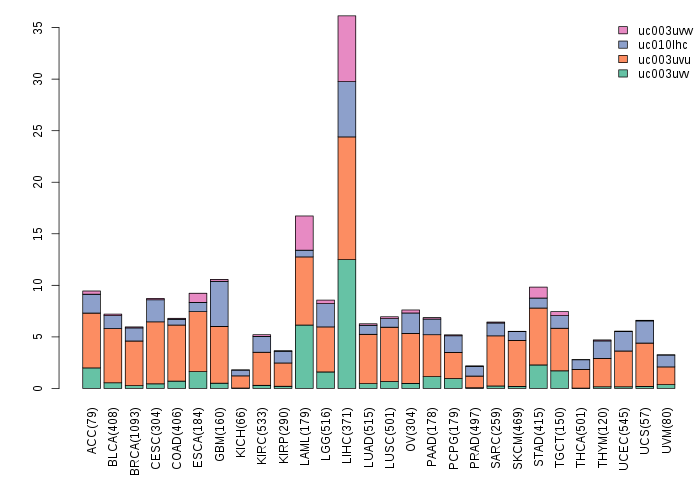
| Gene isoform expressions across 28 cancer types (X-axis: cancer type and Y-axis: log2(norm_counts+1)) (TCGA pan-cancer tcga_rsem_isoform_tpm, version 2016-09-01) |
 |
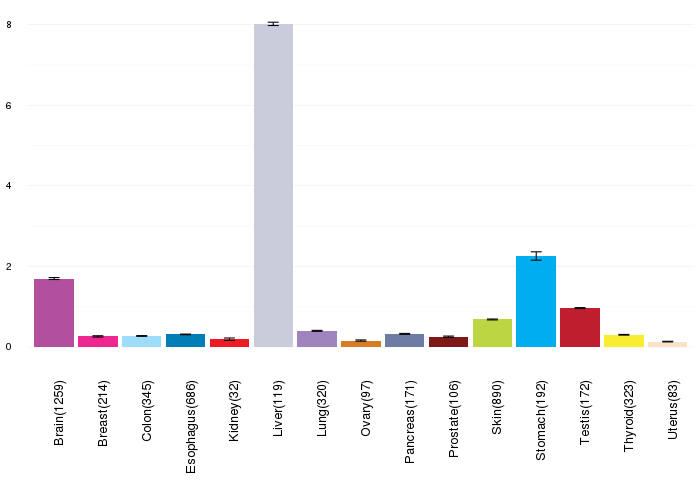
| Gene expressions across normal tissues of GTEx data (GTEx GTEx_Analysis_v6_RNA-seq_RNA-SeQCv1.1.8_gene_rpkm.gct) - Here, we shows the matched tissue types only among our 28 cancer types. |
 |
| Different expressions across 14 cancer types with more than 10 samples between matched tumors and normals (X-axis: cancer type and Y-axis: log2(norm_counts+1)) (TCGA IlluminaHiSeq_RNASeqV2, pan-cancer normalized log2(norm_counts+1) data, version 2016-08-16) |
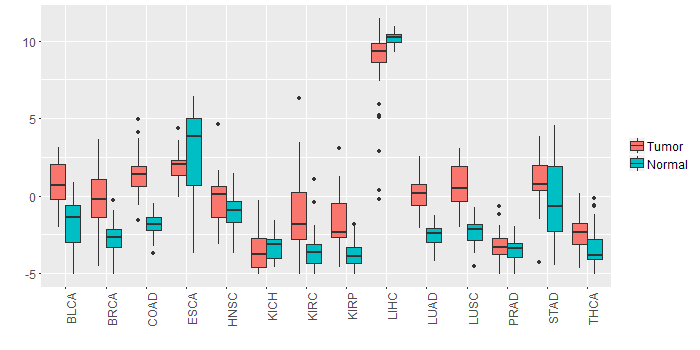 |
| - Significantly differentially expressed cancer types and information. (|Fold change|>1 and FDR<0.05) |
| Cancer type | Mean(exp) in tumor | Mean(exp) in matched normal | Log2FC | P-val. | FDR |
| KIRC | -1.240262323 | -3.591574823 | 2.3513125 | 1.82E-13 | 8.21E-13 |
| BRCA | -0.189499165 | -2.7455132 | 2.556014035 | 6.23E-28 | 7.16E-27 |
| LUSC | 0.611002383 | -2.290568205 | 2.901570588 | 5.81E-20 | 6.81E-19 |
| LUAD | 0.124750321 | -2.528878989 | 2.65362931 | 9.43E-27 | 5.57E-25 |
| KIRP | -1.801475864 | -3.761044614 | 1.95956875 | 1.03E-06 | 5.27E-06 |
| COAD | 1.438355626 | -1.852209759 | 3.290565385 | 1.25E-12 | 3.30E-11 |
| LIHC | 8.715251011 | 10.15549301 | -1.440242 | 8.37E-05 | 0.000293214 |
| BLCA | 0.783881537 | -1.710318463 | 2.4942 | 1.73E-05 | 0.000289287 |
| Top |
| TissGene-miRNA for TFR2 |
| Significantly anti-correlated miRNAs of TissGene across 28 cancer types (Gene-miRNA relations from TargetScanHuman Relsease 7.1, Conserved_Site_Context_Scores.txt.zip, 06.01.2016) (TCGA IlluminaHiSeq_miRNASeq, log2(RPM+1) data, version 2016-11-21) (TCGA IlluminaHiSeq_RNASeqV2, log2(normalized_count+1) data, version 2016-08-16) (Spearman’s Rank Correlation (p-value<0.05 and coefficient<-0.25)) |
| Cancer type | miRNA id | miRNA accession | P-val. | Coeff. | # samples |
| LUAD | hsa-let-7a-5p | MIMAT0000062 | 0.037 | -0.27 | 60 |
| LUAD | hsa-let-7b-5p | MIMAT0000063 | 0.024 | -0.29 | 60 |
| Top |
| TissGeneMut for TFR2 |
| TissGeneSNV for TFR2 |
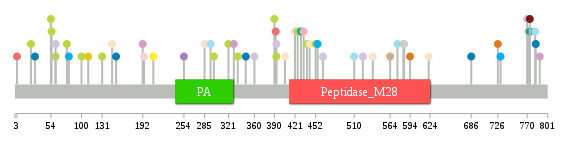
| nsSNV counts per each loci. Different colors of circles represent different cancer types. Circle size denotes number of samples. (TCGA somatic mutation (SNPs and small INDELs) data, version 2016-04-25) * Click on the image to enlarge it in a new window. |
 |
 |
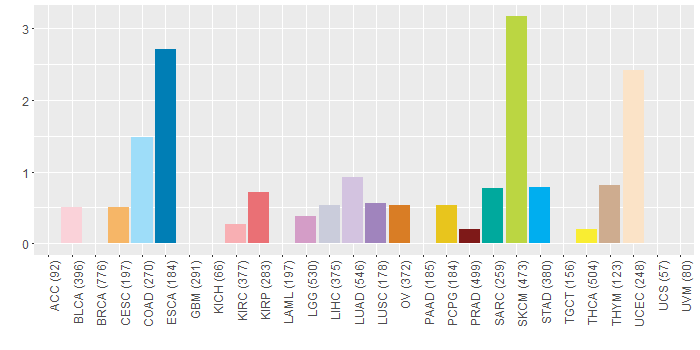
| Somatic nucleotide variants of TissGene across 28 cancer types (X-axis: cancer type and Y-axis: % of mutated samples) The numbers in parentheses are numbers of samples with mutation (nsSNVs). (TCGA somatic mutation (SNPs and small INDELs) data, version 2016-04-25) |
 |
| - nsSNVs sorted by frequency. |
| AAchange | Cancer type | # samples |
| p.S360R | LUAD | 1 |
| p.T406A | UCEC | 1 |
| p.G100S | SKCM | 1 |
| p.T285A | UCEC | 1 |
| p.R30Q | ESCA | 1 |
| p.T575M | COAD | 1 |
| p.H131Y | SKCM | 1 |
| p.T782M | COAD | 1 |
| p.R329W | LGG | 1 |
| p.Y594* | OV | 1 |
| p.E584K | SKCM | 1 |
| p.L783P | ESCA | 1 |
| p.P299S | SKCM | 1 |
| p.A789V | LGG | 1 |
| p.G321E | SKCM | 1 |
| p.R774H | PRAD | 1 |
| p.R730C | STAD | 1 |
| p.S538Y | UCEC | 1 |
| p.P393A | LUAD | 1 |
| p.A347E | ESCA | 1 |
| p.D194N | BLCA | 1 |
| p.A110V | PCPG | 1 |
| p.A510T | COAD | 1 |
| p.H425Y | SKCM | 1 |
| p.S770C | LUAD | 1 |
| p.P393L | SKCM | 1 |
| p.P564S | THYM | 1 |
| p.M54I | SKCM | 1 |
| p.R152C | ESCA | 1 |
| p.S443F | UCEC | 1 |
| p.D434Y | KIRC | 1 |
| p.Q24X | SKCM | 1 |
| p.D663N | READ | 1 |
| p.G294E | COAD | 1 |
| p.A81T | STAD | 1 |
| p.R3Q | KIRP | 1 |
| p.G439E | SKCM | 1 |
| p.V622M | UCEC | 1 |
| p.E254* | LUSC | 1 |
| p.H390Y | SKCM | 1 |
| p.G430A | SARC | 1 |
| p.R774H | SARC | 1 |
| p.G392D | KIRP | 1 |
| p.F335Y | SKCM | 1 |
| p.W192* | LGG | 1 |
| p.F772L | CESC | 1 |
| p.S421* | BLCA | 1 |
| p.F585L | LIHC | 1 |
| p.G78E | SKCM | 1 |
| p.D726N | OV | 1 |
| p.F574Y | HNSC | 1 |
| p.E452K | SKCM | 1 |
| p.R455W | STAD | 1 |
| p.P208R | THCA | 1 |
| p.E686K | ESCA | 1 |
| p.P523H | LUAD | 1 |
| p.E55K | SKCM | 1 |
| p.P61A | LUAD | 1 |
| p.Q146H | UCEC | 1 |
| p.N463S | LIHC | 1 |
| p.P61L | SKCM | 1 |
| Top |
| TissGeneCNV for TFR2 |
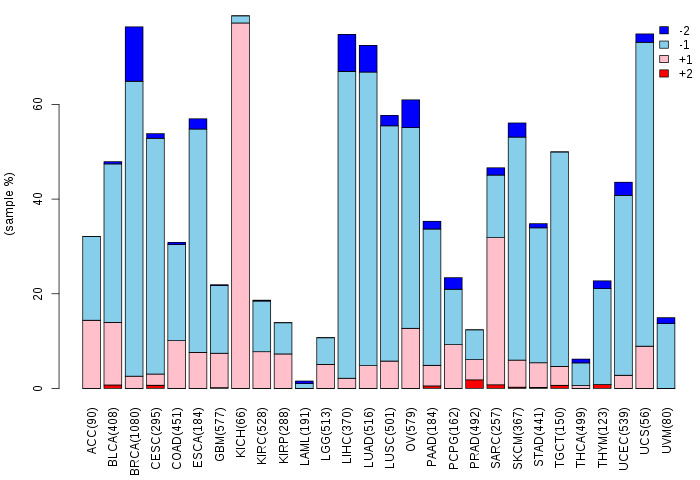
| Copy number variations of TissGene across 28 cancer types (X-axis: cancer type and Y-axis: % of CNV samples) (TCGA Gistic2_CopyNumber_Gistic2_all_data_by_genes, Gistic2 copy number data, version 2016-08-16) |
 |
| Top |
| TissGeneFusions for TFR2 |
| Fusion genes including TissGene (ChimerDB 3.0, 2016-12-01 and TCGA fusion Portal 2015-12-01) |
| Database | Src | Cancer type | Sample | Fusion gene | ORF | 5'-gene BP | 3'-gene BP |
| Top |
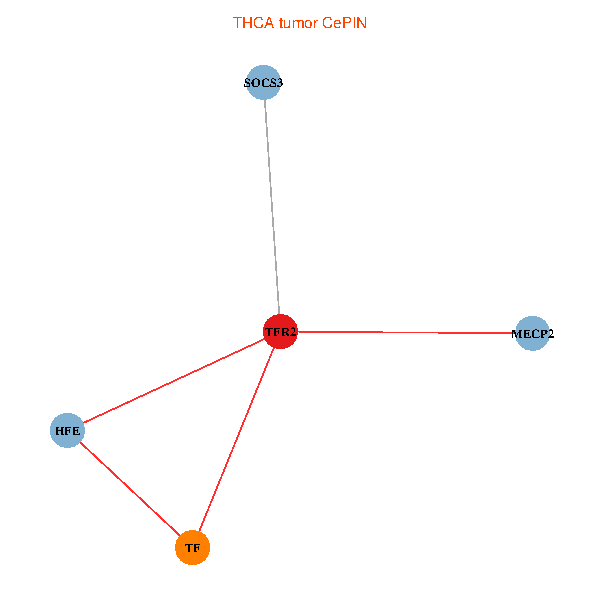
| TissGeneNet for TFR2 |
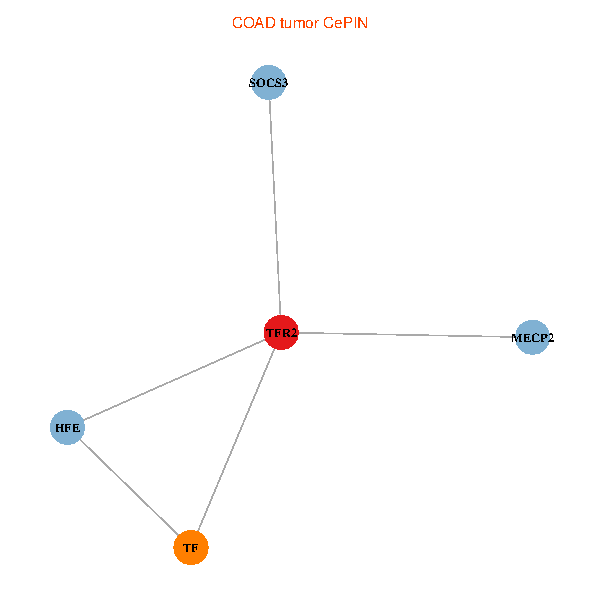
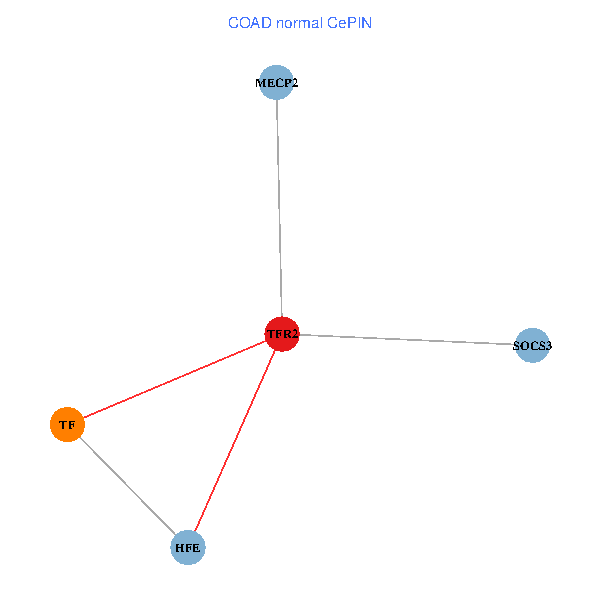
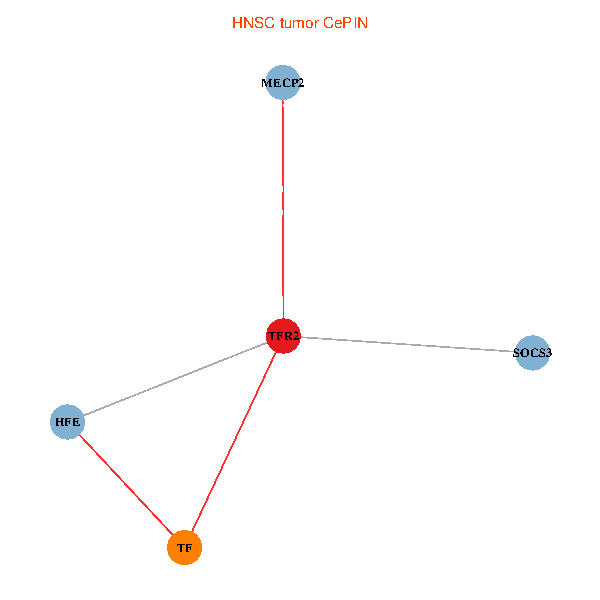
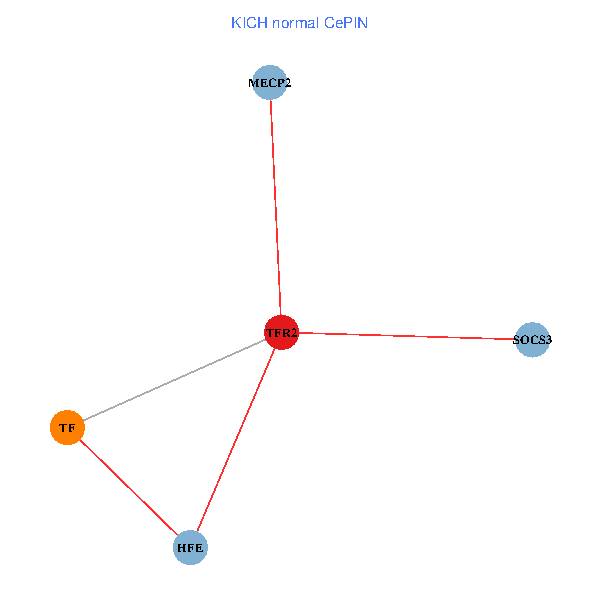
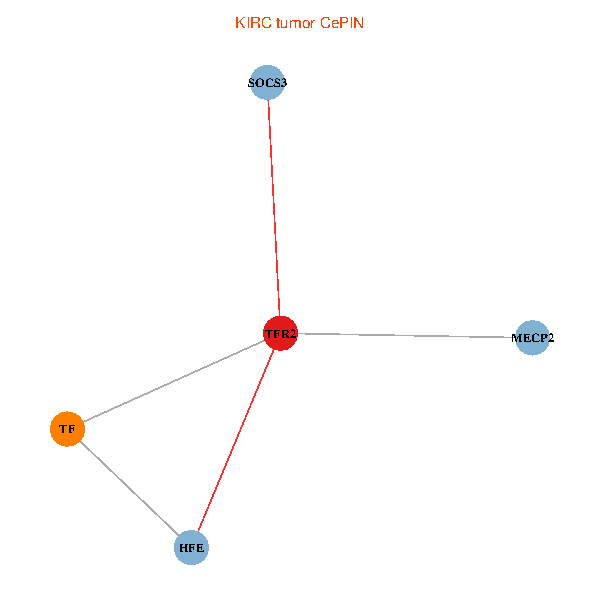
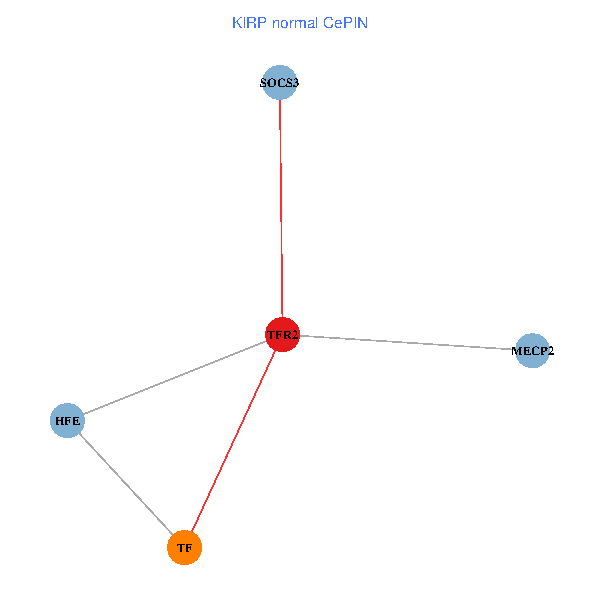
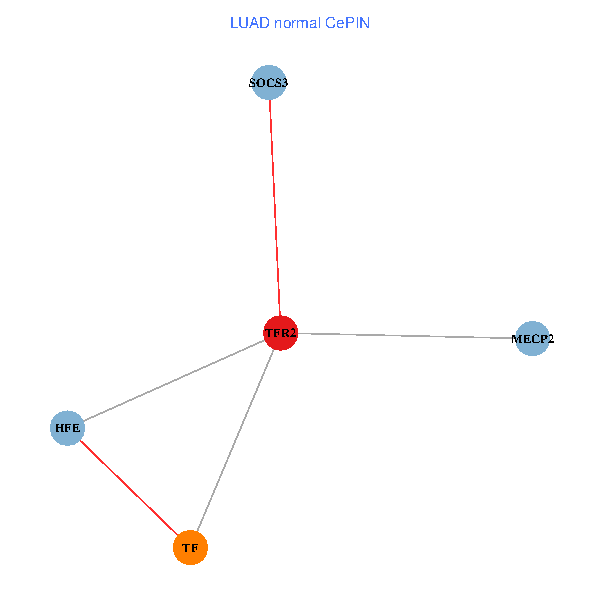
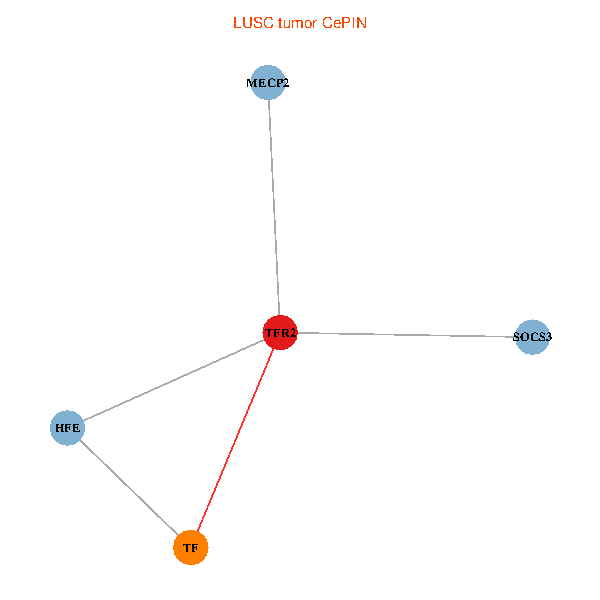
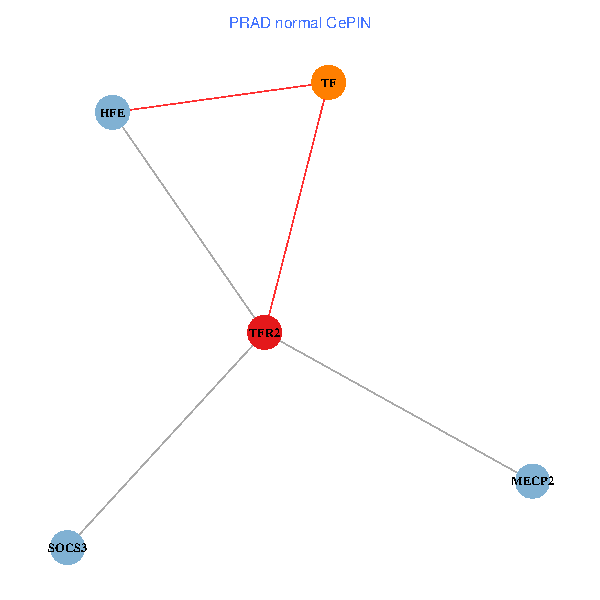
| Co-expressed gene networks based on protein-protein interaction data (CePIN) (TCGA IlluminaHiSeq_RNASeqV2, pan-cancer normalized log2(norm_counts+1) data, version 2016-08-16) (PINA2 ppi data) |
| BRCA (tumor) | BRCA (normal) |
| TFR2, SOCS3, MECP2, TF, HFE (tumor) | TFR2, SOCS3, MECP2, TF, HFE (normal) |
 |  |
| COAD (tumor) | COAD (normal) |
| TFR2, SOCS3, MECP2, TF, HFE (tumor) | TFR2, SOCS3, MECP2, TF, HFE (normal) |
 |  |
| HNSC (tumor) | HNSC (normal) |
| TFR2, SOCS3, MECP2, TF, HFE (tumor) | TFR2, SOCS3, MECP2, TF, HFE (normal) |
 |  |
| KICH (tumor) | KICH (normal) |
| TFR2, SOCS3, MECP2, TF, HFE (tumor) | TFR2, SOCS3, MECP2, TF, HFE (normal) |
 |  |
| KIRC (tumor) | KIRC (normal) |
| TFR2, SOCS3, MECP2, TF, HFE (tumor) | TFR2, SOCS3, MECP2, TF, HFE (normal) |
 |  |
| KIRP (tumor) | KIRP (normal) |
| TFR2, SOCS3, MECP2, TF, HFE (tumor) | TFR2, SOCS3, MECP2, TF, HFE (normal) |
 |  |
| LIHC (tumor) | LIHC (normal) |
| TFR2, SOCS3, MECP2, TF, HFE (tumor) | TFR2, SOCS3, MECP2, TF, HFE (normal) |
 |  |
| LUAD (tumor) | LUAD (normal) |
| TFR2, SOCS3, MECP2, TF, HFE (tumor) | TFR2, SOCS3, MECP2, TF, HFE (normal) |
 |  |
| LUSC (tumor) | LUSC (normal) |
| TFR2, SOCS3, MECP2, TF, HFE (tumor) | TFR2, SOCS3, MECP2, TF, HFE (normal) |
 |  |
| PRAD (tumor) | PRAD (normal) |
| TFR2, SOCS3, MECP2, TF, HFE (tumor) | TFR2, SOCS3, MECP2, TF, HFE (normal) |
 |  |
| STAD (tumor) | STAD (normal) |
| TFR2, SOCS3, MECP2, TF, HFE (tumor) | TFR2, SOCS3, MECP2, TF, HFE (normal) |
 |  |
| THCA (tumor) | THCA (normal) |
| TFR2, SOCS3, MECP2, TF, HFE (tumor) | TFR2, SOCS3, MECP2, TF, HFE (normal) |
 |  |
| Top |
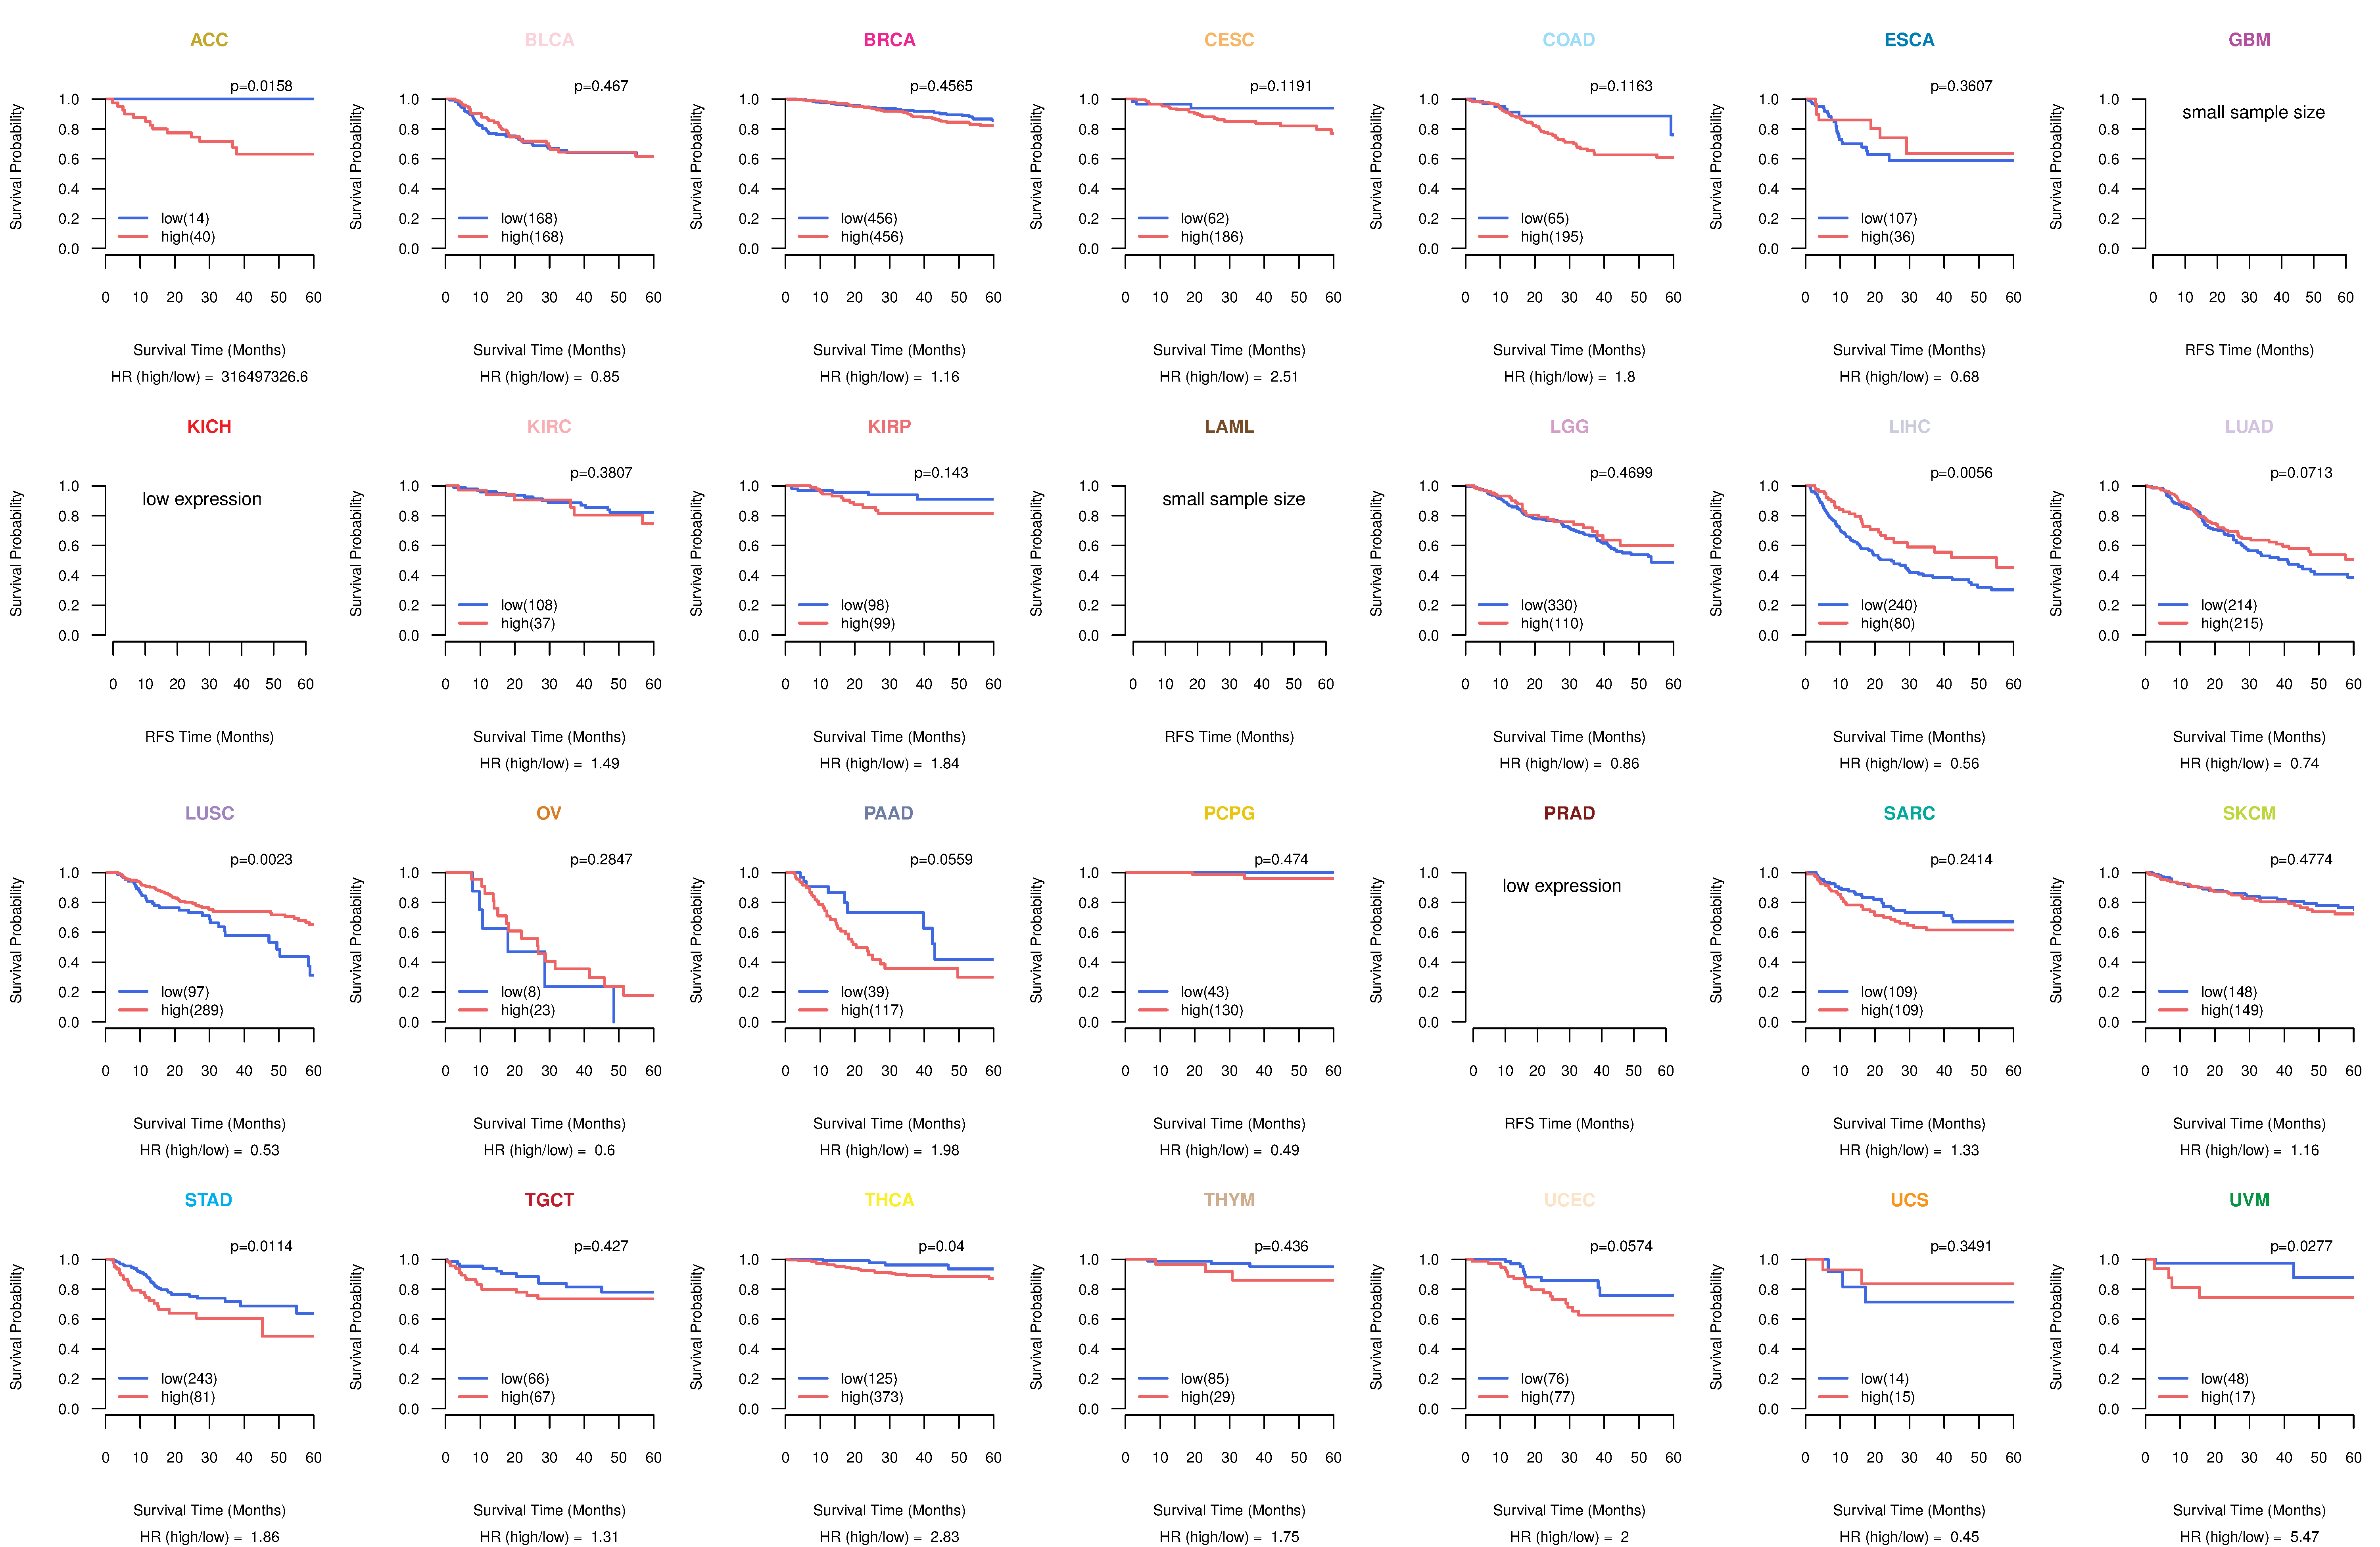
| TissGeneProg for TFR2 |
| Kaplan-Meier plots with logrank tests of overall survival (OS) using 28 cancer types (TCGA IlluminaHiSeq_RNASeqV2, pan-cancer normalized log2(norm_counts+1) data, version 2016-08-16) (TCGA clinicalMatrix, phenotype data, version 2016-04-27) * Click on the image to enlarge it in a new window. |
 |
| Kaplan-Meier plots with logrank test of relapse free survival (RFS) using 28 cancer types (TCGA IlluminaHiSeq_RNASeqV2, pan-cancer normalized log2(norm_counts+1) data, version 2016-08-16) (TCGA clinicalMatrix, phenotype data, version 2016-04-27) * Click on the image enlarge it in a new window. |
 |
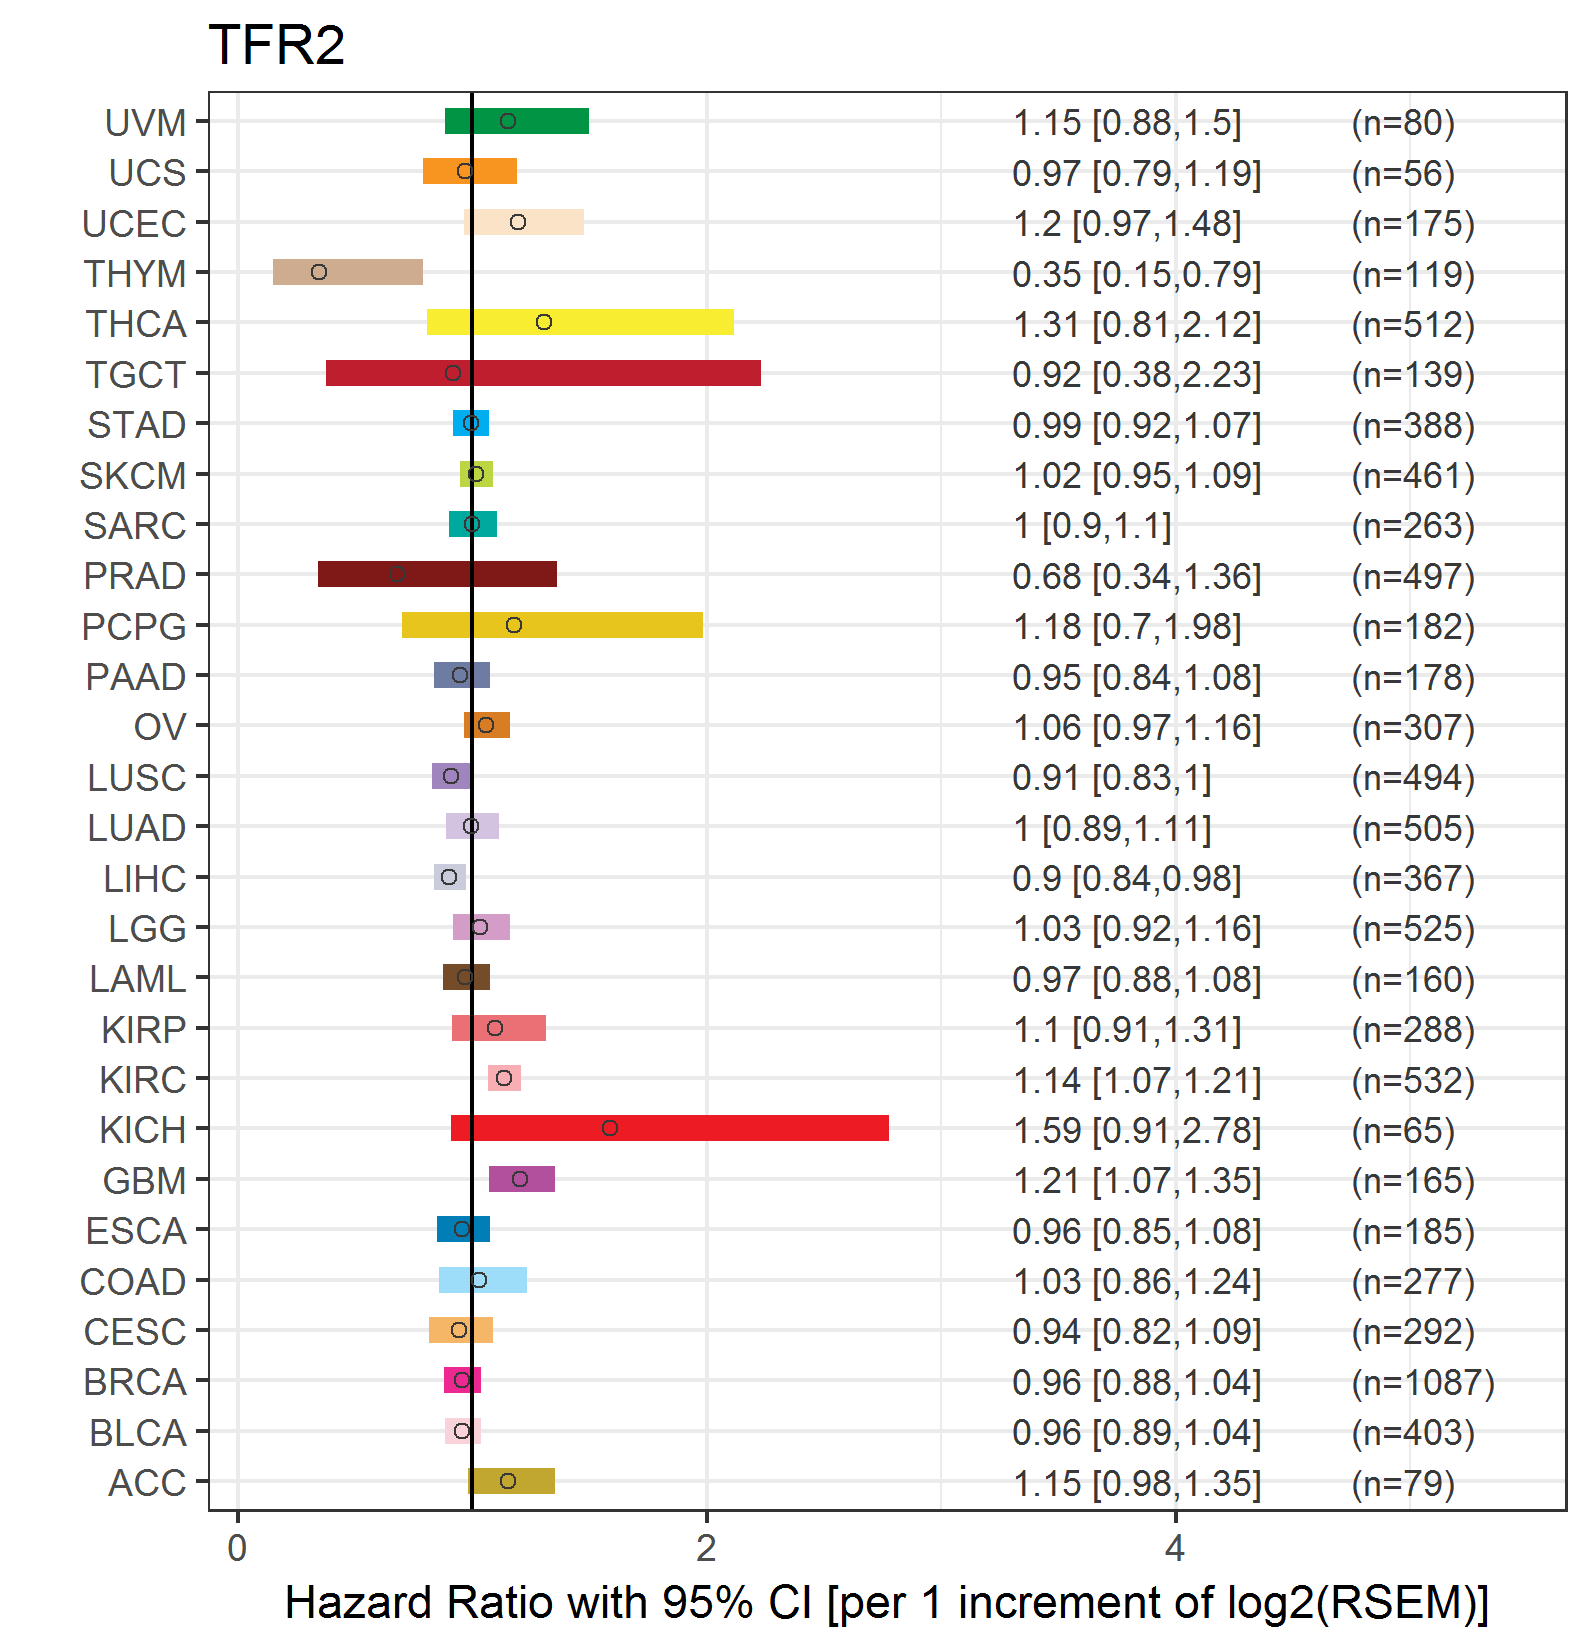
| Forest plot of Cox proportional hazard ratio (HR) and 95% CI of overall survival (OS) using 28 cancer types (TCGA IlluminaHiSeq_RNASeqV2, pan-cancer normalized log2(norm_counts+1) data, version 2016-08-16) (TCGA clinicalMatrix, phenotype data, version 2016-04-27) * Click on the image enlarge it in a new window. |
 |
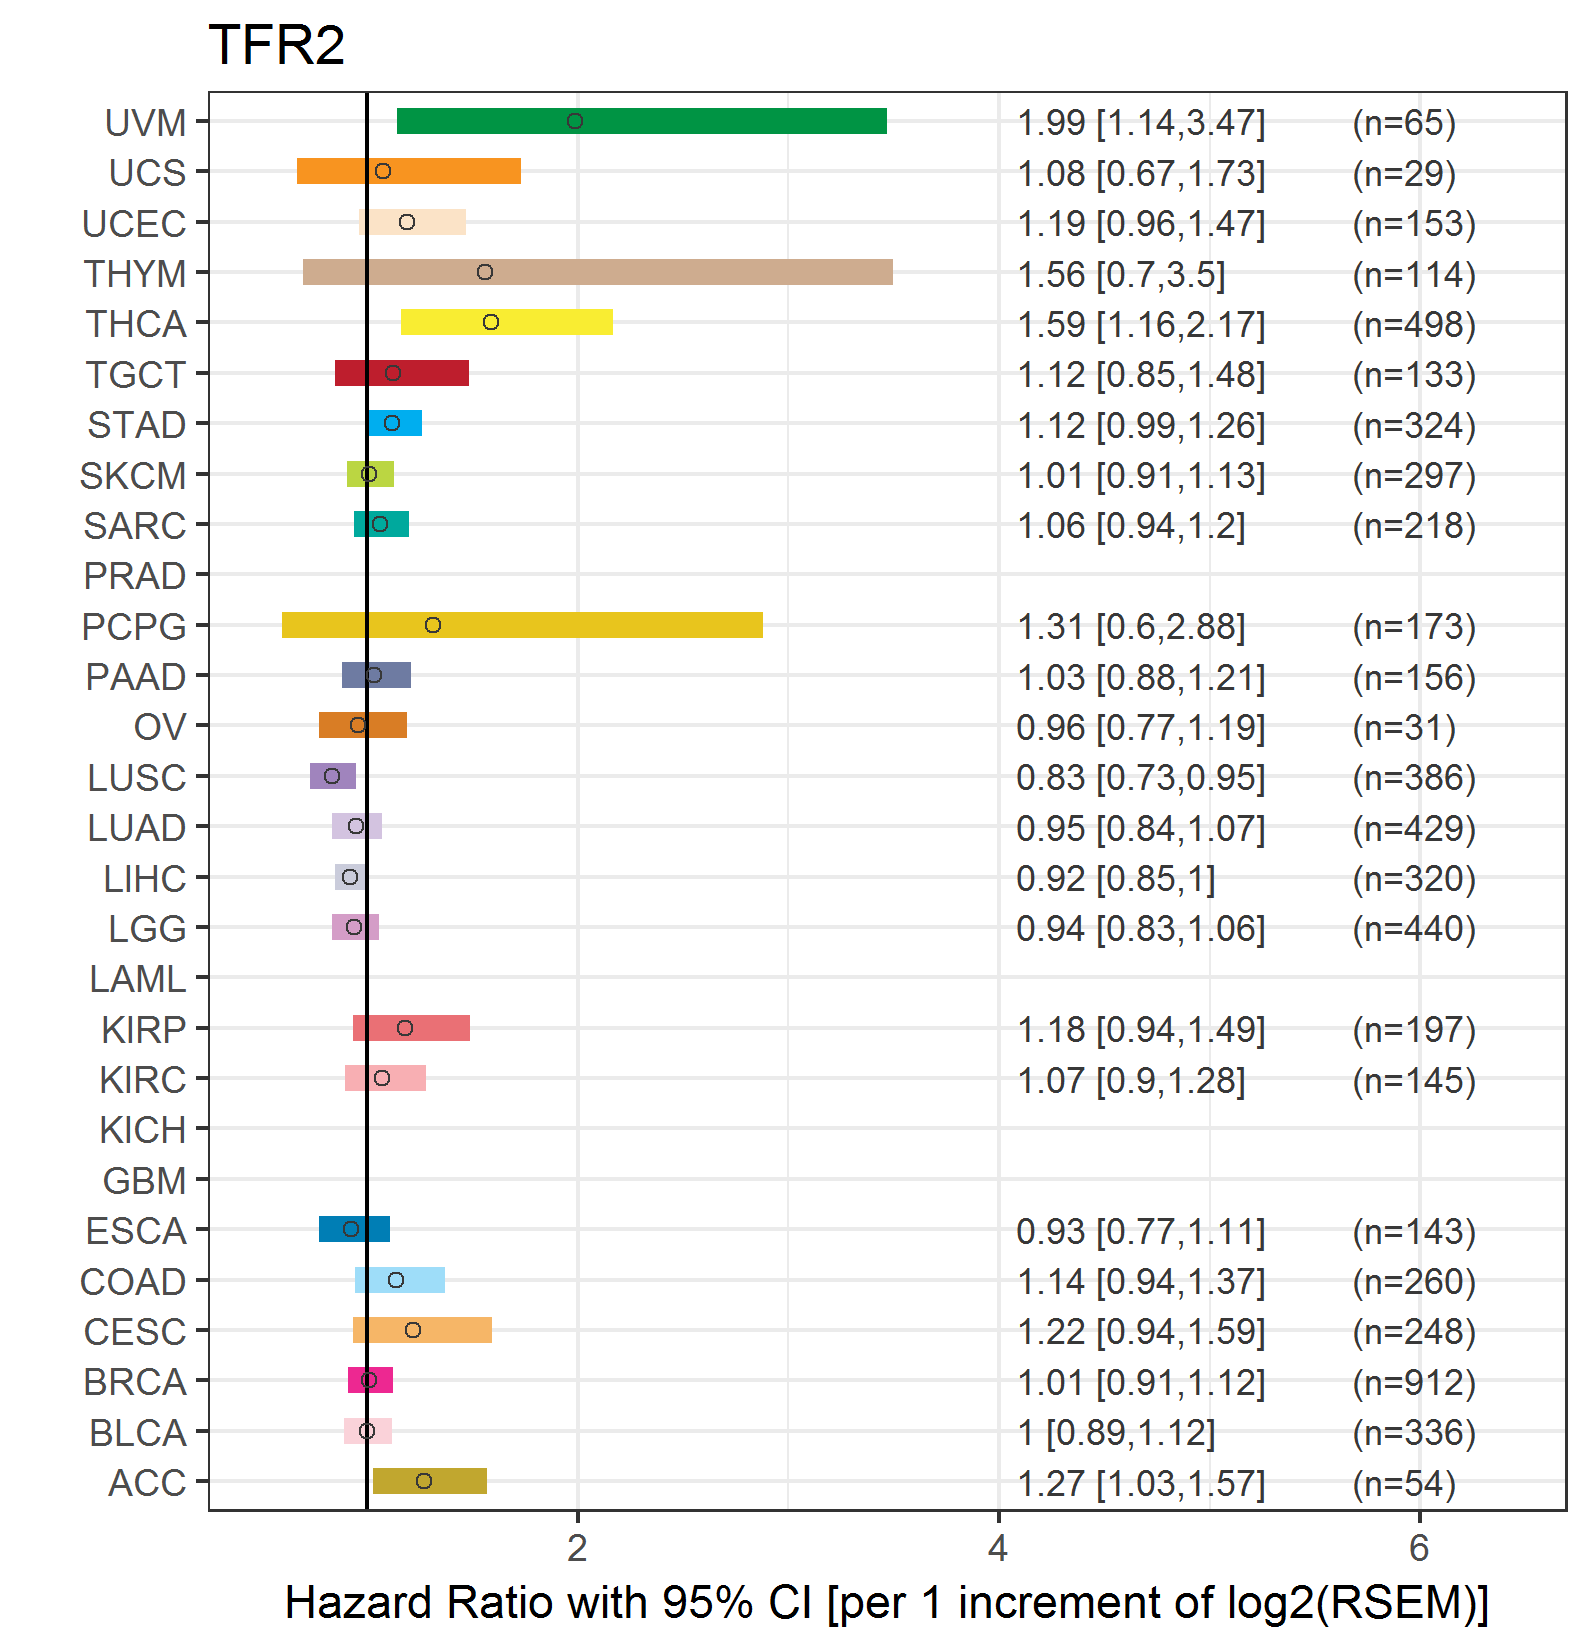
| Forest plot of Cox proportional hazard ratio (HR) and 95% CI of relapse free survival (RFS) using 28 cancer types (TCGA IlluminaHiSeq_RNASeqV2, pan-cancer normalized log2(norm_counts+1) data, version 2016-08-16) (TCGA clinicalMatrix, phenotype data, version 2016-04-27) * Click on the image enlarge it in a new window. |
 |
| Top |
| TissGeneClin for TFR2 |
| TissGeneDrug for TFR2 |
| Drug information targeting TissGene (DrugBank Version 5.0.6, 2017-04-01) |
| DrugBank ID | Drug name | Drug activity | Drug type | Drug status |
| Top |
| TissGeneDisease for TFR2 |
| Disease information associated with TissGene (DisGeNet, 2016-06-01) |
| Disease ID | Disease name | # pubmeds | Source |
| umls:C0018995 | Hemochromatosis | 46 | BeFree,CTD_human,GAD,LHGDN |
| umls:C0282193 | Iron Overload | 34 | BeFree,GAD,LHGDN |
| umls:C0392514 | Hereditary hemochromatosis | 20 | BeFree,CLINVAR |
| umls:C1858664 | HEMOCHROMATOSIS, TYPE 3 | 11 | BeFree,CLINVAR,CTD_human,MGD,ORPHANET,UNIPROT |
| umls:C0268060 | Juvenile hemochromatosis | 7 | BeFree,GAD |
| umls:C2239176 | Liver carcinoma | 6 | BeFree |
| umls:C0023903 | Liver neoplasms | 5 | BeFree |
| umls:C0023467 | Leukemia, Myelocytic, Acute | 3 | BeFree |
| umls:C0002871 | Anemia | 2 | BeFree |
| umls:C0023890 | Liver Cirrhosis | 2 | BeFree |
| umls:C0162566 | Porphyria Cutanea Tarda | 2 | BeFree,GAD |
| umls:C0240066 | Iron deficiency | 2 | BeFree |
| umls:C0242383 | Age related macular degeneration | 2 | BeFree |
| umls:C2827503 | HFE-Associated Hereditary Hemochromatosis | 2 | BeFree |
| umls:C0000786 | Spontaneous abortion | 1 | GAD |
| umls:C0003873 | Rheumatoid Arthritis | 1 | GAD |
| umls:C0004114 | Astrocytoma | 1 | BeFree |
| umls:C0005283 | beta Thalassemia | 1 | BeFree,CTD_human |
| umls:C0006142 | Malignant neoplasm of breast | 1 | GAD |
| umls:C0010674 | Cystic Fibrosis | 1 | GAD |
| umls:C0012715 | Iron Metabolism Disorders | 1 | GAD |
| umls:C0014800 | Hyperplasia erythroid | 1 | BeFree |
| umls:C0020538 | Hypertensive disease | 1 | GAD |
| umls:C0023418 | leukemia | 1 | BeFree |
| umls:C0023440 | Acute Erythroblastic Leukemia | 1 | BeFree |
| umls:C0023449 | Acute lymphocytic leukemia | 1 | BeFree |
| umls:C0023473 | Myeloid Leukemia, Chronic | 1 | BeFree |
| umls:C0023895 | Liver diseases | 1 | GAD |
| umls:C0033027 | Preleukemia | 1 | BeFree |
| umls:C0085576 | Iron-Refractory Iron Deficiency Anemia | 1 | BeFree |
| umls:C0085669 | Acute leukemia | 1 | BeFree |
| umls:C0162316 | Iron deficiency anemia | 1 | BeFree |
| umls:C0239946 | Fibrosis, Liver | 1 | BeFree |
| umls:C0268059 | Neonatal hemochromatosis | 1 | BeFree |
| umls:C0376358 | Malignant neoplasm of prostate | 1 | BeFree |
| umls:C0472767 | Beta thalassemia intermedia | 1 | BeFree |
| umls:C0518014 | Hematocrit level | 1 | GAD,GWASCAT |
| umls:C0524910 | Hepatitis C, Chronic | 1 | GAD |
| umls:C0600139 | Prostate carcinoma | 1 | BeFree |
| umls:C1961102 | Precursor Cell Lymphoblastic Leukemia Lymphoma | 1 | BeFree |
| umls:C3463824 | MYELODYSPLASTIC SYNDROME | 1 | BeFree |
|
Copyright 2016-Present - The University of Texas Health Science Center at Houston (UTHealth) Web File Viewing | How to Report, Fraud, Waste and Abuse | State of Texas | Statewide Search | Texas Homeland Security | Site Policies |