 |
| |
| |
| |
| |
| |
| |
|

| TissGeneSummary for TGM4 |
 Gene summary Gene summary |
| Basic gene information | Gene symbol | TGM4 |
| Gene name | transglutaminase 4 | |
| Synonyms | TGP|hTGP | |
| Cytomap | UCSC genome browser: 3p22-p21.33 | |
| Type of gene | protein-coding | |
| RefGenes | NM_003241.3, | |
| Description | TG(P)TGase PTGase-4fibrinoligaseprostate transglutaminaseprostate-specific transglutaminaseprotein-glutamine gamma-glutamyltransferase 4transglutaminase 4 (prostate)transglutaminase Ptransglutaminase-4 | |
| Modification date | 20141215 | |
| dbXrefs | MIM : 600585 | |
| HGNC : HGNC | ||
| Ensembl : ENSG00000163810 | ||
| HPRD : 08997 | ||
| Vega : OTTHUMG00000133096 | ||
| Protein | UniProt: go to UniProt's Cross Reference DB Table | |
| Expression | CleanEX: HS_TGM4 | |
| BioGPS: 7047 | ||
| Pathway | NCI Pathway Interaction Database: TGM4 | |
| KEGG: TGM4 | ||
| REACTOME: TGM4 | ||
| Pathway Commons: TGM4 | ||
| Context | iHOP: TGM4 | |
| ligand binding site mutation search in PubMed: TGM4 | ||
| UCL Cancer Institute: TGM4 | ||
| Assigned class in TissGDB* | A | |
| Included tissue-specific gene expression resources | HPA,TiGER,GTEx | |
| Specific-tissues in normal samples (assigned by TissGDB using HPA, TiGER, and GTEx) | Prostate | |
| Cancer types related to the specific-tissues in cancer samples (assigned by TissGDB using TCGA) | PRAD | |
| Reference showing the relevant tissue of TGM4 | The human prostate-specific transglutaminase gene (TGM4): genomic organization, tissue-specific expression, and promoter characterization. Genomics. 1998 Aug 1;51(3):434-44. (pmid:9721214) go to article | |
| Description by TissGene annotations | TissgsKTS CNV lost TissGeneKTS | |
| * Class A consists of genes with literature evidence and is part of the cTissGenes. Class B consists of only cTissGenes without additional evidence. The remaining genes belong to Class C. |
| Gene ontology having evidence of Inferred from Direct Assay (IDA) from Entrez |
| GO ID | GO term | PubMed ID |
| Top |
| TissGeneExp for TGM4 |
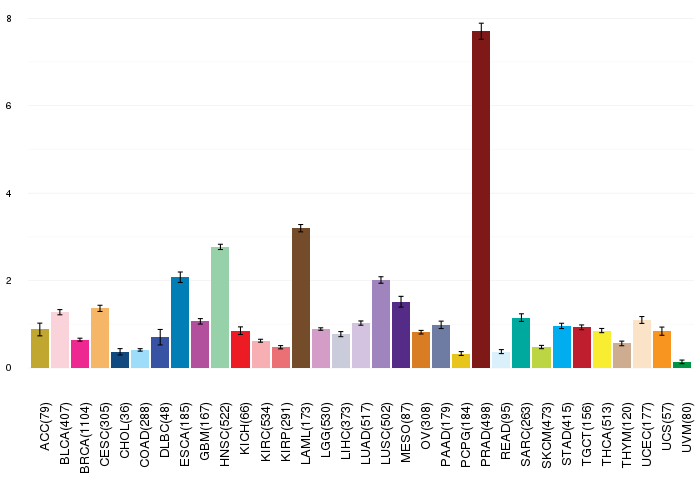
| Gene expressions across 28 cancer types (X-axis: cancer type and Y-axis: log2(norm_counts+1)) (TCGA IlluminaHiSeq_RNASeqV2, pan-cancer normalized log2(norm_counts+1) data, version 2016-08-16) |
 |
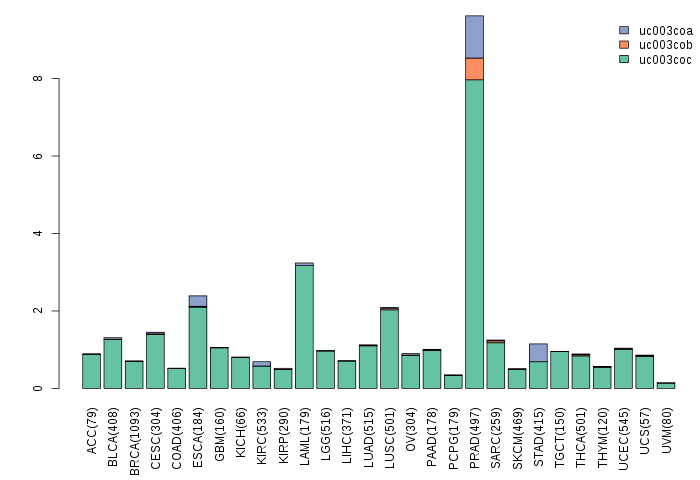
| Gene isoform expressions across 28 cancer types (X-axis: cancer type and Y-axis: log2(norm_counts+1)) (TCGA pan-cancer tcga_rsem_isoform_tpm, version 2016-09-01) |
 |
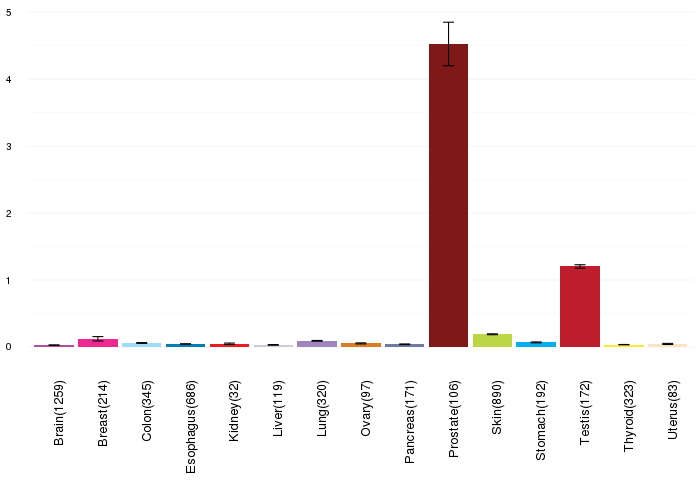
| Gene expressions across normal tissues of GTEx data (GTEx GTEx_Analysis_v6_RNA-seq_RNA-SeQCv1.1.8_gene_rpkm.gct) - Here, we shows the matched tissue types only among our 28 cancer types. |
 |
| Different expressions across 14 cancer types with more than 10 samples between matched tumors and normals (X-axis: cancer type and Y-axis: log2(norm_counts+1)) (TCGA IlluminaHiSeq_RNASeqV2, pan-cancer normalized log2(norm_counts+1) data, version 2016-08-16) |
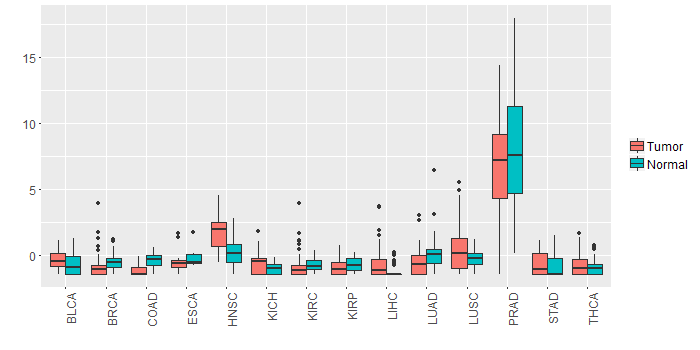 |
| - Significantly differentially expressed cancer types and information. (|Fold change|>1 and FDR<0.05) |
| Cancer type | Mean(exp) in tumor | Mean(exp) in matched normal | Log2FC | P-val. | FDR |
| HNSC | 1.75021101 | 0.173934265 | 1.576276744 | 4.60E-08 | 4.81E-07 |
| Top |
| TissGene-miRNA for TGM4 |
| Significantly anti-correlated miRNAs of TissGene across 28 cancer types (Gene-miRNA relations from TargetScanHuman Relsease 7.1, Conserved_Site_Context_Scores.txt.zip, 06.01.2016) (TCGA IlluminaHiSeq_miRNASeq, log2(RPM+1) data, version 2016-11-21) (TCGA IlluminaHiSeq_RNASeqV2, log2(normalized_count+1) data, version 2016-08-16) (Spearman’s Rank Correlation (p-value<0.05 and coefficient<-0.25)) |
| Cancer type | miRNA id | miRNA accession | P-val. | Coeff. | # samples |
| Top |
| TissGeneMut for TGM4 |
| TissGeneSNV for TGM4 |
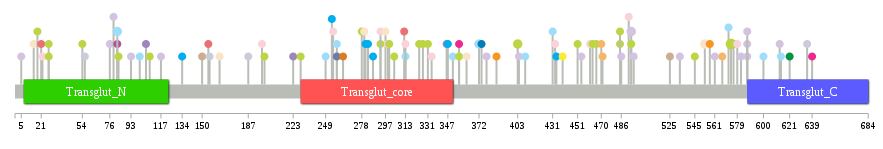
| nsSNV counts per each loci. Different colors of circles represent different cancer types. Circle size denotes number of samples. (TCGA somatic mutation (SNPs and small INDELs) data, version 2016-04-25) * Click on the image to enlarge it in a new window. |
 |
 |
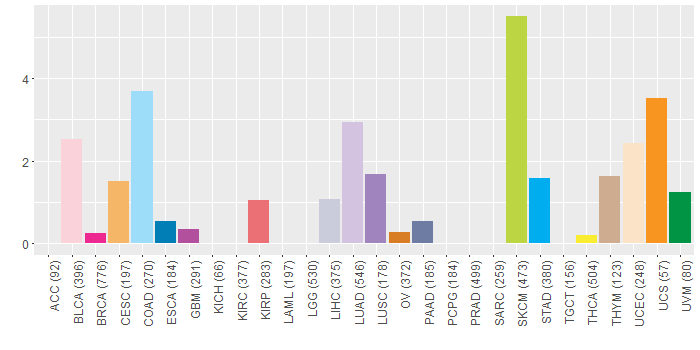
| Somatic nucleotide variants of TissGene across 28 cancer types (X-axis: cancer type and Y-axis: % of mutated samples) The numbers in parentheses are numbers of samples with mutation (nsSNVs). (TCGA somatic mutation (SNPs and small INDELs) data, version 2016-04-25) |
 |
| - nsSNVs sorted by frequency. |
| AAchange | Cancer type | # samples |
| p.E574K | SKCM | 4 |
| p.L494R | LUAD | 2 |
| p.G403E | SKCM | 2 |
| p.R372C | COAD | 2 |
| p.T82M | COAD | 2 |
| p.A553T | UCEC | 2 |
| p.S54F | SKCM | 1 |
| p.L93I | LUAD | 1 |
| p.M400V | DLBC | 1 |
| p.V304M | SKCM | 1 |
| p.V105F | LUSC | 1 |
| p.D331N | SKCM | 1 |
| p.Q404K | LUAD | 1 |
| p.I561F | LUAD | 1 |
| p.D293N | BLCA | 1 |
| p.S545Y | SKCM | 1 |
| p.R465K | HNSC | 1 |
| p.E470D | CESC | 1 |
| p.D525Y | THYM | 1 |
| p.F15L | UCEC | 1 |
| p.P587N | LUAD | 1 |
| p.D297N | UCEC | 1 |
| p.P66R | HNSC | 1 |
| p.K621Q | UVM | 1 |
| p.D557H | UCS | 1 |
| p.G312D | KIRP | 1 |
| p.N486K | LUAD | 1 |
| p.E299Q | BLCA | 1 |
| p.W324X | SKCM | 1 |
| p.T582M | LUAD | 1 |
| p.Q18* | SKCM | 1 |
| p.R356Q | SKCM | 1 |
| p.P83S | SKCM | 1 |
| p.V22I | BLCA | 1 |
| p.A614V | COAD | 1 |
| p.T82M | GBM | 1 |
| p.R300K | SKCM | 1 |
| p.G283C | STAD | 1 |
| p.S249T | COAD | 1 |
| p.S108F | SKCM | 1 |
| p.E313K | COAD | 1 |
| p.H56Q | LIHC | 1 |
| p.E313D | BLCA | 1 |
| p.Q254H | STAD | 1 |
| p.G485E | SKCM | 1 |
| p.E558K | HNSC | 1 |
| p.K439* | THCA | 1 |
| p.P587T | LUAD | 1 |
| p.Q533K | LUAD | 1 |
| p.Q633K | HNSC | 1 |
| p.K156I | LIHC | 1 |
| p.E463K | SKCM | 1 |
| p.A21S | KIRP | 1 |
| p.R356Q | BRCA | 1 |
| p.P587H | LUAD | 1 |
| p.N258K | PAAD | 1 |
| p.R466Q | SKCM | 1 |
| p.E558Q | HNSC | 1 |
| p.G374V | ESCA | 1 |
| p.C362* | UCEC | 1 |
| p.H327Y | SKCM | 1 |
| p.M334I | BLCA | 1 |
| p.Q347R | STAD | 1 |
| p.D293N | SKCM | 1 |
| p.Q117K | LUAD | 1 |
| p.I378V | LUAD | 1 |
| p.M451I | SKCM | 1 |
| p.V278M | SKCM | 1 |
| p.E223Q | LUSC | 1 |
| p.G485R | SKCM | 1 |
| p.V263L | OV | 1 |
| p.S572A | COAD | 1 |
| p.D433Y | BLCA | 1 |
| p.W27* | SKCM | 1 |
| p.R287C | STAD | 1 |
| p.L613M | LUAD | 1 |
| p.N258K | COAD | 1 |
| p.E461Q | BLCA | 1 |
| p.M576I | SKCM | 1 |
| p.F386L | UCS | 1 |
| p.E100D | COAD | 1 |
| p.A351T | COAD | 1 |
| p.D79H | LUAD | 1 |
| p.S635P | LIHC | 1 |
| p.L134I | STAD | 1 |
| p.E198K | BLCA | 1 |
| p.N187K | LIHC | 1 |
| p.S200F | SKCM | 1 |
| p.R280I | UCEC | 1 |
| p.W333C | HNSC | 1 |
| p.L229F | SKCM | 1 |
| p.G164D | UCEC | 1 |
| p.E579K | BLCA | 1 |
| p.N471Y | CESC | 1 |
| p.S5L | LUAD | 1 |
| p.Q255H | BLCA | 1 |
| p.L494F | SKCM | 1 |
| p.V492M | BLCA | 1 |
| p.W346R | LUSC | 1 |
| p.T639M | BRCA | 1 |
| p.A567V | HNSC | 1 |
| p.R431W | COAD | 1 |
| p.P150S | THYM | 1 |
| p.G600R | COAD | 1 |
| p.R496W | LUAD | 1 |
| p.R155H | KIRP | 1 |
| p.A567V | CESC | 1 |
| p.G345S | HNSC | 1 |
| p.W27X | SKCM | 1 |
| p.I434V | STAD | 1 |
| p.F326L | READ | 1 |
| p.E185Q | HNSC | 1 |
| p.A454V | LUAD | 1 |
| p.A281V | STAD | 1 |
| p.V409I | COAD | 1 |
| p.V76E | LUAD | 1 |
| Top |
| TissGeneCNV for TGM4 |
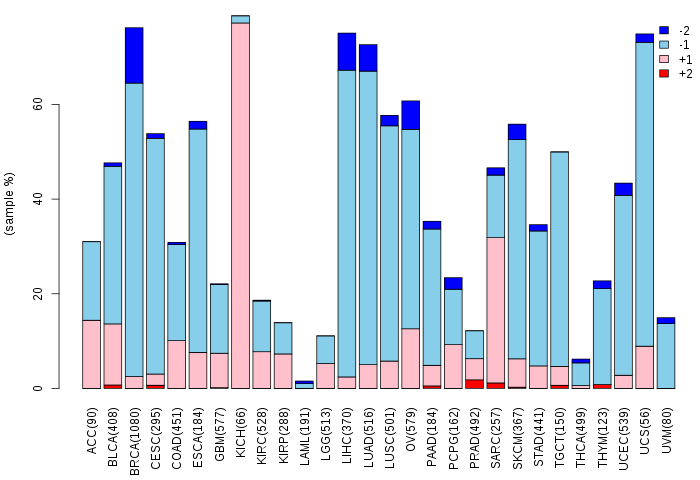
| Copy number variations of TissGene across 28 cancer types (X-axis: cancer type and Y-axis: % of CNV samples) (TCGA Gistic2_CopyNumber_Gistic2_all_data_by_genes, Gistic2 copy number data, version 2016-08-16) |
 |
| Top |
| TissGeneFusions for TGM4 |
| Fusion genes including TissGene (ChimerDB 3.0, 2016-12-01 and TCGA fusion Portal 2015-12-01) |
| Database | Src | Cancer type | Sample | Fusion gene | ORF | 5'-gene BP | 3'-gene BP |
| Top |
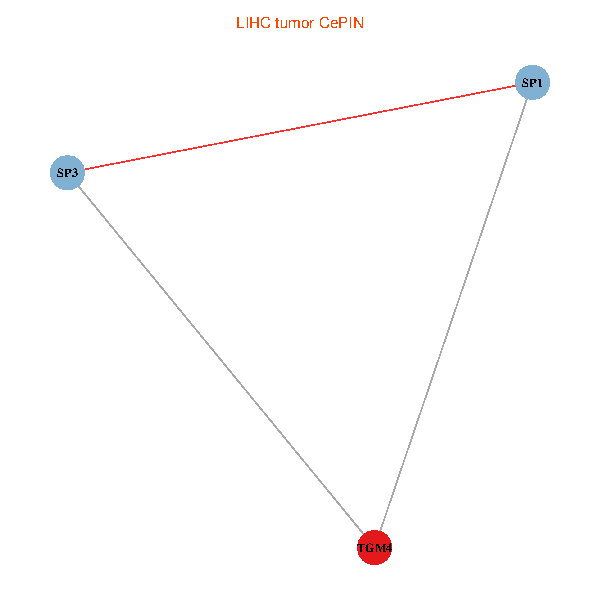
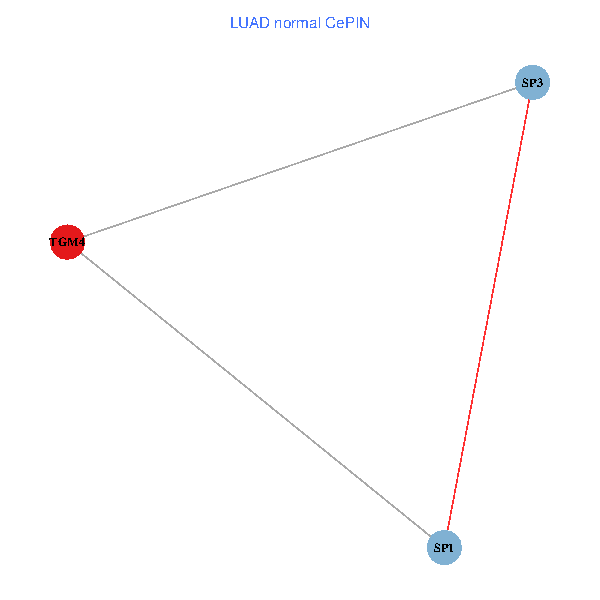
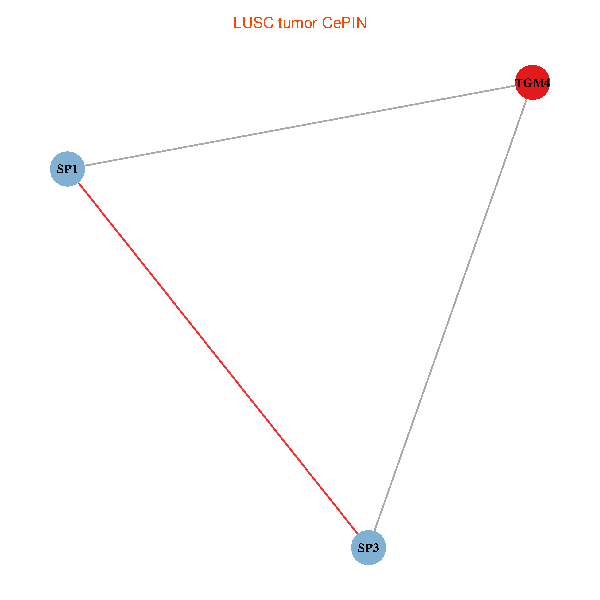
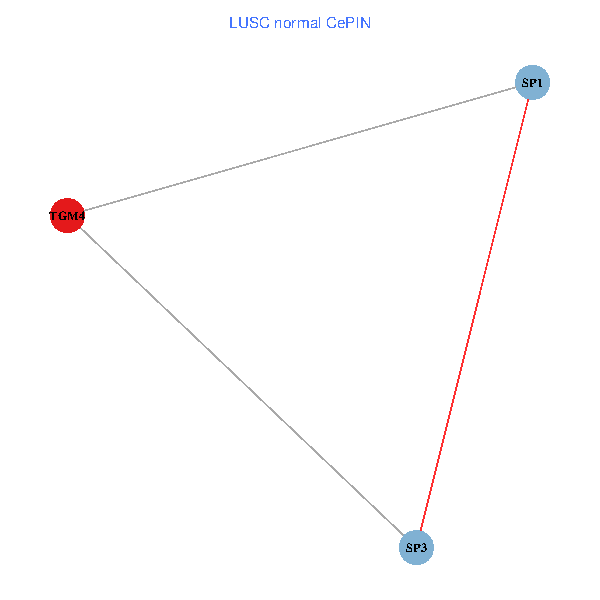
| TissGeneNet for TGM4 |
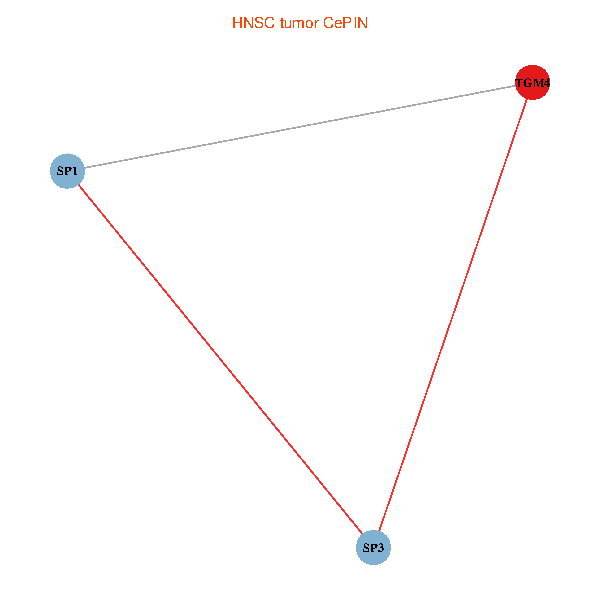
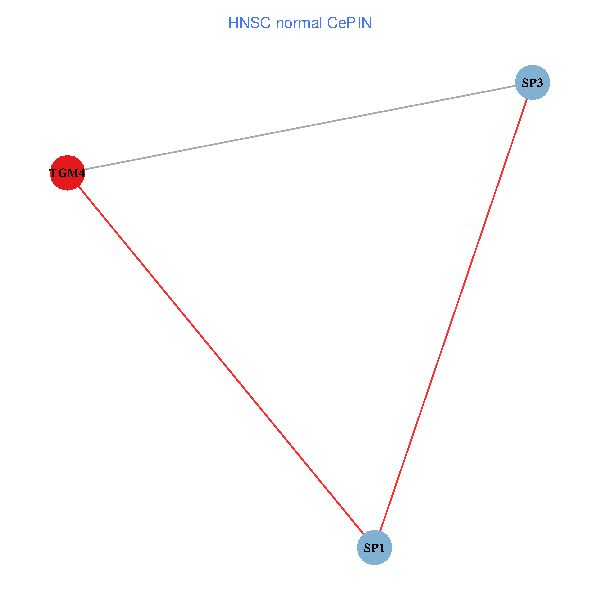
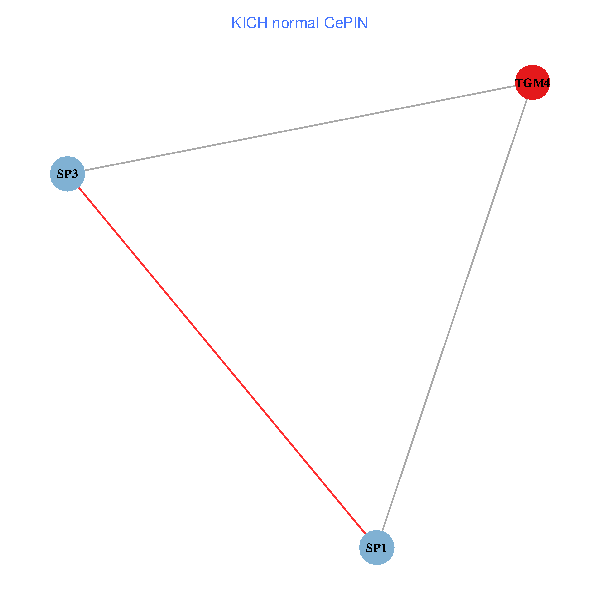
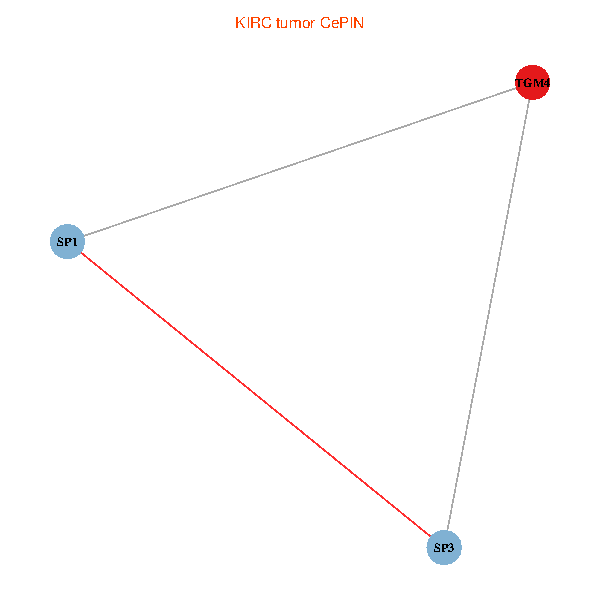
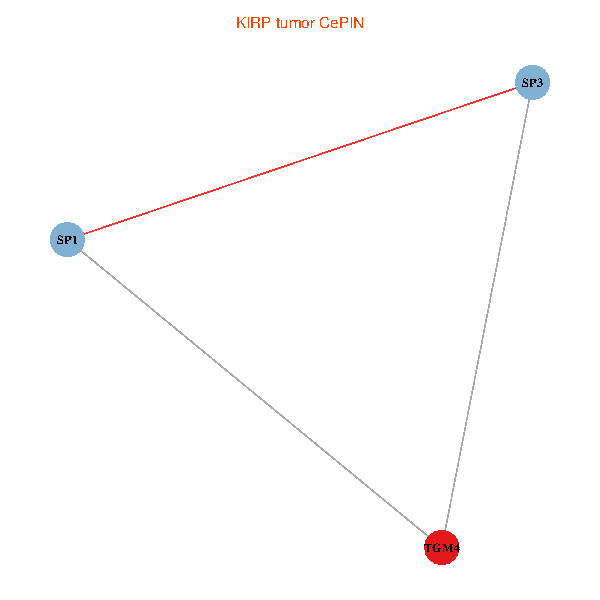
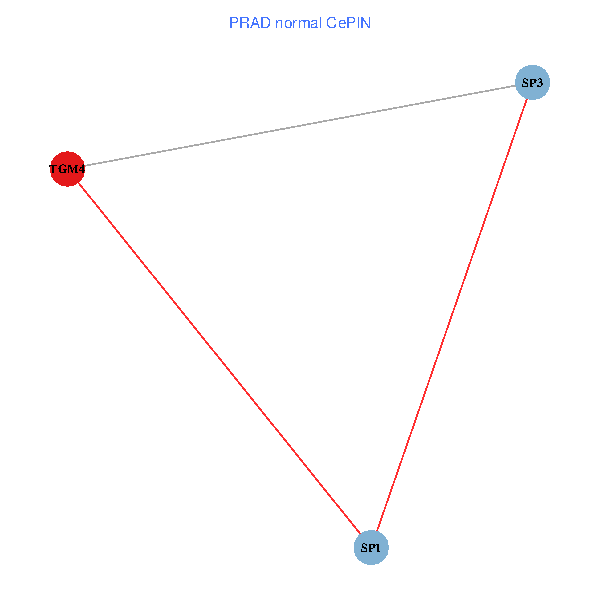
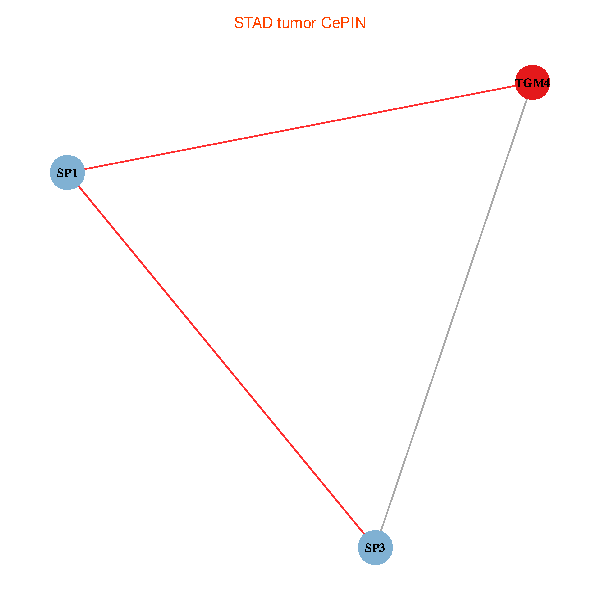
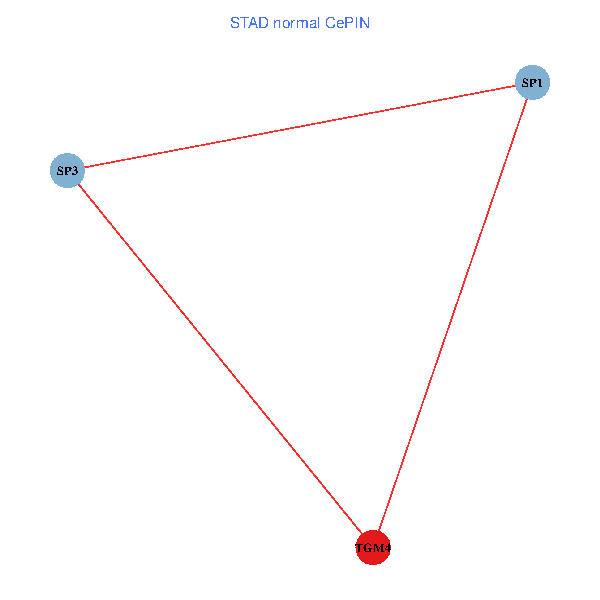
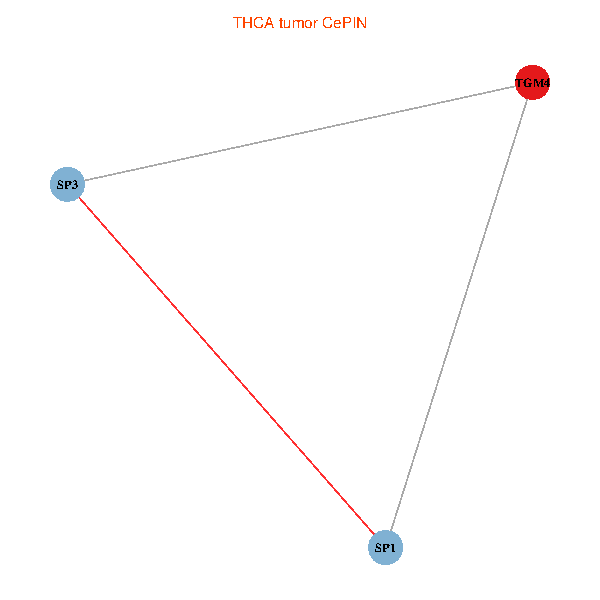
| Co-expressed gene networks based on protein-protein interaction data (CePIN) (TCGA IlluminaHiSeq_RNASeqV2, pan-cancer normalized log2(norm_counts+1) data, version 2016-08-16) (PINA2 ppi data) |
| BRCA (tumor) | BRCA (normal) |
| TGM4, SP1, SP3 (tumor) | TGM4, SP1, SP3 (normal) |
 |  |
| COAD (tumor) | COAD (normal) |
| TGM4, SP1, SP3 (tumor) | TGM4, SP1, SP3 (normal) |
 |  |
| HNSC (tumor) | HNSC (normal) |
| TGM4, SP1, SP3 (tumor) | TGM4, SP1, SP3 (normal) |
 |  |
| KICH (tumor) | KICH (normal) |
| TGM4, SP1, SP3 (tumor) | TGM4, SP1, SP3 (normal) |
 |  |
| KIRC (tumor) | KIRC (normal) |
| TGM4, SP1, SP3 (tumor) | TGM4, SP1, SP3 (normal) |
 |  |
| KIRP (tumor) | KIRP (normal) |
| TGM4, SP1, SP3 (tumor) | TGM4, SP1, SP3 (normal) |
 |  |
| LIHC (tumor) | LIHC (normal) |
| TGM4, SP1, SP3 (tumor) | TGM4, SP1, SP3 (normal) |
 |  |
| LUAD (tumor) | LUAD (normal) |
| TGM4, SP1, SP3 (tumor) | TGM4, SP1, SP3 (normal) |
 |  |
| LUSC (tumor) | LUSC (normal) |
| TGM4, SP1, SP3 (tumor) | TGM4, SP1, SP3 (normal) |
 |  |
| PRAD (tumor) | PRAD (normal) |
| TGM4, SP1, SP3 (tumor) | TGM4, SP1, SP3 (normal) |
 |  |
| STAD (tumor) | STAD (normal) |
| TGM4, SP1, SP3 (tumor) | TGM4, SP1, SP3 (normal) |
 |  |
| THCA (tumor) | THCA (normal) |
| TGM4, SP1, SP3 (tumor) | TGM4, SP1, SP3 (normal) |
 |  |
| Top |
| TissGeneProg for TGM4 |
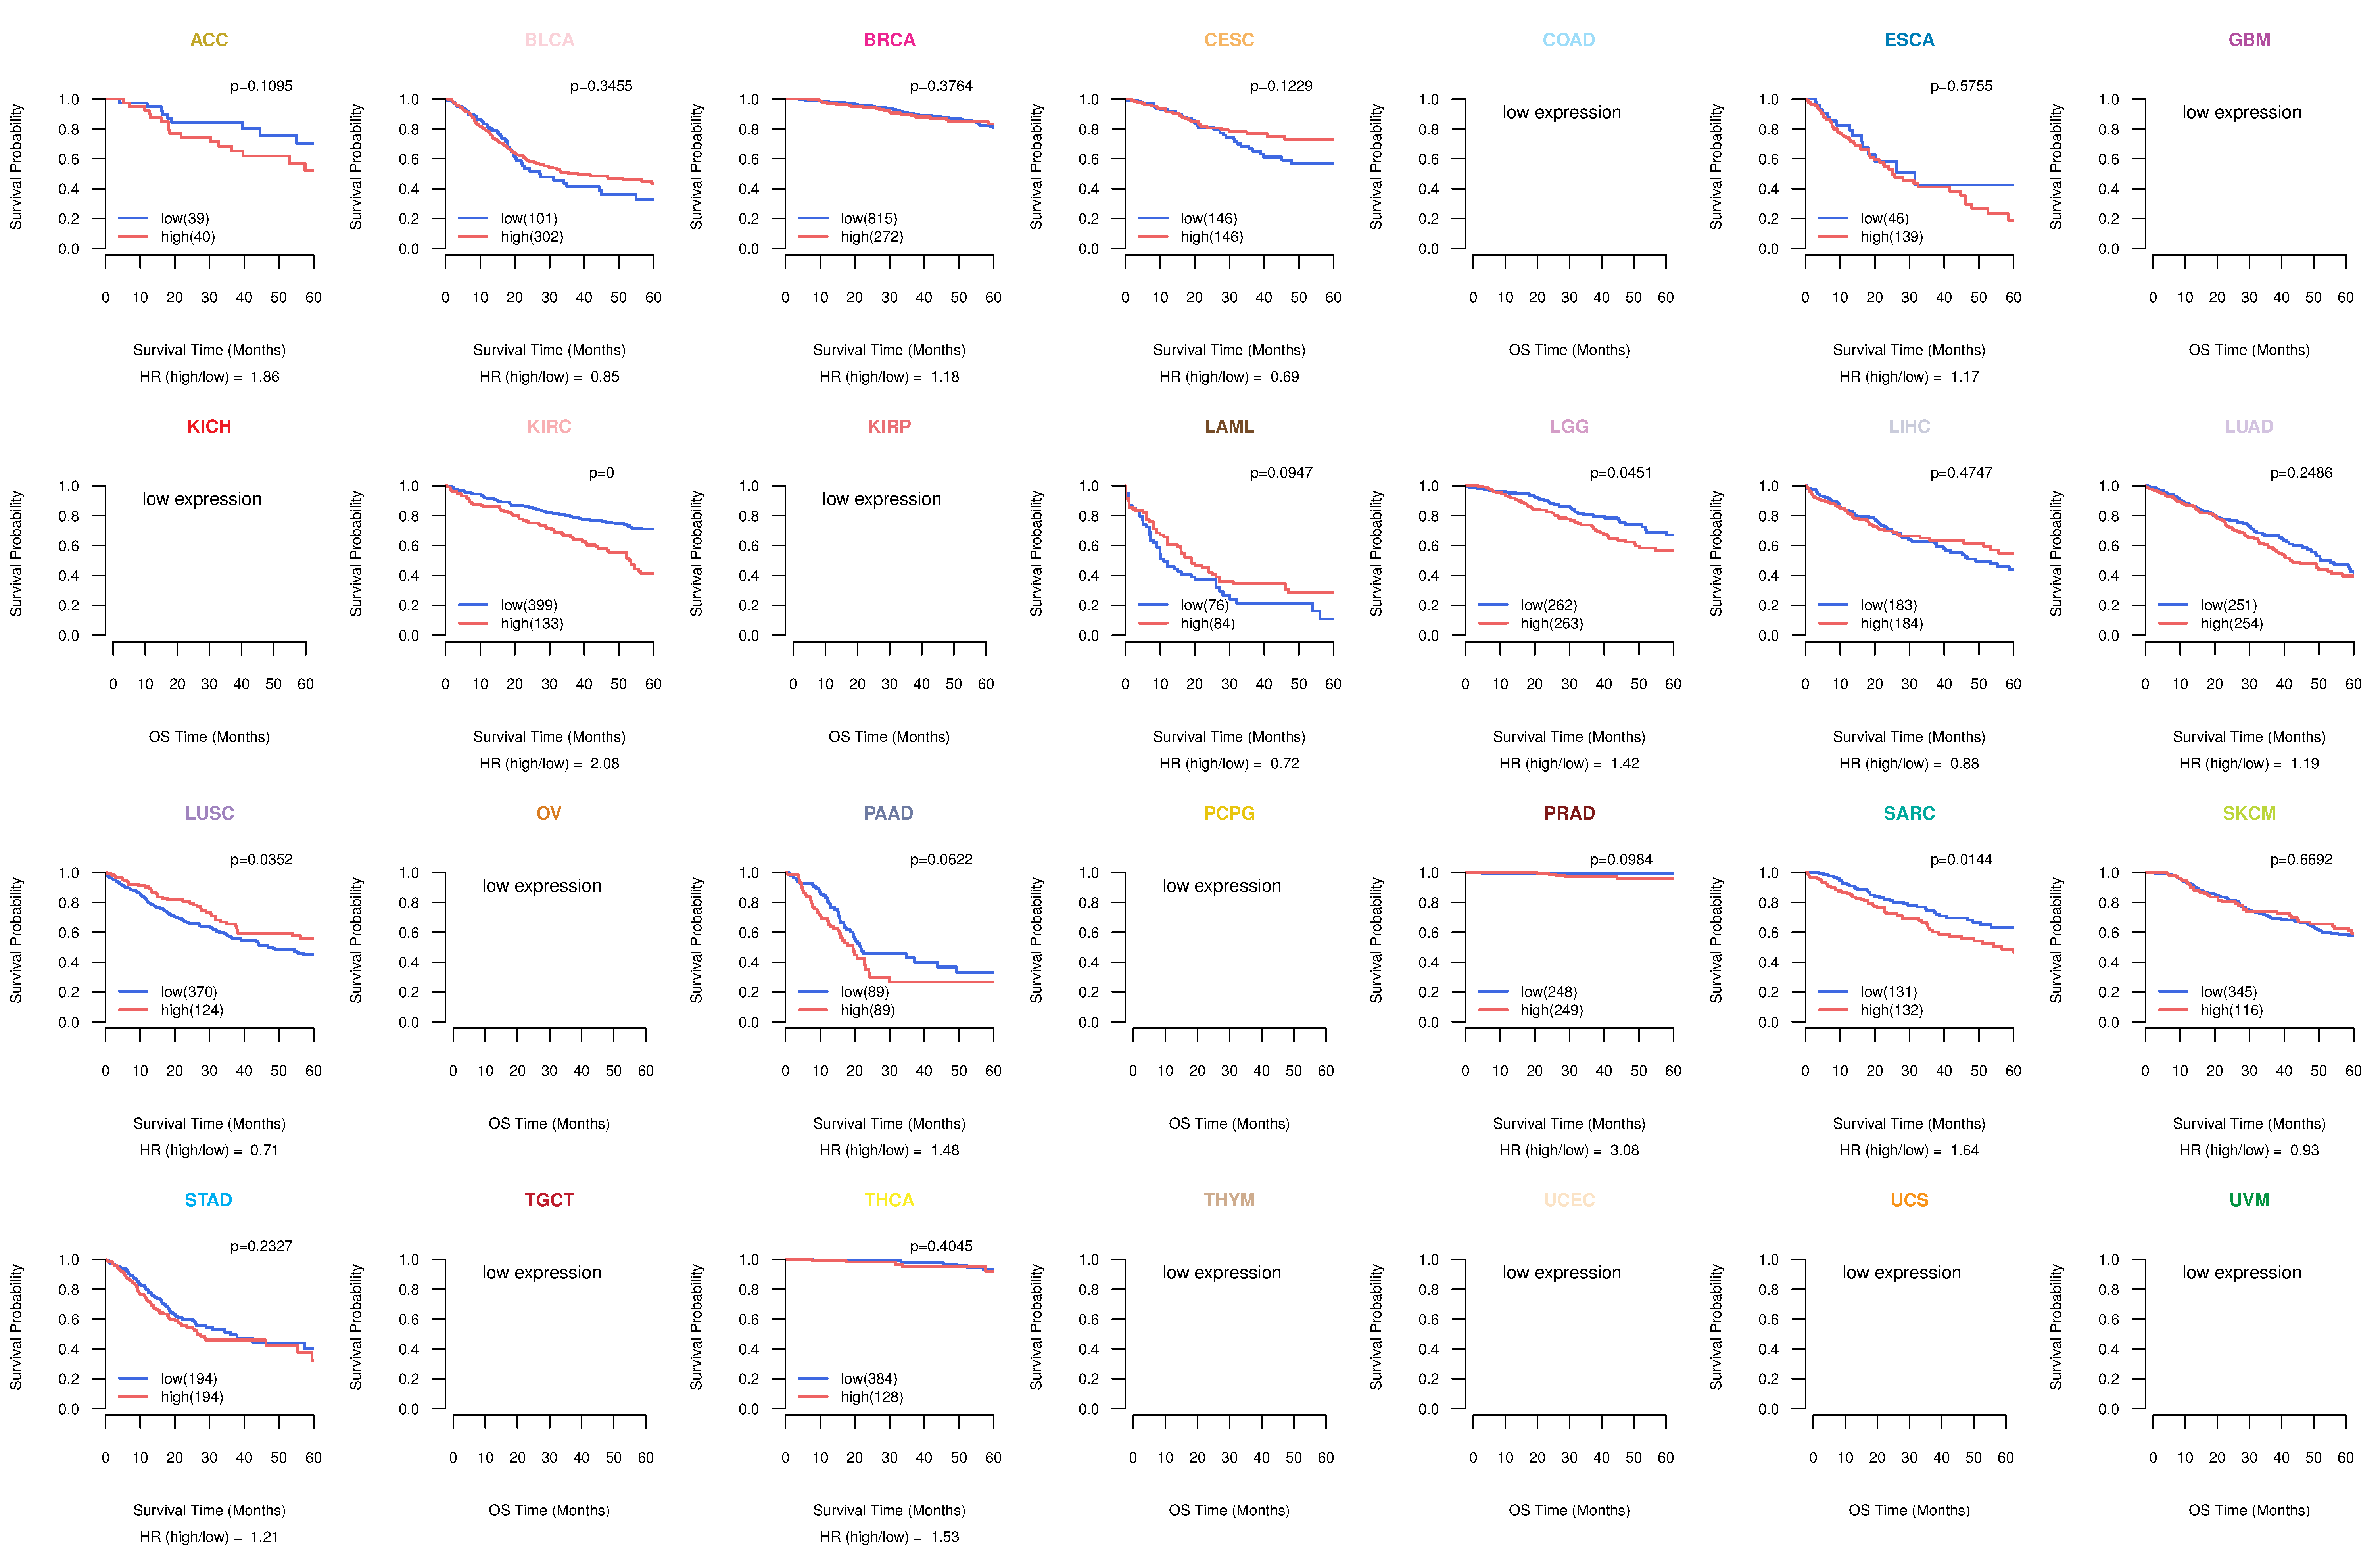
| Kaplan-Meier plots with logrank tests of overall survival (OS) using 28 cancer types (TCGA IlluminaHiSeq_RNASeqV2, pan-cancer normalized log2(norm_counts+1) data, version 2016-08-16) (TCGA clinicalMatrix, phenotype data, version 2016-04-27) * Click on the image to enlarge it in a new window. |
 |
| Kaplan-Meier plots with logrank test of relapse free survival (RFS) using 28 cancer types (TCGA IlluminaHiSeq_RNASeqV2, pan-cancer normalized log2(norm_counts+1) data, version 2016-08-16) (TCGA clinicalMatrix, phenotype data, version 2016-04-27) * Click on the image enlarge it in a new window. |
 |
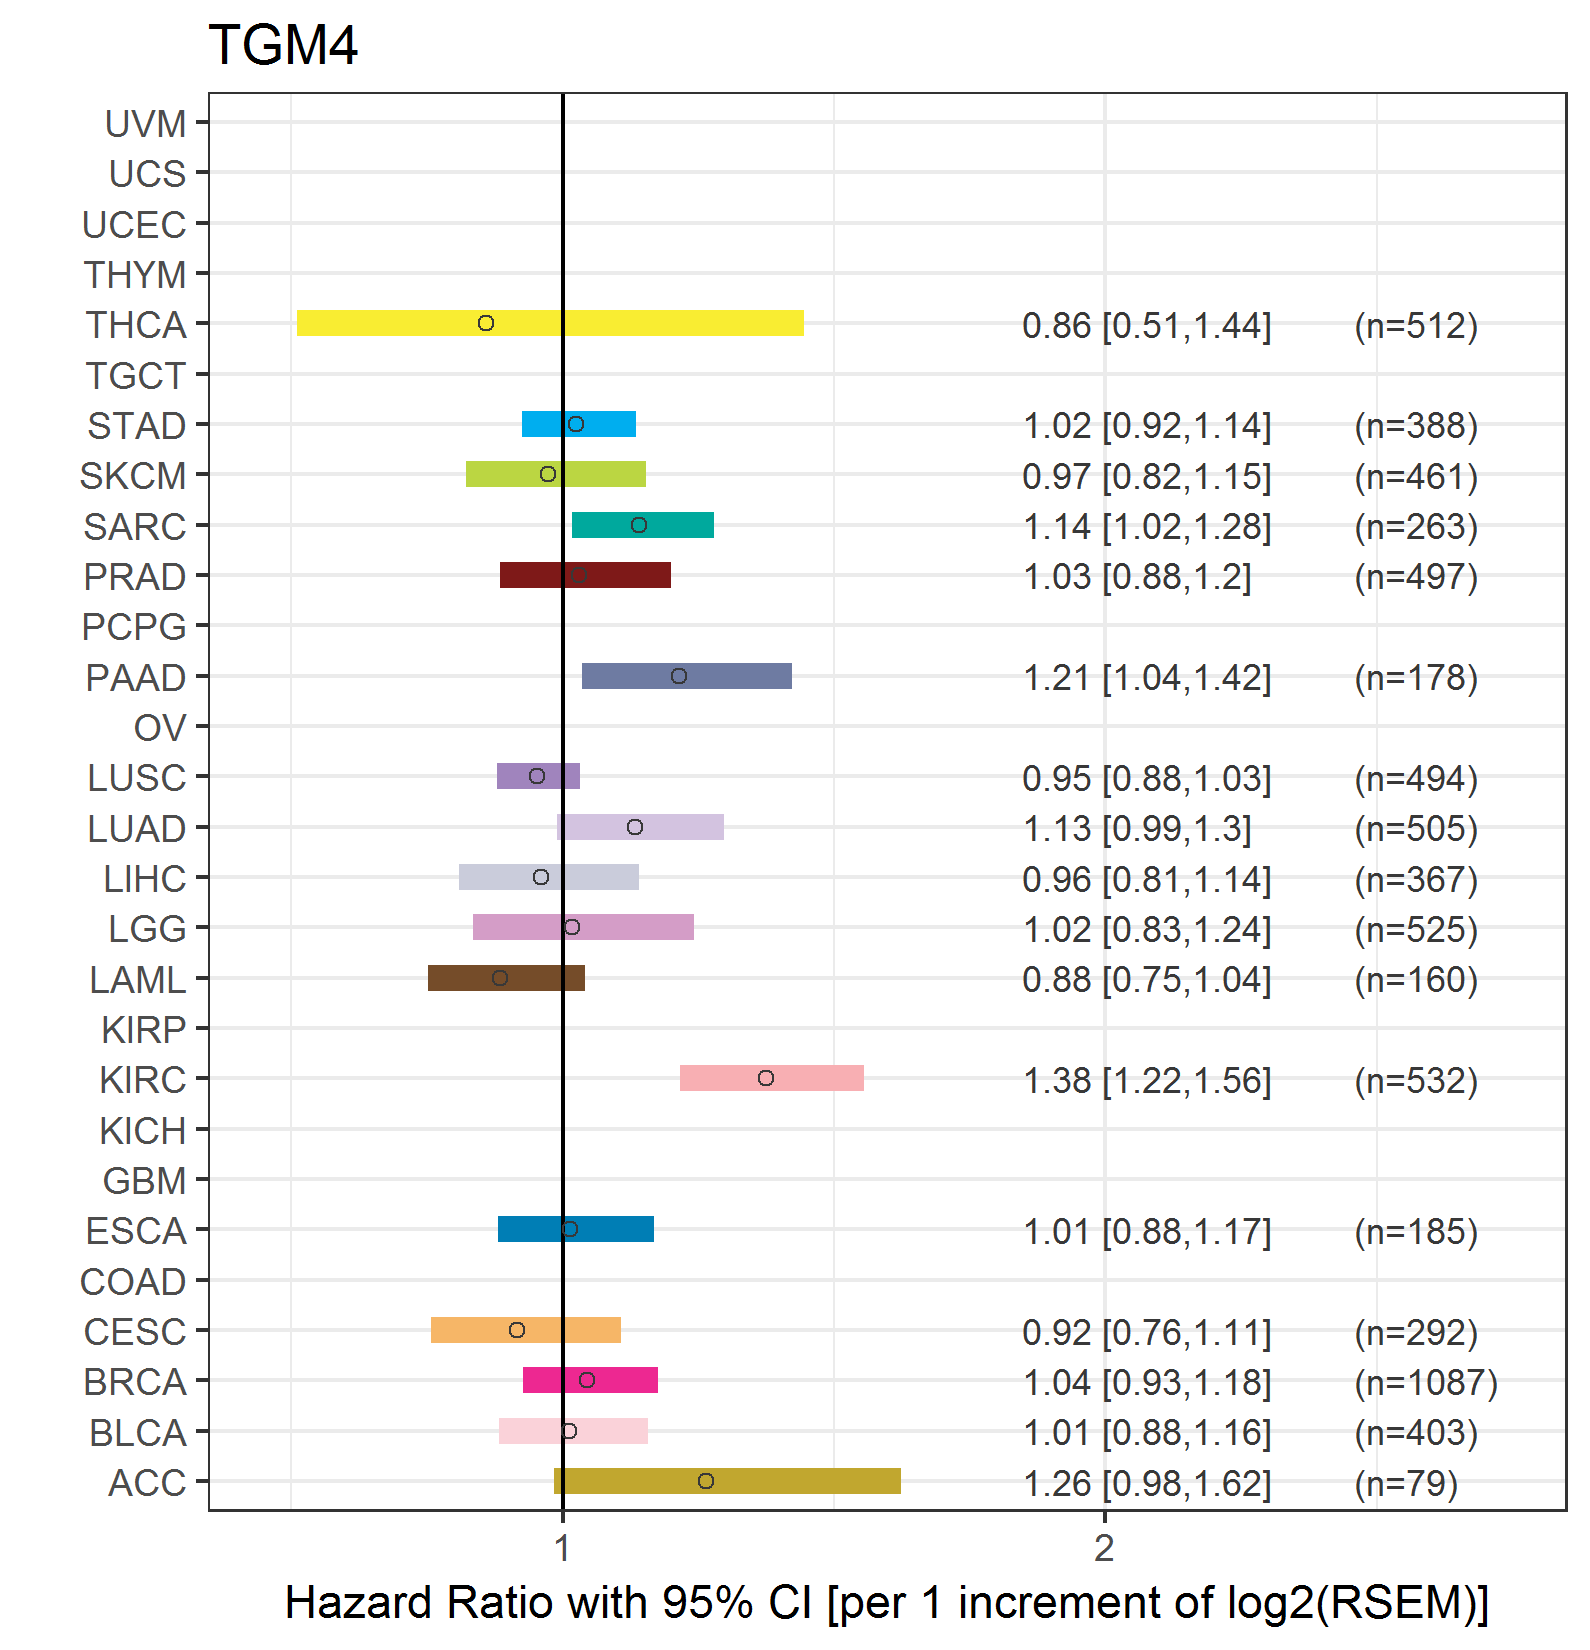
| Forest plot of Cox proportional hazard ratio (HR) and 95% CI of overall survival (OS) using 28 cancer types (TCGA IlluminaHiSeq_RNASeqV2, pan-cancer normalized log2(norm_counts+1) data, version 2016-08-16) (TCGA clinicalMatrix, phenotype data, version 2016-04-27) * Click on the image enlarge it in a new window. |
 |
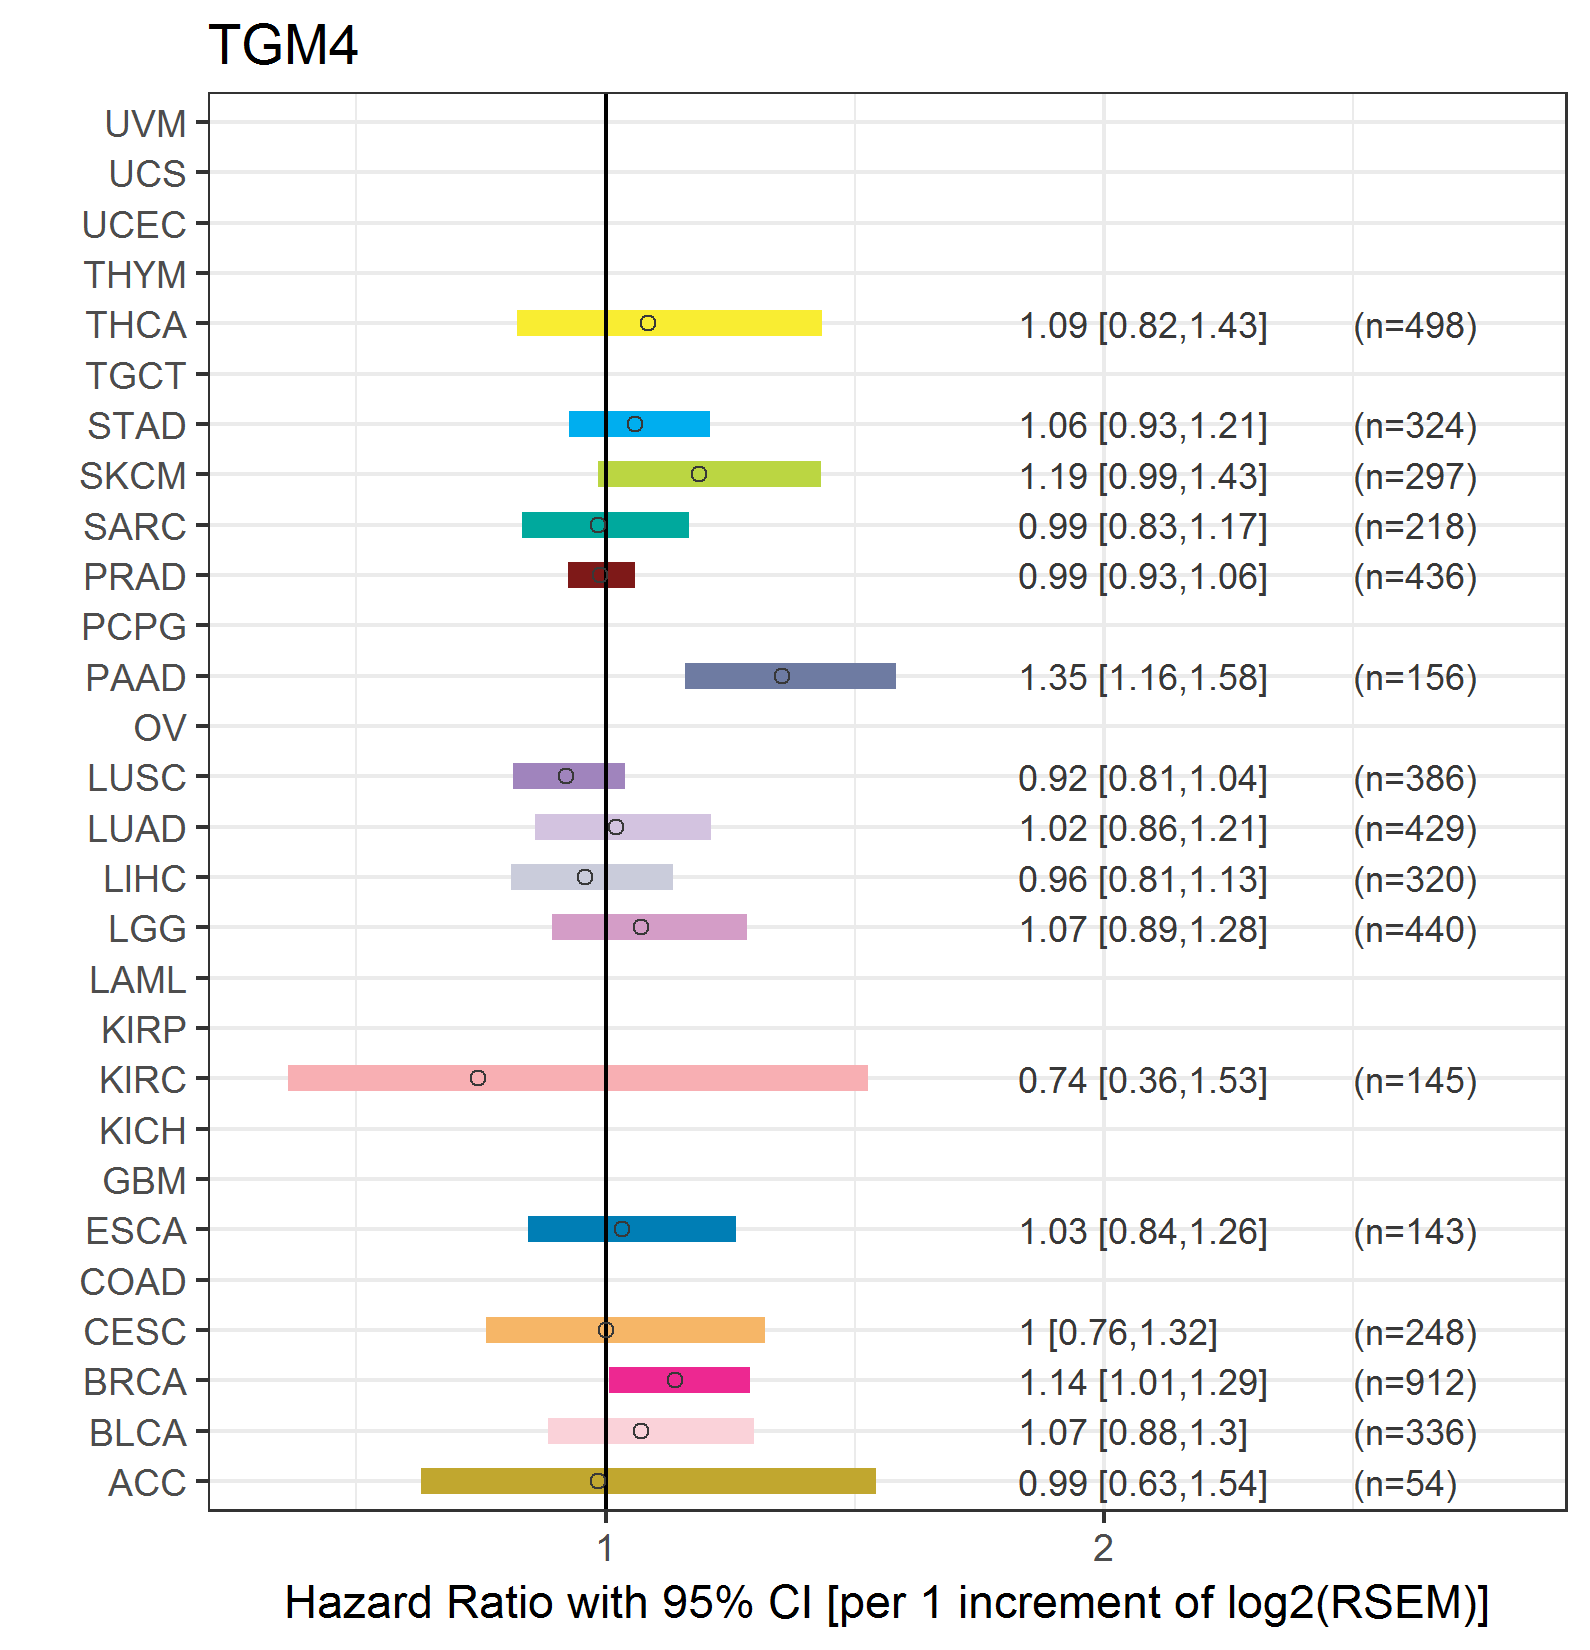
| Forest plot of Cox proportional hazard ratio (HR) and 95% CI of relapse free survival (RFS) using 28 cancer types (TCGA IlluminaHiSeq_RNASeqV2, pan-cancer normalized log2(norm_counts+1) data, version 2016-08-16) (TCGA clinicalMatrix, phenotype data, version 2016-04-27) * Click on the image enlarge it in a new window. |
 |
| Top |
| TissGeneClin for TGM4 |
| TissGeneDrug for TGM4 |
| Drug information targeting TissGene (DrugBank Version 5.0.6, 2017-04-01) |
| DrugBank ID | Drug name | Drug activity | Drug type | Drug status |
| Top |
| TissGeneDisease for TGM4 |
| Disease information associated with TissGene (DisGeNet, 2016-06-01) |
| Disease ID | Disease name | # pubmeds | Source |
| umls:C0376358 | Malignant neoplasm of prostate | 8 | BeFree |
| umls:C0600139 | Prostate carcinoma | 8 | BeFree |
| umls:C1704272 | Benign Prostatic Hyperplasia | 2 | BeFree |
| umls:C0004509 | Azoospermia | 1 | BeFree |
| umls:C0028754 | Obesity | 1 | BeFree |
| umls:C0031099 | Periodontitis | 1 | BeFree |
|
Copyright 2016-Present - The University of Texas Health Science Center at Houston (UTHealth) Web File Viewing | How to Report, Fraud, Waste and Abuse | State of Texas | Statewide Search | Texas Homeland Security | Site Policies |