 |
| |
| |
| |
| |
| |
| |
|

| TissGeneSummary for ACTG2 |
 Gene summary Gene summary |
| Basic gene information | Gene symbol | ACTG2 |
| Gene name | actin, gamma 2, smooth muscle, enteric | |
| Synonyms | ACT|ACTA3|ACTE|ACTL3|ACTSG|VSCM | |
| Cytomap | UCSC genome browser: 2p13.1 | |
| Type of gene | protein-coding | |
| RefGenes | NM_001199893.1, NM_001615.3, | |
| Description | actin, gamma-enteric smooth muscleactin-like proteinalpha-actin-3 | |
| Modification date | 20141207 | |
| dbXrefs | MIM : 102545 | |
| HGNC : HGNC | ||
| Ensembl : ENSG00000163017 | ||
| HPRD : 00016 | ||
| Vega : OTTHUMG00000129813 | ||
| Protein | UniProt: go to UniProt's Cross Reference DB Table | |
| Expression | CleanEX: HS_ACTG2 | |
| BioGPS: 72 | ||
| Pathway | NCI Pathway Interaction Database: ACTG2 | |
| KEGG: ACTG2 | ||
| REACTOME: ACTG2 | ||
| Pathway Commons: ACTG2 | ||
| Context | iHOP: ACTG2 | |
| ligand binding site mutation search in PubMed: ACTG2 | ||
| UCL Cancer Institute: ACTG2 | ||
| Assigned class in TissGDB* | C | |
| Included tissue-specific gene expression resources | TiGER,GTEx | |
| Specific-tissues in normal samples (assigned by TissGDB using HPA, TiGER, and GTEx) | ColonProstate | |
| Cancer types related to the specific-tissues in cancer samples (assigned by TissGDB using TCGA) | COADPRAD | |
| Reference showing the relevant tissue of ACTG2 | ||
| Description by TissGene annotations | Protective TissGene in RFS Fused withTSGene Fused withOncogene | |
| * Class A consists of genes with literature evidence and is part of the cTissGenes. Class B consists of only cTissGenes without additional evidence. The remaining genes belong to Class C. |
| Gene ontology having evidence of Inferred from Direct Assay (IDA) from Entrez |
| GO ID | GO term | PubMed ID |
| Top |
| TissGeneExp for ACTG2 |
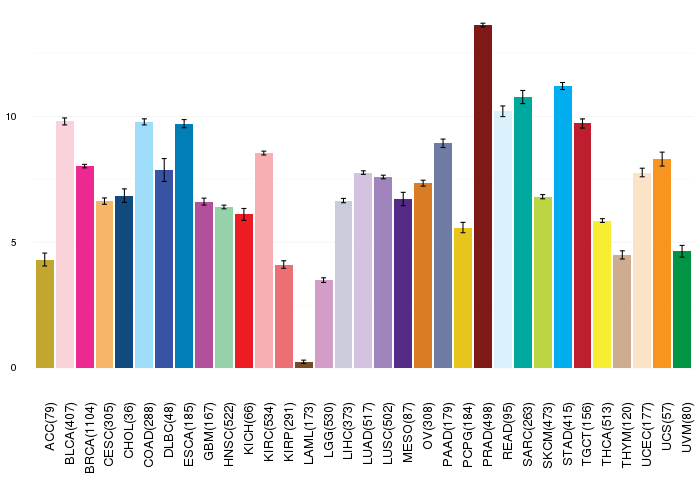
| Gene expressions across 28 cancer types (X-axis: cancer type and Y-axis: log2(norm_counts+1)) (TCGA IlluminaHiSeq_RNASeqV2, pan-cancer normalized log2(norm_counts+1) data, version 2016-08-16) |
 |
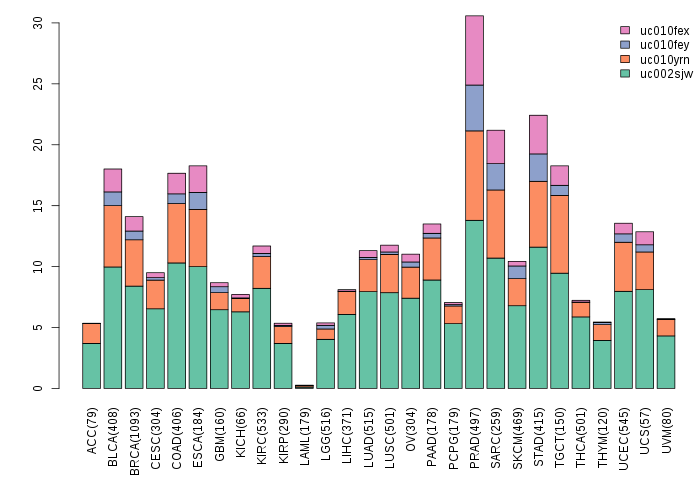
| Gene isoform expressions across 28 cancer types (X-axis: cancer type and Y-axis: log2(norm_counts+1)) (TCGA pan-cancer tcga_rsem_isoform_tpm, version 2016-09-01) |
 |
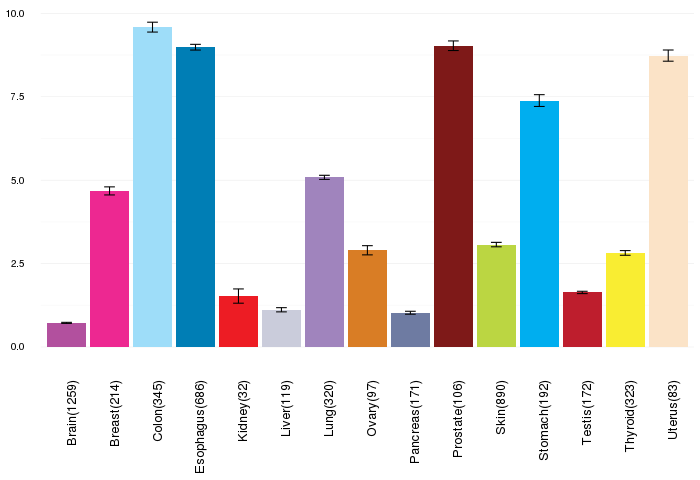
| Gene expressions across normal tissues of GTEx data (GTEx GTEx_Analysis_v6_RNA-seq_RNA-SeQCv1.1.8_gene_rpkm.gct) - Here, we shows the matched tissue types only among our 28 cancer types. |
 |
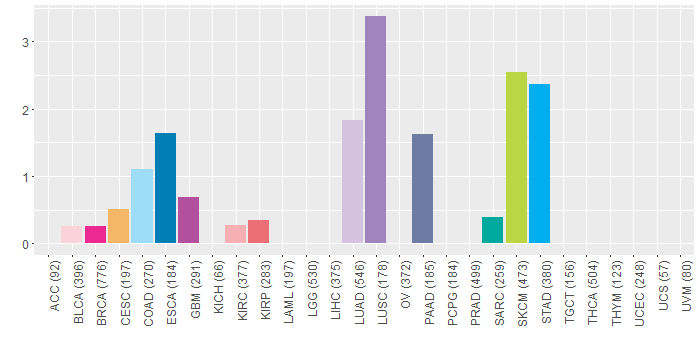
| Different expressions across 14 cancer types with more than 10 samples between matched tumors and normals (X-axis: cancer type and Y-axis: log2(norm_counts+1)) (TCGA IlluminaHiSeq_RNASeqV2, pan-cancer normalized log2(norm_counts+1) data, version 2016-08-16) |
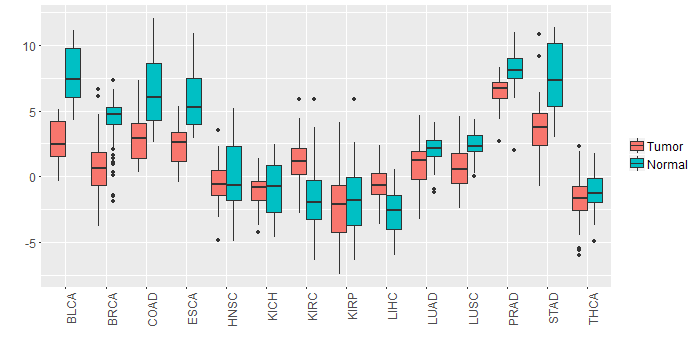 |
| - Significantly differentially expressed cancer types and information. (|Fold change|>1 and FDR<0.05) |
| Cancer type | Mean(exp) in tumor | Mean(exp) in matched normal | Log2FC | P-val. | FDR |
| COAD | 3.086220034 | 6.54807388 | -3.461853846 | 1.87E-06 | 9.87E-06 |
| STAD | 3.842737822 | 7.433400322 | -3.5906625 | 4.05E-07 | 8.06E-06 |
| BLCA | 2.754631572 | 7.777463151 | -5.022831579 | 3.42E-09 | 4.23E-07 |
| LUAD | 0.880774676 | 2.036910883 | -1.156136207 | 6.70E-06 | 2.01E-05 |
| BRCA | 0.532323678 | 4.324821046 | -3.792497368 | 8.56E-36 | 1.68E-34 |
| LIHC | -0.598568428 | -2.758718428 | 2.16015 | 1.15E-10 | 1.50E-09 |
| KIRC | 1.142530183 | -1.644332317 | 2.7868625 | 3.40E-12 | 1.39E-11 |
| PRAD | 6.454270034 | 8.109208495 | -1.654938462 | 8.66E-10 | 1.39E-08 |
| LUSC | 0.561839416 | 2.396206082 | -1.834366667 | 3.48E-10 | 1.25E-09 |
| ESCA | 2.3580043 | 5.885722481 | -3.527718182 | 0.00116 | 0.016328101 |
| Top |
| TissGene-miRNA for ACTG2 |
| Significantly anti-correlated miRNAs of TissGene across 28 cancer types (Gene-miRNA relations from TargetScanHuman Relsease 7.1, Conserved_Site_Context_Scores.txt.zip, 06.01.2016) (TCGA IlluminaHiSeq_miRNASeq, log2(RPM+1) data, version 2016-11-21) (TCGA IlluminaHiSeq_RNASeqV2, log2(normalized_count+1) data, version 2016-08-16) (Spearman’s Rank Correlation (p-value<0.05 and coefficient<-0.25)) |
| Cancer type | miRNA id | miRNA accession | P-val. | Coeff. | # samples |
| Top |
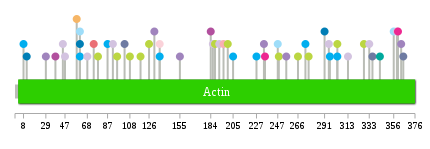
| TissGeneMut for ACTG2 |
| TissGeneSNV for ACTG2 |
| nsSNV counts per each loci. Different colors of circles represent different cancer types. Circle size denotes number of samples. (TCGA somatic mutation (SNPs and small INDELs) data, version 2016-04-25) * Click on the image to enlarge it in a new window. |
 |
 |
| Somatic nucleotide variants of TissGene across 28 cancer types (X-axis: cancer type and Y-axis: % of mutated samples) The numbers in parentheses are numbers of samples with mutation (nsSNVs). (TCGA somatic mutation (SNPs and small INDELs) data, version 2016-04-25) |
 |
| - nsSNVs sorted by frequency. |
| AAchange | Cancer type | # samples |
| p.R336W | PAAD | 1 |
| p.D188N | SKCM | 1 |
| p.V248A | SKCM | 1 |
| p.D155Y | LUSC | 1 |
| p.E108K | SKCM | 1 |
| p.H276P | SKCM | 1 |
| p.H74Y | KIRP | 1 |
| p.E227D | STAD | 1 |
| p.A205S | STAD | 1 |
| p.P103L | PAAD | 1 |
| p.G343E | SARC | 1 |
| p.Q247H | COAD | 1 |
| p.M45I | LUAD | 1 |
| p.E4K | HNSC | 1 |
| p.R255L | LUSC | 1 |
| p.R313S | LUAD | 1 |
| p.E196D | KIRC | 1 |
| p.R63L | HNSC | 1 |
| p.E365* | PAAD | 1 |
| p.Y92H | LUAD | 1 |
| p.E118K | SKCM | 1 |
| p.S235F | BRCA | 1 |
| p.G47* | LUAD | 1 |
| p.S266F | SKCM | 1 |
| p.T78I | SKCM | 1 |
| p.E58K | CESC | 1 |
| p.M356I | COAD | 1 |
| p.E126K | SKCM | 1 |
| p.S234Y | LUSC | 1 |
| p.I328S | SKCM | 1 |
| p.A8T | HNSC | 1 |
| p.R29W | LUSC | 1 |
| p.G303S | STAD | 1 |
| p.S200F | SKCM | 1 |
| p.Y295* | LUAD | 1 |
| p.K360N | BRCA | 1 |
| p.S359R | LUAD | 1 |
| p.R291H | ESCA | 1 |
| p.K192N | LUAD | 1 |
| p.R96H | SKCM | 1 |
| p.P333H | LUAD | 1 |
| p.R184H | GBM | 1 |
| p.L68V | LUAD | 1 |
| p.A136T | STAD | 1 |
| p.A273T | STAD | 1 |
| p.R38H | GBM | 1 |
| p.A8T | STAD | 1 |
| p.P131A | LUSC | 1 |
| p.A136T | BLCA | 1 |
| p.A296G | STAD | 1 |
| p.W87* | STAD | 1 |
| p.S61I | COAD | 1 |
| p.S61I | ESCA | 1 |
| p.Y363N | LUSC | 1 |
| p.G303D | SKCM | 1 |
| p.L186I | LUAD | 1 |
| p.S61R | STAD | 1 |
| p.E242Q | HNSC | 1 |
| p.C11F | ESCA | 1 |
| p.M83I | HNSC | 1 |
| Top |
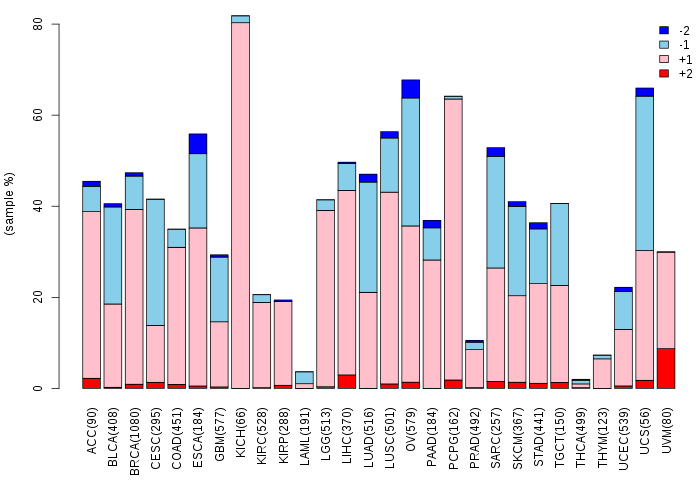
| TissGeneCNV for ACTG2 |
| Copy number variations of TissGene across 28 cancer types (X-axis: cancer type and Y-axis: % of CNV samples) (TCGA Gistic2_CopyNumber_Gistic2_all_data_by_genes, Gistic2 copy number data, version 2016-08-16) |
 |
| Top |
| TissGeneFusions for ACTG2 |
| Fusion genes including TissGene (ChimerDB 3.0, 2016-12-01 and TCGA fusion Portal 2015-12-01) |
| Database | Src | Cancer type | Sample | Fusion gene | ORF | 5'-gene BP | 3'-gene BP |
| Chimerdb3.0 | ChiTaRs | NA | AI682411 | ACTG2-ERCC2 | chr2:74146780 | chr19:45861543 | |
| Chimerdb3.0 | ChiTaRs | NA | T60048 | ACTG2-ACTG2 | chr2:74143821 | chr2:74129591 | |
| Chimerdb3.0 | ChiTaRs | NA | AA506469 | ACTG2-ACTG2 | chr2:74146695 | chr2:74146692 | |
| Chimerdb3.0 | ChiTaRs | NA | BG982943 | BATF2-ACTG2 | chr11:64764442 | chr2:74120141 | |
| Chimerdb3.0 | FusionScan | PRAD | TCGA-CH-5763-01A | ACTG2-REG3G | 5'UTR-5'UTR | chr2:74120178 | chr2:79253208 |
| Chimerdb3.0 | FusionScan | SARC | TCGA-IW-A3M6-01A | ACTG2-ALK | Out-of-Frame | chr2:74128564 | chr2:29449940 |
| Chimerdb3.0 | FusionScan | UCS | TCGA-NA-A4QW-01A | ACTG2-ACTA1 | CDS-5'UTR | chr2:74143892 | chr1:229567389 |
| Chimerdb3.0 | TopHat-Fusion | BRCA | TCGA-B6-A3ZX-01A | TET3-ACTG2 | 5'UTR-CDS | chr2:74230292 | chr2:74135799 |
| TCGAfusionPortal | PRADA | BLCA | TCGA-BT-A3PJ-01A | DGUOK-ACTG2 | In-frame | Chr2:74177859 | Chr2:74129487 |
| TCGAfusionPortal | PRADA | BRCA | TCGA-A8-A079-01A | PELI1-ACTG2 | CDS-5UTR | Chr2:64331835 | Chr2:74128403 |
| TCGAfusionPortal | PRADA | BRCA | TCGA-B6-A3ZX-01A | TET3-ACTG2 | NA | Chr2:74230293 | Chr2:74135800 |
| TCGAfusionPortal | PRADA | BRCA | TCGA-E2-A1AZ-01A | TET3-ACTG2 | NA | Chr2:74230293 | Chr2:74128403 |
| Top |
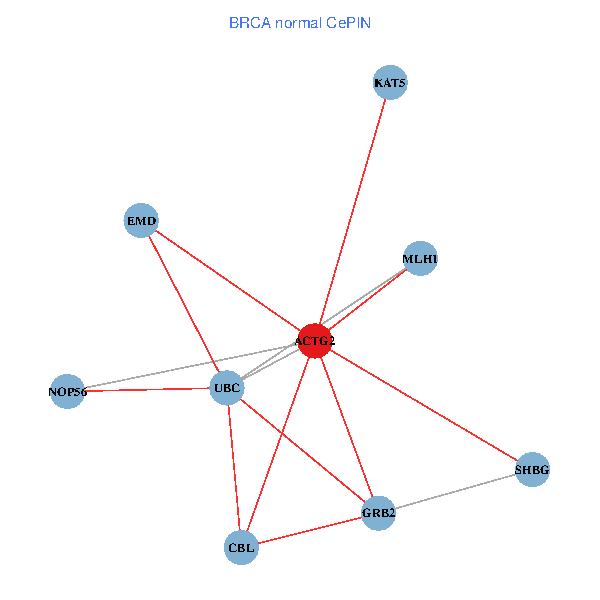
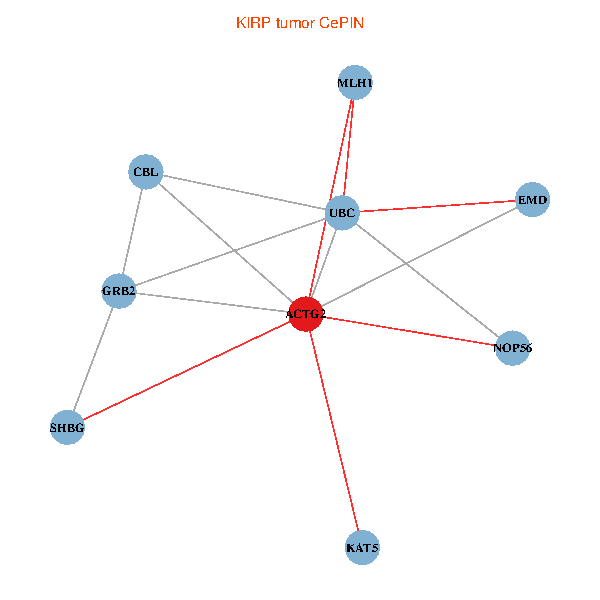
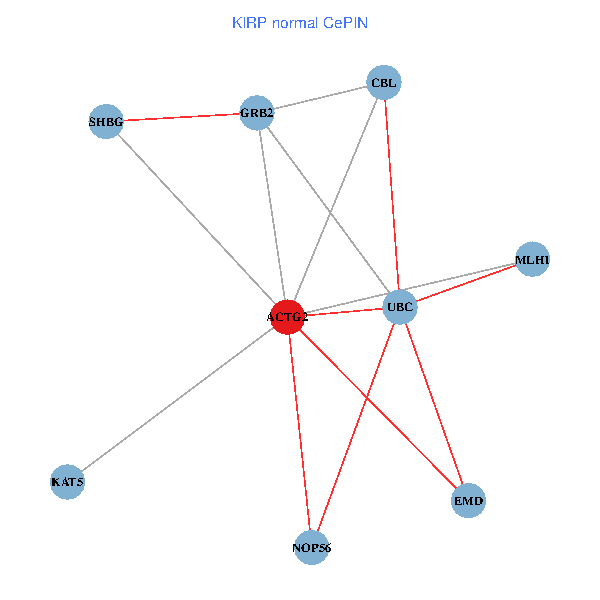
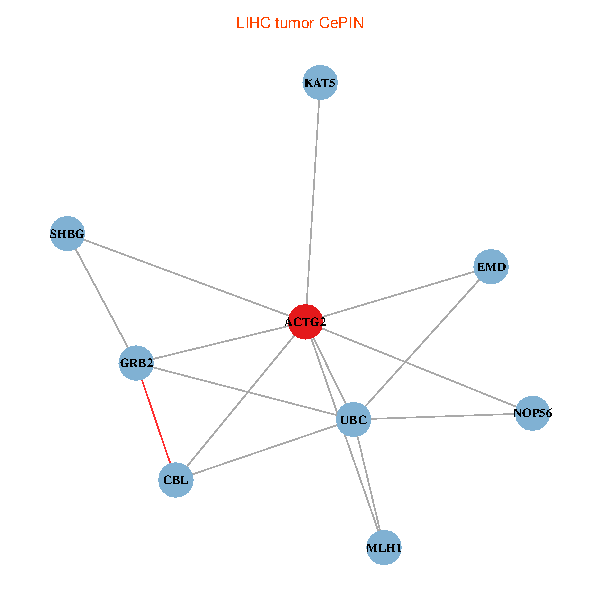
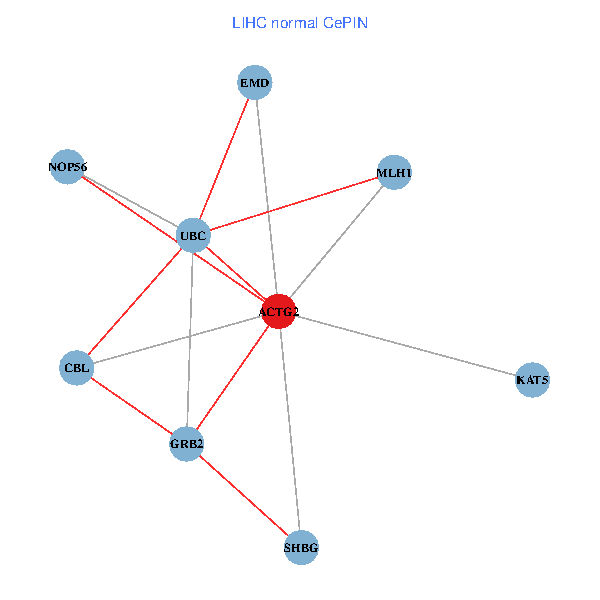
| TissGeneNet for ACTG2 |
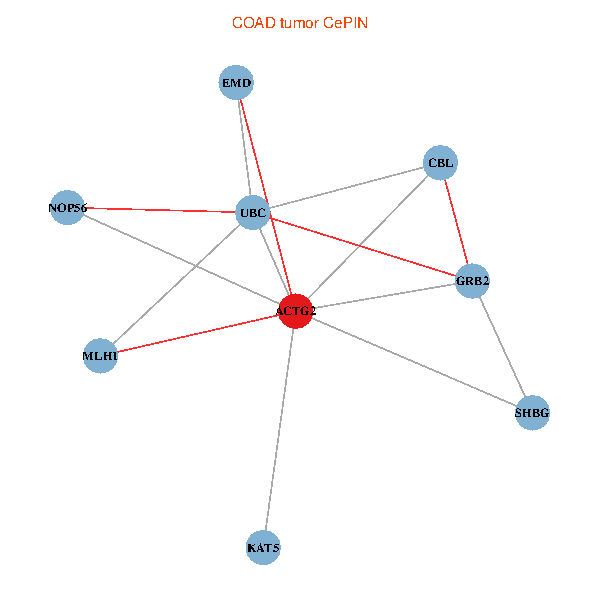
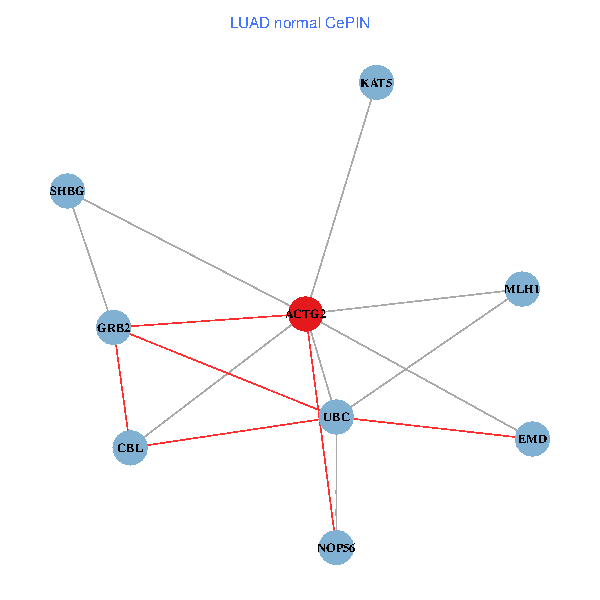
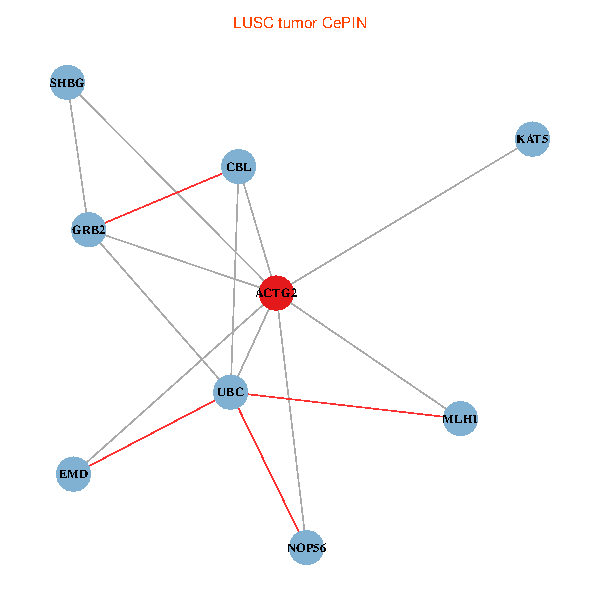
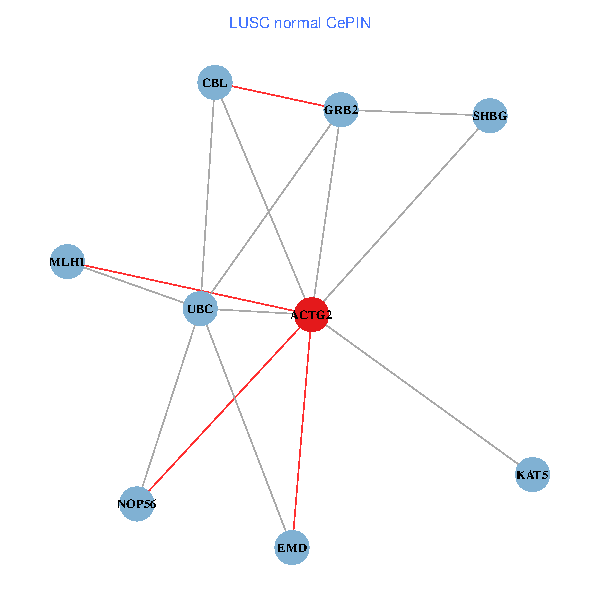
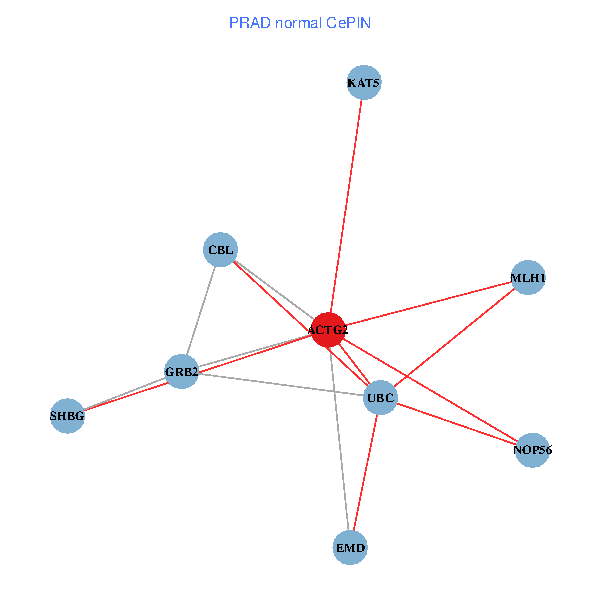
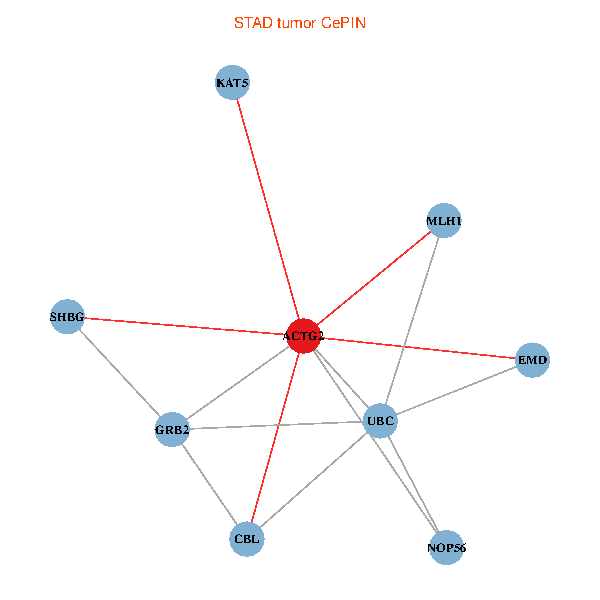
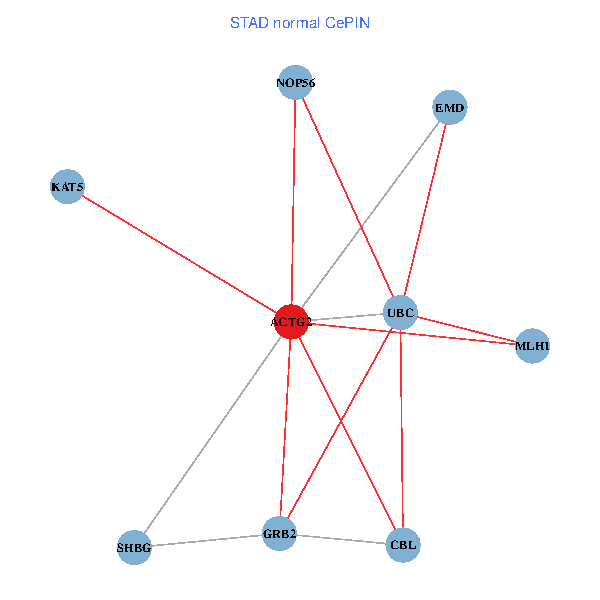
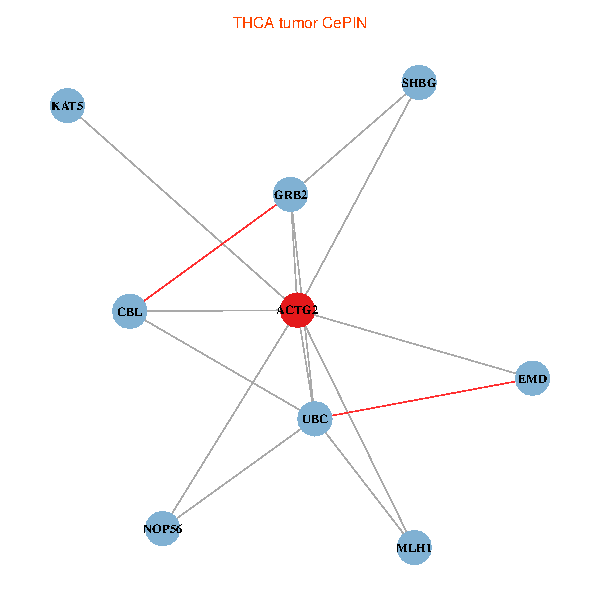
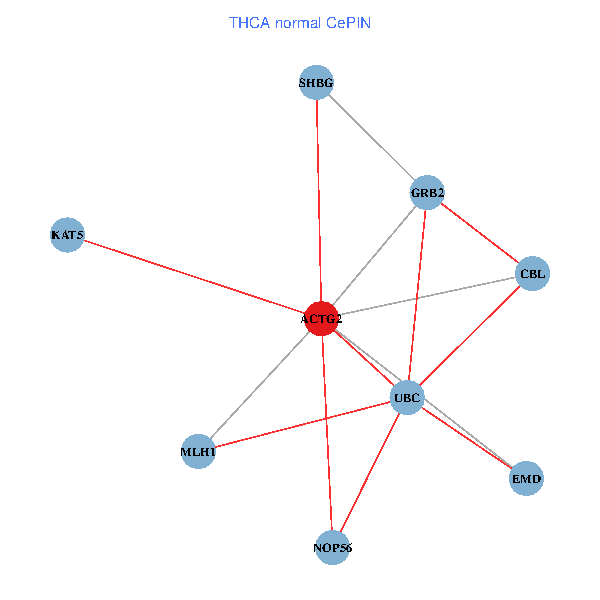
| Co-expressed gene networks based on protein-protein interaction data (CePIN) (TCGA IlluminaHiSeq_RNASeqV2, pan-cancer normalized log2(norm_counts+1) data, version 2016-08-16) (PINA2 ppi data) |
| BRCA (tumor) | BRCA (normal) |
| ACTG2, KAT5, UBC, EMD, MLH1, GRB2, CBL, SHBG, NOP56 (tumor) | ACTG2, KAT5, UBC, EMD, MLH1, GRB2, CBL, SHBG, NOP56 (normal) |
 |  |
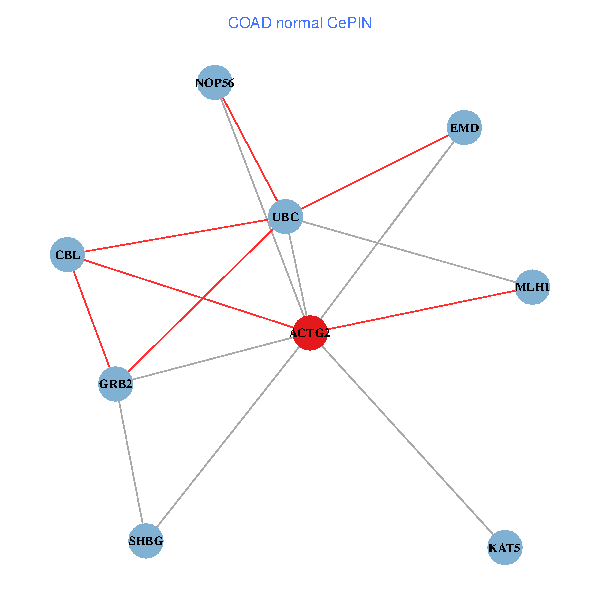
| COAD (tumor) | COAD (normal) |
| ACTG2, KAT5, UBC, EMD, MLH1, GRB2, CBL, SHBG, NOP56 (tumor) | ACTG2, KAT5, UBC, EMD, MLH1, GRB2, CBL, SHBG, NOP56 (normal) |
 |  |
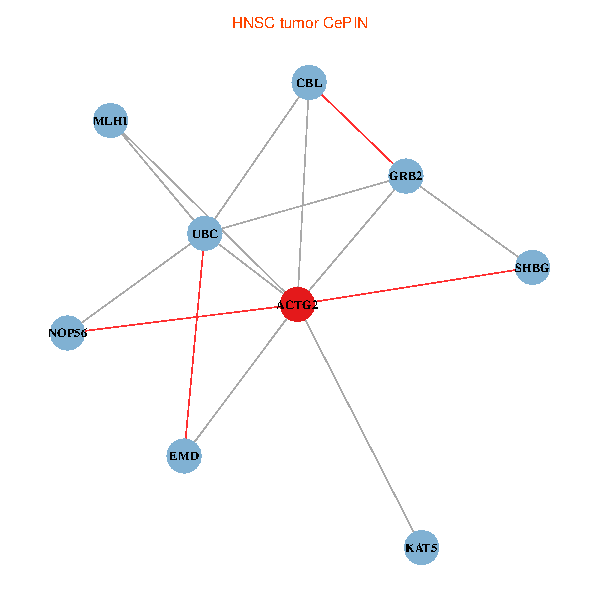
| HNSC (tumor) | HNSC (normal) |
| ACTG2, KAT5, UBC, EMD, MLH1, GRB2, CBL, SHBG, NOP56 (tumor) | ACTG2, KAT5, UBC, EMD, MLH1, GRB2, CBL, SHBG, NOP56 (normal) |
 |  |
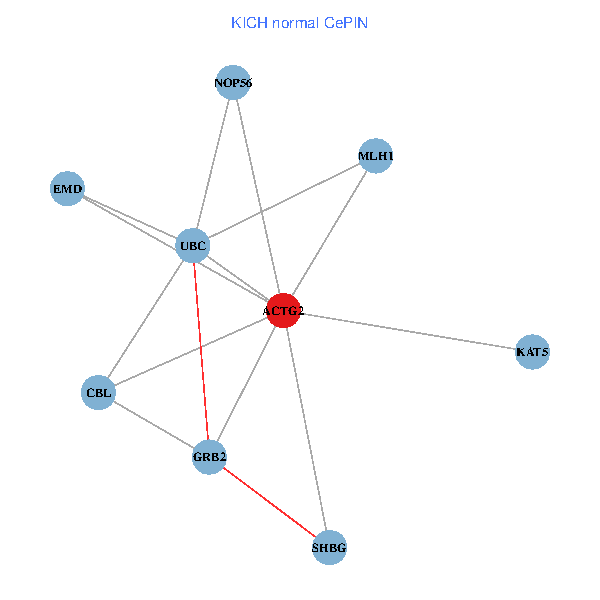
| KICH (tumor) | KICH (normal) |
| ACTG2, KAT5, UBC, EMD, MLH1, GRB2, CBL, SHBG, NOP56 (tumor) | ACTG2, KAT5, UBC, EMD, MLH1, GRB2, CBL, SHBG, NOP56 (normal) |
 |  |
| KIRC (tumor) | KIRC (normal) |
| ACTG2, KAT5, UBC, EMD, MLH1, GRB2, CBL, SHBG, NOP56 (tumor) | ACTG2, KAT5, UBC, EMD, MLH1, GRB2, CBL, SHBG, NOP56 (normal) |
 |  |
| KIRP (tumor) | KIRP (normal) |
| ACTG2, KAT5, UBC, EMD, MLH1, GRB2, CBL, SHBG, NOP56 (tumor) | ACTG2, KAT5, UBC, EMD, MLH1, GRB2, CBL, SHBG, NOP56 (normal) |
 |  |
| LIHC (tumor) | LIHC (normal) |
| ACTG2, KAT5, UBC, EMD, MLH1, GRB2, CBL, SHBG, NOP56 (tumor) | ACTG2, KAT5, UBC, EMD, MLH1, GRB2, CBL, SHBG, NOP56 (normal) |
 |  |
| LUAD (tumor) | LUAD (normal) |
| ACTG2, KAT5, UBC, EMD, MLH1, GRB2, CBL, SHBG, NOP56 (tumor) | ACTG2, KAT5, UBC, EMD, MLH1, GRB2, CBL, SHBG, NOP56 (normal) |
 |  |
| LUSC (tumor) | LUSC (normal) |
| ACTG2, KAT5, UBC, EMD, MLH1, GRB2, CBL, SHBG, NOP56 (tumor) | ACTG2, KAT5, UBC, EMD, MLH1, GRB2, CBL, SHBG, NOP56 (normal) |
 |  |
| PRAD (tumor) | PRAD (normal) |
| ACTG2, KAT5, UBC, EMD, MLH1, GRB2, CBL, SHBG, NOP56 (tumor) | ACTG2, KAT5, UBC, EMD, MLH1, GRB2, CBL, SHBG, NOP56 (normal) |
 |  |
| STAD (tumor) | STAD (normal) |
| ACTG2, KAT5, UBC, EMD, MLH1, GRB2, CBL, SHBG, NOP56 (tumor) | ACTG2, KAT5, UBC, EMD, MLH1, GRB2, CBL, SHBG, NOP56 (normal) |
 |  |
| THCA (tumor) | THCA (normal) |
| ACTG2, KAT5, UBC, EMD, MLH1, GRB2, CBL, SHBG, NOP56 (tumor) | ACTG2, KAT5, UBC, EMD, MLH1, GRB2, CBL, SHBG, NOP56 (normal) |
 |  |
| Top |
| TissGeneProg for ACTG2 |
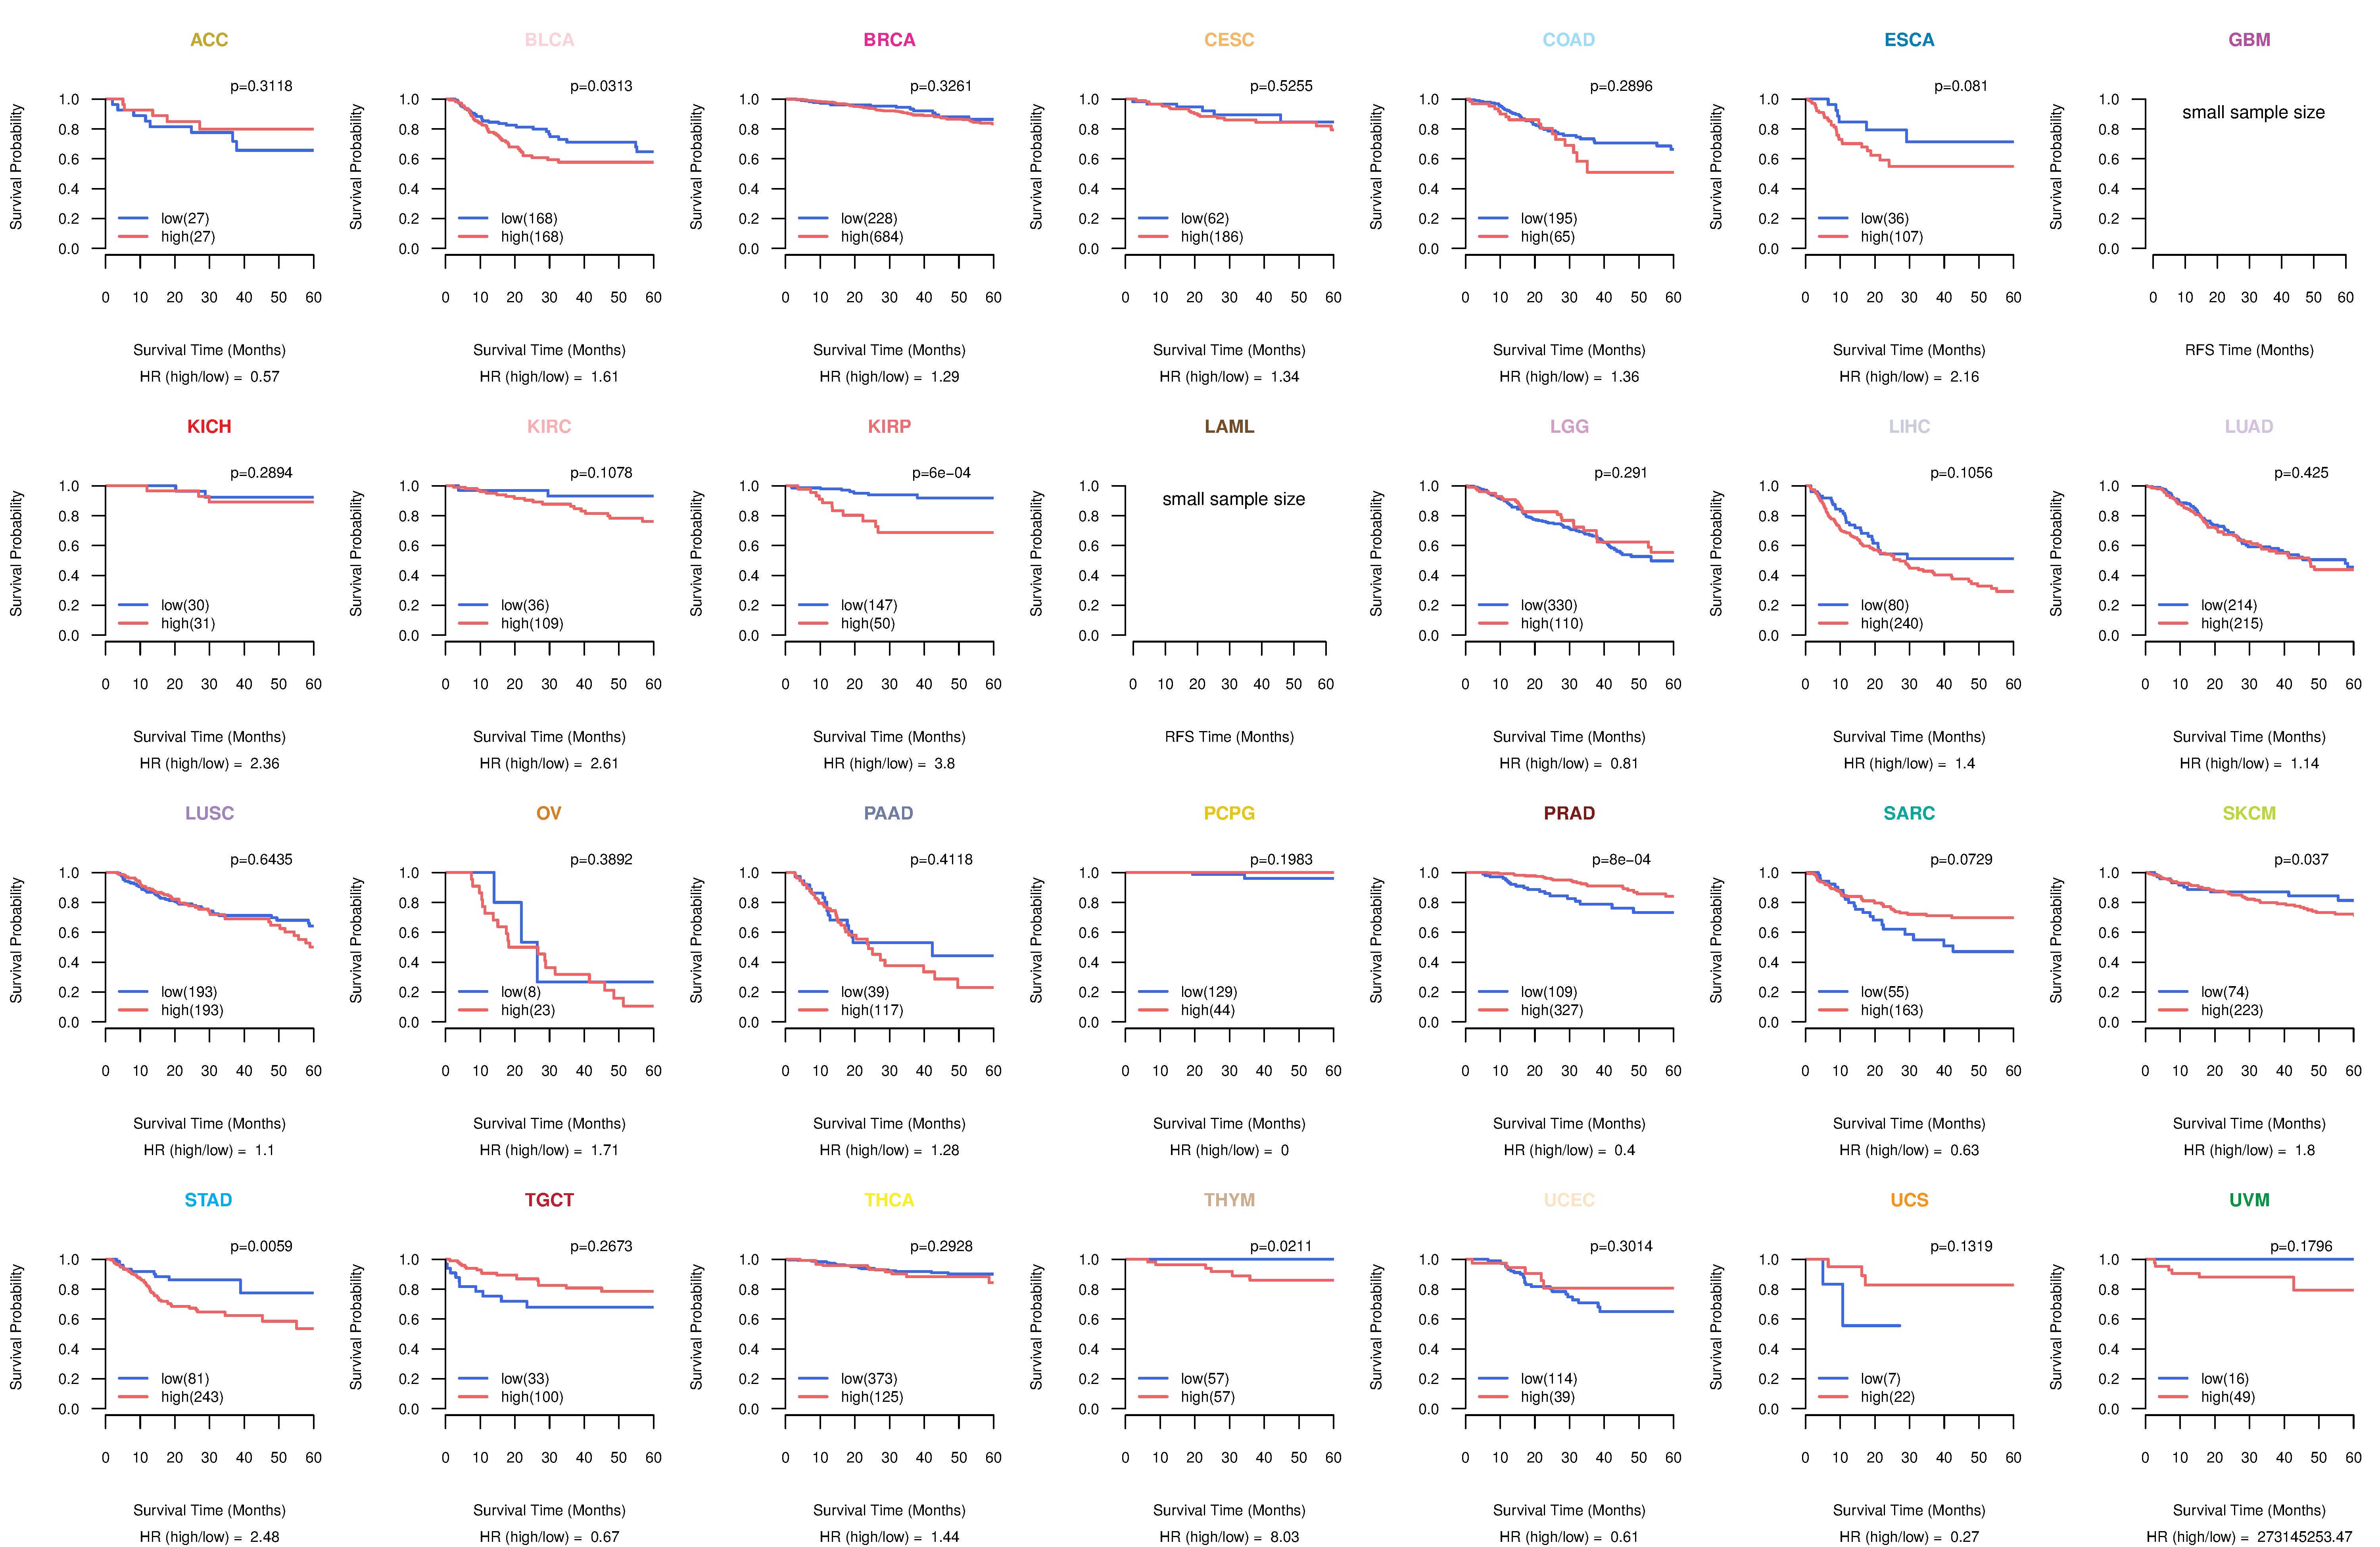
| Kaplan-Meier plots with logrank tests of overall survival (OS) using 28 cancer types (TCGA IlluminaHiSeq_RNASeqV2, pan-cancer normalized log2(norm_counts+1) data, version 2016-08-16) (TCGA clinicalMatrix, phenotype data, version 2016-04-27) * Click on the image to enlarge it in a new window. |
 |
| Kaplan-Meier plots with logrank test of relapse free survival (RFS) using 28 cancer types (TCGA IlluminaHiSeq_RNASeqV2, pan-cancer normalized log2(norm_counts+1) data, version 2016-08-16) (TCGA clinicalMatrix, phenotype data, version 2016-04-27) * Click on the image enlarge it in a new window. |
 |
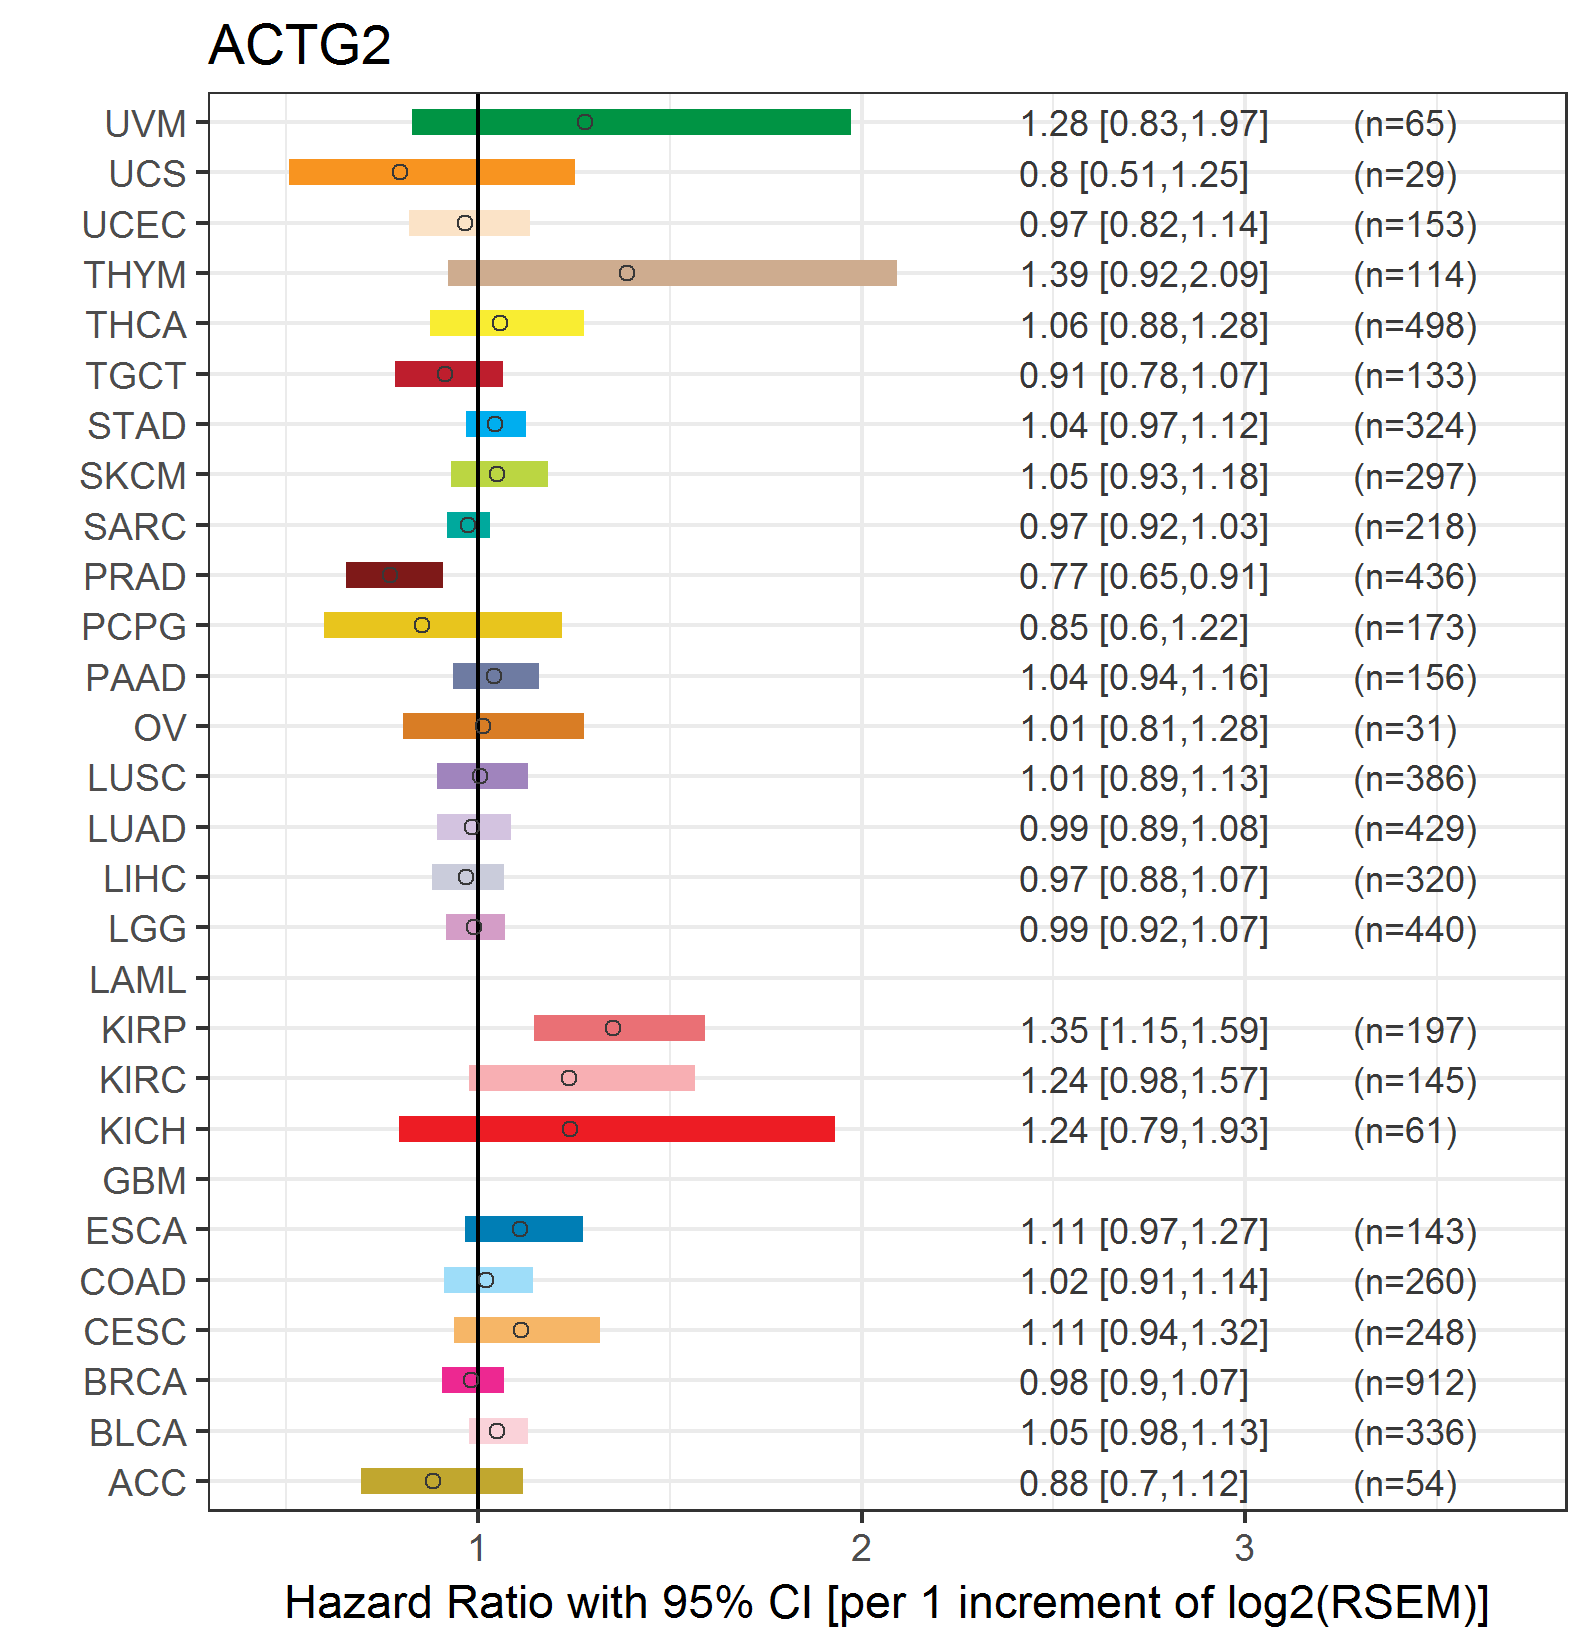
| Forest plot of Cox proportional hazard ratio (HR) and 95% CI of overall survival (OS) using 28 cancer types (TCGA IlluminaHiSeq_RNASeqV2, pan-cancer normalized log2(norm_counts+1) data, version 2016-08-16) (TCGA clinicalMatrix, phenotype data, version 2016-04-27) * Click on the image enlarge it in a new window. |
 |
| Forest plot of Cox proportional hazard ratio (HR) and 95% CI of relapse free survival (RFS) using 28 cancer types (TCGA IlluminaHiSeq_RNASeqV2, pan-cancer normalized log2(norm_counts+1) data, version 2016-08-16) (TCGA clinicalMatrix, phenotype data, version 2016-04-27) * Click on the image enlarge it in a new window. |
 |
| Top |
| TissGeneClin for ACTG2 |
| TissGeneDrug for ACTG2 |
| Drug information targeting TissGene (DrugBank Version 5.0.6, 2017-04-01) |
| DrugBank ID | Drug name | Drug activity | Drug type | Drug status |
| Top |
| TissGeneDisease for ACTG2 |
| Disease information associated with TissGene (DisGeNet, 2016-06-01) |
| Disease ID | Disease name | # pubmeds | Source |
| umls:C0002395 | Alzheimer's Disease | 3 | BeFree |
| umls:C0004096 | Asthma | 3 | BeFree |
| umls:C0042781 | Visceral Myopathy | 3 | UNIPROT |
| umls:C0206686 | Adrenocortical carcinoma | 3 | BeFree |
| umls:C0011860 | Diabetes Mellitus, Non-Insulin-Dependent | 2 | BeFree |
| umls:C0175754 | Agenesis of corpus callosum | 2 | BeFree |
| umls:C0948380 | Colorectal cancer metastatic | 2 | BeFree |
| umls:C1608393 | Megacystis microcolon intestinal hypoperistalsis syndrome | 2 | BeFree,CTD_human,ORPHANET |
| umls:C0005586 | Bipolar Disorder | 1 | BeFree |
| umls:C0006142 | Malignant neoplasm of breast | 1 | BeFree |
| umls:C0008370 | Cholestasis | 1 | LHGDN |
| umls:C0009375 | Colonic Neoplasms | 1 | CTD_human |
| umls:C0011265 | Presenile dementia | 1 | BeFree |
| umls:C0011854 | Diabetes Mellitus, Insulin-Dependent | 1 | BeFree |
| umls:C0011881 | Diabetic Nephropathy | 1 | LHGDN |
| umls:C0016059 | Fibrosis | 1 | LHGDN |
| umls:C0017638 | Glioma | 1 | BeFree |
| umls:C0023269 | leiomyosarcoma | 1 | BeFree |
| umls:C0023343 | Leprosy | 1 | BeFree |
| umls:C0024117 | Chronic Obstructive Airway Disease | 1 | BeFree |
| umls:C0024530 | Malaria | 1 | BeFree |
| umls:C0024535 | Malaria, Falciparum | 1 | BeFree |
| umls:C0027051 | Myocardial Infarction | 1 | BeFree |
| umls:C0030567 | Parkinson Disease | 1 | BeFree |
| umls:C0032002 | Pituitary Diseases | 1 | BeFree |
| umls:C0032914 | Pre-Eclampsia | 1 | LHGDN |
| umls:C0149871 | Deep Vein Thrombosis | 1 | BeFree |
| umls:C0266833 | Visceral Myopathy, Familial | 1 | BeFree,CTD_human,ORPHANET |
| umls:C0279626 | Squamous cell carcinoma of esophagus | 1 | BeFree |
| umls:C0338656 | Impaired cognition | 1 | BeFree |
| umls:C0442874 | Neuropathy | 1 | BeFree |
| umls:C0497327 | Dementia | 1 | BeFree |
| umls:C0678222 | Breast Carcinoma | 1 | BeFree |
| umls:C0685828 | Congenital dilatation of bladder | 1 | BeFree |
| umls:C0729353 | Subfertility | 1 | BeFree |
| umls:C1266184 | Atypical teratoid/rhabdoid tumor | 1 | BeFree |
| umls:C1270972 | Mild cognitive disorder | 1 | BeFree |
| umls:C1290162 | Disorder of smooth muscle | 1 | BeFree |
| umls:C1851710 | LATERAL MENINGOCELE SYNDROME | 1 | BeFree |
| umls:C1835084 | Megaduodenum and/or Megacystis | 0 | CLINVAR |
|
Copyright 2016-Present - The University of Texas Health Science Center at Houston (UTHealth) Web File Viewing | How to Report, Fraud, Waste and Abuse | State of Texas | Statewide Search | Texas Homeland Security | Site Policies |