 |
| |
| |
| |
| |
| |
| |
|

| TissGeneSummary for C4BPB |
 Gene summary Gene summary |
| Basic gene information | Gene symbol | C4BPB |
| Gene name | complement component 4 binding protein, beta | |
| Synonyms | C4BP | |
| Cytomap | UCSC genome browser: 1q32 | |
| Type of gene | protein-coding | |
| RefGenes | NM_000716.3, NM_001017364.1,NM_001017365.1,NM_001017366.1,NM_001017367.1, | |
| Description | C4b-binding protein beta chain | |
| Modification date | 20141207 | |
| dbXrefs | MIM : 120831 | |
| HGNC : HGNC | ||
| Ensembl : ENSG00000123843 | ||
| HPRD : 00404 | ||
| Vega : OTTHUMG00000036035 | ||
| Protein | UniProt: go to UniProt's Cross Reference DB Table | |
| Expression | CleanEX: HS_C4BPB | |
| BioGPS: 725 | ||
| Pathway | NCI Pathway Interaction Database: C4BPB | |
| KEGG: C4BPB | ||
| REACTOME: C4BPB | ||
| Pathway Commons: C4BPB | ||
| Context | iHOP: C4BPB | |
| ligand binding site mutation search in PubMed: C4BPB | ||
| UCL Cancer Institute: C4BPB | ||
| Assigned class in TissGDB* | C | |
| Included tissue-specific gene expression resources | TiGER,GTEx | |
| Specific-tissues in normal samples (assigned by TissGDB using HPA, TiGER, and GTEx) | CervixLiver | |
| Cancer types related to the specific-tissues in cancer samples (assigned by TissGDB using TCGA) | CESCLIHC | |
| Reference showing the relevant tissue of C4BPB | ||
| Description by TissGene annotations | ||
| * Class A consists of genes with literature evidence and is part of the cTissGenes. Class B consists of only cTissGenes without additional evidence. The remaining genes belong to Class C. |
| Gene ontology having evidence of Inferred from Direct Assay (IDA) from Entrez |
| GO ID | GO term | PubMed ID | GO:0045732 | positive regulation of protein catabolic process | 22333221 | GO:0045959 | negative regulation of complement activation, classical pathway | 22333221 | GO:0045732 | positive regulation of protein catabolic process | 22333221 | GO:0045959 | negative regulation of complement activation, classical pathway | 22333221 |
| Top |
| TissGeneExp for C4BPB |
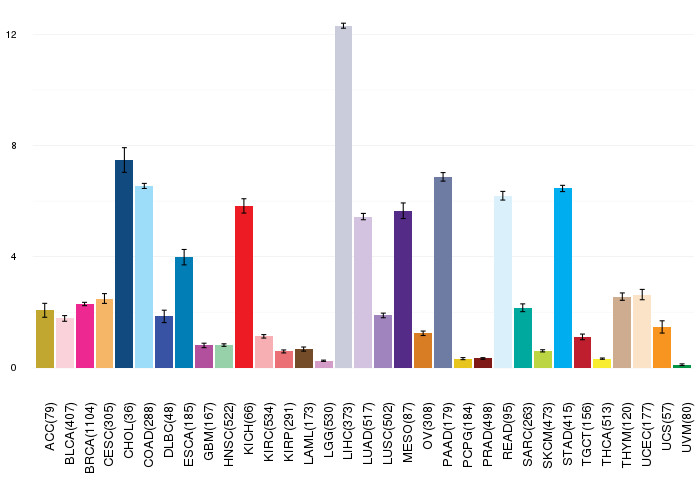
| Gene expressions across 28 cancer types (X-axis: cancer type and Y-axis: log2(norm_counts+1)) (TCGA IlluminaHiSeq_RNASeqV2, pan-cancer normalized log2(norm_counts+1) data, version 2016-08-16) |
 |
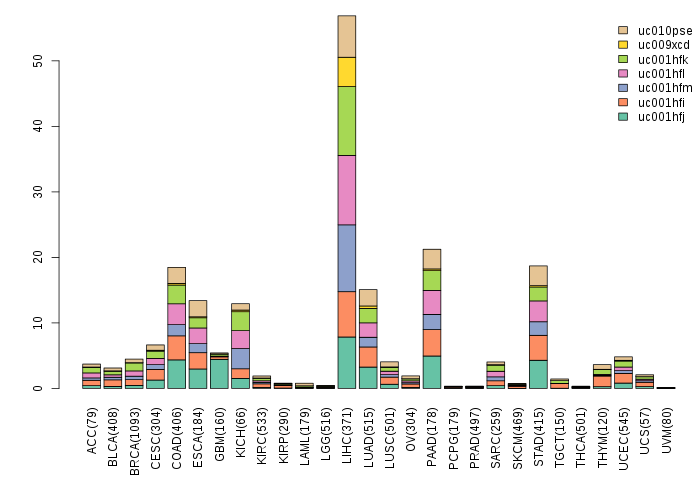
| Gene isoform expressions across 28 cancer types (X-axis: cancer type and Y-axis: log2(norm_counts+1)) (TCGA pan-cancer tcga_rsem_isoform_tpm, version 2016-09-01) |
 |
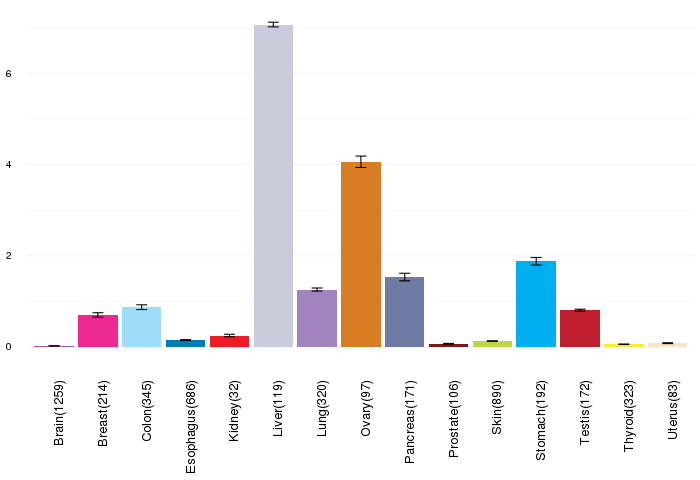
| Gene expressions across normal tissues of GTEx data (GTEx GTEx_Analysis_v6_RNA-seq_RNA-SeQCv1.1.8_gene_rpkm.gct) - Here, we shows the matched tissue types only among our 28 cancer types. |
 |
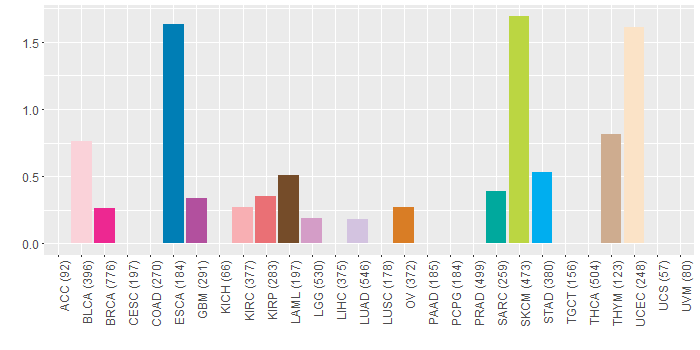
| Different expressions across 14 cancer types with more than 10 samples between matched tumors and normals (X-axis: cancer type and Y-axis: log2(norm_counts+1)) (TCGA IlluminaHiSeq_RNASeqV2, pan-cancer normalized log2(norm_counts+1) data, version 2016-08-16) |
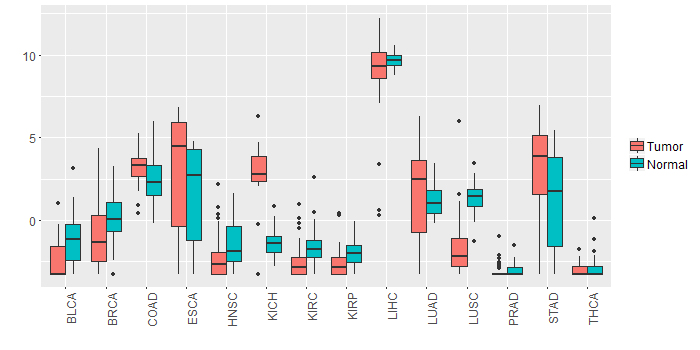 |
| - Significantly differentially expressed cancer types and information. (|Fold change|>1 and FDR<0.05) |
| Cancer type | Mean(exp) in tumor | Mean(exp) in matched normal | Log2FC | P-val. | FDR |
| KICH | 2.761453965 | -1.416850035 | 4.178304 | 9.08E-10 | 5.78E-09 |
| BRCA | -0.98376793 | 0.18189786 | -1.165665789 | 1.89E-07 | 5.53E-07 |
| LUSC | -1.687284545 | 1.404813494 | -3.092098039 | 4.93E-19 | 5.12E-18 |
| BLCA | -2.355620561 | -1.028841614 | -1.326778947 | 0.00789 | 0.03717661 |
| STAD | 3.280908715 | 1.01246184 | 2.268446875 | 0.0013 | 0.006511581 |
| Top |
| TissGene-miRNA for C4BPB |
| Significantly anti-correlated miRNAs of TissGene across 28 cancer types (Gene-miRNA relations from TargetScanHuman Relsease 7.1, Conserved_Site_Context_Scores.txt.zip, 06.01.2016) (TCGA IlluminaHiSeq_miRNASeq, log2(RPM+1) data, version 2016-11-21) (TCGA IlluminaHiSeq_RNASeqV2, log2(normalized_count+1) data, version 2016-08-16) (Spearman’s Rank Correlation (p-value<0.05 and coefficient<-0.25)) |
| Cancer type | miRNA id | miRNA accession | P-val. | Coeff. | # samples |
| Top |
| TissGeneMut for C4BPB |
| TissGeneSNV for C4BPB |
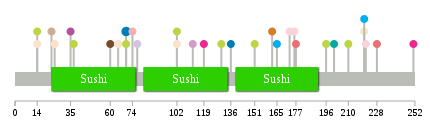
| nsSNV counts per each loci. Different colors of circles represent different cancer types. Circle size denotes number of samples. (TCGA somatic mutation (SNPs and small INDELs) data, version 2016-04-25) * Click on the image to enlarge it in a new window. |
 |
 |
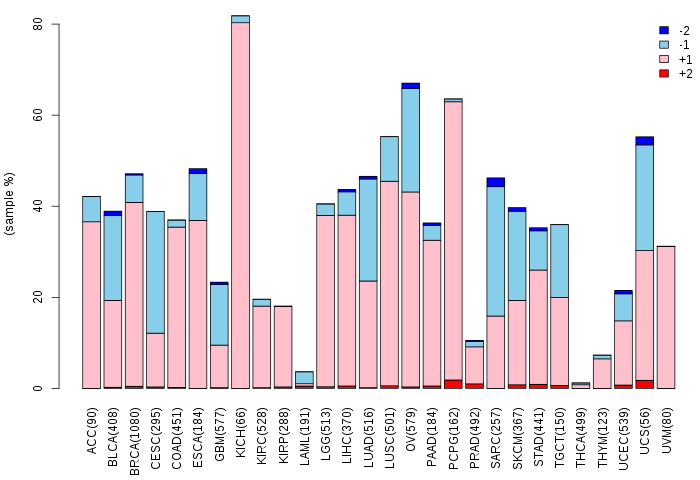
| Somatic nucleotide variants of TissGene across 28 cancer types (X-axis: cancer type and Y-axis: % of mutated samples) The numbers in parentheses are numbers of samples with mutation (nsSNVs). (TCGA somatic mutation (SNPs and small INDELs) data, version 2016-04-25) |
 |
| - nsSNVs sorted by frequency. |
| AAchange | Cancer type | # samples |
| p.D70Y | ESCA | 2 |
| p.S162I | OV | 1 |
| p.E220D | UCEC | 1 |
| p.N221Y | BLCA | 1 |
| p.E176D | BLCA | 1 |
| p.K37N | SKCM | 1 |
| p.I103M | HNSC | 1 |
| p.Q210* | SKCM | 1 |
| p.K102N | UCEC | 1 |
| p.I112N | LGG | 1 |
| p.E151K | SKCM | 1 |
| p.C165R | STAD | 1 |
| p.L251* | BRCA | 1 |
| p.K102N | SKCM | 1 |
| p.T60I | LAML | 1 |
| p.S119R | BRCA | 1 |
| p.G35W | GBM | 1 |
| p.Q182R | MESO | 1 |
| p.R14* | UCEC | 1 |
| p.D70N | SKCM | 1 |
| p.E25G | UCEC | 1 |
| p.E220D | STAD | 1 |
| p.Q228K | KIRP | 1 |
| p.R14Q | SKCM | 1 |
| p.T74I | KIRC | 1 |
| p.I186T | MESO | 1 |
| p.F91L | HNSC | 1 |
| p.Q177K | KIRP | 1 |
| p.P130H | SKCM | 1 |
| p.A65T | UCEC | 1 |
| p.E201Q | SARC | 1 |
| p.C23F | THYM | 1 |
| p.E196K | SKCM | 1 |
| p.G173V | BLCA | 1 |
| p.R77S | LUAD | 1 |
| p.Q136H | ESCA | 1 |
| Top |
| TissGeneCNV for C4BPB |
| Copy number variations of TissGene across 28 cancer types (X-axis: cancer type and Y-axis: % of CNV samples) (TCGA Gistic2_CopyNumber_Gistic2_all_data_by_genes, Gistic2 copy number data, version 2016-08-16) |
 |
| Top |
| TissGeneFusions for C4BPB |
| Fusion genes including TissGene (ChimerDB 3.0, 2016-12-01 and TCGA fusion Portal 2015-12-01) |
| Database | Src | Cancer type | Sample | Fusion gene | ORF | 5'-gene BP | 3'-gene BP |
| Top |
| TissGeneNet for C4BPB |
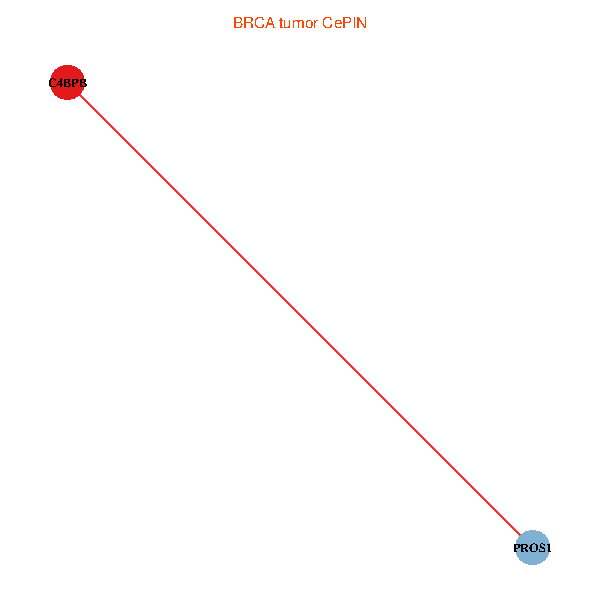
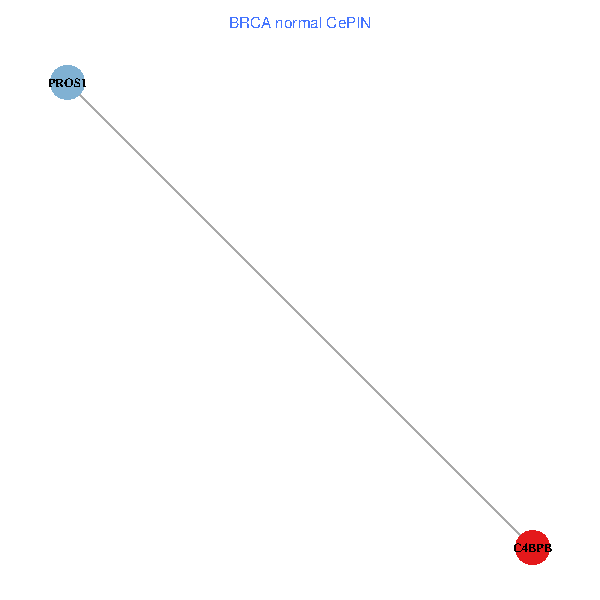
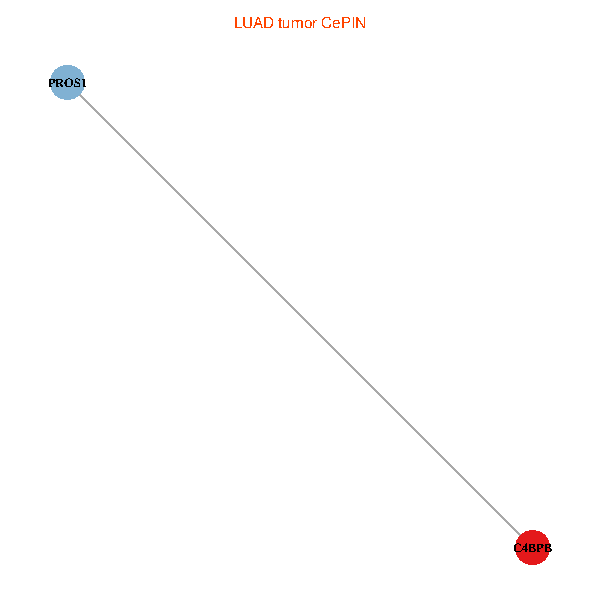
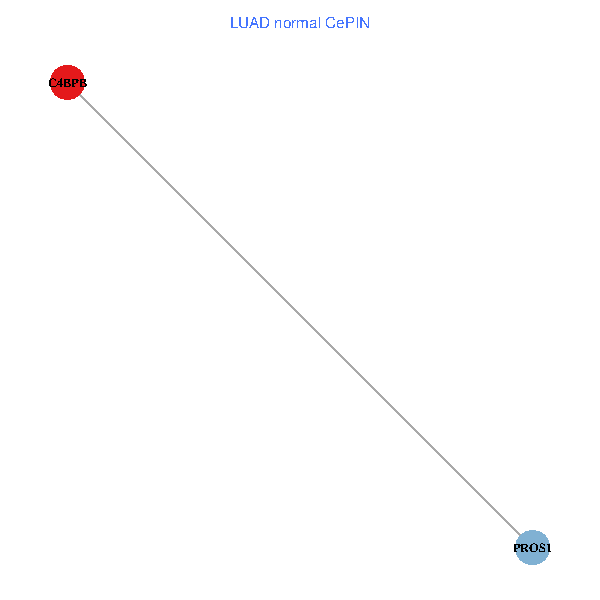
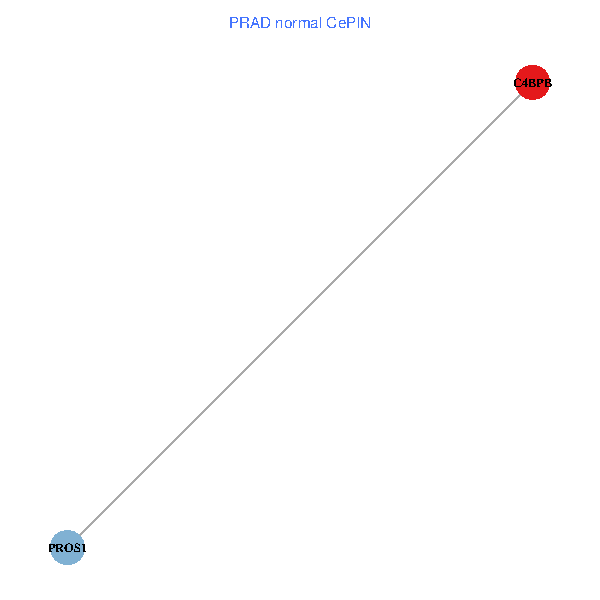
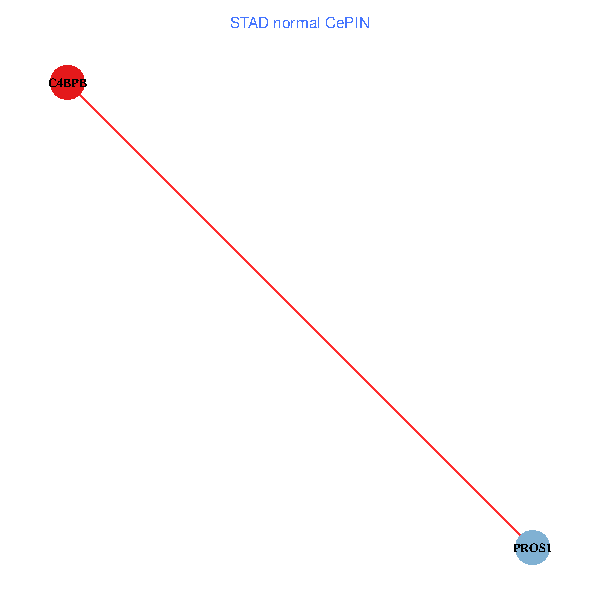
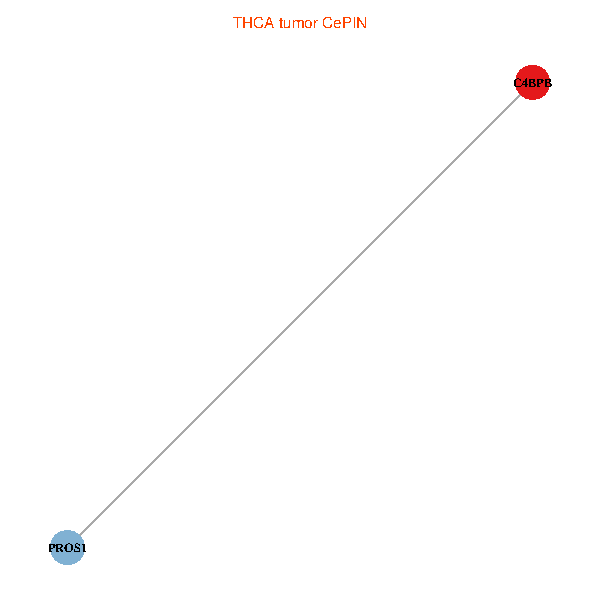
| Co-expressed gene networks based on protein-protein interaction data (CePIN) (TCGA IlluminaHiSeq_RNASeqV2, pan-cancer normalized log2(norm_counts+1) data, version 2016-08-16) (PINA2 ppi data) |
| BRCA (tumor) | BRCA (normal) |
| C4BPB, PROS1 (tumor) | C4BPB, PROS1 (normal) |
 |  |
| COAD (tumor) | COAD (normal) |
| C4BPB, PROS1 (tumor) | C4BPB, PROS1 (normal) |
 |  |
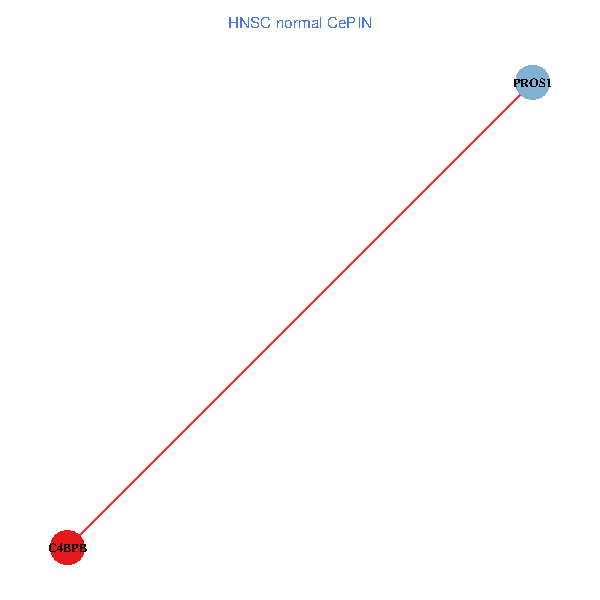
| HNSC (tumor) | HNSC (normal) |
| C4BPB, PROS1 (tumor) | C4BPB, PROS1 (normal) |
 |  |
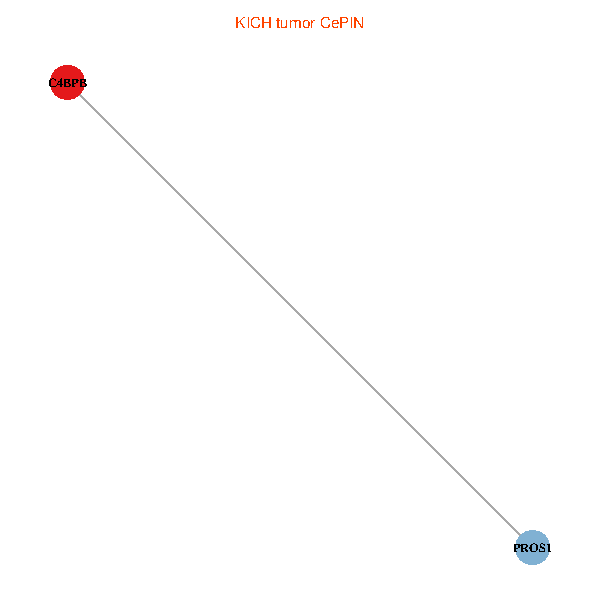
| KICH (tumor) | KICH (normal) |
| C4BPB, PROS1 (tumor) | C4BPB, PROS1 (normal) |
 |  |
| KIRC (tumor) | KIRC (normal) |
| C4BPB, PROS1 (tumor) | C4BPB, PROS1 (normal) |
 |  |
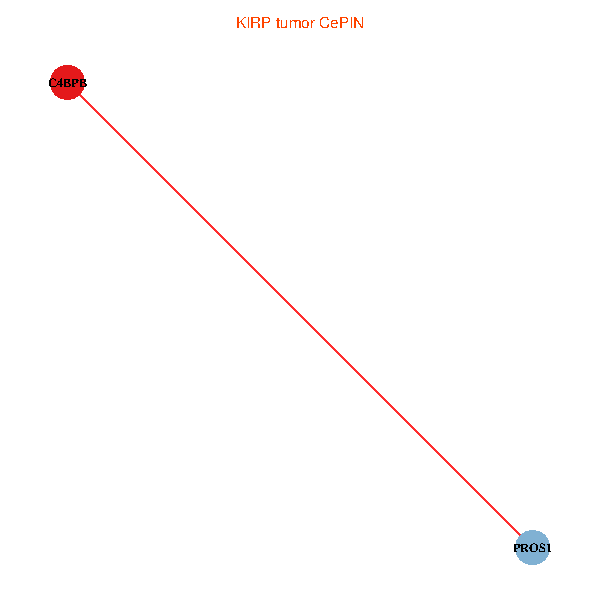
| KIRP (tumor) | KIRP (normal) |
| C4BPB, PROS1 (tumor) | C4BPB, PROS1 (normal) |
 |  |
| LIHC (tumor) | LIHC (normal) |
| C4BPB, PROS1 (tumor) | C4BPB, PROS1 (normal) |
 |  |
| LUAD (tumor) | LUAD (normal) |
| C4BPB, PROS1 (tumor) | C4BPB, PROS1 (normal) |
 |  |
| LUSC (tumor) | LUSC (normal) |
| C4BPB, PROS1 (tumor) | C4BPB, PROS1 (normal) |
 |  |
| PRAD (tumor) | PRAD (normal) |
| C4BPB, PROS1 (tumor) | C4BPB, PROS1 (normal) |
 |  |
| STAD (tumor) | STAD (normal) |
| C4BPB, PROS1 (tumor) | C4BPB, PROS1 (normal) |
 |  |
| THCA (tumor) | THCA (normal) |
| C4BPB, PROS1 (tumor) | C4BPB, PROS1 (normal) |
 |  |
| Top |
| TissGeneProg for C4BPB |
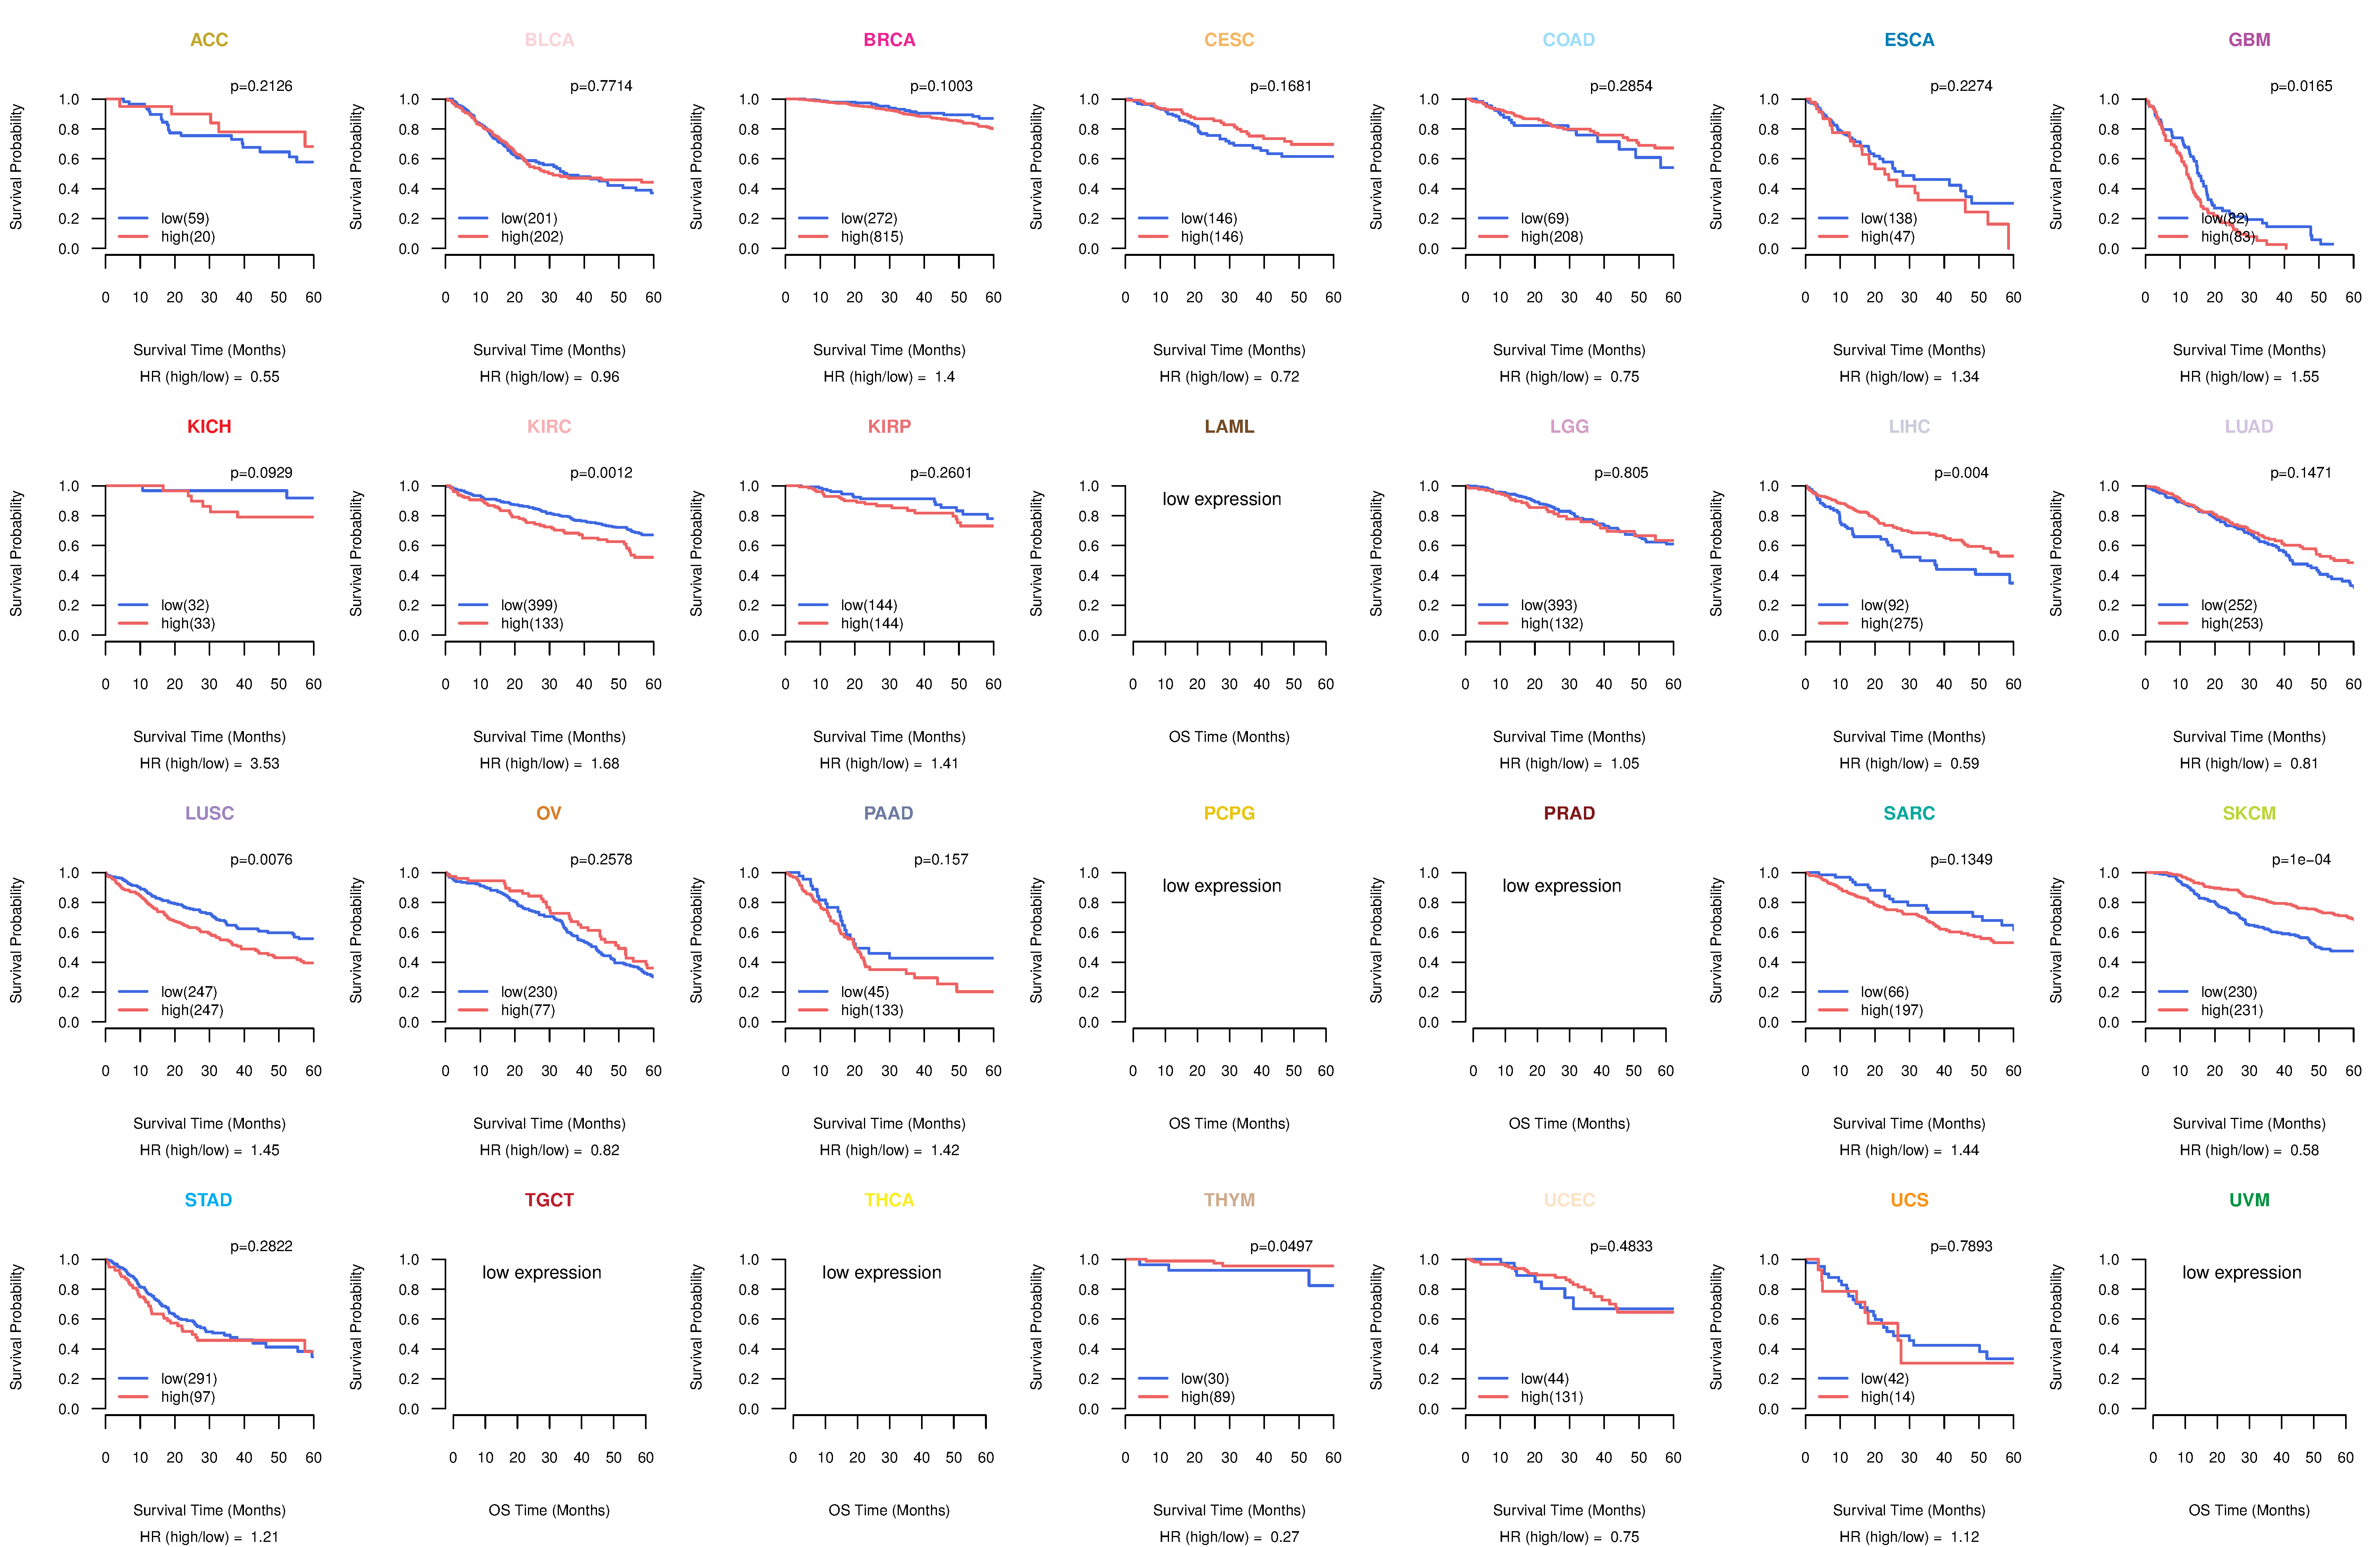
| Kaplan-Meier plots with logrank tests of overall survival (OS) using 28 cancer types (TCGA IlluminaHiSeq_RNASeqV2, pan-cancer normalized log2(norm_counts+1) data, version 2016-08-16) (TCGA clinicalMatrix, phenotype data, version 2016-04-27) * Click on the image to enlarge it in a new window. |
 |
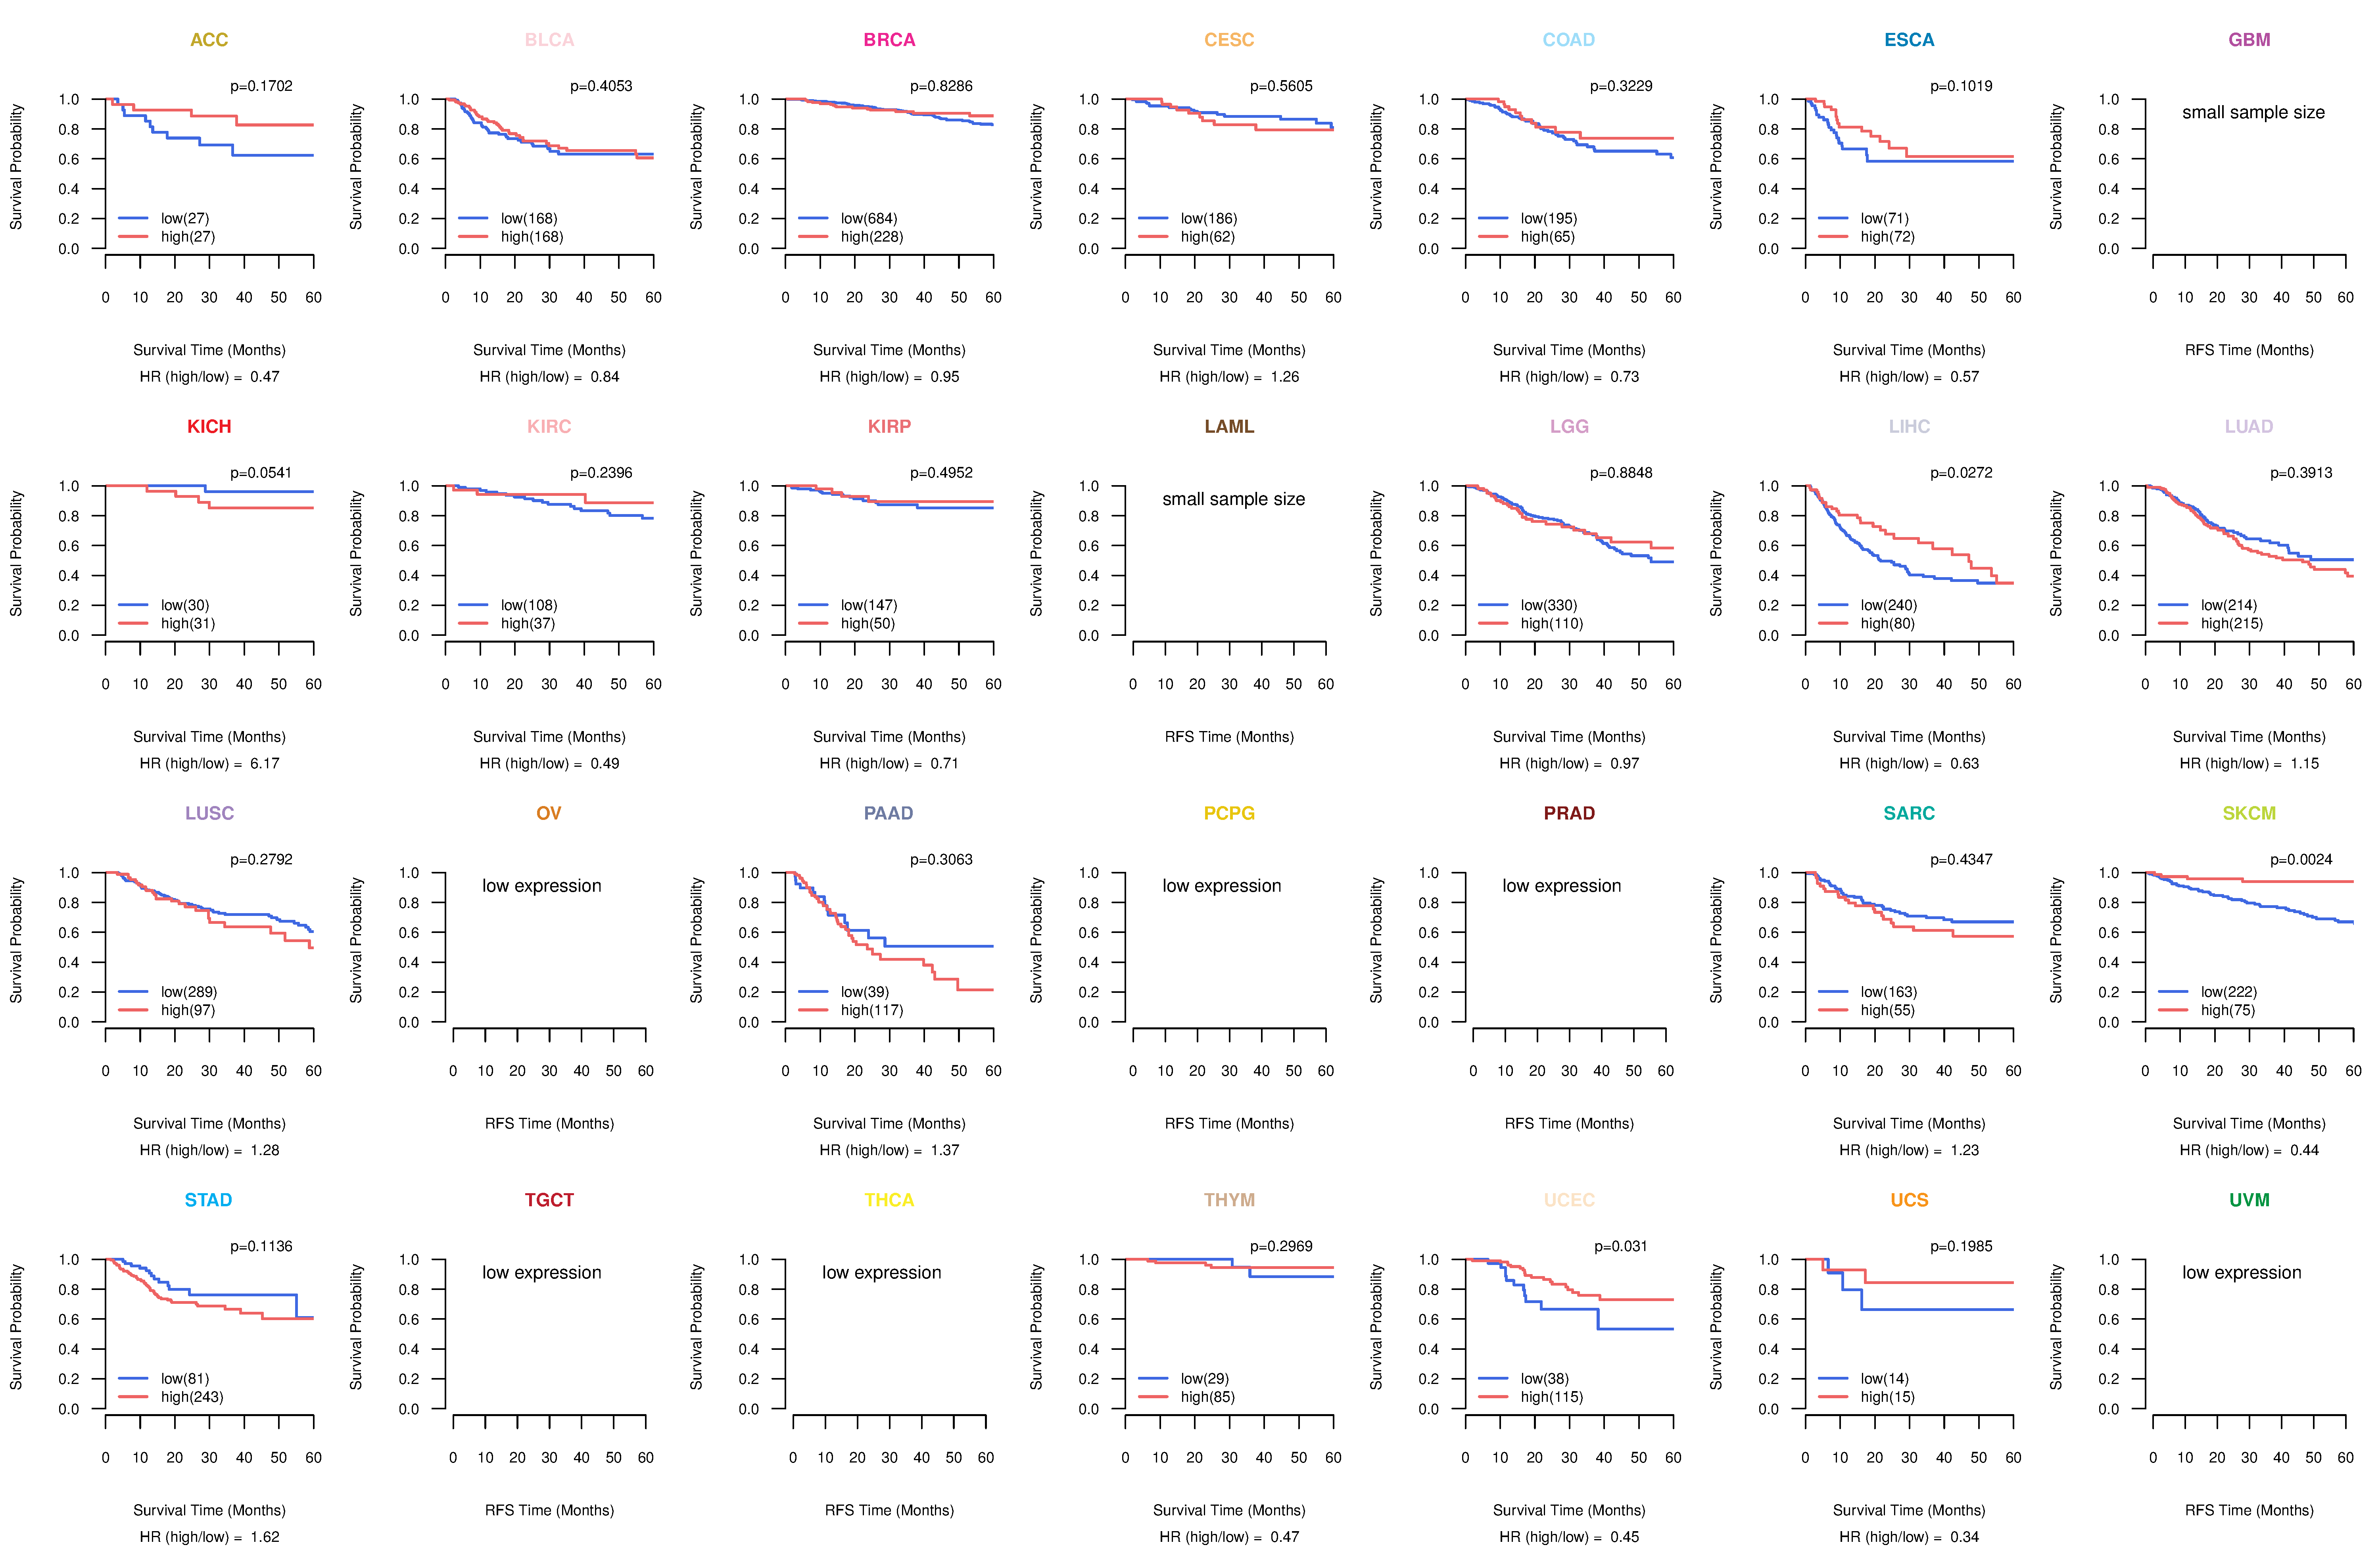
| Kaplan-Meier plots with logrank test of relapse free survival (RFS) using 28 cancer types (TCGA IlluminaHiSeq_RNASeqV2, pan-cancer normalized log2(norm_counts+1) data, version 2016-08-16) (TCGA clinicalMatrix, phenotype data, version 2016-04-27) * Click on the image enlarge it in a new window. |
 |
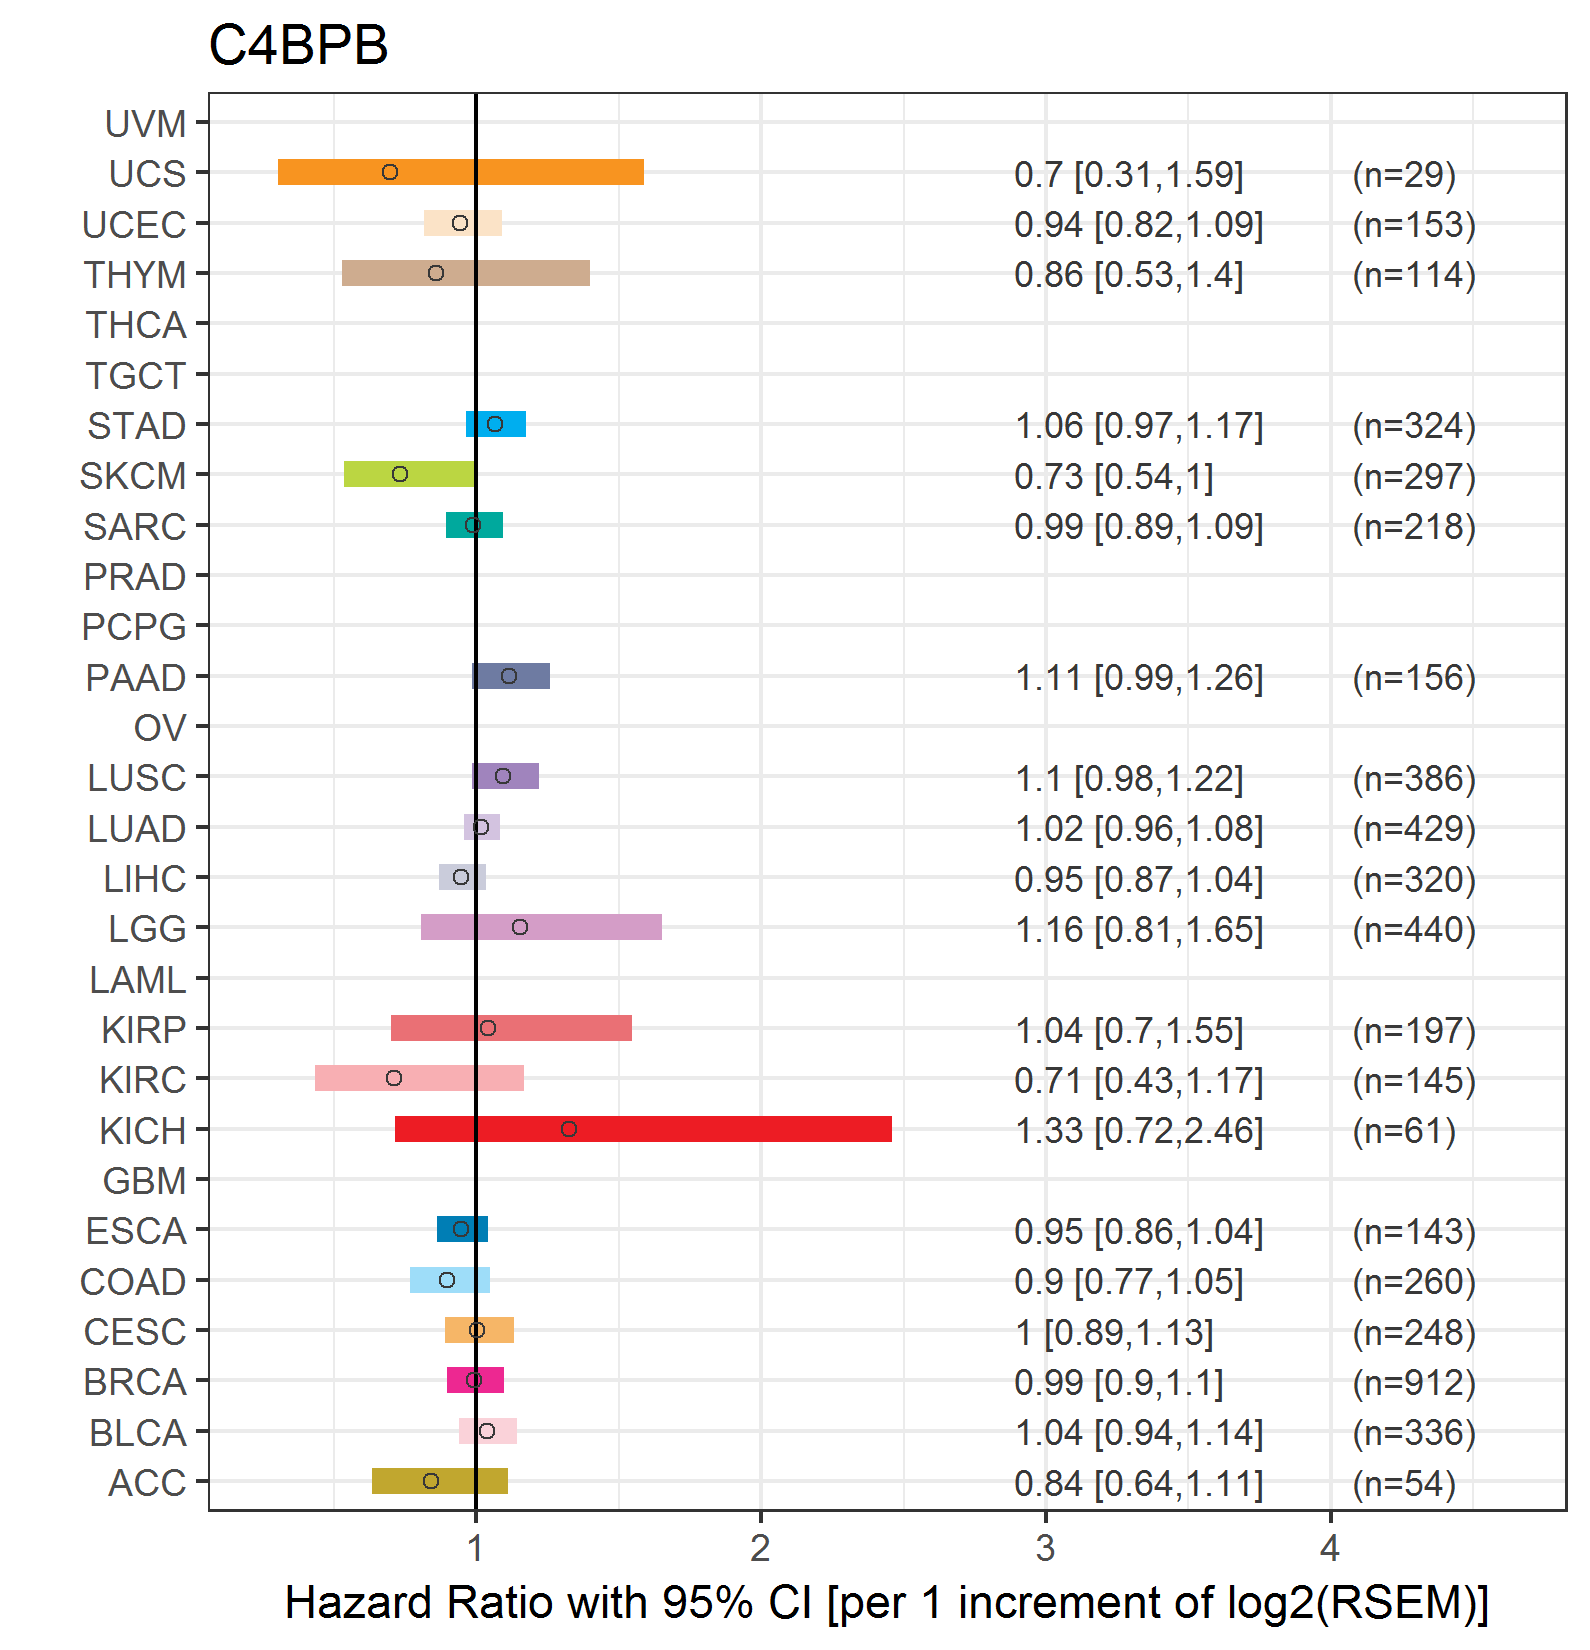
| Forest plot of Cox proportional hazard ratio (HR) and 95% CI of overall survival (OS) using 28 cancer types (TCGA IlluminaHiSeq_RNASeqV2, pan-cancer normalized log2(norm_counts+1) data, version 2016-08-16) (TCGA clinicalMatrix, phenotype data, version 2016-04-27) * Click on the image enlarge it in a new window. |
 |
| Forest plot of Cox proportional hazard ratio (HR) and 95% CI of relapse free survival (RFS) using 28 cancer types (TCGA IlluminaHiSeq_RNASeqV2, pan-cancer normalized log2(norm_counts+1) data, version 2016-08-16) (TCGA clinicalMatrix, phenotype data, version 2016-04-27) * Click on the image enlarge it in a new window. |
 |
| Top |
| TissGeneClin for C4BPB |
| TissGeneDrug for C4BPB |
| Drug information targeting TissGene (DrugBank Version 5.0.6, 2017-04-01) |
| DrugBank ID | Drug name | Drug activity | Drug type | Drug status |
| Top |
| TissGeneDisease for C4BPB |
| Disease information associated with TissGene (DisGeNet, 2016-06-01) |
| Disease ID | Disease name | # pubmeds | Source |
| umls:C0242383 | Age related macular degeneration | 2 | BeFree,GAD |
| umls:C0004610 | Bacteremia | 1 | BeFree |
| umls:C0004943 | Behcet Syndrome | 1 | BeFree |
| umls:C0007131 | Non-Small Cell Lung Carcinoma | 1 | BeFree |
| umls:C0020445 | Hypercholesterolemia, Familial | 1 | BeFree |
| umls:C0024305 | Lymphoma, Non-Hodgkin | 1 | GAD |
| umls:C0036341 | Schizophrenia | 1 | BeFree |
| umls:C0040336 | Tobacco Use Disorder | 1 | GAD |
| umls:C0242666 | Protein S Deficiency | 1 | BeFree |
| umls:C0311370 | Lupus anticoagulant disorder | 1 | BeFree |
|
Copyright 2016-Present - The University of Texas Health Science Center at Houston (UTHealth) Web File Viewing | How to Report, Fraud, Waste and Abuse | State of Texas | Statewide Search | Texas Homeland Security | Site Policies |