 |
| |
| |
| |
| |
| |
| |
|

| TissGeneSummary for TTPA |
 Gene summary Gene summary |
| Basic gene information | Gene symbol | TTPA |
| Gene name | tocopherol (alpha) transfer protein | |
| Synonyms | ATTP|AVED|TTP1|alphaTTP | |
| Cytomap | UCSC genome browser: 8q12.3 | |
| Type of gene | protein-coding | |
| RefGenes | NM_000370.3, | |
| Description | alpha-TTPalpha-tocopherol transfer proteintocopherol (alpha) transfer protein (ataxia (Friedreich-like) with vitamin E deficiency) | |
| Modification date | 20141219 | |
| dbXrefs | MIM : 600415 | |
| HGNC : HGNC | ||
| Ensembl : ENSG00000137561 | ||
| HPRD : 02685 | ||
| Vega : OTTHUMG00000164367 | ||
| Protein | UniProt: go to UniProt's Cross Reference DB Table | |
| Expression | CleanEX: HS_TTPA | |
| BioGPS: 7274 | ||
| Pathway | NCI Pathway Interaction Database: TTPA | |
| KEGG: TTPA | ||
| REACTOME: TTPA | ||
| Pathway Commons: TTPA | ||
| Context | iHOP: TTPA | |
| ligand binding site mutation search in PubMed: TTPA | ||
| UCL Cancer Institute: TTPA | ||
| Assigned class in TissGDB* | C | |
| Included tissue-specific gene expression resources | HPA,GTEx | |
| Specific-tissues in normal samples (assigned by TissGDB using HPA, TiGER, and GTEx) | Liver | |
| Cancer types related to the specific-tissues in cancer samples (assigned by TissGDB using TCGA) | LIHC | |
| Reference showing the relevant tissue of TTPA | ||
| Description by TissGene annotations | ||
| * Class A consists of genes with literature evidence and is part of the cTissGenes. Class B consists of only cTissGenes without additional evidence. The remaining genes belong to Class C. |
| Gene ontology having evidence of Inferred from Direct Assay (IDA) from Entrez |
| GO ID | GO term | PubMed ID |
| Top |
| TissGeneExp for TTPA |
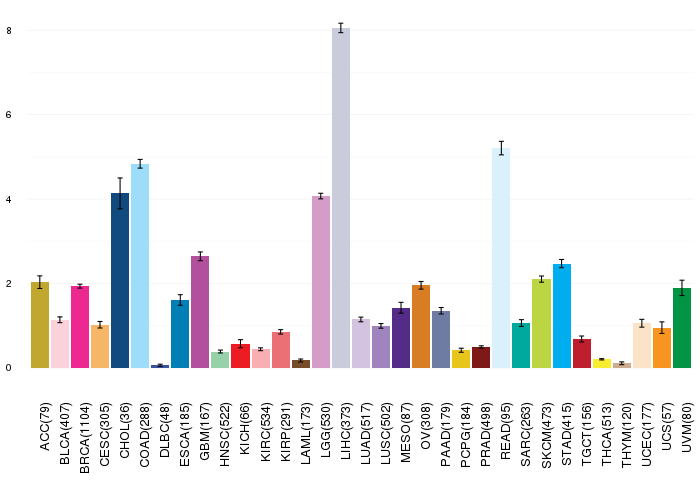
| Gene expressions across 28 cancer types (X-axis: cancer type and Y-axis: log2(norm_counts+1)) (TCGA IlluminaHiSeq_RNASeqV2, pan-cancer normalized log2(norm_counts+1) data, version 2016-08-16) |
 |
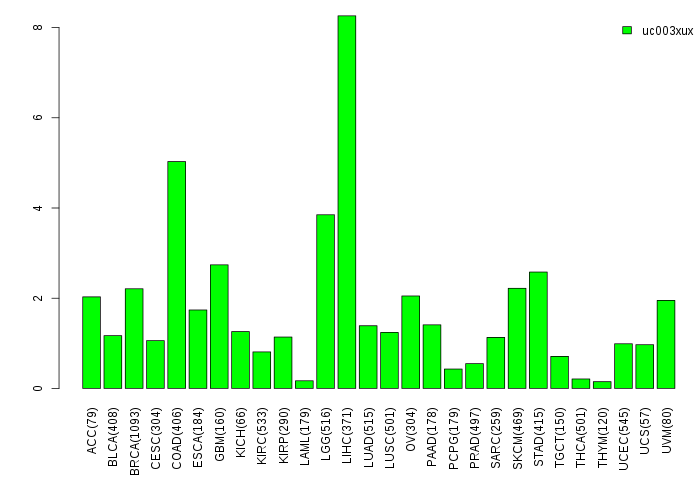
| Gene isoform expressions across 28 cancer types (X-axis: cancer type and Y-axis: log2(norm_counts+1)) (TCGA pan-cancer tcga_rsem_isoform_tpm, version 2016-09-01) |
 |
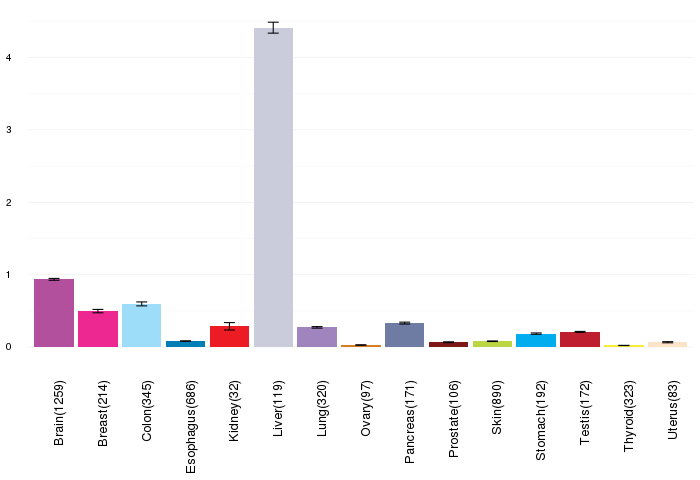
| Gene expressions across normal tissues of GTEx data (GTEx GTEx_Analysis_v6_RNA-seq_RNA-SeQCv1.1.8_gene_rpkm.gct) - Here, we shows the matched tissue types only among our 28 cancer types. |
 |
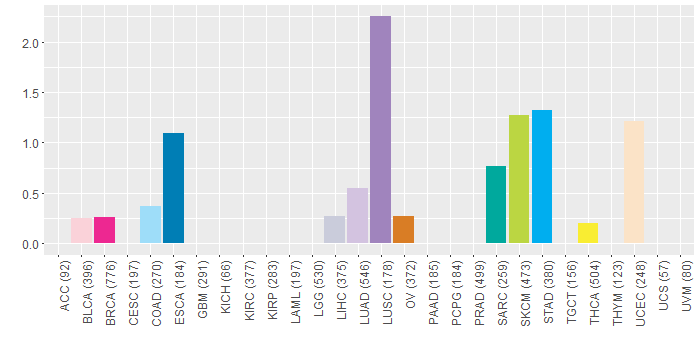
| Different expressions across 14 cancer types with more than 10 samples between matched tumors and normals (X-axis: cancer type and Y-axis: log2(norm_counts+1)) (TCGA IlluminaHiSeq_RNASeqV2, pan-cancer normalized log2(norm_counts+1) data, version 2016-08-16) |
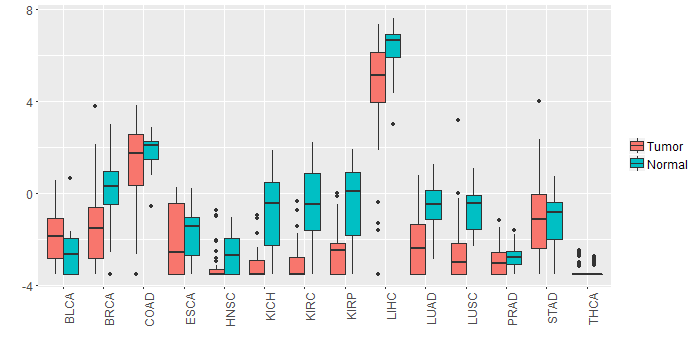 |
| - Significantly differentially expressed cancer types and information. (|Fold change|>1 and FDR<0.05) |
| Cancer type | Mean(exp) in tumor | Mean(exp) in matched normal | Log2FC | P-val. | FDR |
| KICH | -3.007230909 | -0.749522909 | -2.257708 | 2.27E-07 | 9.66E-07 |
| LUSC | -2.553063066 | -0.723974831 | -1.829088235 | 1.14E-12 | 5.19E-12 |
| KIRP | -2.422114659 | -0.378417784 | -2.043696875 | 4.19E-07 | 2.31E-06 |
| LIHC | 4.608219091 | 6.374577091 | -1.766358 | 3.84E-06 | 1.83E-05 |
| BRCA | -1.498147225 | 0.207875582 | -1.706022807 | 2.64E-17 | 1.57E-16 |
| KIRC | -3.041262576 | -0.400584798 | -2.640677778 | 1.29E-24 | 1.49E-23 |
| LUAD | -2.217691599 | -0.511514013 | -1.706177586 | 1.38E-13 | 1.20E-12 |
| Top |
| TissGene-miRNA for TTPA |
| Significantly anti-correlated miRNAs of TissGene across 28 cancer types (Gene-miRNA relations from TargetScanHuman Relsease 7.1, Conserved_Site_Context_Scores.txt.zip, 06.01.2016) (TCGA IlluminaHiSeq_miRNASeq, log2(RPM+1) data, version 2016-11-21) (TCGA IlluminaHiSeq_RNASeqV2, log2(normalized_count+1) data, version 2016-08-16) (Spearman’s Rank Correlation (p-value<0.05 and coefficient<-0.25)) |
| Cancer type | miRNA id | miRNA accession | P-val. | Coeff. | # samples |
| Top |
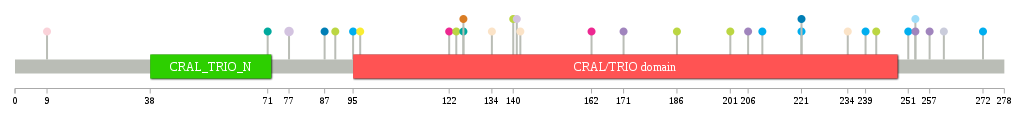
| TissGeneMut for TTPA |
| TissGeneSNV for TTPA |
| nsSNV counts per each loci. Different colors of circles represent different cancer types. Circle size denotes number of samples. (TCGA somatic mutation (SNPs and small INDELs) data, version 2016-04-25) * Click on the image to enlarge it in a new window. |
 |
 |
| Somatic nucleotide variants of TissGene across 28 cancer types (X-axis: cancer type and Y-axis: % of mutated samples) The numbers in parentheses are numbers of samples with mutation (nsSNVs). (TCGA somatic mutation (SNPs and small INDELs) data, version 2016-04-25) |
 |
| - nsSNVs sorted by frequency. |
| AAchange | Cancer type | # samples |
| p.R77S | LUAD | 2 |
| p.L95I | STAD | 1 |
| p.W122C | BRCA | 1 |
| p.H225L | HNSC | 1 |
| p.D239Y | STAD | 1 |
| p.G162V | BRCA | 1 |
| p.V126I | SARC | 1 |
| p.V201I | SKCM | 1 |
| p.K97N | THCA | 1 |
| p.R134Q | UCEC | 1 |
| p.P124S | SKCM | 1 |
| p.Q257R | LUSC | 1 |
| p.P242L | HNSC | 1 |
| p.D49E | READ | 1 |
| p.E253V | COAD | 1 |
| p.E253Q | LUSC | 1 |
| p.V206A | LUSC | 1 |
| p.P242S | SKCM | 1 |
| p.R90K | SKCM | 1 |
| p.S186L | SKCM | 1 |
| p.R221W | STAD | 1 |
| p.I210M | STAD | 1 |
| p.P124T | HNSC | 1 |
| p.L87I | ESCA | 1 |
| p.V126I | OV | 1 |
| p.L142I | UCEC | 1 |
| p.S272I | STAD | 1 |
| p.E141D | LUAD | 1 |
| p.K71* | SARC | 1 |
| p.L234I | UCEC | 1 |
| p.V144L | HNSC | 1 |
| p.N261S | LIHC | 1 |
| p.R134X | READ | 1 |
| p.S140F | SKCM | 1 |
| p.S9* | BLCA | 1 |
| p.R221W | ESCA | 1 |
| p.S251F | STAD | 1 |
| p.I171M | LUSC | 1 |
| Top |
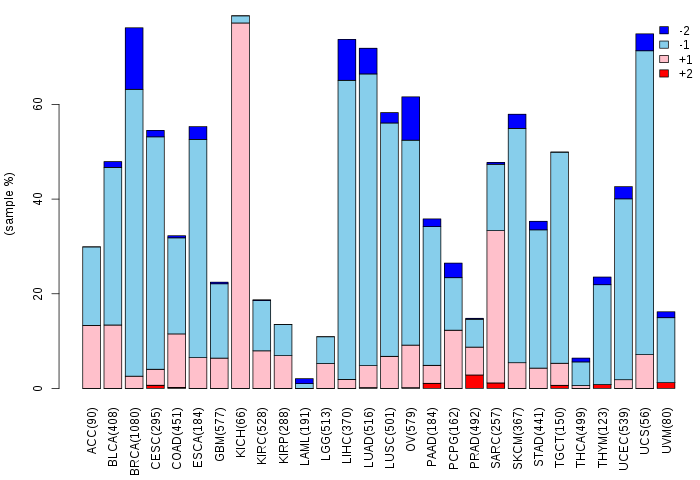
| TissGeneCNV for TTPA |
| Copy number variations of TissGene across 28 cancer types (X-axis: cancer type and Y-axis: % of CNV samples) (TCGA Gistic2_CopyNumber_Gistic2_all_data_by_genes, Gistic2 copy number data, version 2016-08-16) |
 |
| Top |
| TissGeneFusions for TTPA |
| Fusion genes including TissGene (ChimerDB 3.0, 2016-12-01 and TCGA fusion Portal 2015-12-01) |
| Database | Src | Cancer type | Sample | Fusion gene | ORF | 5'-gene BP | 3'-gene BP |
| Top |
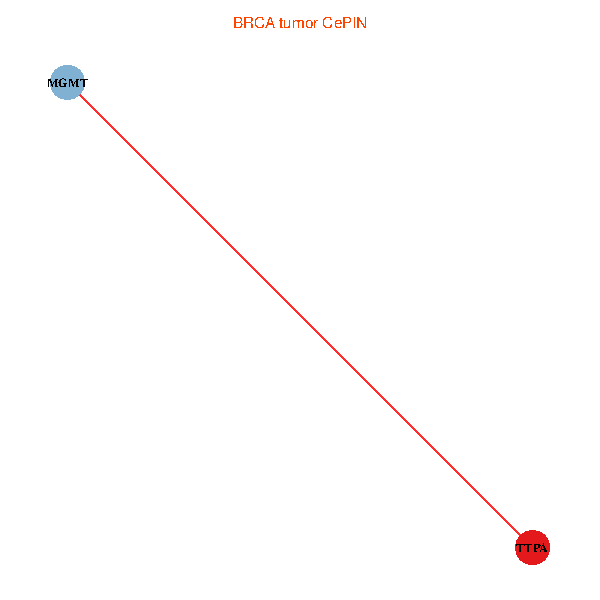
| TissGeneNet for TTPA |
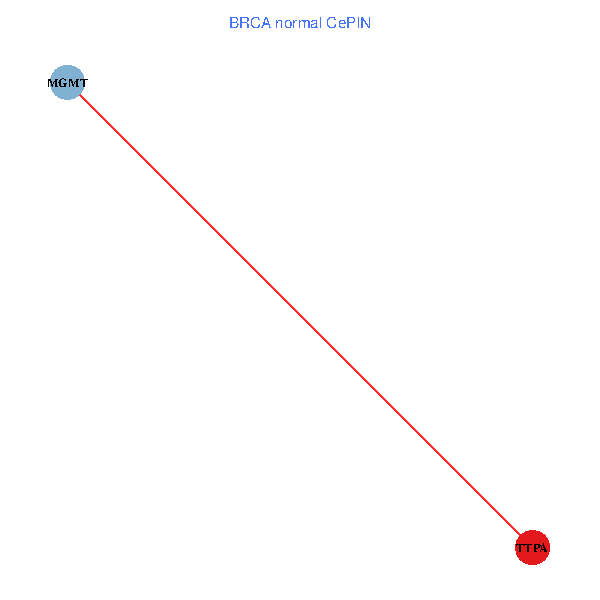
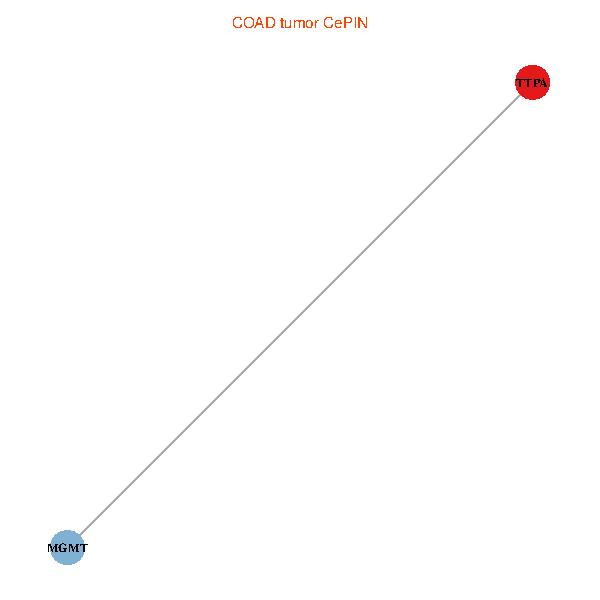
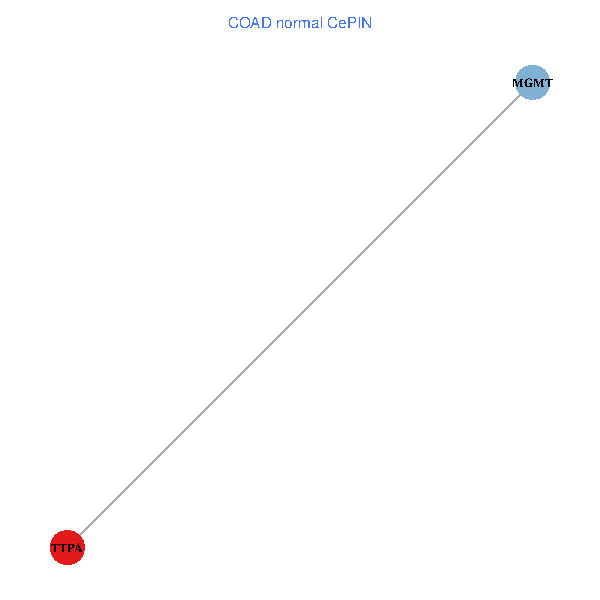
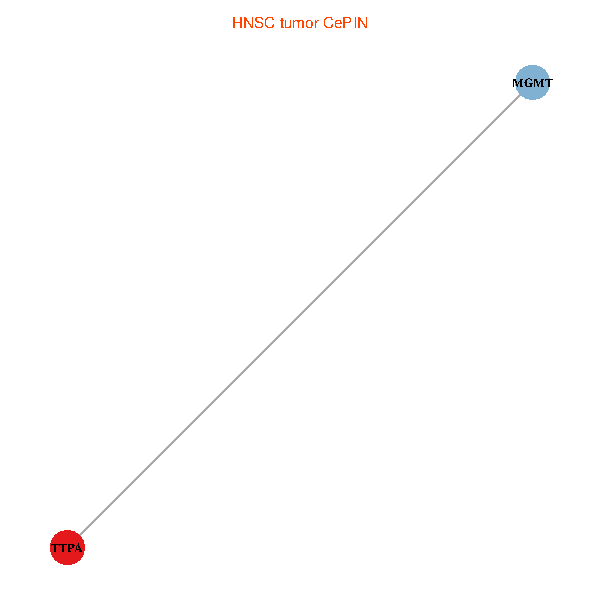
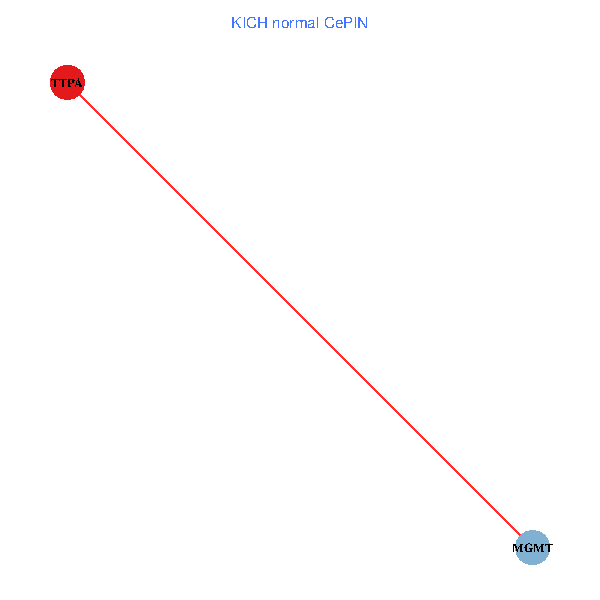
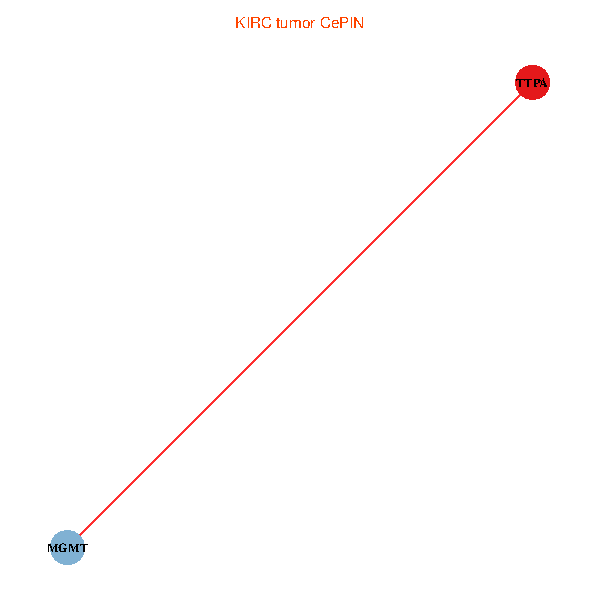
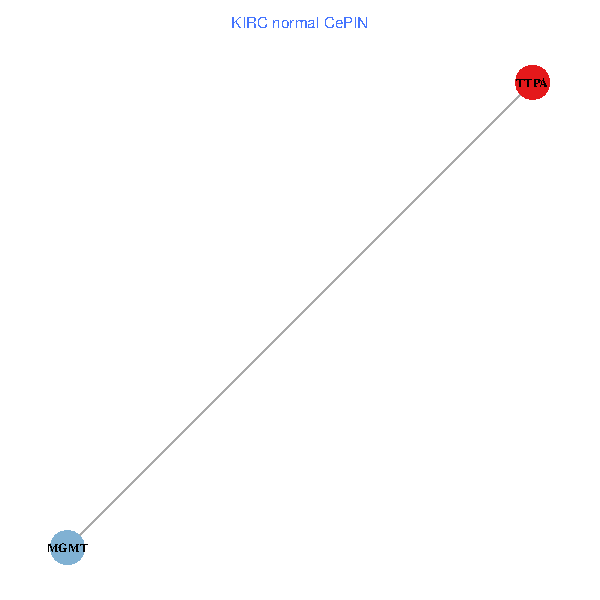
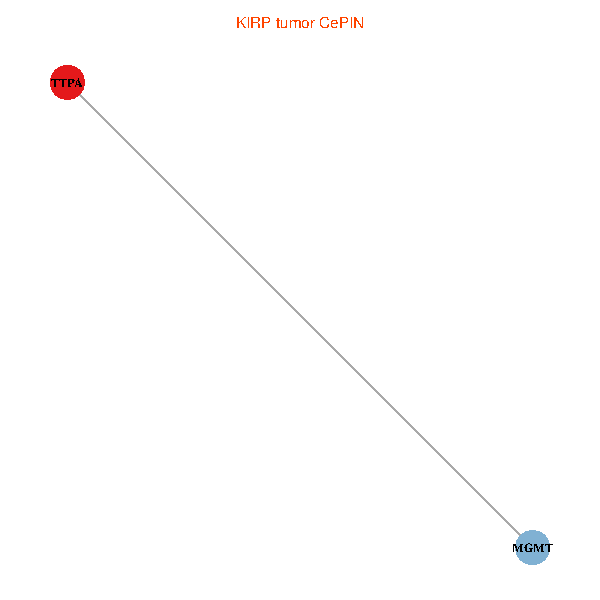
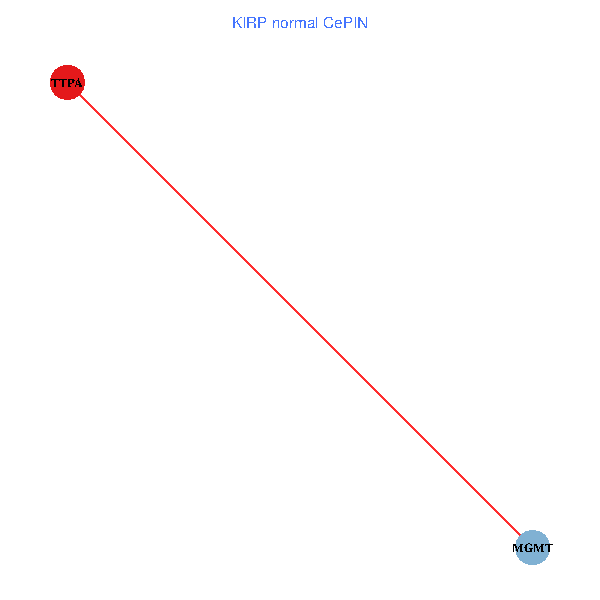
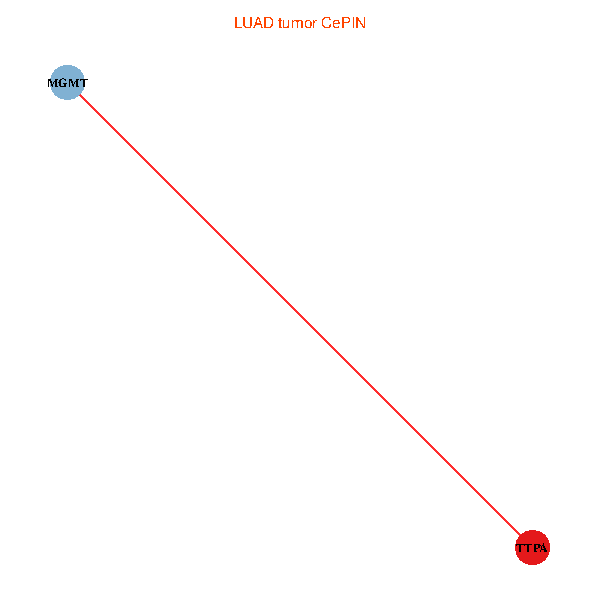
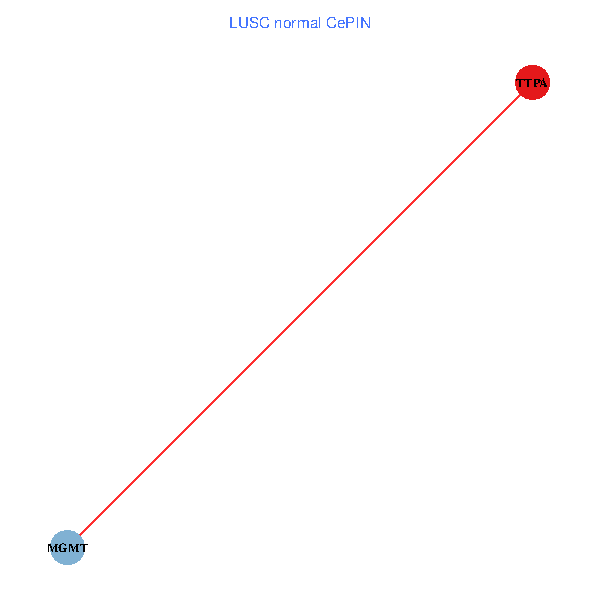
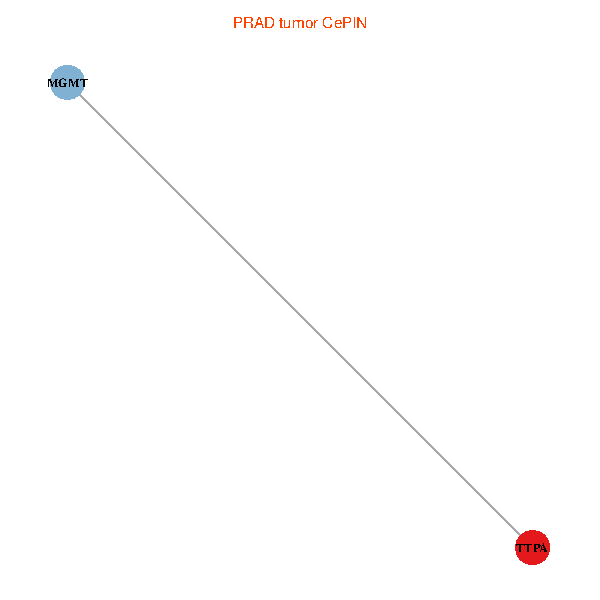
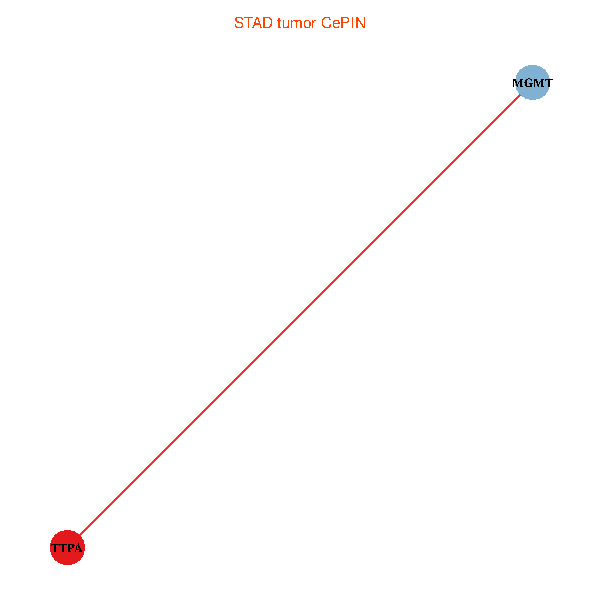
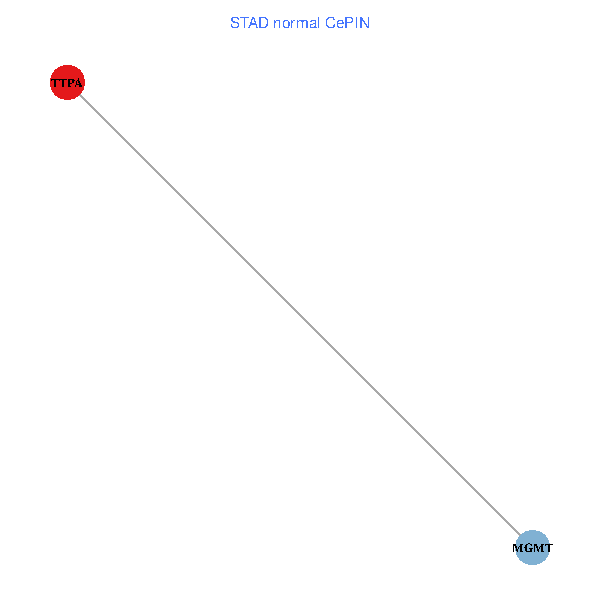
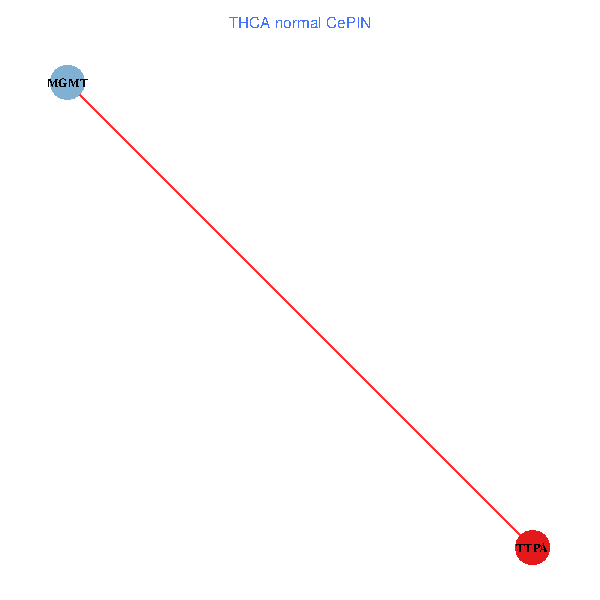
| Co-expressed gene networks based on protein-protein interaction data (CePIN) (TCGA IlluminaHiSeq_RNASeqV2, pan-cancer normalized log2(norm_counts+1) data, version 2016-08-16) (PINA2 ppi data) |
| BRCA (tumor) | BRCA (normal) |
| TTPA, MGMT (tumor) | TTPA, MGMT (normal) |
 |  |
| COAD (tumor) | COAD (normal) |
| TTPA, MGMT (tumor) | TTPA, MGMT (normal) |
 |  |
| HNSC (tumor) | HNSC (normal) |
| TTPA, MGMT (tumor) | TTPA, MGMT (normal) |
 |  |
| KICH (tumor) | KICH (normal) |
| TTPA, MGMT (tumor) | TTPA, MGMT (normal) |
 |  |
| KIRC (tumor) | KIRC (normal) |
| TTPA, MGMT (tumor) | TTPA, MGMT (normal) |
 |  |
| KIRP (tumor) | KIRP (normal) |
| TTPA, MGMT (tumor) | TTPA, MGMT (normal) |
 |  |
| LIHC (tumor) | LIHC (normal) |
| TTPA, MGMT (tumor) | TTPA, MGMT (normal) |
 |  |
| LUAD (tumor) | LUAD (normal) |
| TTPA, MGMT (tumor) | TTPA, MGMT (normal) |
 |  |
| LUSC (tumor) | LUSC (normal) |
| TTPA, MGMT (tumor) | TTPA, MGMT (normal) |
 |  |
| PRAD (tumor) | PRAD (normal) |
| TTPA, MGMT (tumor) | TTPA, MGMT (normal) |
 |  |
| STAD (tumor) | STAD (normal) |
| TTPA, MGMT (tumor) | TTPA, MGMT (normal) |
 |  |
| THCA (tumor) | THCA (normal) |
| TTPA, MGMT (tumor) | TTPA, MGMT (normal) |
 |  |
| Top |
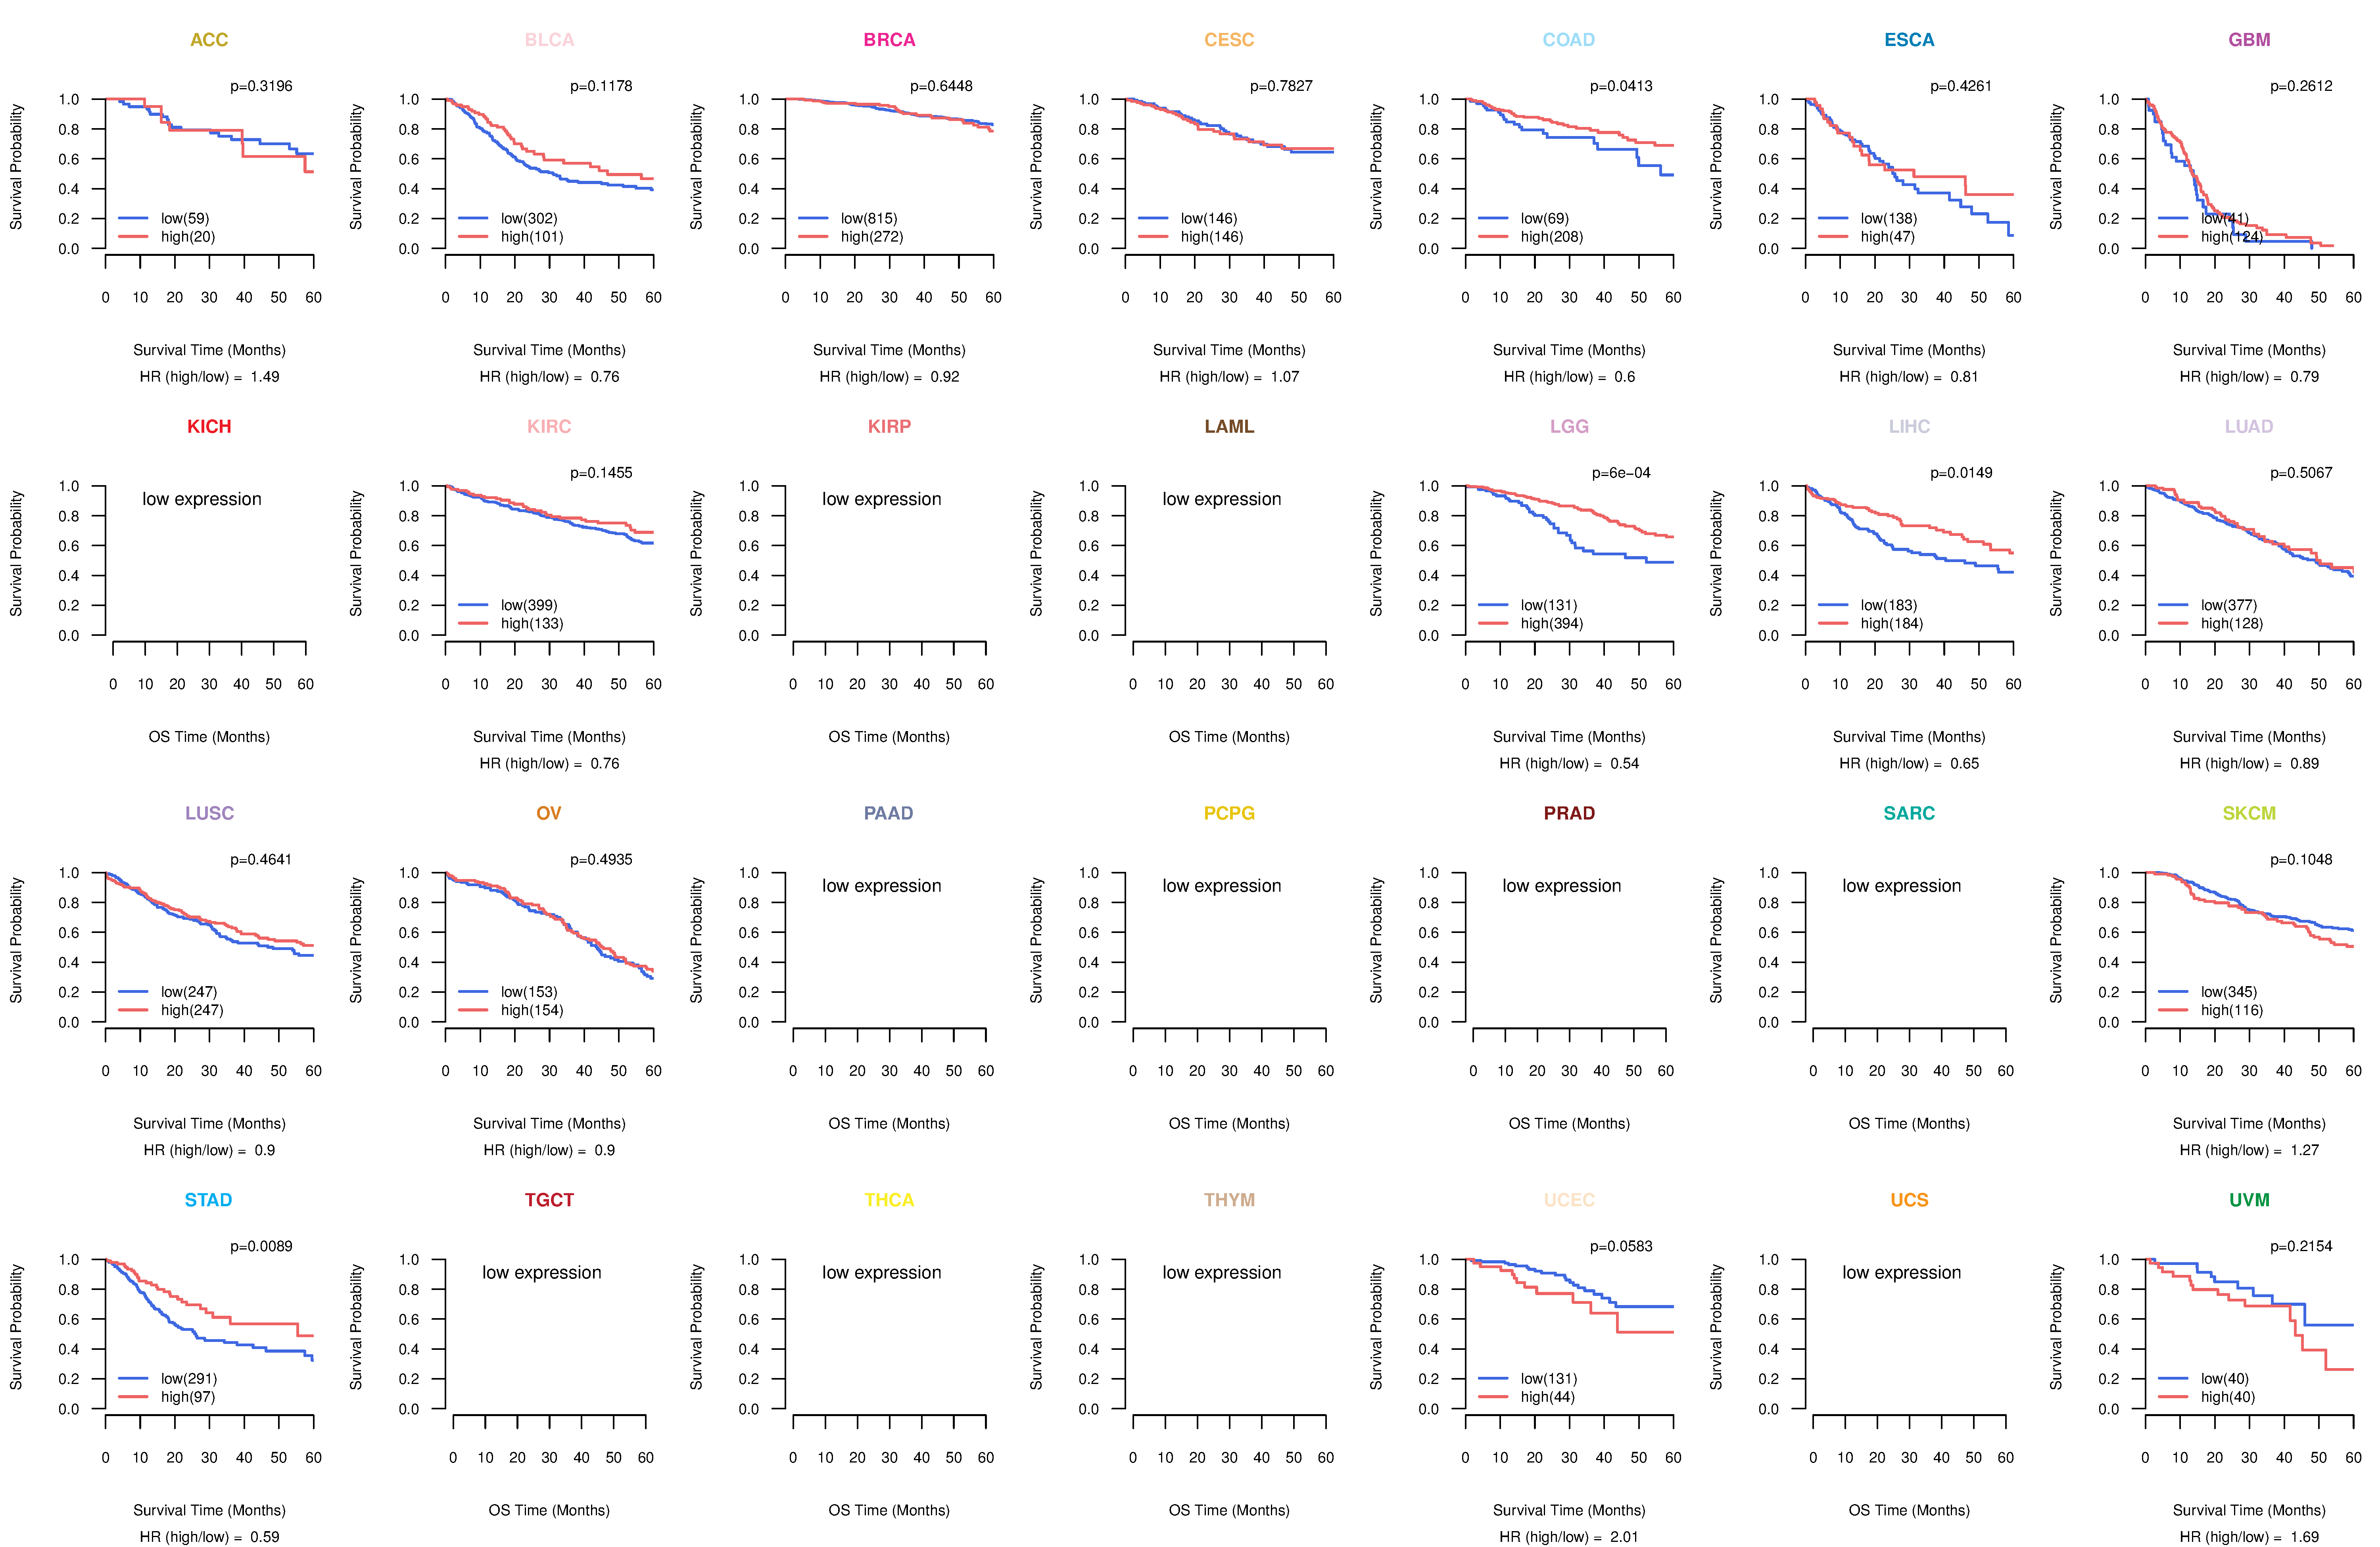
| TissGeneProg for TTPA |
| Kaplan-Meier plots with logrank tests of overall survival (OS) using 28 cancer types (TCGA IlluminaHiSeq_RNASeqV2, pan-cancer normalized log2(norm_counts+1) data, version 2016-08-16) (TCGA clinicalMatrix, phenotype data, version 2016-04-27) * Click on the image to enlarge it in a new window. |
 |
| Kaplan-Meier plots with logrank test of relapse free survival (RFS) using 28 cancer types (TCGA IlluminaHiSeq_RNASeqV2, pan-cancer normalized log2(norm_counts+1) data, version 2016-08-16) (TCGA clinicalMatrix, phenotype data, version 2016-04-27) * Click on the image enlarge it in a new window. |
 |
| Forest plot of Cox proportional hazard ratio (HR) and 95% CI of overall survival (OS) using 28 cancer types (TCGA IlluminaHiSeq_RNASeqV2, pan-cancer normalized log2(norm_counts+1) data, version 2016-08-16) (TCGA clinicalMatrix, phenotype data, version 2016-04-27) * Click on the image enlarge it in a new window. |
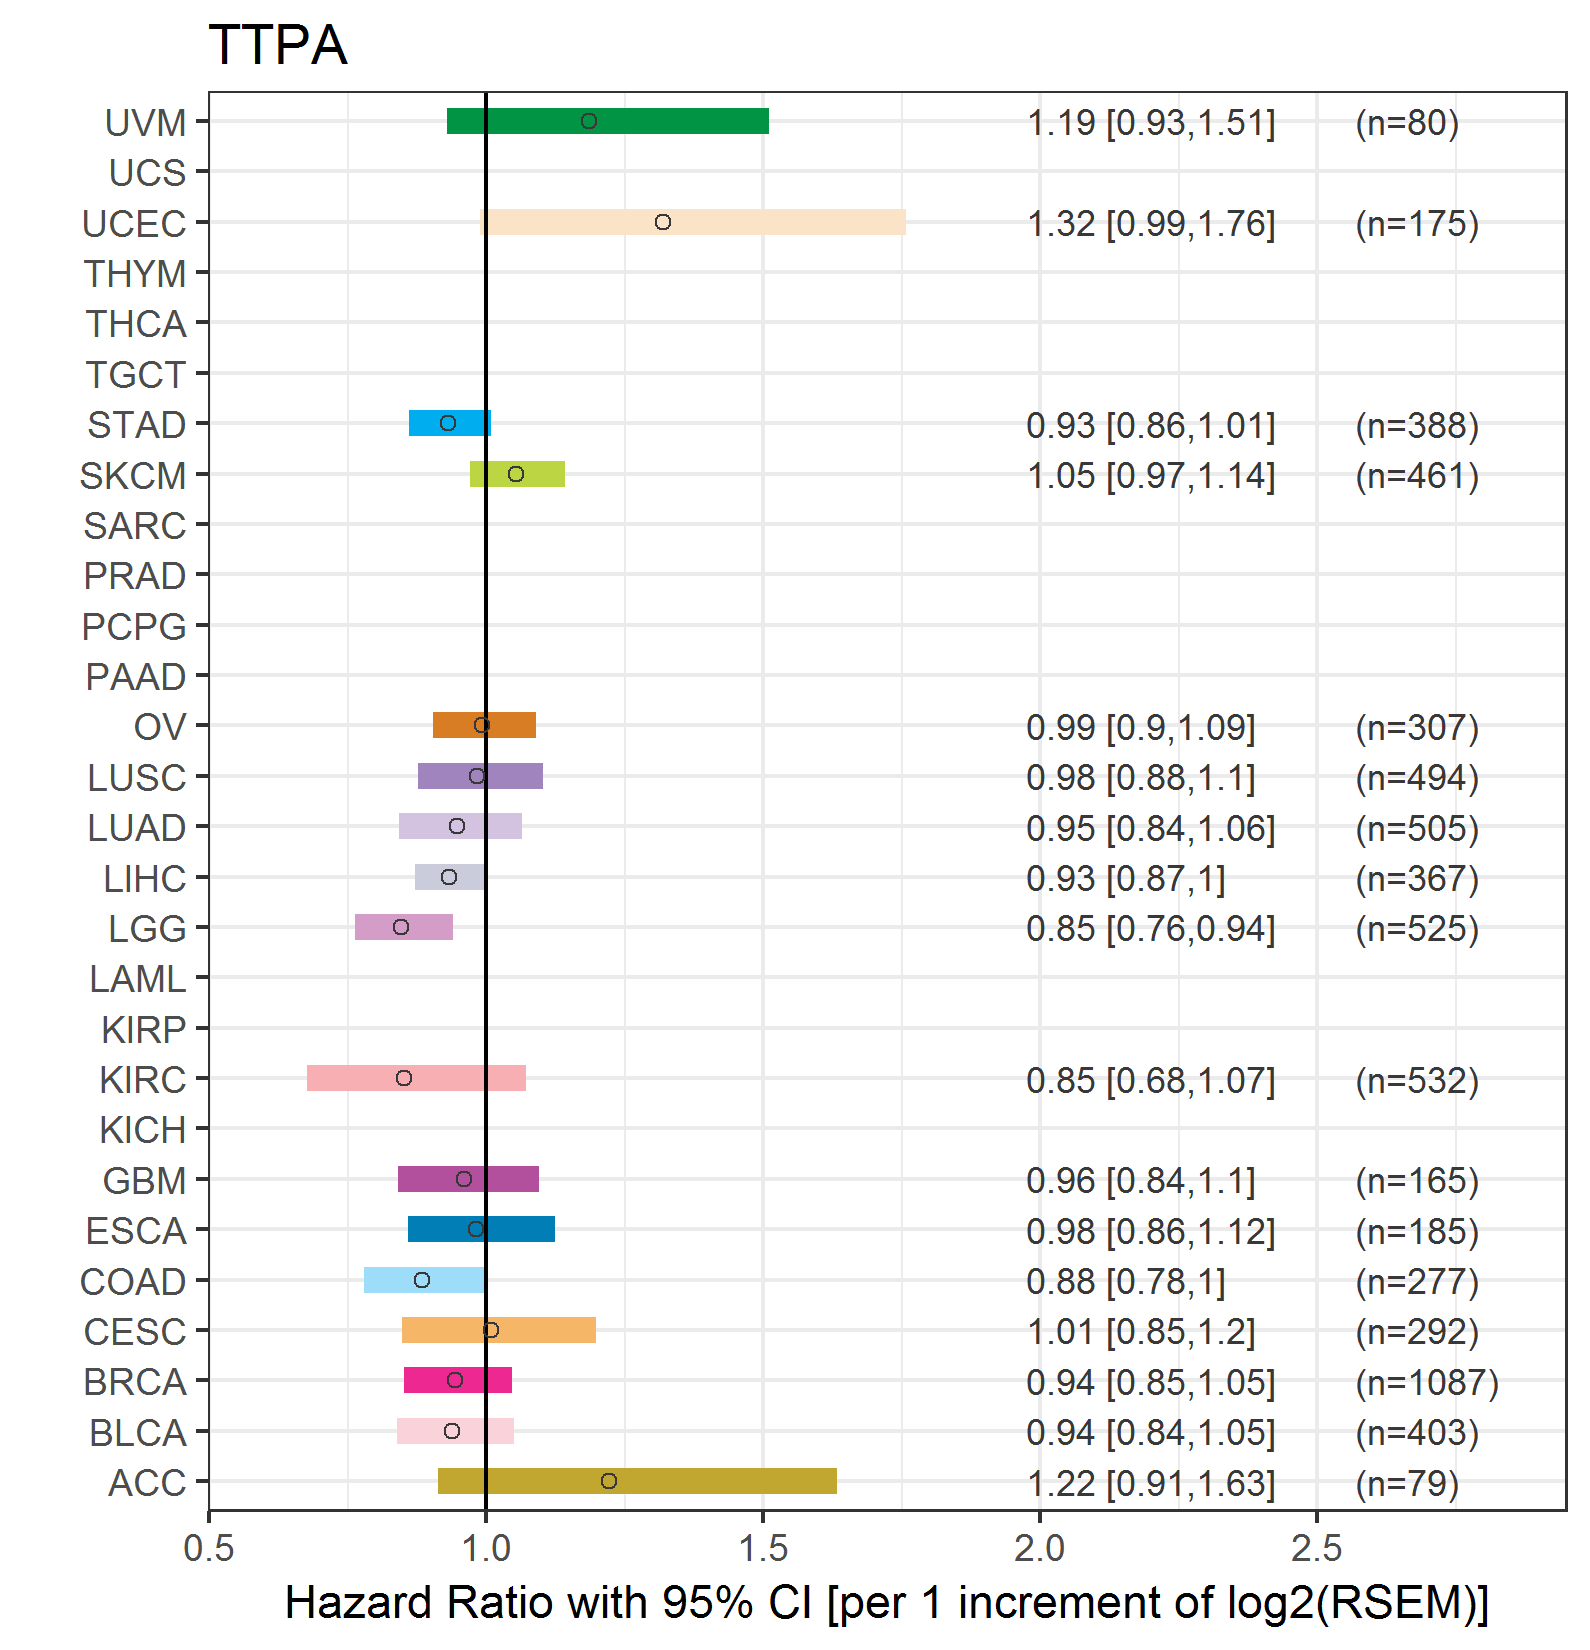 |
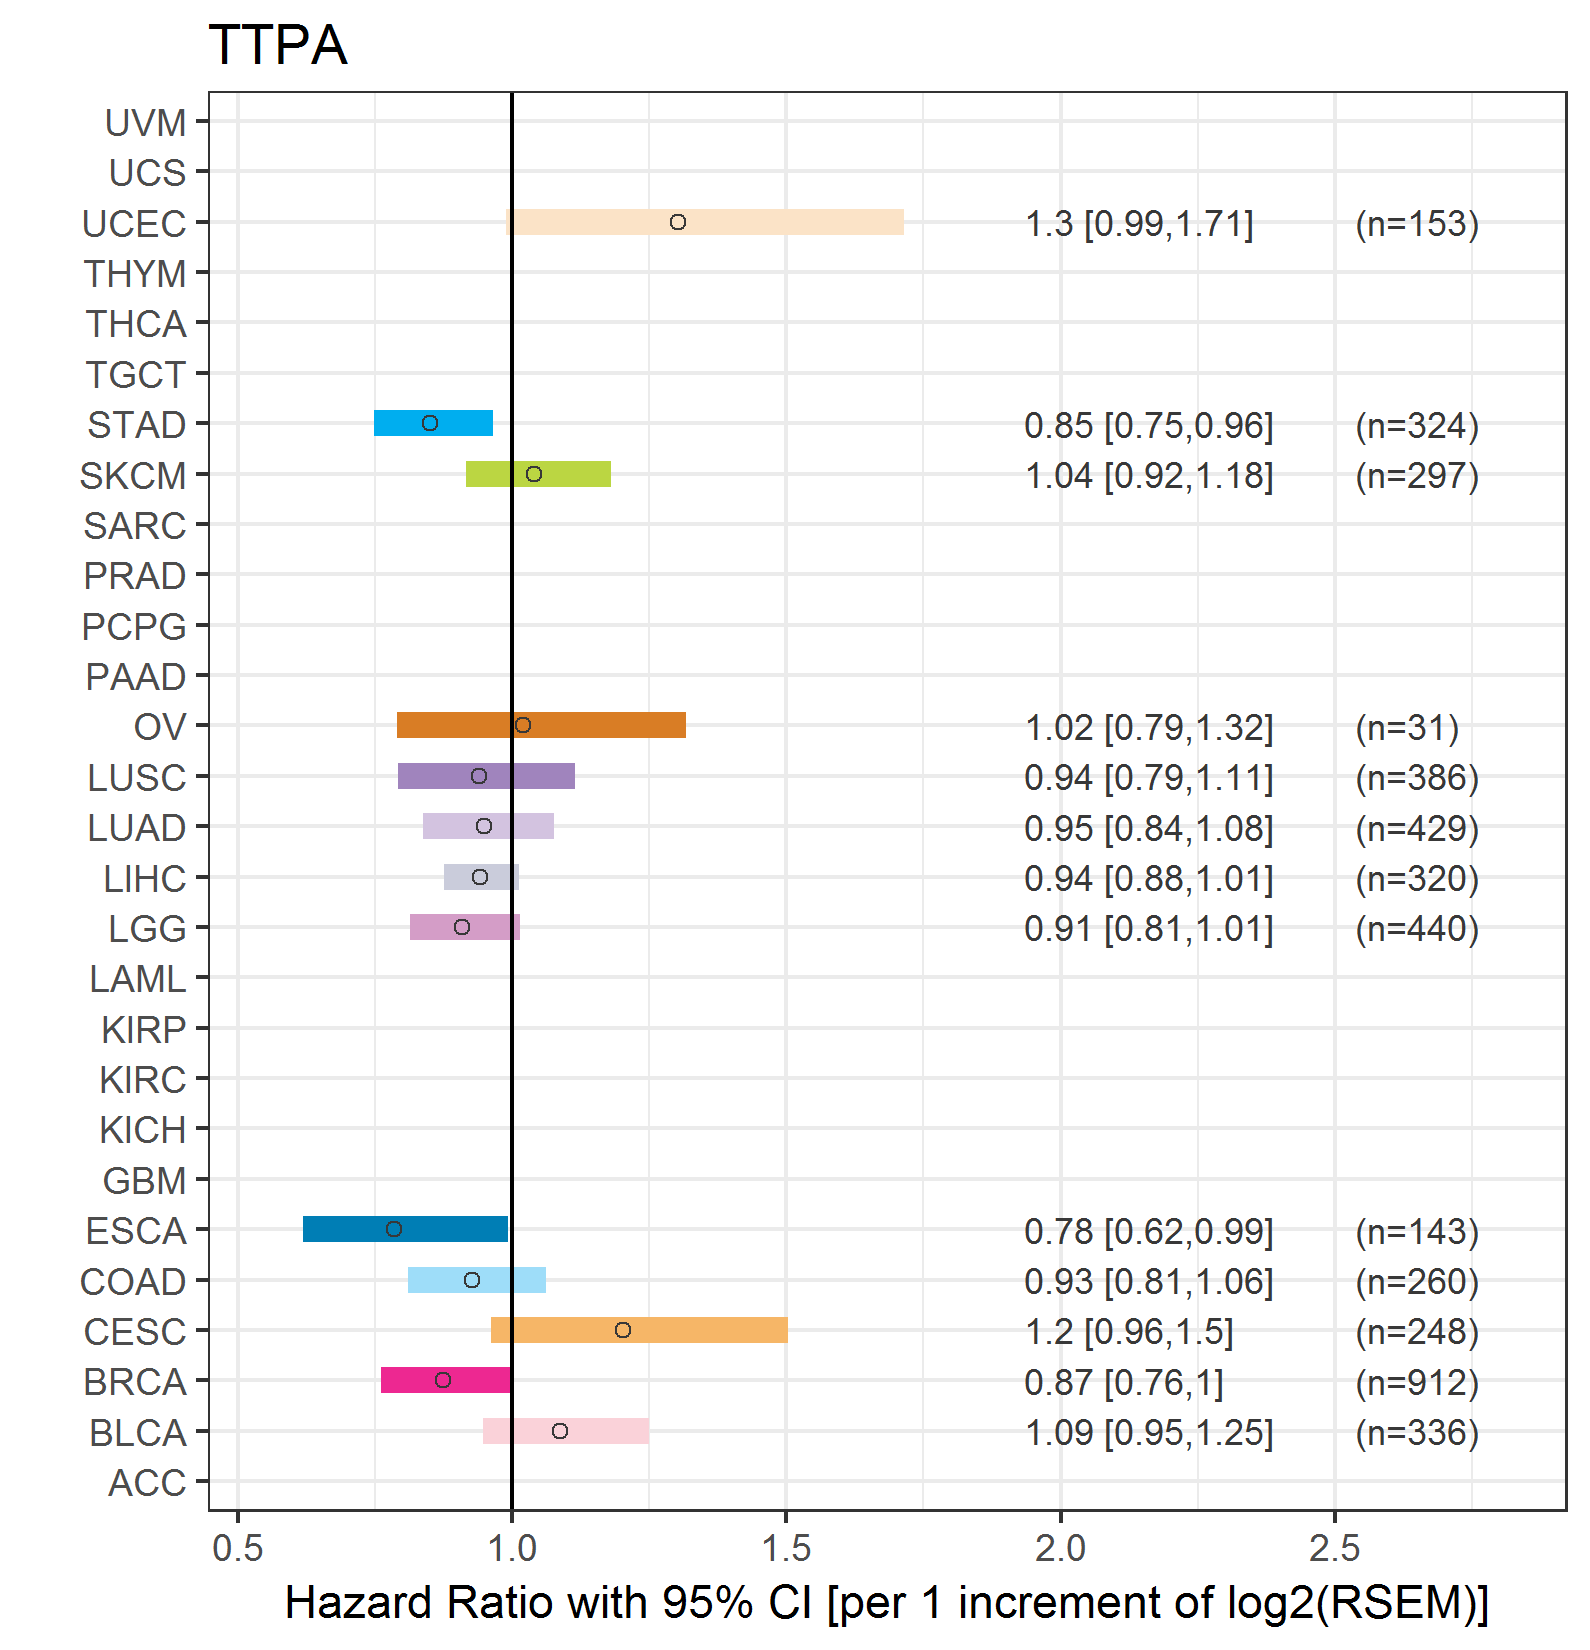
| Forest plot of Cox proportional hazard ratio (HR) and 95% CI of relapse free survival (RFS) using 28 cancer types (TCGA IlluminaHiSeq_RNASeqV2, pan-cancer normalized log2(norm_counts+1) data, version 2016-08-16) (TCGA clinicalMatrix, phenotype data, version 2016-04-27) * Click on the image enlarge it in a new window. |
 |
| Top |
| TissGeneClin for TTPA |
| TissGeneDrug for TTPA |
| Drug information targeting TissGene (DrugBank Version 5.0.6, 2017-04-01) |
| DrugBank ID | Drug name | Drug activity | Drug type | Drug status |
| Top |
| TissGeneDisease for TTPA |
| Disease information associated with TissGene (DisGeNet, 2016-06-01) |
| Disease ID | Disease name | # pubmeds | Source |
| umls:C1848533 | Ataxia with vitamin E deficiency | 26 | BeFree,CLINVAR,CTD_human,MGD,ORPHANET,UNIPROT |
| umls:C0042875 | Vitamin E Deficiency | 11 | BeFree,CTD_human,LHGDN |
| umls:C0004134 | Ataxia | 9 | BeFree,LHGDN |
| umls:C0035334 | Retinitis Pigmentosa | 7 | BeFree,CTD_human |
| umls:C0027877 | Neuronal Ceroid-Lipofuscinoses | 6 | BeFree |
| umls:C0524851 | Neurodegenerative Disorders | 5 | BeFree |
| umls:C0022340 | Late-Infantile Neuronal Ceroid Lipfuscinosis | 4 | BeFree |
| umls:C0002395 | Alzheimer's Disease | 2 | BeFree,GAD |
| umls:C0003873 | Rheumatoid Arthritis | 2 | BeFree,GAD |
| umls:C0027765 | nervous system disorder | 2 | BeFree,CTD_human |
| umls:C0035309 | Retinal Diseases | 2 | CTD_human,GAD |
| umls:C0087012 | Ataxia, Spinocerebellar | 2 | BeFree,LHGDN |
| umls:C2239176 | Liver carcinoma | 2 | BeFree |
| umls:C0002874 | Aplastic Anemia | 1 | BeFree |
| umls:C0004153 | Atherosclerosis | 1 | CTD_human |
| umls:C0005956 | Bone Marrow Diseases | 1 | BeFree |
| umls:C0013421 | Dystonia | 1 | BeFree |
| umls:C0016719 | Friedreich Ataxia | 1 | BeFree |
| umls:C0019693 | HIV Infections | 1 | BeFree |
| umls:C0023434 | Chronic Lymphocytic Leukemia | 1 | BeFree |
| umls:C0023903 | Liver neoplasms | 1 | RGD |
| umls:C0024437 | Macular degeneration | 1 | BeFree |
| umls:C0026846 | Muscular Atrophy | 1 | CTD_human |
| umls:C0027051 | Myocardial Infarction | 1 | LHGDN |
| umls:C0030312 | Pancytopenia | 1 | BeFree |
| umls:C0034933 | Reflex, Abnormal | 1 | CTD_human |
| umls:C0037822 | Speech Disorders | 1 | CTD_human |
| umls:C0042035 | Urination Disorders | 1 | CTD_human |
| umls:C0042790 | Vision Disorders | 1 | CTD_human |
| umls:C0233401 | Psychiatric symptom | 1 | BeFree |
| umls:C0234366 | Ataxic | 1 | BeFree |
| umls:C0235031 | Neurologic Symptoms | 1 | BeFree |
| umls:C0242383 | Age related macular degeneration | 1 | BeFree |
| umls:C0242706 | Hyperoxia | 1 | RGD |
| umls:C0260662 | Hearing problem | 1 | CTD_human |
| umls:C0265965 | Dyskeratosis Congenita | 1 | BeFree |
| umls:C0376358 | Malignant neoplasm of prostate | 1 | BeFree,GAD |
| umls:C0393593 | Dystonia Disorders | 1 | BeFree |
| umls:C0596263 | Carcinogenesis | 1 | BeFree |
| umls:C0600139 | Prostate carcinoma | 1 | BeFree |
| umls:C0752125 | Spinocerebellar Ataxia Type 7 | 1 | BeFree |
| umls:C0752262 | Somatosensory Disorders | 1 | CTD_human |
| umls:C1318485 | Liver regeneration disorder | 1 | BeFree |
| umls:C1512409 | Hepatocarcinogenesis | 1 | BeFree |
| umls:C1846142 | HOYERAAL-HREIDARSSON SYNDROME | 1 | BeFree |
| umls:C1853761 | SPINOCEREBELLAR ATAXIA, AUTOSOMAL RECESSIVE 1 | 1 | BeFree |
|
Copyright 2016-Present - The University of Texas Health Science Center at Houston (UTHealth) Web File Viewing | How to Report, Fraud, Waste and Abuse | State of Texas | Statewide Search | Texas Homeland Security | Site Policies |