 |
| |
| |
| |
| |
| |
| |
|

| TissGeneSummary for USP1 |
 Gene summary Gene summary |
| Basic gene information | Gene symbol | USP1 |
| Gene name | ubiquitin specific peptidase 1 | |
| Synonyms | UBP | |
| Cytomap | UCSC genome browser: 1p31.3 | |
| Type of gene | protein-coding | |
| RefGenes | NM_001017415.1, NM_001017416.1,NM_003368.4, | |
| Description | deubiquitinating enzyme 1hUBPubiquitin carboxyl terminal hydrolase 1ubiquitin carboxyl-terminal hydrolase 1ubiquitin specific processing protease 1ubiquitin specific protease 1ubiquitin thioesterase 1ubiquitin thiolesterase 1ubiquitin-specific-pro | |
| Modification date | 20141207 | |
| dbXrefs | MIM : 603478 | |
| HGNC : HGNC | ||
| Ensembl : ENSG00000162607 | ||
| HPRD : 04593 | ||
| Vega : OTTHUMG00000008972 | ||
| Protein | UniProt: go to UniProt's Cross Reference DB Table | |
| Expression | CleanEX: HS_USP1 | |
| BioGPS: 7398 | ||
| Pathway | NCI Pathway Interaction Database: USP1 | |
| KEGG: USP1 | ||
| REACTOME: USP1 | ||
| Pathway Commons: USP1 | ||
| Context | iHOP: USP1 | |
| ligand binding site mutation search in PubMed: USP1 | ||
| UCL Cancer Institute: USP1 | ||
| Assigned class in TissGDB* | C | |
| Included tissue-specific gene expression resources | TiGER,GTEx | |
| Specific-tissues in normal samples (assigned by TissGDB using HPA, TiGER, and GTEx) | BladderTestis | |
| Cancer types related to the specific-tissues in cancer samples (assigned by TissGDB using TCGA) | BLCATGCT | |
| Reference showing the relevant tissue of USP1 | ||
| Description by TissGene annotations | Cancer gene Have significant anti-correlated miRNA TissgsLTS | |
| * Class A consists of genes with literature evidence and is part of the cTissGenes. Class B consists of only cTissGenes without additional evidence. The remaining genes belong to Class C. |
| Gene ontology having evidence of Inferred from Direct Assay (IDA) from Entrez |
| GO ID | GO term | PubMed ID | GO:0006282 | regulation of DNA repair | 18082604 | GO:0009411 | response to UV | 18082604 | GO:0016579 | protein deubiquitination | 18082604 | GO:0006282 | regulation of DNA repair | 18082604 | GO:0009411 | response to UV | 18082604 | GO:0016579 | protein deubiquitination | 18082604 |
| Top |
| TissGeneExp for USP1 |
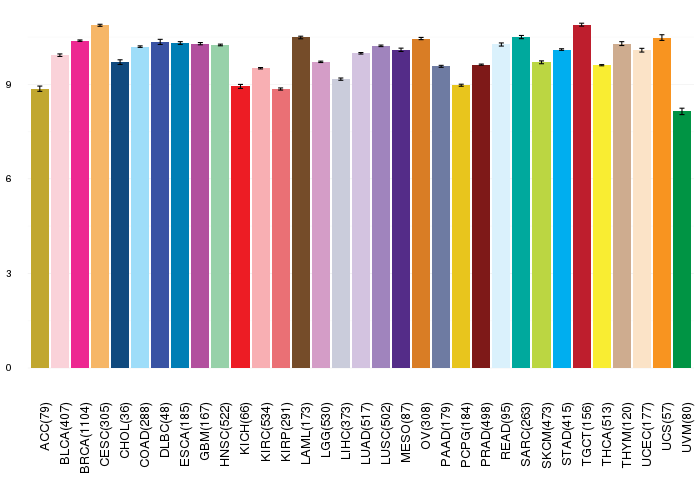
| Gene expressions across 28 cancer types (X-axis: cancer type and Y-axis: log2(norm_counts+1)) (TCGA IlluminaHiSeq_RNASeqV2, pan-cancer normalized log2(norm_counts+1) data, version 2016-08-16) |
 |
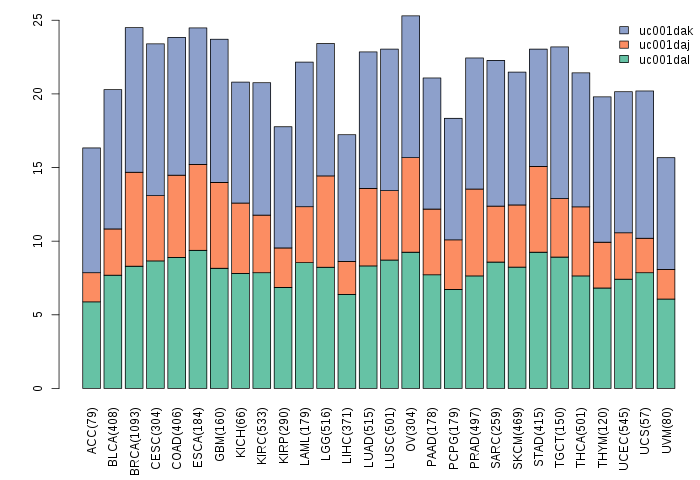
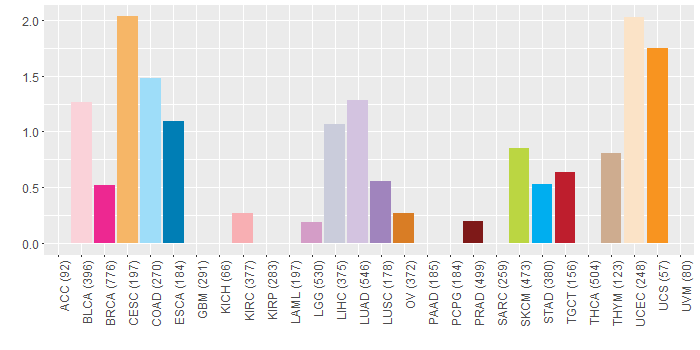
| Gene isoform expressions across 28 cancer types (X-axis: cancer type and Y-axis: log2(norm_counts+1)) (TCGA pan-cancer tcga_rsem_isoform_tpm, version 2016-09-01) |
 |
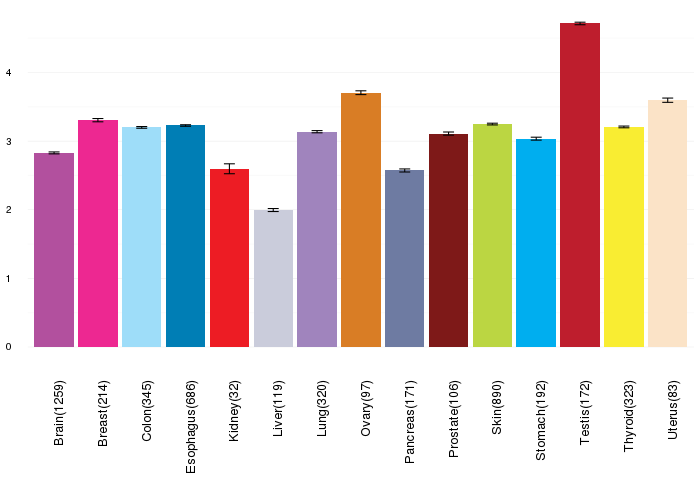
| Gene expressions across normal tissues of GTEx data (GTEx GTEx_Analysis_v6_RNA-seq_RNA-SeQCv1.1.8_gene_rpkm.gct) - Here, we shows the matched tissue types only among our 28 cancer types. |
 |
| Different expressions across 14 cancer types with more than 10 samples between matched tumors and normals (X-axis: cancer type and Y-axis: log2(norm_counts+1)) (TCGA IlluminaHiSeq_RNASeqV2, pan-cancer normalized log2(norm_counts+1) data, version 2016-08-16) |
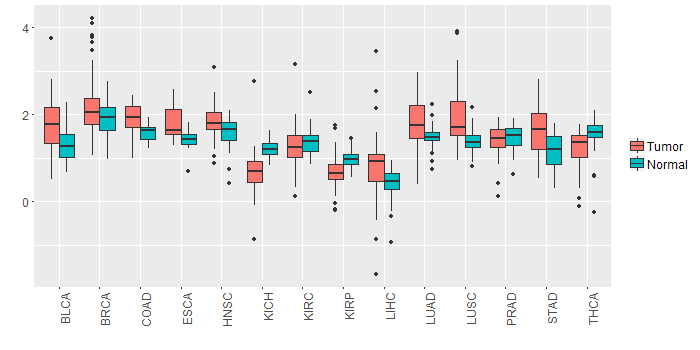 |
| - Significantly differentially expressed cancer types and information. (|Fold change|>1 and FDR<0.05) |
| Cancer type | Mean(exp) in tumor | Mean(exp) in matched normal | Log2FC | P-val. | FDR |
| Top |
| TissGene-miRNA for USP1 |
| Significantly anti-correlated miRNAs of TissGene across 28 cancer types (Gene-miRNA relations from TargetScanHuman Relsease 7.1, Conserved_Site_Context_Scores.txt.zip, 06.01.2016) (TCGA IlluminaHiSeq_miRNASeq, log2(RPM+1) data, version 2016-11-21) (TCGA IlluminaHiSeq_RNASeqV2, log2(normalized_count+1) data, version 2016-08-16) (Spearman’s Rank Correlation (p-value<0.05 and coefficient<-0.25)) |
| Cancer type | miRNA id | miRNA accession | P-val. | Coeff. | # samples |
| LUAD | hsa-miR-215-5p | MIMAT0000272 | 0.0096 | -0.33 | 60 |
| Top |
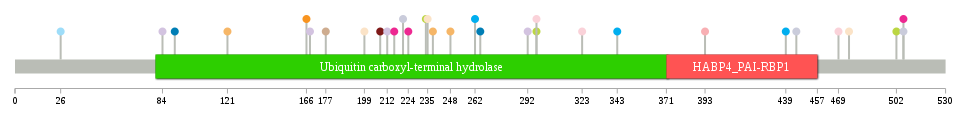
| TissGeneMut for USP1 |
| TissGeneSNV for USP1 |
| nsSNV counts per each loci. Different colors of circles represent different cancer types. Circle size denotes number of samples. (TCGA somatic mutation (SNPs and small INDELs) data, version 2016-04-25) * Click on the image to enlarge it in a new window. |
 |
 |
| Somatic nucleotide variants of TissGene across 28 cancer types (X-axis: cancer type and Y-axis: % of mutated samples) The numbers in parentheses are numbers of samples with mutation (nsSNVs). (TCGA somatic mutation (SNPs and small INDELs) data, version 2016-04-25) |
 |
| - nsSNVs sorted by frequency. |
| AAchange | Cancer type | # samples |
| p.N725T | UCEC | 1 |
| p.H238D | CESC | 1 |
| p.R439C | STAD | 1 |
| p.Q454* | HNSC | 1 |
| p.S323C | BLCA | 1 |
| p.L627F | BRCA | 1 |
| p.C506R | LIHC | 1 |
| p.E168G | LUAD | 1 |
| p.S445G | LIHC | 1 |
| p.E744D | BLCA | 1 |
| p.M618I | LUSC | 1 |
| p.N166K | UCS | 1 |
| p.S335L | HNSC | 1 |
| p.Y91C | ESCA | 1 |
| p.G393R | KIRC | 1 |
| p.E234K | SKCM | 1 |
| p.Q216* | BRCA | 1 |
| p.D199A | UCEC | 1 |
| p.Q617* | SKCM | 1 |
| p.S292* | LUAD | 1 |
| p.A676T | COAD | 1 |
| p.S766F | BLCA | 1 |
| p.N84D | LUAD | 1 |
| p.E221K | LIHC | 1 |
| p.E262D | STAD | 1 |
| p.K623Q | LIHC | 1 |
| p.G667A | LUAD | 1 |
| p.S248I | CESC | 1 |
| p.L208F | PRAD | 1 |
| p.E742G | COAD | 1 |
| p.F39L | HNSC | 1 |
| p.K224E | BRCA | 1 |
| p.K343T | STAD | 1 |
| p.F542V | READ | 1 |
| p.P777L | CESC | 1 |
| p.S475Y | UCEC | 1 |
| p.E607G | UCEC | 1 |
| p.D502N | SKCM | 1 |
| p.D543N | LUAD | 1 |
| p.E469Q | BLCA | 1 |
| p.K26T | COAD | 1 |
| p.E235* | UCEC | 1 |
| p.E625K | LGG | 1 |
| p.Q297H | SKCM | 1 |
| p.Q297H | BLCA | 1 |
| p.C506S | BRCA | 1 |
| p.N612S | HNSC | 1 |
| p.Q212E | LUAD | 1 |
| p.E121K | CESC | 1 |
| p.P265L | ESCA | 1 |
| p.N765K | TGCT | 1 |
| p.S605C | LUAD | 1 |
| p.S734L | HNSC | 1 |
| p.S575R | OV | 1 |
| p.K30N | READ | 1 |
| p.Q177H | THYM | 1 |
| p.K673T | COAD | 1 |
| Top |
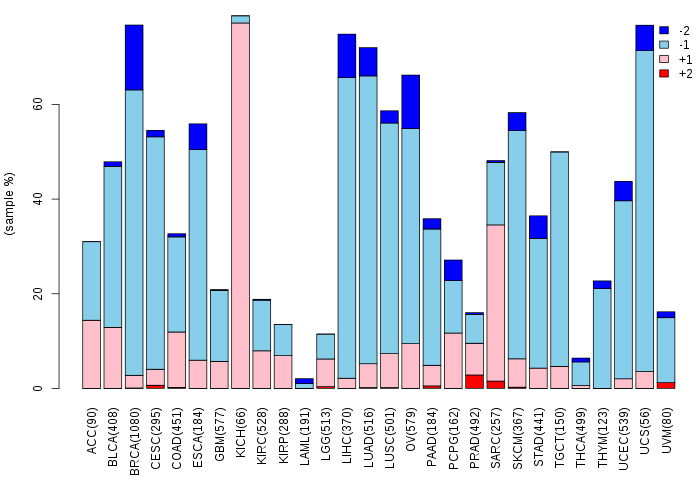
| TissGeneCNV for USP1 |
| Copy number variations of TissGene across 28 cancer types (X-axis: cancer type and Y-axis: % of CNV samples) (TCGA Gistic2_CopyNumber_Gistic2_all_data_by_genes, Gistic2 copy number data, version 2016-08-16) |
 |
| Top |
| TissGeneFusions for USP1 |
| Fusion genes including TissGene (ChimerDB 3.0, 2016-12-01 and TCGA fusion Portal 2015-12-01) |
| Database | Src | Cancer type | Sample | Fusion gene | ORF | 5'-gene BP | 3'-gene BP |
| Chimerdb3.0 | ChiTaRs | NA | BG291031 | USP1-USP1 | chr1:62916702 | chr1:62917055 | |
| TCGAfusionPortal | PRADA | BRCA | TCGA-AR-A24S-01A | USP1-SGIP1 | Out-of-frame | Chr1:62914337 | Chr1:67091530 |
| TCGAfusionPortal | PRADA | PRAD | TCGA-J9-A8CK-01A | USP1-EFCAB7 | 5UTR-CDS | Chr1:62903071 | Chr1:64027380 |
| Top |
| TissGeneNet for USP1 |
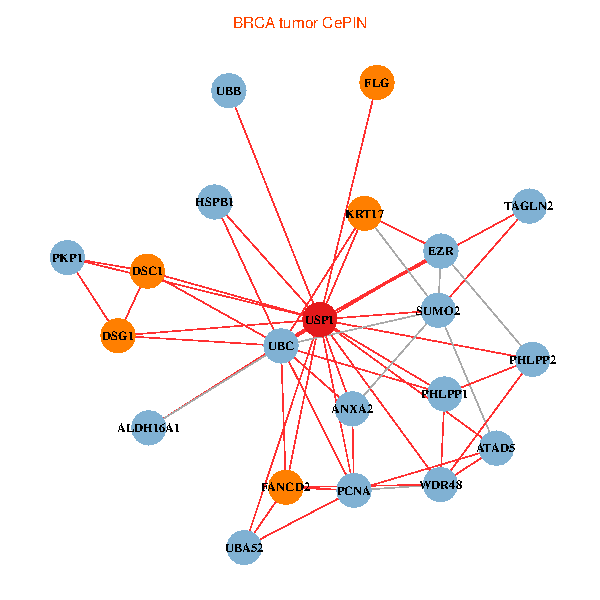
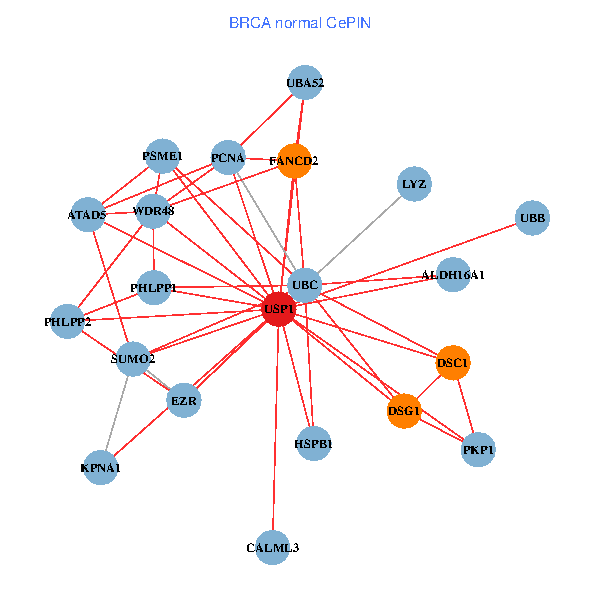
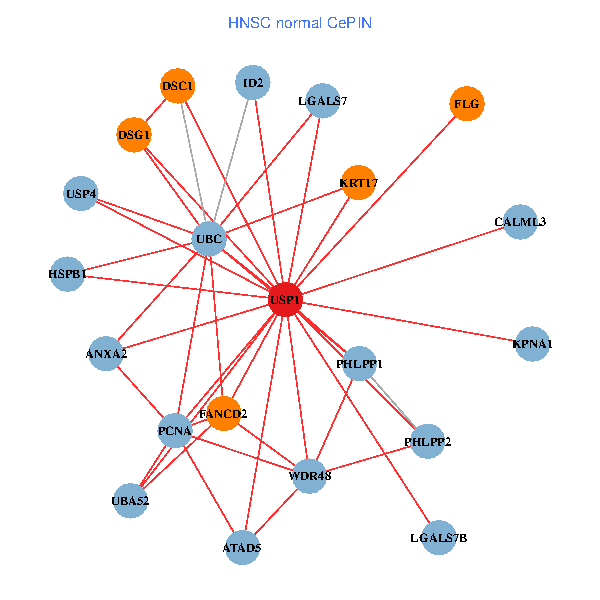
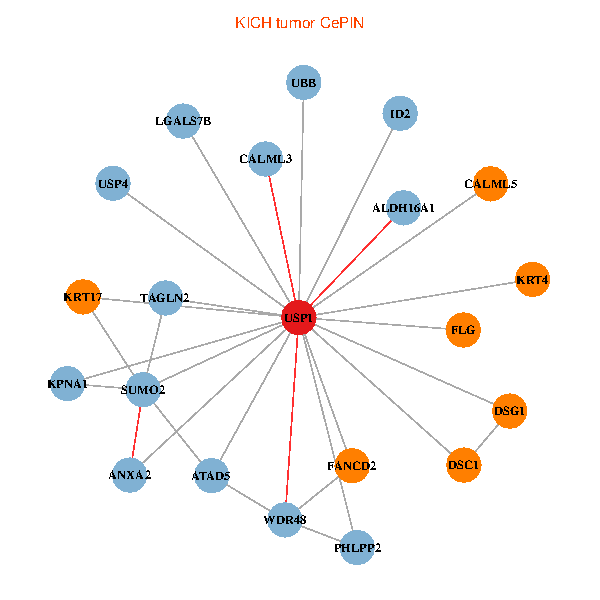
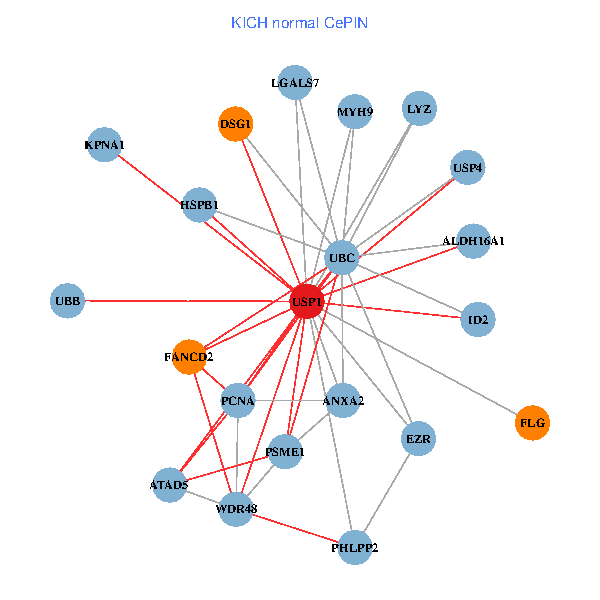
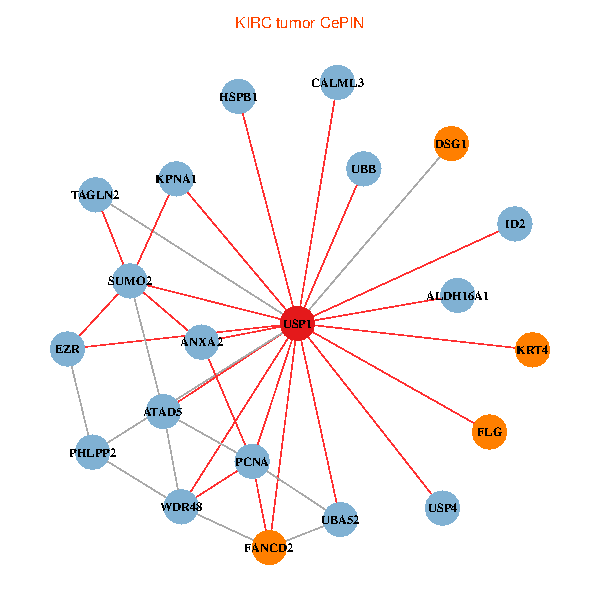
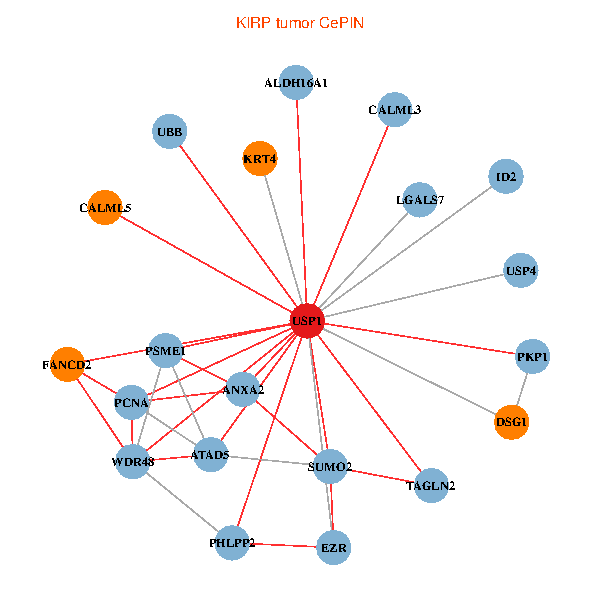
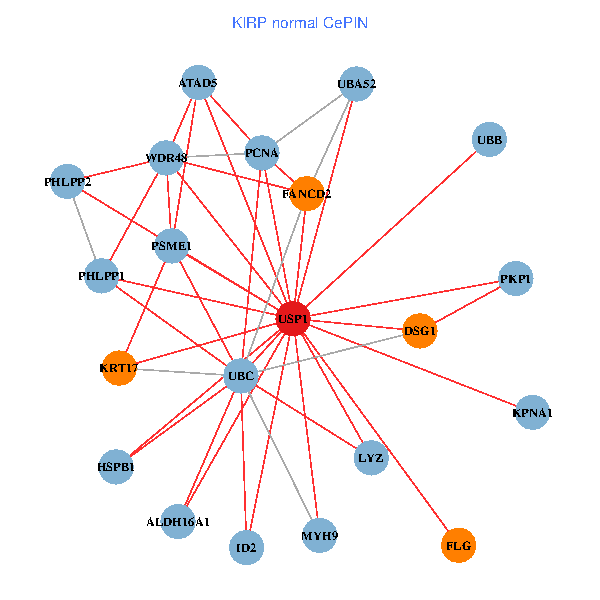
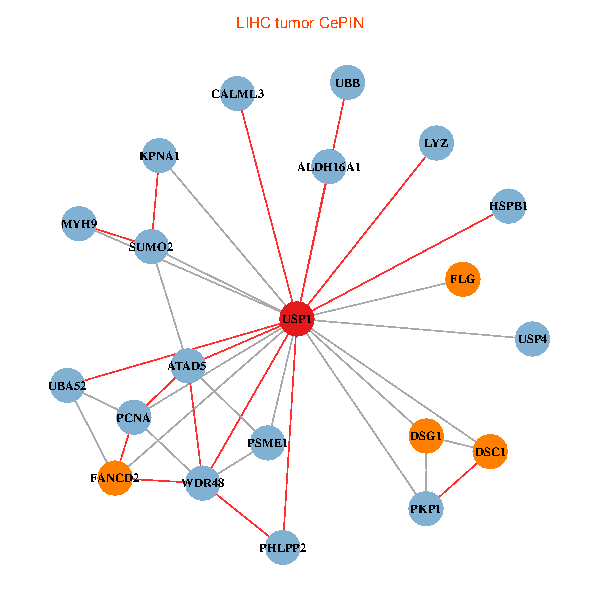
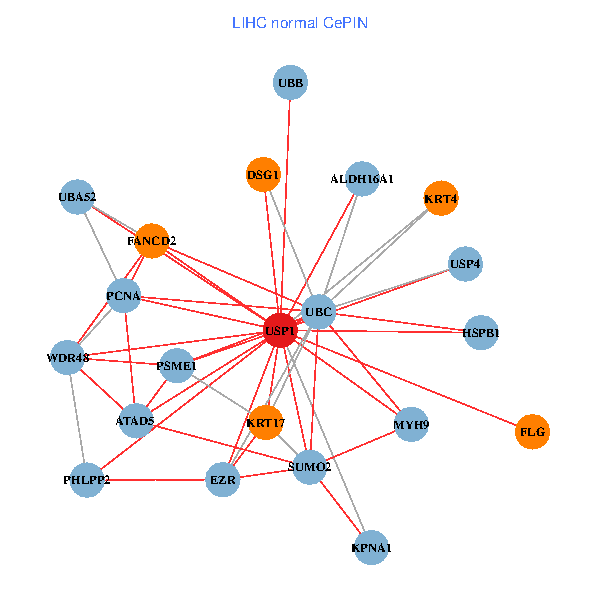
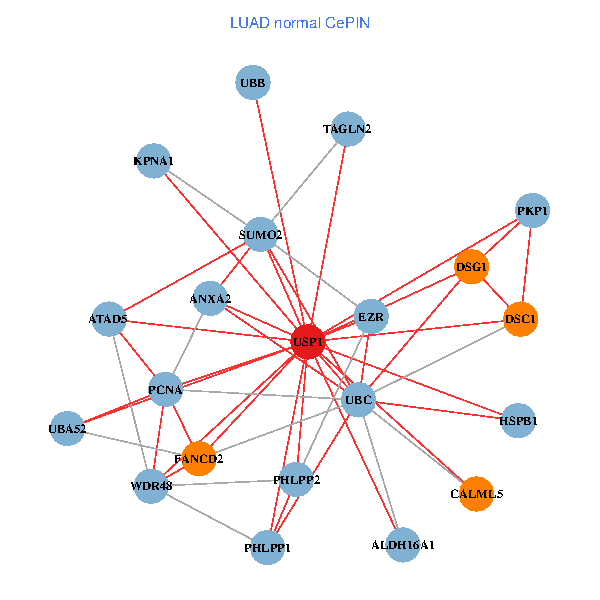
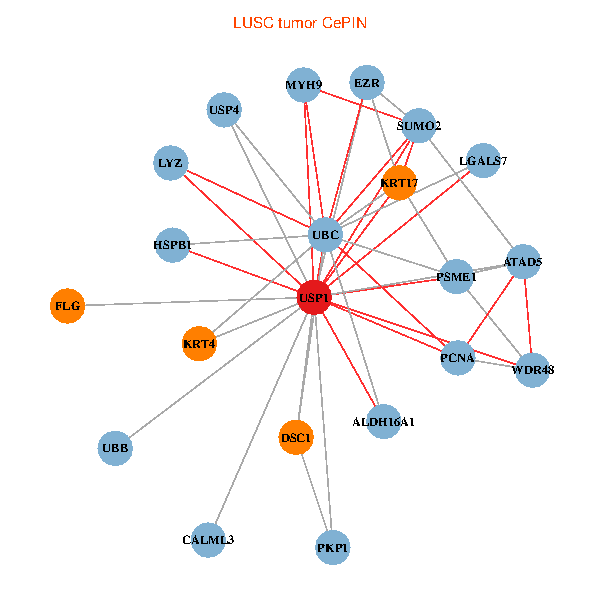
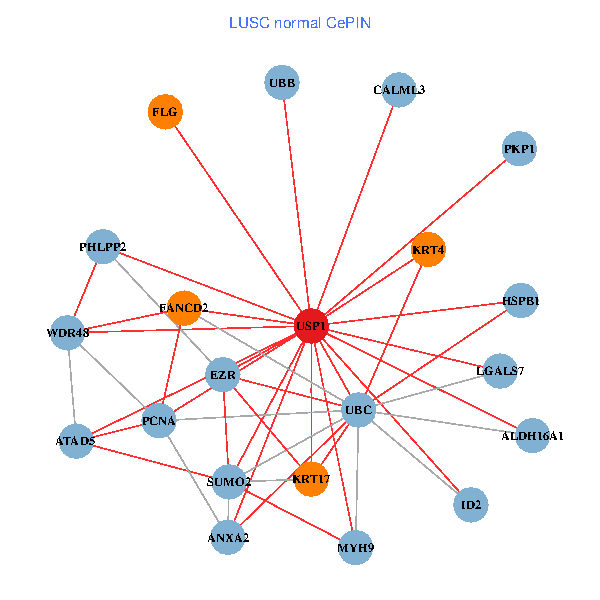
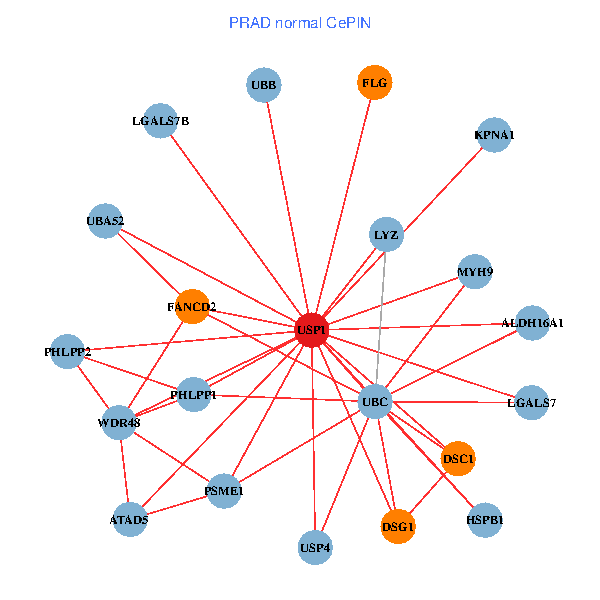
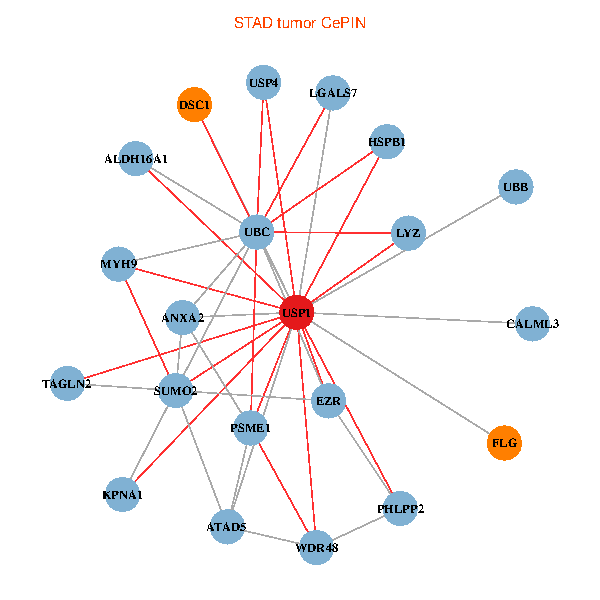
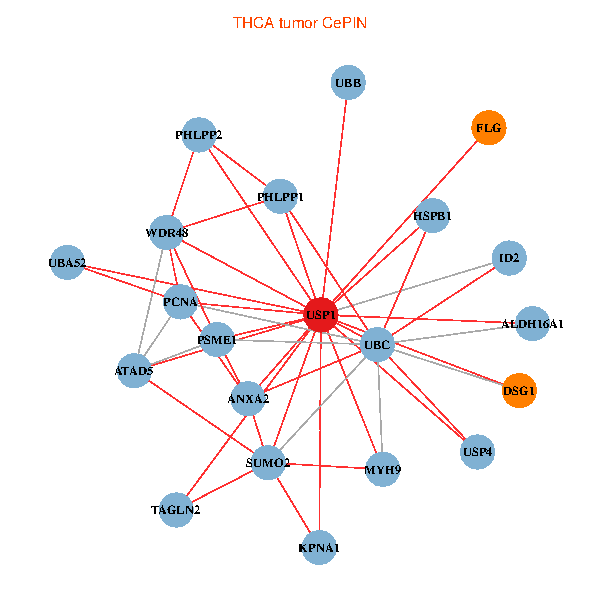
| Co-expressed gene networks based on protein-protein interaction data (CePIN) (TCGA IlluminaHiSeq_RNASeqV2, pan-cancer normalized log2(norm_counts+1) data, version 2016-08-16) (PINA2 ppi data) |
| BRCA (tumor) | BRCA (normal) |
| USP1, UBC, SUMO2, EZR, ANXA2, WDR48, KRT17, PCNA, UBA52, ATAD5, UBB, HSPB1, PHLPP1, DSC1, FANCD2, PHLPP2, DSG1, FLG, ALDH16A1, TAGLN2, PKP1 (tumor) | USP1, UBC, SUMO2, EZR, KPNA1, WDR48, PCNA, UBA52, LYZ, PSME1, ATAD5, UBB, HSPB1, PHLPP1, DSC1, FANCD2, PHLPP2, DSG1, ALDH16A1, PKP1, CALML3 (normal) |
 |  |
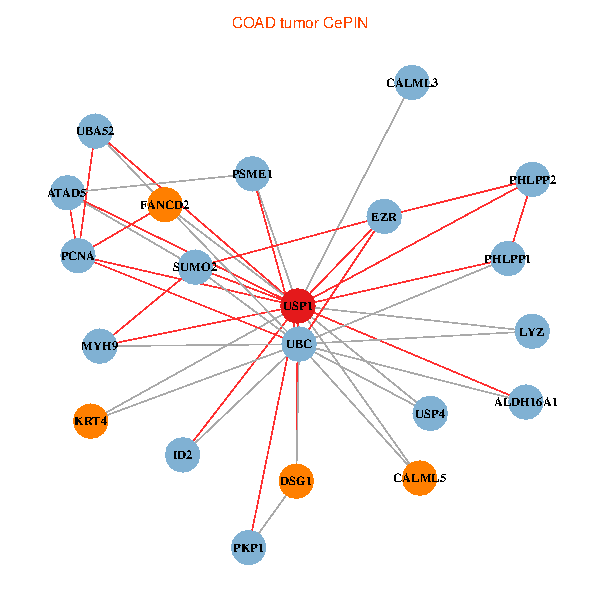
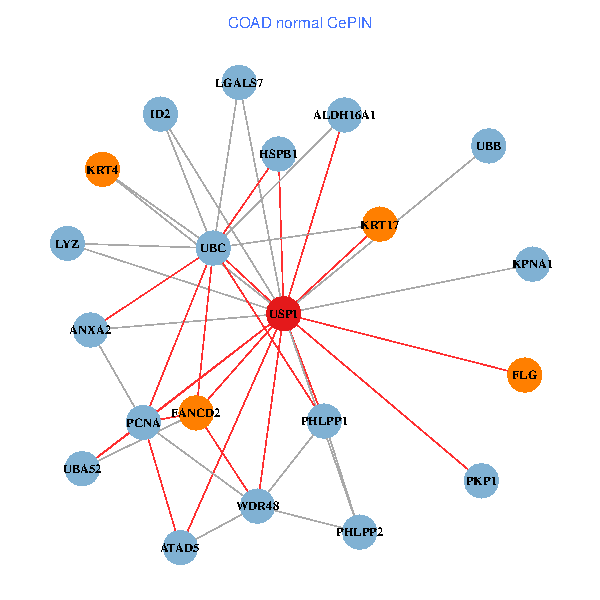
| COAD (tumor) | COAD (normal) |
| USP1, UBC, SUMO2, EZR, PCNA, MYH9, UBA52, ID2, LYZ, PSME1, ATAD5, USP4, PHLPP1, CALML5, KRT4, FANCD2, PHLPP2, DSG1, ALDH16A1, PKP1, CALML3 (tumor) | USP1, UBC, KPNA1, ANXA2, LGALS7, WDR48, KRT17, PCNA, UBA52, ID2, LYZ, ATAD5, UBB, HSPB1, PHLPP1, KRT4, FANCD2, PHLPP2, FLG, ALDH16A1, PKP1 (normal) |
 |  |
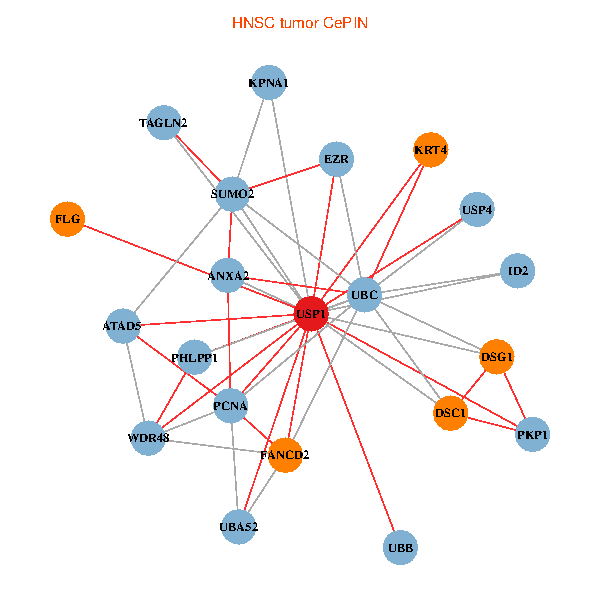
| HNSC (tumor) | HNSC (normal) |
| USP1, UBC, SUMO2, EZR, KPNA1, ANXA2, WDR48, PCNA, UBA52, ID2, ATAD5, USP4, UBB, PHLPP1, DSC1, KRT4, FANCD2, DSG1, FLG, TAGLN2, PKP1 (tumor) | USP1, UBC, KPNA1, ANXA2, LGALS7, WDR48, KRT17, PCNA, UBA52, ID2, ATAD5, USP4, HSPB1, PHLPP1, DSC1, FANCD2, PHLPP2, DSG1, FLG, LGALS7B, CALML3 (normal) |
 |  |
| KICH (tumor) | KICH (normal) |
| USP1, SUMO2, KPNA1, ANXA2, WDR48, KRT17, ID2, ATAD5, USP4, UBB, DSC1, CALML5, KRT4, FANCD2, PHLPP2, DSG1, FLG, ALDH16A1, TAGLN2, LGALS7B, CALML3 (tumor) | USP1, UBC, EZR, KPNA1, ANXA2, LGALS7, WDR48, PCNA, MYH9, ID2, LYZ, PSME1, ATAD5, USP4, UBB, HSPB1, FANCD2, PHLPP2, DSG1, FLG, ALDH16A1 (normal) |
 |  |
| KIRC (tumor) | KIRC (normal) |
| USP1, SUMO2, EZR, KPNA1, ANXA2, WDR48, PCNA, UBA52, ID2, ATAD5, USP4, UBB, HSPB1, KRT4, FANCD2, PHLPP2, DSG1, FLG, ALDH16A1, TAGLN2, CALML3 (tumor) | USP1, UBC, KPNA1, ANXA2, LGALS7, WDR48, KRT17, PCNA, MYH9, UBA52, LYZ, PSME1, ATAD5, UBB, HSPB1, PHLPP1, PHLPP2, ALDH16A1, TAGLN2, LGALS7B, CALML3 (normal) |
 |  |
| KIRP (tumor) | KIRP (normal) |
| USP1, SUMO2, EZR, ANXA2, LGALS7, WDR48, PCNA, ID2, PSME1, ATAD5, USP4, UBB, CALML5, KRT4, FANCD2, PHLPP2, DSG1, ALDH16A1, TAGLN2, PKP1, CALML3 (tumor) | USP1, UBC, KPNA1, WDR48, KRT17, PCNA, MYH9, UBA52, ID2, LYZ, PSME1, ATAD5, UBB, HSPB1, PHLPP1, FANCD2, PHLPP2, DSG1, FLG, ALDH16A1, PKP1 (normal) |
 |  |
| LIHC (tumor) | LIHC (normal) |
| USP1, SUMO2, KPNA1, WDR48, PCNA, MYH9, UBA52, LYZ, PSME1, ATAD5, USP4, UBB, HSPB1, DSC1, FANCD2, PHLPP2, DSG1, FLG, ALDH16A1, PKP1, CALML3 (tumor) | USP1, UBC, SUMO2, EZR, KPNA1, WDR48, KRT17, PCNA, MYH9, UBA52, PSME1, ATAD5, USP4, UBB, HSPB1, KRT4, FANCD2, PHLPP2, DSG1, FLG, ALDH16A1 (normal) |
 |  |
| LUAD (tumor) | LUAD (normal) |
| USP1, UBC, SUMO2, KPNA1, ANXA2, LGALS7, WDR48, PCNA, MYH9, ID2, PSME1, ATAD5, USP4, UBB, HSPB1, KRT4, FANCD2, FLG, ALDH16A1, LGALS7B, PKP1 (tumor) | USP1, UBC, SUMO2, EZR, KPNA1, ANXA2, WDR48, PCNA, UBA52, ATAD5, UBB, HSPB1, PHLPP1, DSC1, CALML5, FANCD2, PHLPP2, DSG1, ALDH16A1, TAGLN2, PKP1 (normal) |
 |  |
| LUSC (tumor) | LUSC (normal) |
| USP1, UBC, SUMO2, EZR, LGALS7, WDR48, KRT17, PCNA, MYH9, LYZ, PSME1, ATAD5, USP4, UBB, HSPB1, DSC1, KRT4, FLG, ALDH16A1, PKP1, CALML3 (tumor) | USP1, UBC, SUMO2, EZR, ANXA2, LGALS7, WDR48, KRT17, PCNA, MYH9, ID2, ATAD5, UBB, HSPB1, KRT4, FANCD2, PHLPP2, FLG, ALDH16A1, PKP1, CALML3 (normal) |
 |  |
| PRAD (tumor) | PRAD (normal) |
| USP1, UBC, SUMO2, EZR, KPNA1, WDR48, KRT17, MYH9, UBA52, LYZ, ATAD5, USP4, HSPB1, DSC1, KRT4, FANCD2, PHLPP2, DSG1, FLG, ALDH16A1, TAGLN2 (tumor) | USP1, UBC, KPNA1, LGALS7, WDR48, MYH9, UBA52, LYZ, PSME1, ATAD5, USP4, UBB, HSPB1, PHLPP1, DSC1, FANCD2, PHLPP2, DSG1, FLG, ALDH16A1, LGALS7B (normal) |
 |  |
| STAD (tumor) | STAD (normal) |
| USP1, UBC, SUMO2, EZR, KPNA1, ANXA2, LGALS7, WDR48, MYH9, LYZ, PSME1, ATAD5, USP4, UBB, HSPB1, DSC1, PHLPP2, FLG, ALDH16A1, TAGLN2, CALML3 (tumor) | USP1, UBC, SUMO2, EZR, KPNA1, LGALS7, WDR48, PCNA, MYH9, UBA52, LYZ, ATAD5, USP4, UBB, HSPB1, PHLPP1, FANCD2, PHLPP2, ALDH16A1, TAGLN2, PKP1 (normal) |
 |  |
| THCA (tumor) | THCA (normal) |
| USP1, UBC, SUMO2, KPNA1, ANXA2, WDR48, PCNA, MYH9, UBA52, ID2, PSME1, ATAD5, USP4, UBB, HSPB1, PHLPP1, PHLPP2, DSG1, FLG, ALDH16A1, TAGLN2 (tumor) | USP1, UBC, SUMO2, KPNA1, LGALS7, WDR48, MYH9, UBA52, LYZ, PSME1, ATAD5, USP4, UBB, HSPB1, DSC1, FANCD2, PHLPP2, FLG, ALDH16A1, LGALS7B, PKP1 (normal) |
 |  |
| Top |
| TissGeneProg for USP1 |
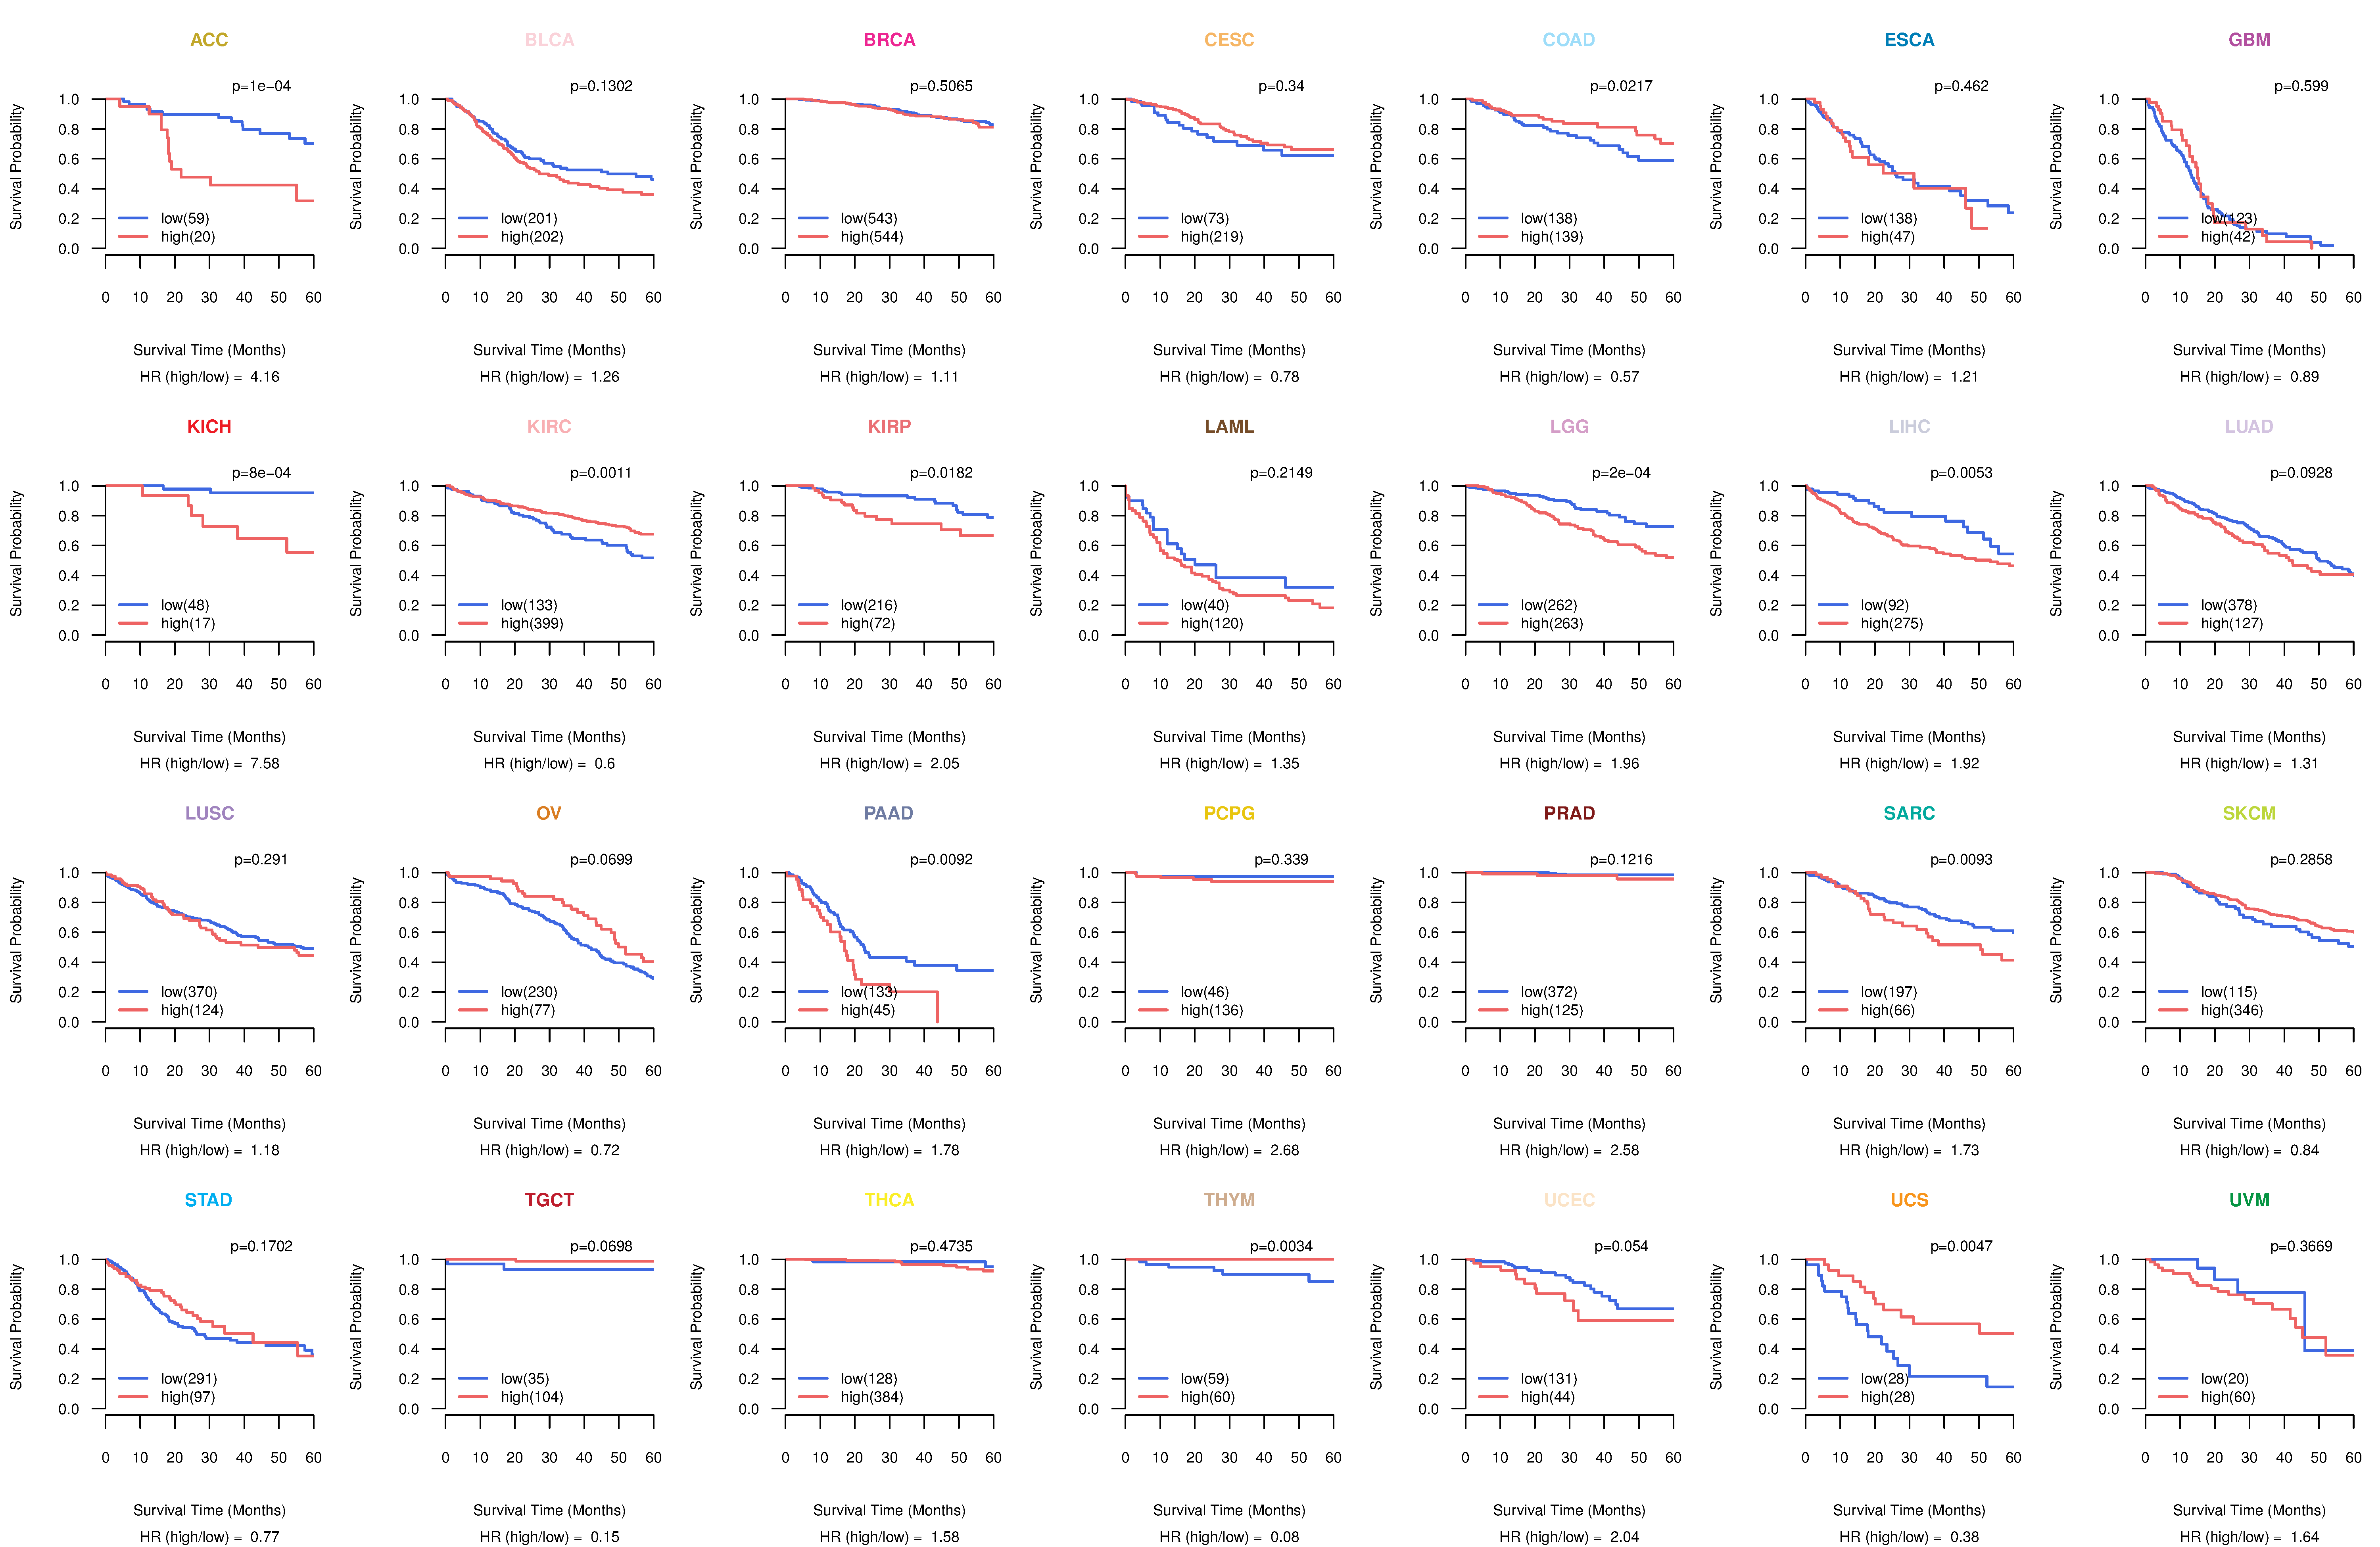
| Kaplan-Meier plots with logrank tests of overall survival (OS) using 28 cancer types (TCGA IlluminaHiSeq_RNASeqV2, pan-cancer normalized log2(norm_counts+1) data, version 2016-08-16) (TCGA clinicalMatrix, phenotype data, version 2016-04-27) * Click on the image to enlarge it in a new window. |
 |
| Kaplan-Meier plots with logrank test of relapse free survival (RFS) using 28 cancer types (TCGA IlluminaHiSeq_RNASeqV2, pan-cancer normalized log2(norm_counts+1) data, version 2016-08-16) (TCGA clinicalMatrix, phenotype data, version 2016-04-27) * Click on the image enlarge it in a new window. |
 |
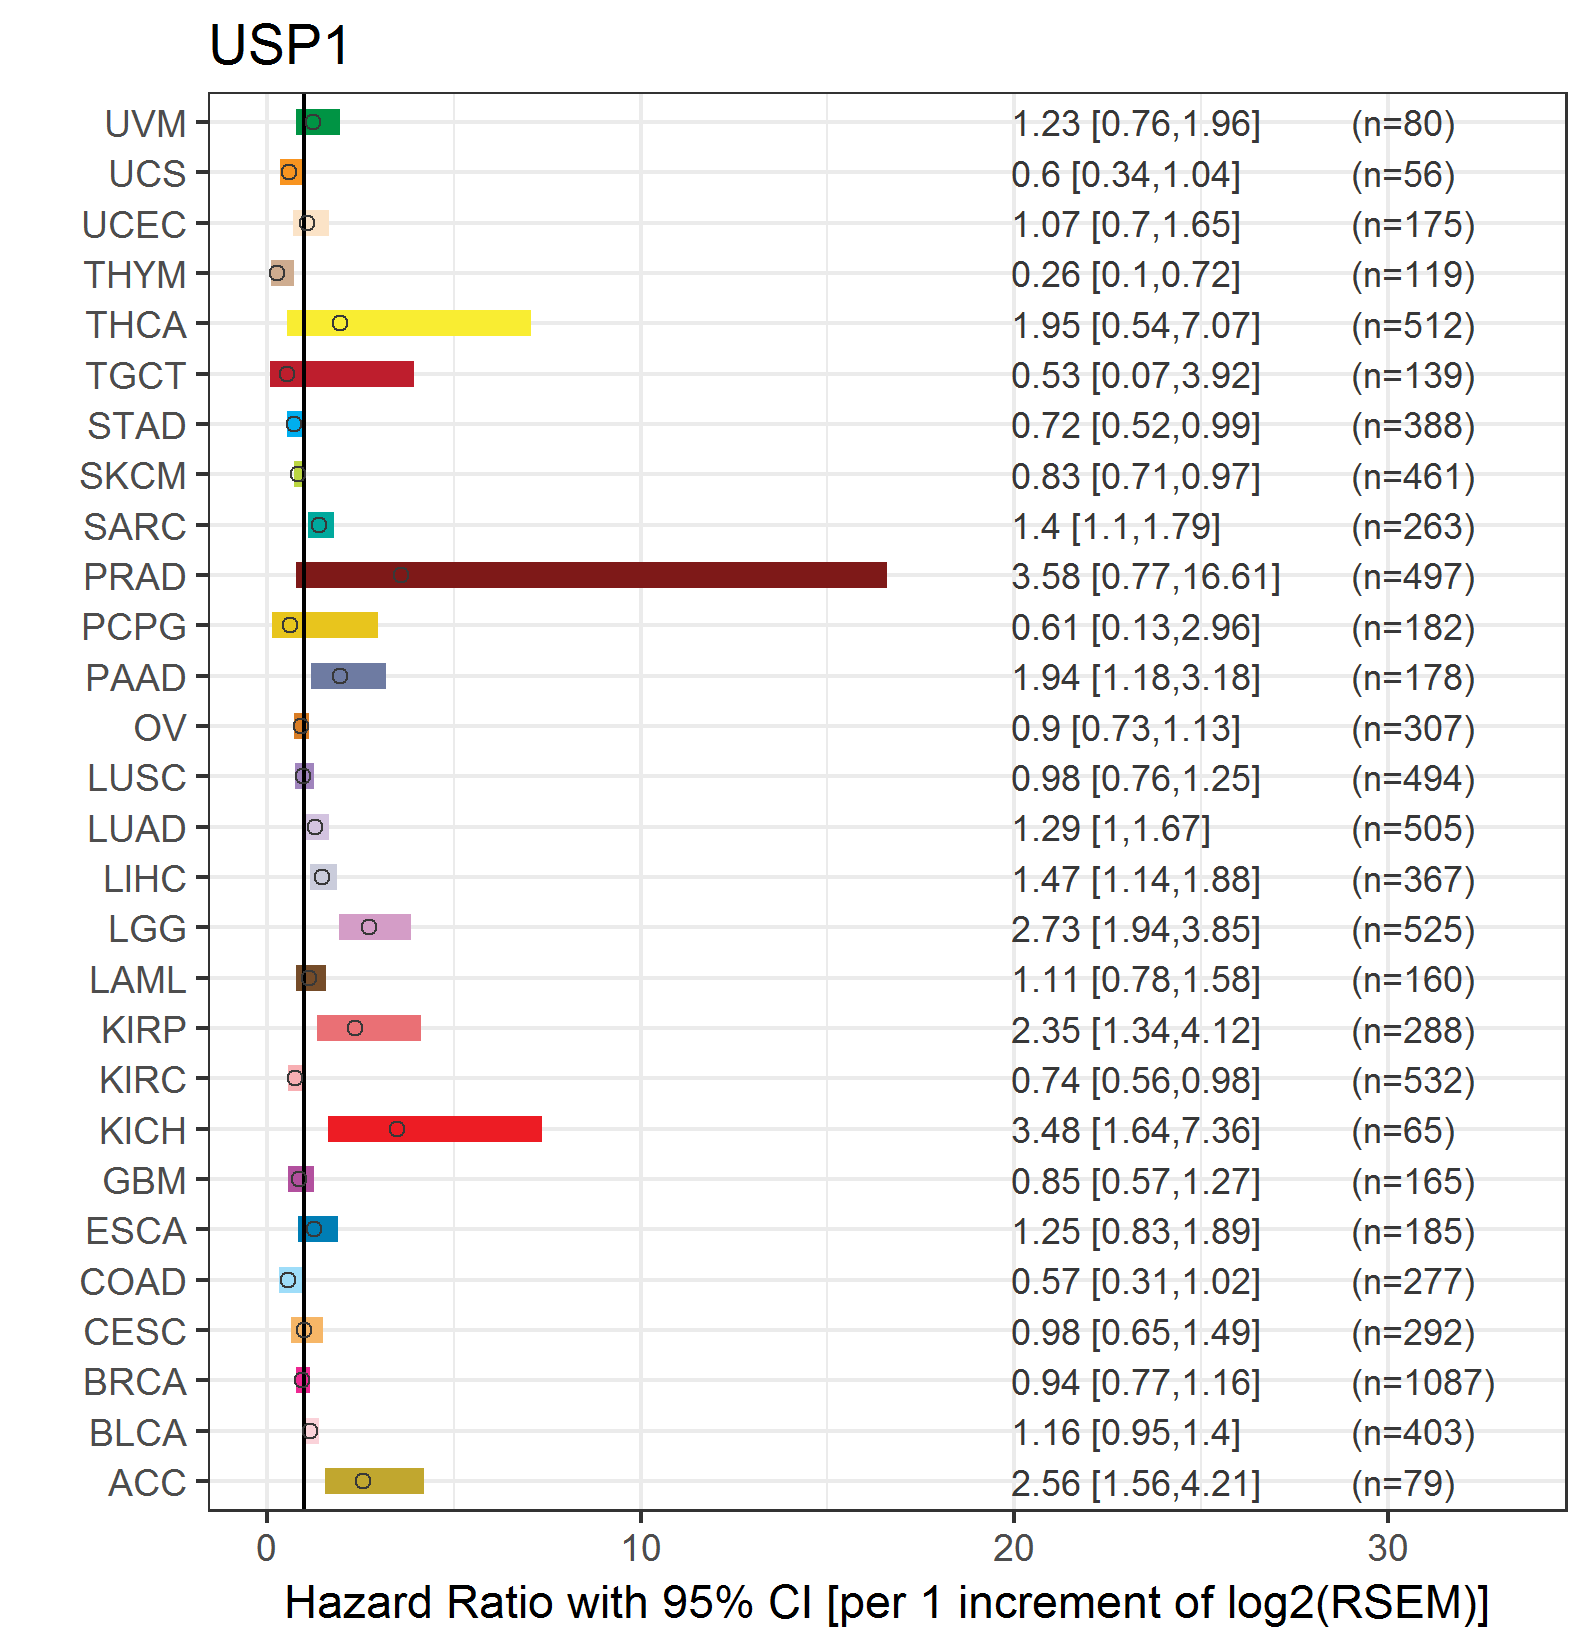
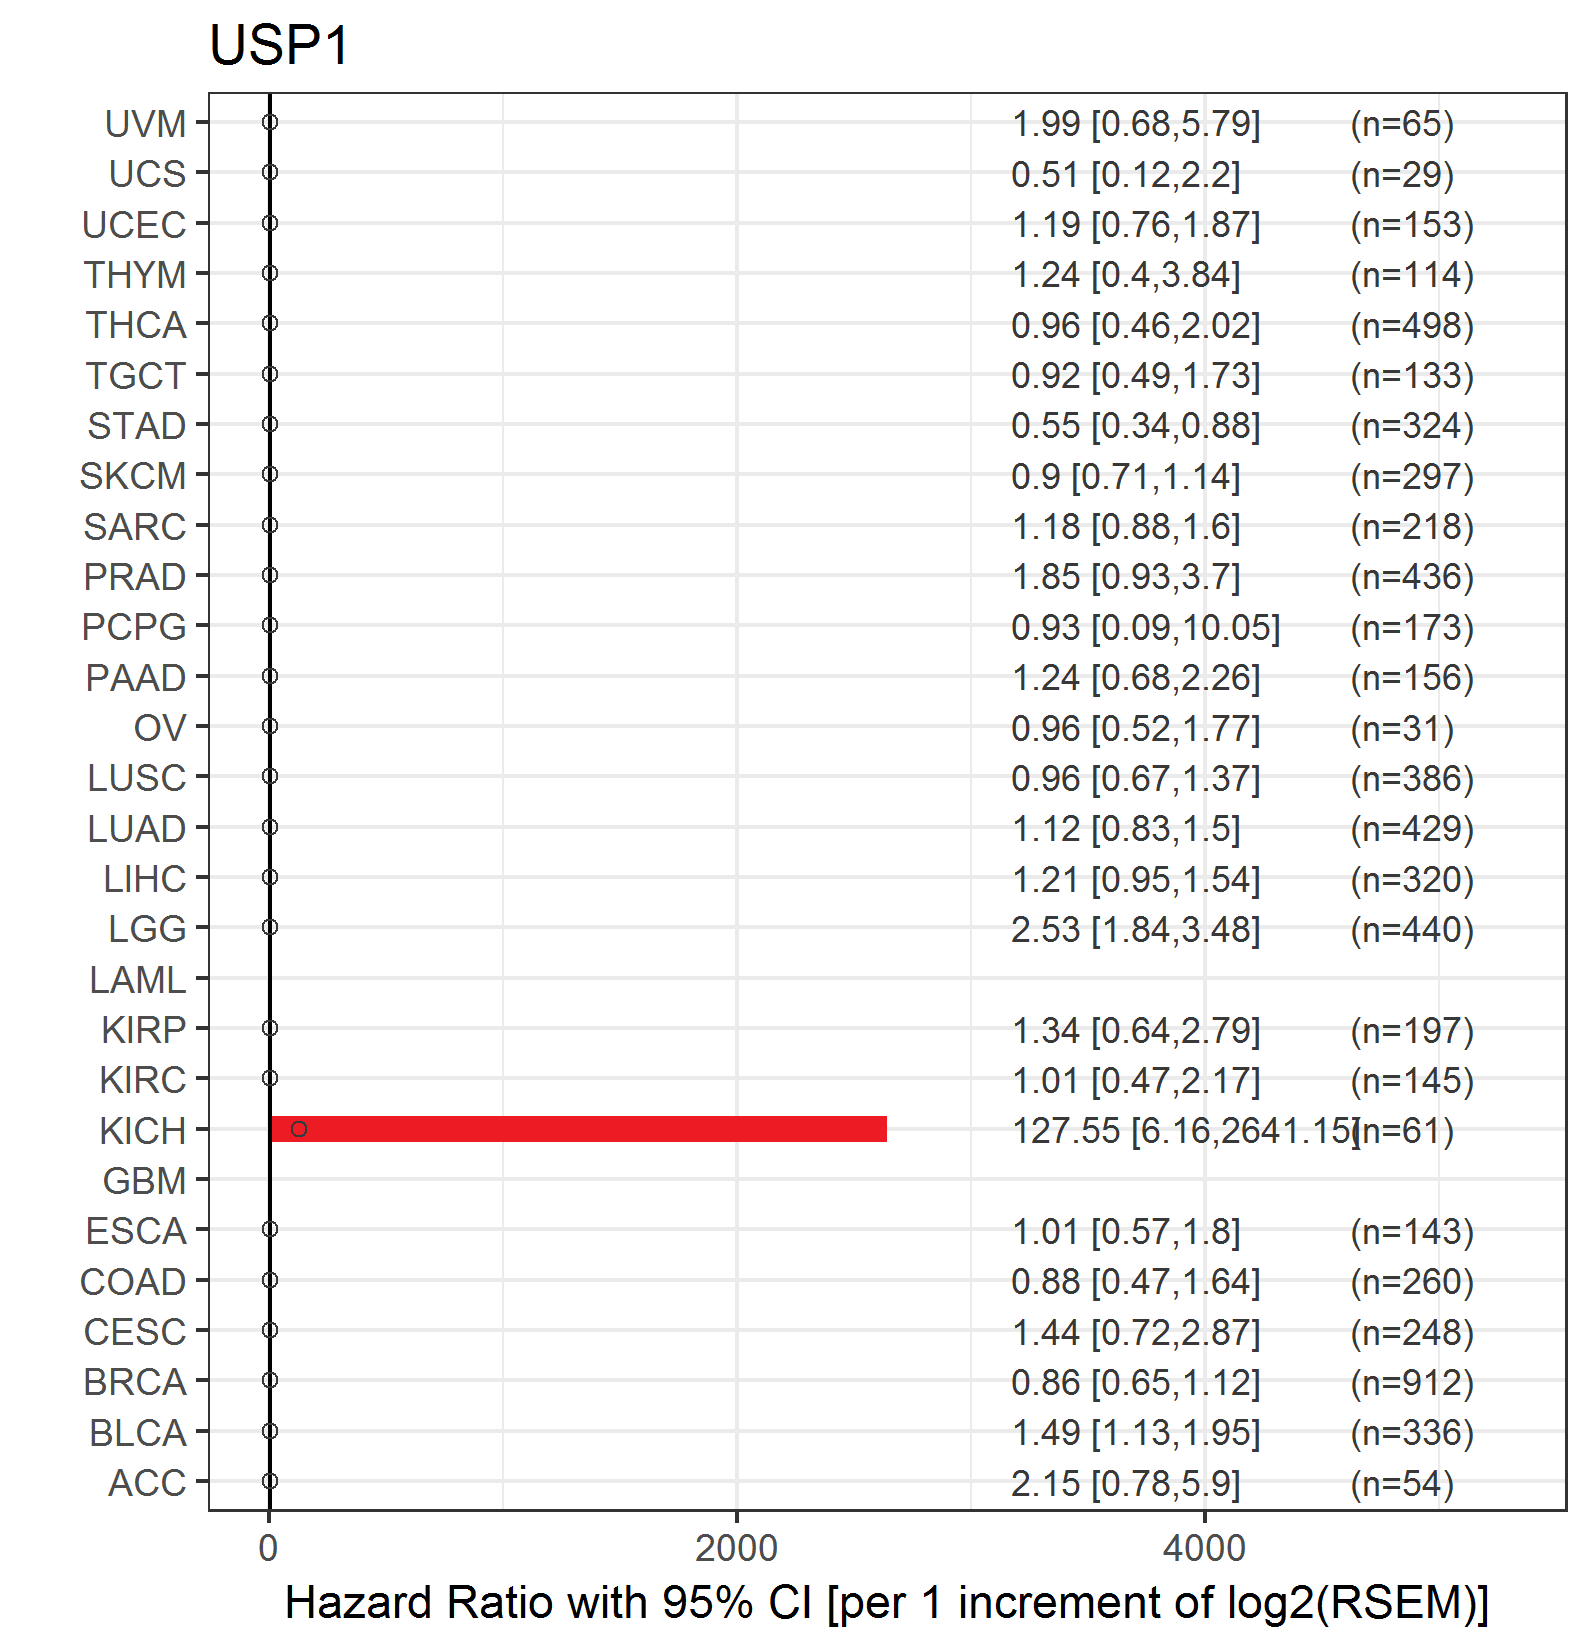
| Forest plot of Cox proportional hazard ratio (HR) and 95% CI of overall survival (OS) using 28 cancer types (TCGA IlluminaHiSeq_RNASeqV2, pan-cancer normalized log2(norm_counts+1) data, version 2016-08-16) (TCGA clinicalMatrix, phenotype data, version 2016-04-27) * Click on the image enlarge it in a new window. |
 |
| Forest plot of Cox proportional hazard ratio (HR) and 95% CI of relapse free survival (RFS) using 28 cancer types (TCGA IlluminaHiSeq_RNASeqV2, pan-cancer normalized log2(norm_counts+1) data, version 2016-08-16) (TCGA clinicalMatrix, phenotype data, version 2016-04-27) * Click on the image enlarge it in a new window. |
 |
| Top |
| TissGeneClin for USP1 |
| TissGeneDrug for USP1 |
| Drug information targeting TissGene (DrugBank Version 5.0.6, 2017-04-01) |
| DrugBank ID | Drug name | Drug activity | Drug type | Drug status |
| Top |
| TissGeneDisease for USP1 |
| Disease information associated with TissGene (DisGeNet, 2016-06-01) |
| Disease ID | Disease name | # pubmeds | Source |
| umls:C0015625 | Fanconi Anemia | 5 | BeFree,LHGDN |
| umls:C3469521 | FANCONI ANEMIA, COMPLEMENTATION GROUP A (disorder) | 5 | BeFree |
| umls:C0006142 | Malignant neoplasm of breast | 1 | GAD |
| umls:C0007131 | Non-Small Cell Lung Carcinoma | 1 | BeFree |
| umls:C0007134 | Renal Cell Carcinoma | 1 | BeFree |
| umls:C0008626 | Congenital chromosomal disease | 1 | BeFree |
| umls:C0009402 | Colorectal Carcinoma | 1 | BeFree |
| umls:C0023418 | leukemia | 1 | BeFree |
| umls:C0030567 | Parkinson Disease | 1 | BeFree |
| umls:C0037286 | Skin Neoplasms | 1 | BeFree |
| umls:C0242379 | Malignant neoplasm of lung | 1 | BeFree |
| umls:C0376358 | Malignant neoplasm of prostate | 1 | BeFree |
| umls:C0600139 | Prostate carcinoma | 1 | BeFree |
| umls:C0678213 | Complete hydatidiform mole | 1 | BeFree |
| umls:C0684249 | Carcinoma of lung | 1 | BeFree |
| umls:C0751688 | Malignant Squamous Cell Neoplasm | 1 | BeFree |
| umls:C1527249 | Colorectal Cancer | 1 | BeFree |
|
Copyright 2016-Present - The University of Texas Health Science Center at Houston (UTHealth) Web File Viewing | How to Report, Fraud, Waste and Abuse | State of Texas | Statewide Search | Texas Homeland Security | Site Policies |