 |
| |
| |
| |
| |
| |
| |
|

| TissGeneSummary for ZFY |
 Gene summary Gene summary |
| Basic gene information | Gene symbol | ZFY |
| Gene name | zinc finger protein, Y-linked | |
| Synonyms | ZNF911 | |
| Cytomap | UCSC genome browser: Yp11.3 | |
| Type of gene | protein-coding | |
| RefGenes | NM_001145275.1, NM_001145276.1,NM_003411.3, | |
| Description | zinc finger Y-chromosomal protein | |
| Modification date | 20141207 | |
| dbXrefs | MIM : 490000 | |
| HGNC : HGNC | ||
| Ensembl : ENSG00000067646 | ||
| HPRD : 02466 | ||
| Vega : OTTHUMG00000036159 | ||
| Protein | UniProt: go to UniProt's Cross Reference DB Table | |
| Expression | CleanEX: HS_ZFY | |
| BioGPS: 7544 | ||
| Pathway | NCI Pathway Interaction Database: ZFY | |
| KEGG: ZFY | ||
| REACTOME: ZFY | ||
| Pathway Commons: ZFY | ||
| Context | iHOP: ZFY | |
| ligand binding site mutation search in PubMed: ZFY | ||
| UCL Cancer Institute: ZFY | ||
| Assigned class in TissGDB* | C | |
| Included tissue-specific gene expression resources | TiGER,GTEx | |
| Specific-tissues in normal samples (assigned by TissGDB using HPA, TiGER, and GTEx) | KidneyTestis | |
| Cancer types related to the specific-tissues in cancer samples (assigned by TissGDB using TCGA) | KIRC,KIRP,KICHTGCT | |
| Reference showing the relevant tissue of ZFY | ||
| Description by TissGene annotations | ||
| * Class A consists of genes with literature evidence and is part of the cTissGenes. Class B consists of only cTissGenes without additional evidence. The remaining genes belong to Class C. |
| Gene ontology having evidence of Inferred from Direct Assay (IDA) from Entrez |
| GO ID | GO term | PubMed ID |
| Top |
| TissGeneExp for ZFY |
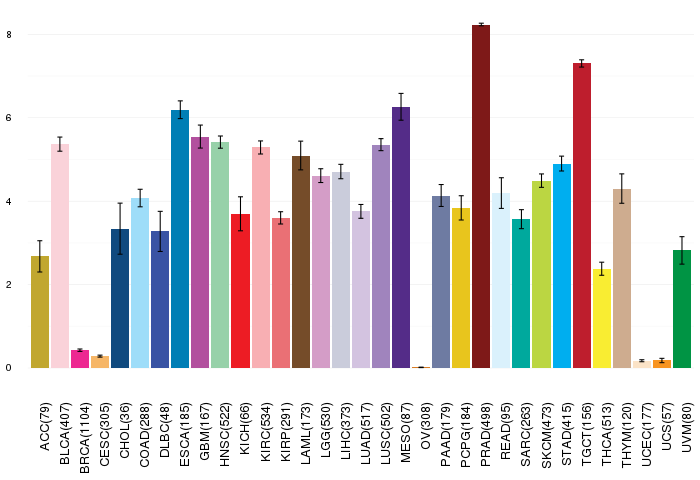
| Gene expressions across 28 cancer types (X-axis: cancer type and Y-axis: log2(norm_counts+1)) (TCGA IlluminaHiSeq_RNASeqV2, pan-cancer normalized log2(norm_counts+1) data, version 2016-08-16) |
 |
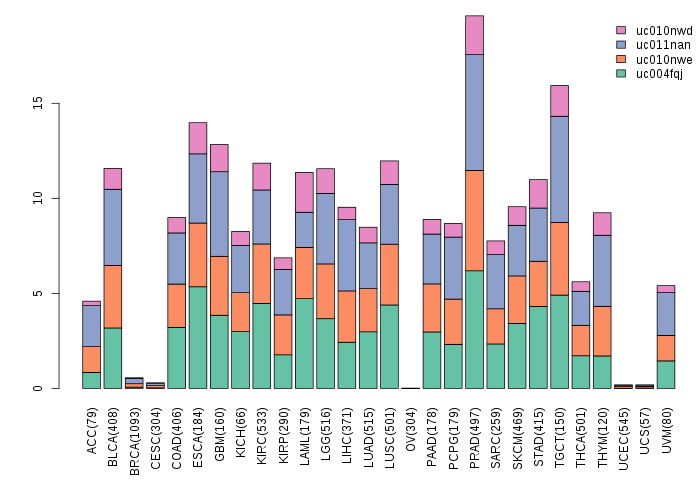
| Gene isoform expressions across 28 cancer types (X-axis: cancer type and Y-axis: log2(norm_counts+1)) (TCGA pan-cancer tcga_rsem_isoform_tpm, version 2016-09-01) |
 |
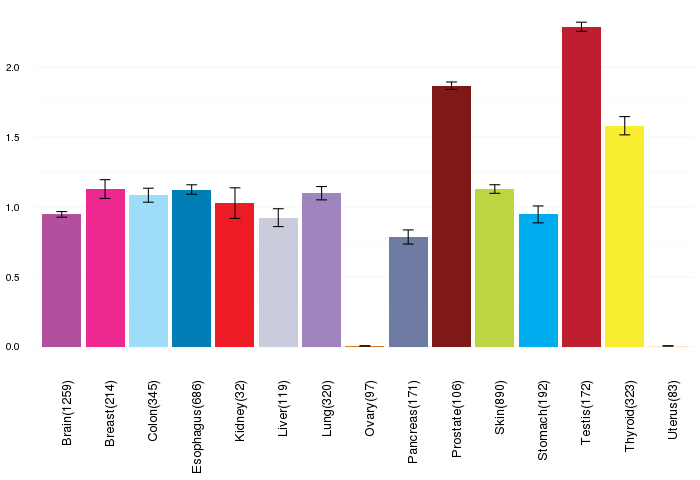
| Gene expressions across normal tissues of GTEx data (GTEx GTEx_Analysis_v6_RNA-seq_RNA-SeQCv1.1.8_gene_rpkm.gct) - Here, we shows the matched tissue types only among our 28 cancer types. |
 |
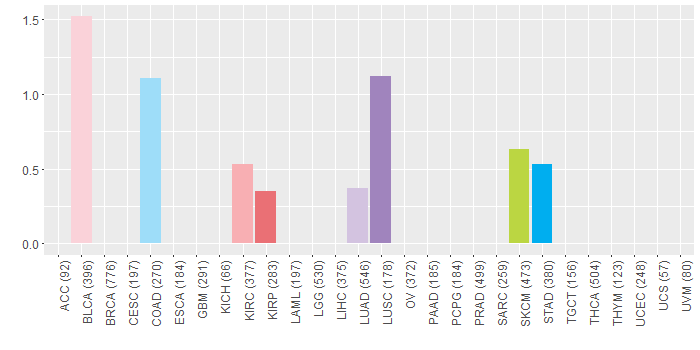
| Different expressions across 14 cancer types with more than 10 samples between matched tumors and normals (X-axis: cancer type and Y-axis: log2(norm_counts+1)) (TCGA IlluminaHiSeq_RNASeqV2, pan-cancer normalized log2(norm_counts+1) data, version 2016-08-16) |
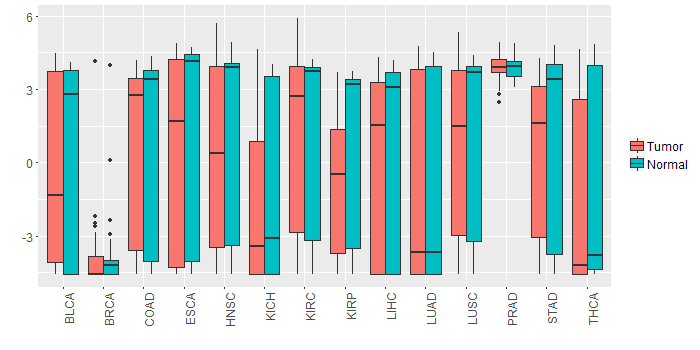 |
| - Significantly differentially expressed cancer types and information. (|Fold change|>1 and FDR<0.05) |
| Cancer type | Mean(exp) in tumor | Mean(exp) in matched normal | Log2FC | P-val. | FDR |
| KIRP | -0.812694781 | 1.083977094 | -1.896671875 | 0.0169 | 0.03495369 |
| Top |
| TissGene-miRNA for ZFY |
| Significantly anti-correlated miRNAs of TissGene across 28 cancer types (Gene-miRNA relations from TargetScanHuman Relsease 7.1, Conserved_Site_Context_Scores.txt.zip, 06.01.2016) (TCGA IlluminaHiSeq_miRNASeq, log2(RPM+1) data, version 2016-11-21) (TCGA IlluminaHiSeq_RNASeqV2, log2(normalized_count+1) data, version 2016-08-16) (Spearman’s Rank Correlation (p-value<0.05 and coefficient<-0.25)) |
| Cancer type | miRNA id | miRNA accession | P-val. | Coeff. | # samples |
| Top |
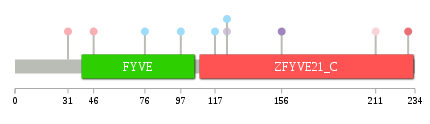
| TissGeneMut for ZFY |
| TissGeneSNV for ZFY |
| nsSNV counts per each loci. Different colors of circles represent different cancer types. Circle size denotes number of samples. (TCGA somatic mutation (SNPs and small INDELs) data, version 2016-04-25) * Click on the image to enlarge it in a new window. |
 |
 |
| Somatic nucleotide variants of TissGene across 28 cancer types (X-axis: cancer type and Y-axis: % of mutated samples) The numbers in parentheses are numbers of samples with mutation (nsSNVs). (TCGA somatic mutation (SNPs and small INDELs) data, version 2016-04-25) |
 |
| - nsSNVs sorted by frequency. |
| AAchange | Cancer type | # samples |
| p.H690N | BLCA | 1 |
| p.Q31X | KIRC | 1 |
| p.Q573* | SKCM | 1 |
| p.Q382X | SKCM | 1 |
| p.R703H | STAD | 1 |
| p.R97C | COAD | 1 |
| p.S641* | BLCA | 1 |
| p.V352L | BLCA | 1 |
| p.R370L | BLCA | 1 |
| p.I124T | COAD | 1 |
| p.R363Q | READ | 1 |
| p.E797* | STAD | 1 |
| p.Q303* | LUSC | 1 |
| p.I124F | LUAD | 1 |
| p.V46M | KIRC | 1 |
| p.H633P | LUAD | 1 |
| p.S156C | LUSC | 1 |
| p.A230P | KIRP | 1 |
| p.S557L | BLCA | 1 |
| p.I76V | COAD | 1 |
| p.S211L | BLCA | 1 |
| p.D117Y | COAD | 1 |
| p.R554* | SKCM | 1 |
| p.F493Y | SKCM | 1 |
| p.H142L | HNSC | 1 |
| Top |
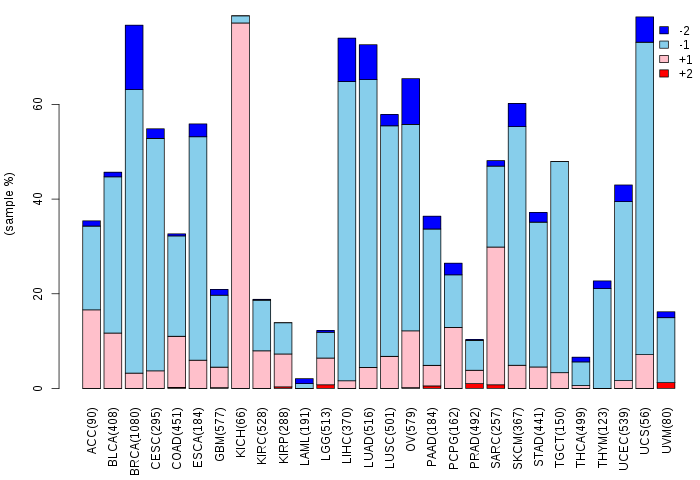
| TissGeneCNV for ZFY |
| Copy number variations of TissGene across 28 cancer types (X-axis: cancer type and Y-axis: % of CNV samples) (TCGA Gistic2_CopyNumber_Gistic2_all_data_by_genes, Gistic2 copy number data, version 2016-08-16) |
 |
| Top |
| TissGeneFusions for ZFY |
| Fusion genes including TissGene (ChimerDB 3.0, 2016-12-01 and TCGA fusion Portal 2015-12-01) |
| Database | Src | Cancer type | Sample | Fusion gene | ORF | 5'-gene BP | 3'-gene BP |
| Chimerdb3.0 | FusionScan | ESCA | TCGA-JY-A93D-01A | ZFY-HNRNPC | 5'UTR-5'UTR | chrY:2803487 | chr14:21702388 |
| Top |
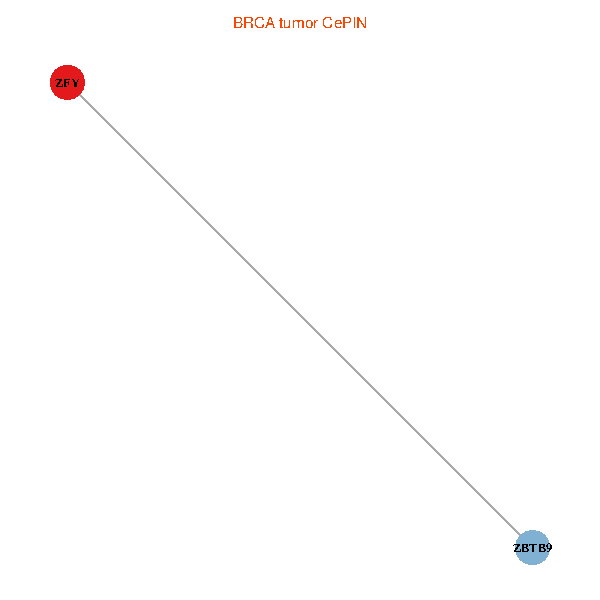
| TissGeneNet for ZFY |
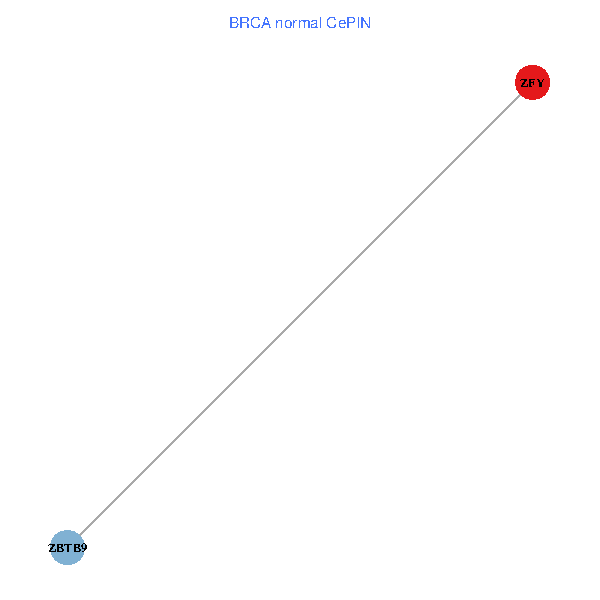
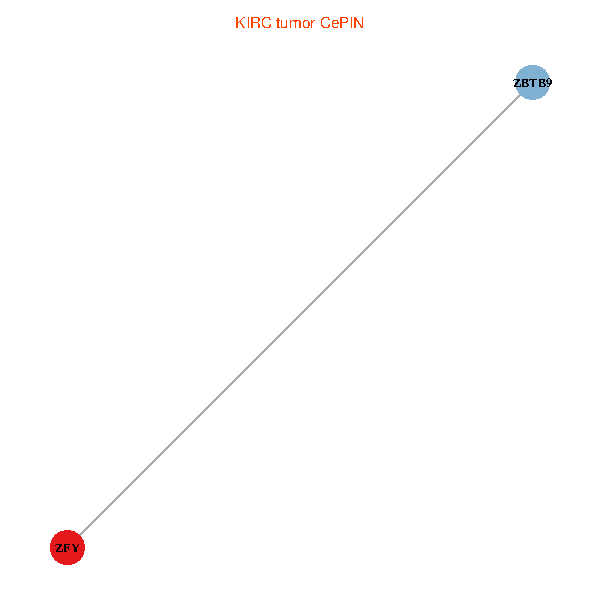
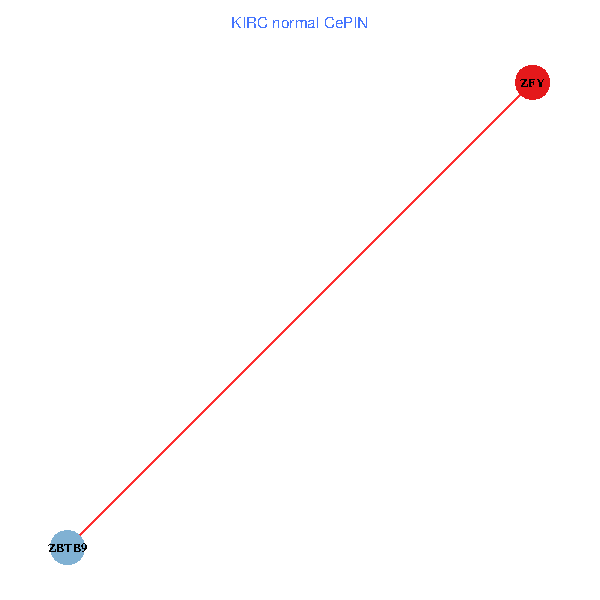
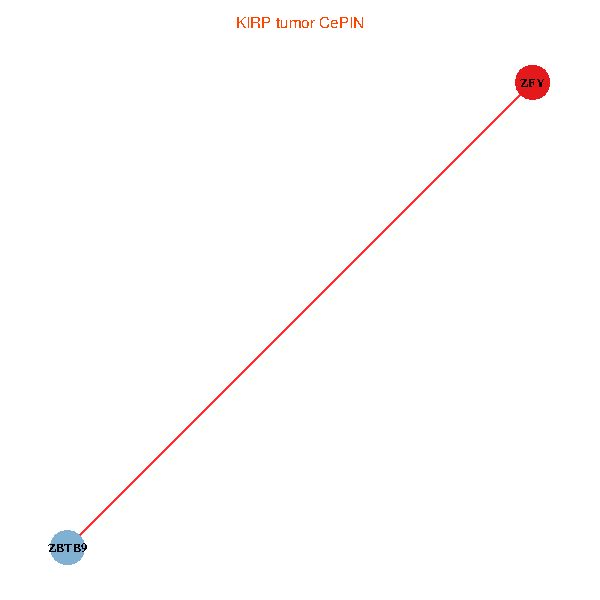
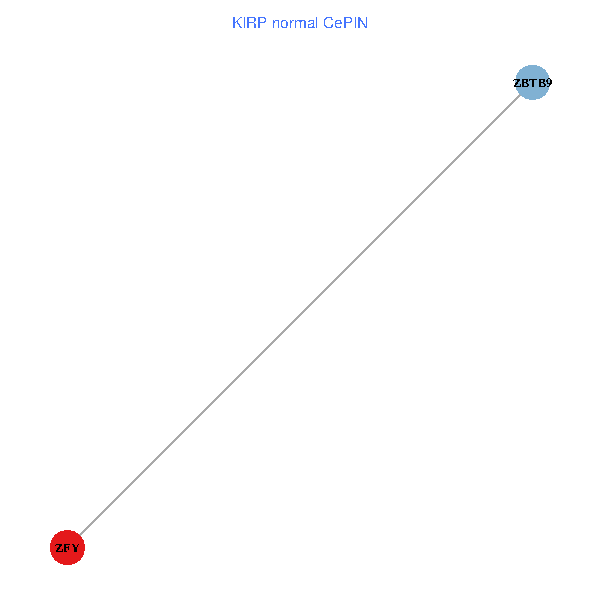
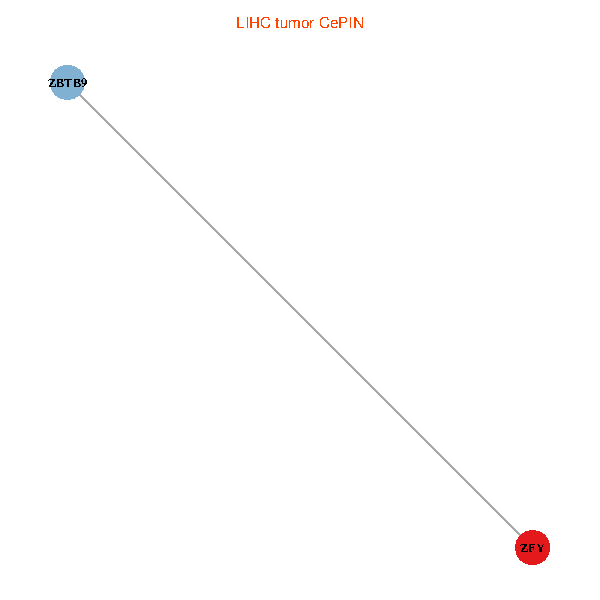
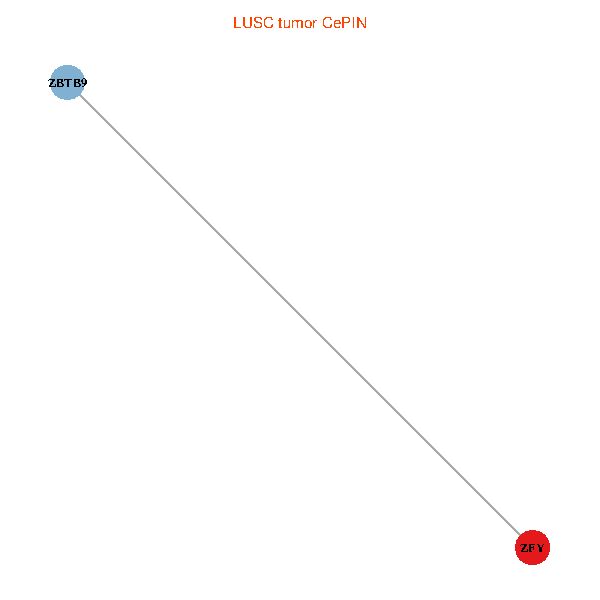
| Co-expressed gene networks based on protein-protein interaction data (CePIN) (TCGA IlluminaHiSeq_RNASeqV2, pan-cancer normalized log2(norm_counts+1) data, version 2016-08-16) (PINA2 ppi data) |
| BRCA (tumor) | BRCA (normal) |
| ZFY, ZBTB9 (tumor) | ZFY, ZBTB9 (normal) |
 |  |
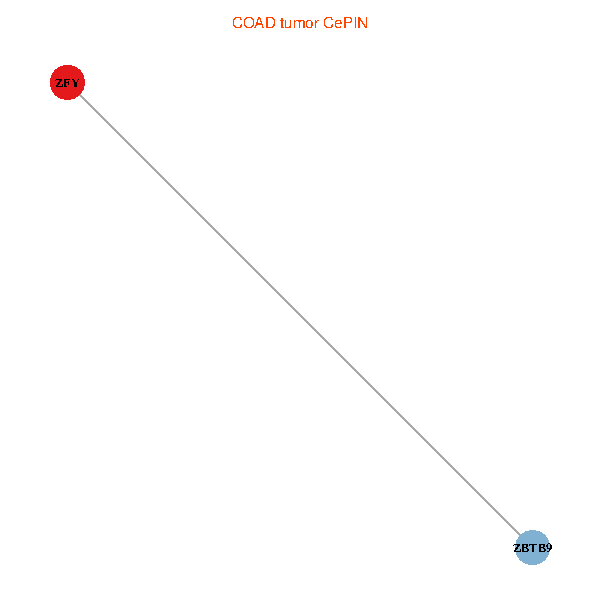
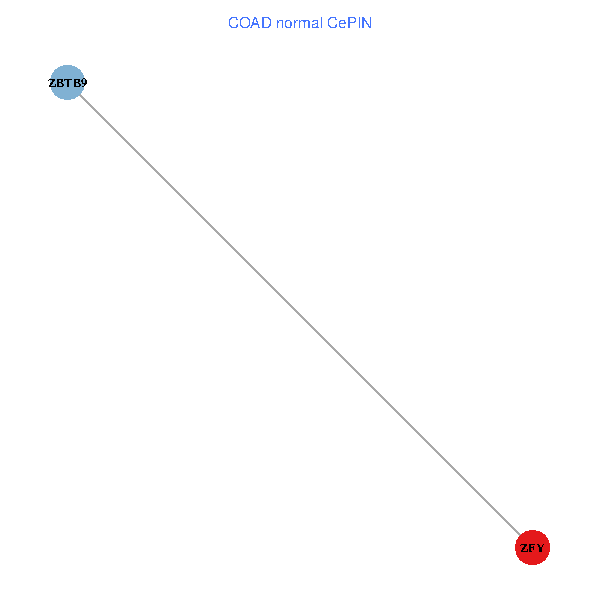
| COAD (tumor) | COAD (normal) |
| ZFY, ZBTB9 (tumor) | ZFY, ZBTB9 (normal) |
 |  |
| HNSC (tumor) | HNSC (normal) |
| ZFY, ZBTB9 (tumor) | ZFY, ZBTB9 (normal) |
 |  |
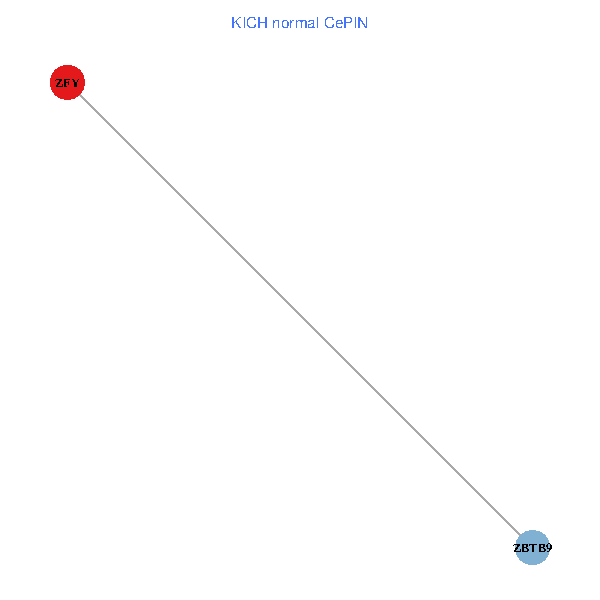
| KICH (tumor) | KICH (normal) |
| ZFY, ZBTB9 (tumor) | ZFY, ZBTB9 (normal) |
 |  |
| KIRC (tumor) | KIRC (normal) |
| ZFY, ZBTB9 (tumor) | ZFY, ZBTB9 (normal) |
 |  |
| KIRP (tumor) | KIRP (normal) |
| ZFY, ZBTB9 (tumor) | ZFY, ZBTB9 (normal) |
 |  |
| LIHC (tumor) | LIHC (normal) |
| ZFY, ZBTB9 (tumor) | ZFY, ZBTB9 (normal) |
 |  |
| LUAD (tumor) | LUAD (normal) |
| ZFY, ZBTB9 (tumor) | ZFY, ZBTB9 (normal) |
 |  |
| LUSC (tumor) | LUSC (normal) |
| ZFY, ZBTB9 (tumor) | ZFY, ZBTB9 (normal) |
 |  |
| PRAD (tumor) | PRAD (normal) |
| ZFY, ZBTB9 (tumor) | ZFY, ZBTB9 (normal) |
 |  |
| STAD (tumor) | STAD (normal) |
| ZFY, ZBTB9 (tumor) | ZFY, ZBTB9 (normal) |
 |  |
| THCA (tumor) | THCA (normal) |
| ZFY, ZBTB9 (tumor) | ZFY, ZBTB9 (normal) |
 |  |
| Top |
| TissGeneProg for ZFY |
| Kaplan-Meier plots with logrank tests of overall survival (OS) using 28 cancer types (TCGA IlluminaHiSeq_RNASeqV2, pan-cancer normalized log2(norm_counts+1) data, version 2016-08-16) (TCGA clinicalMatrix, phenotype data, version 2016-04-27) * Click on the image to enlarge it in a new window. |
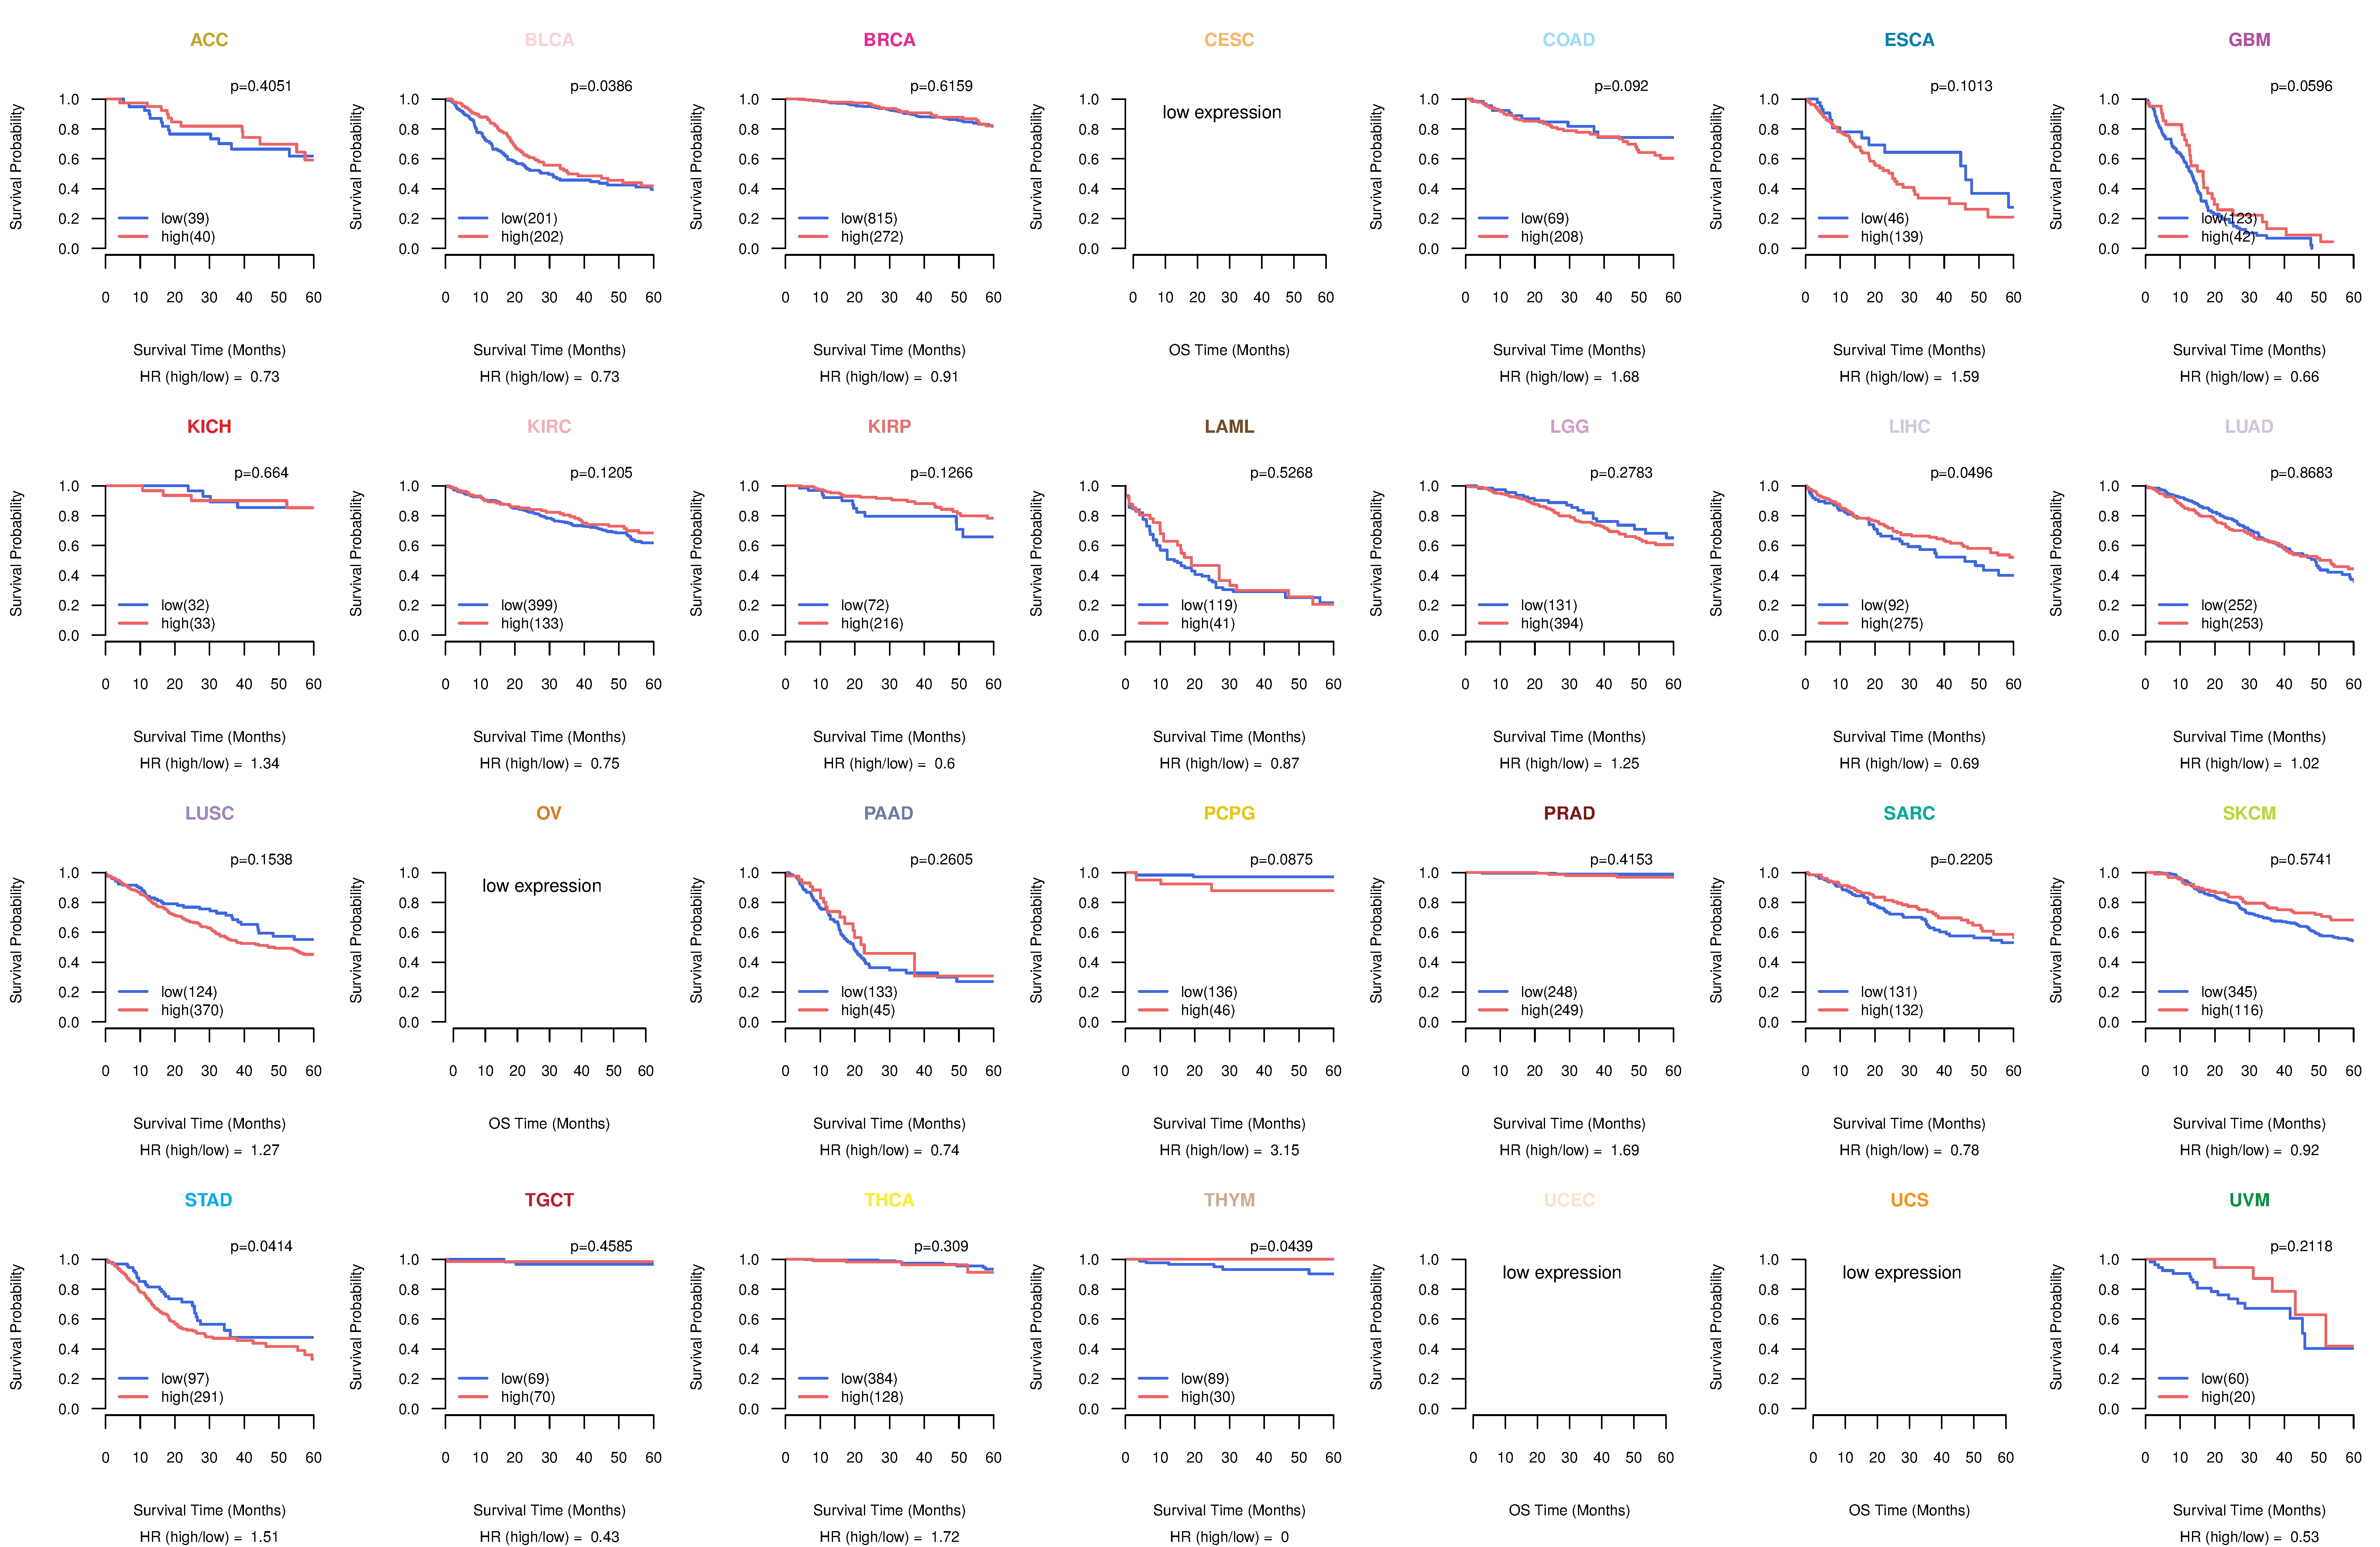 |
| Kaplan-Meier plots with logrank test of relapse free survival (RFS) using 28 cancer types (TCGA IlluminaHiSeq_RNASeqV2, pan-cancer normalized log2(norm_counts+1) data, version 2016-08-16) (TCGA clinicalMatrix, phenotype data, version 2016-04-27) * Click on the image enlarge it in a new window. |
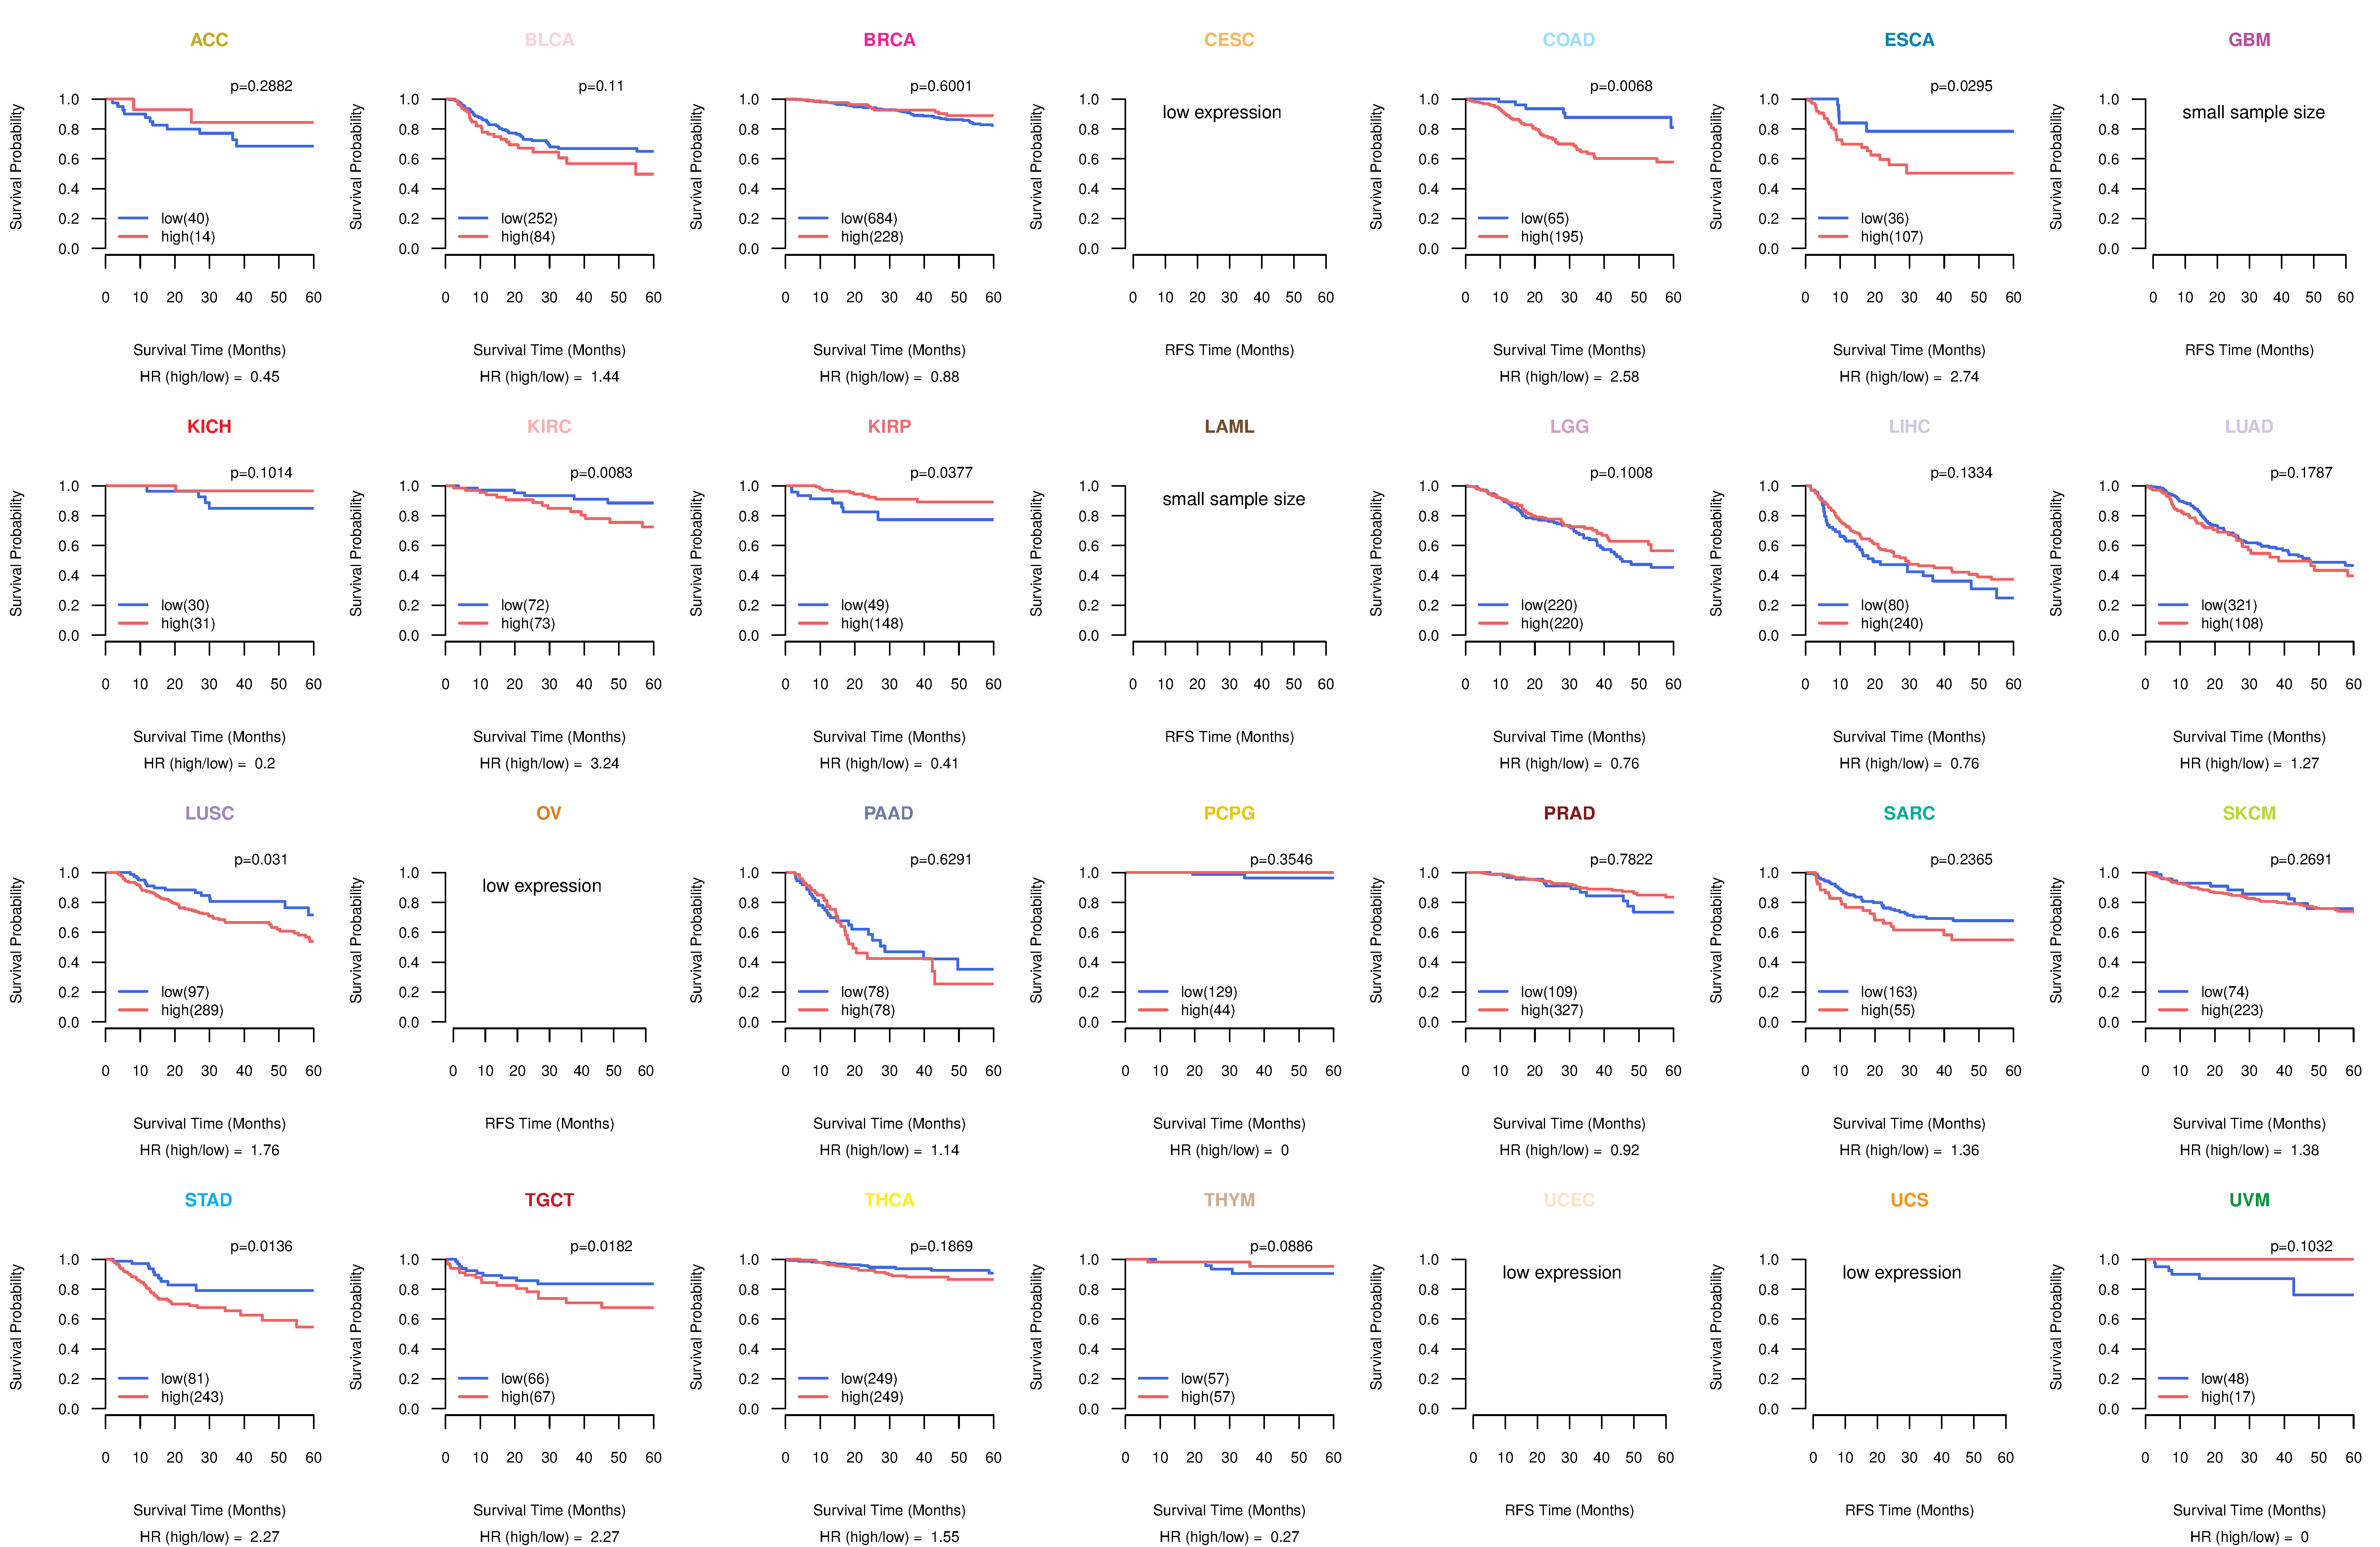 |
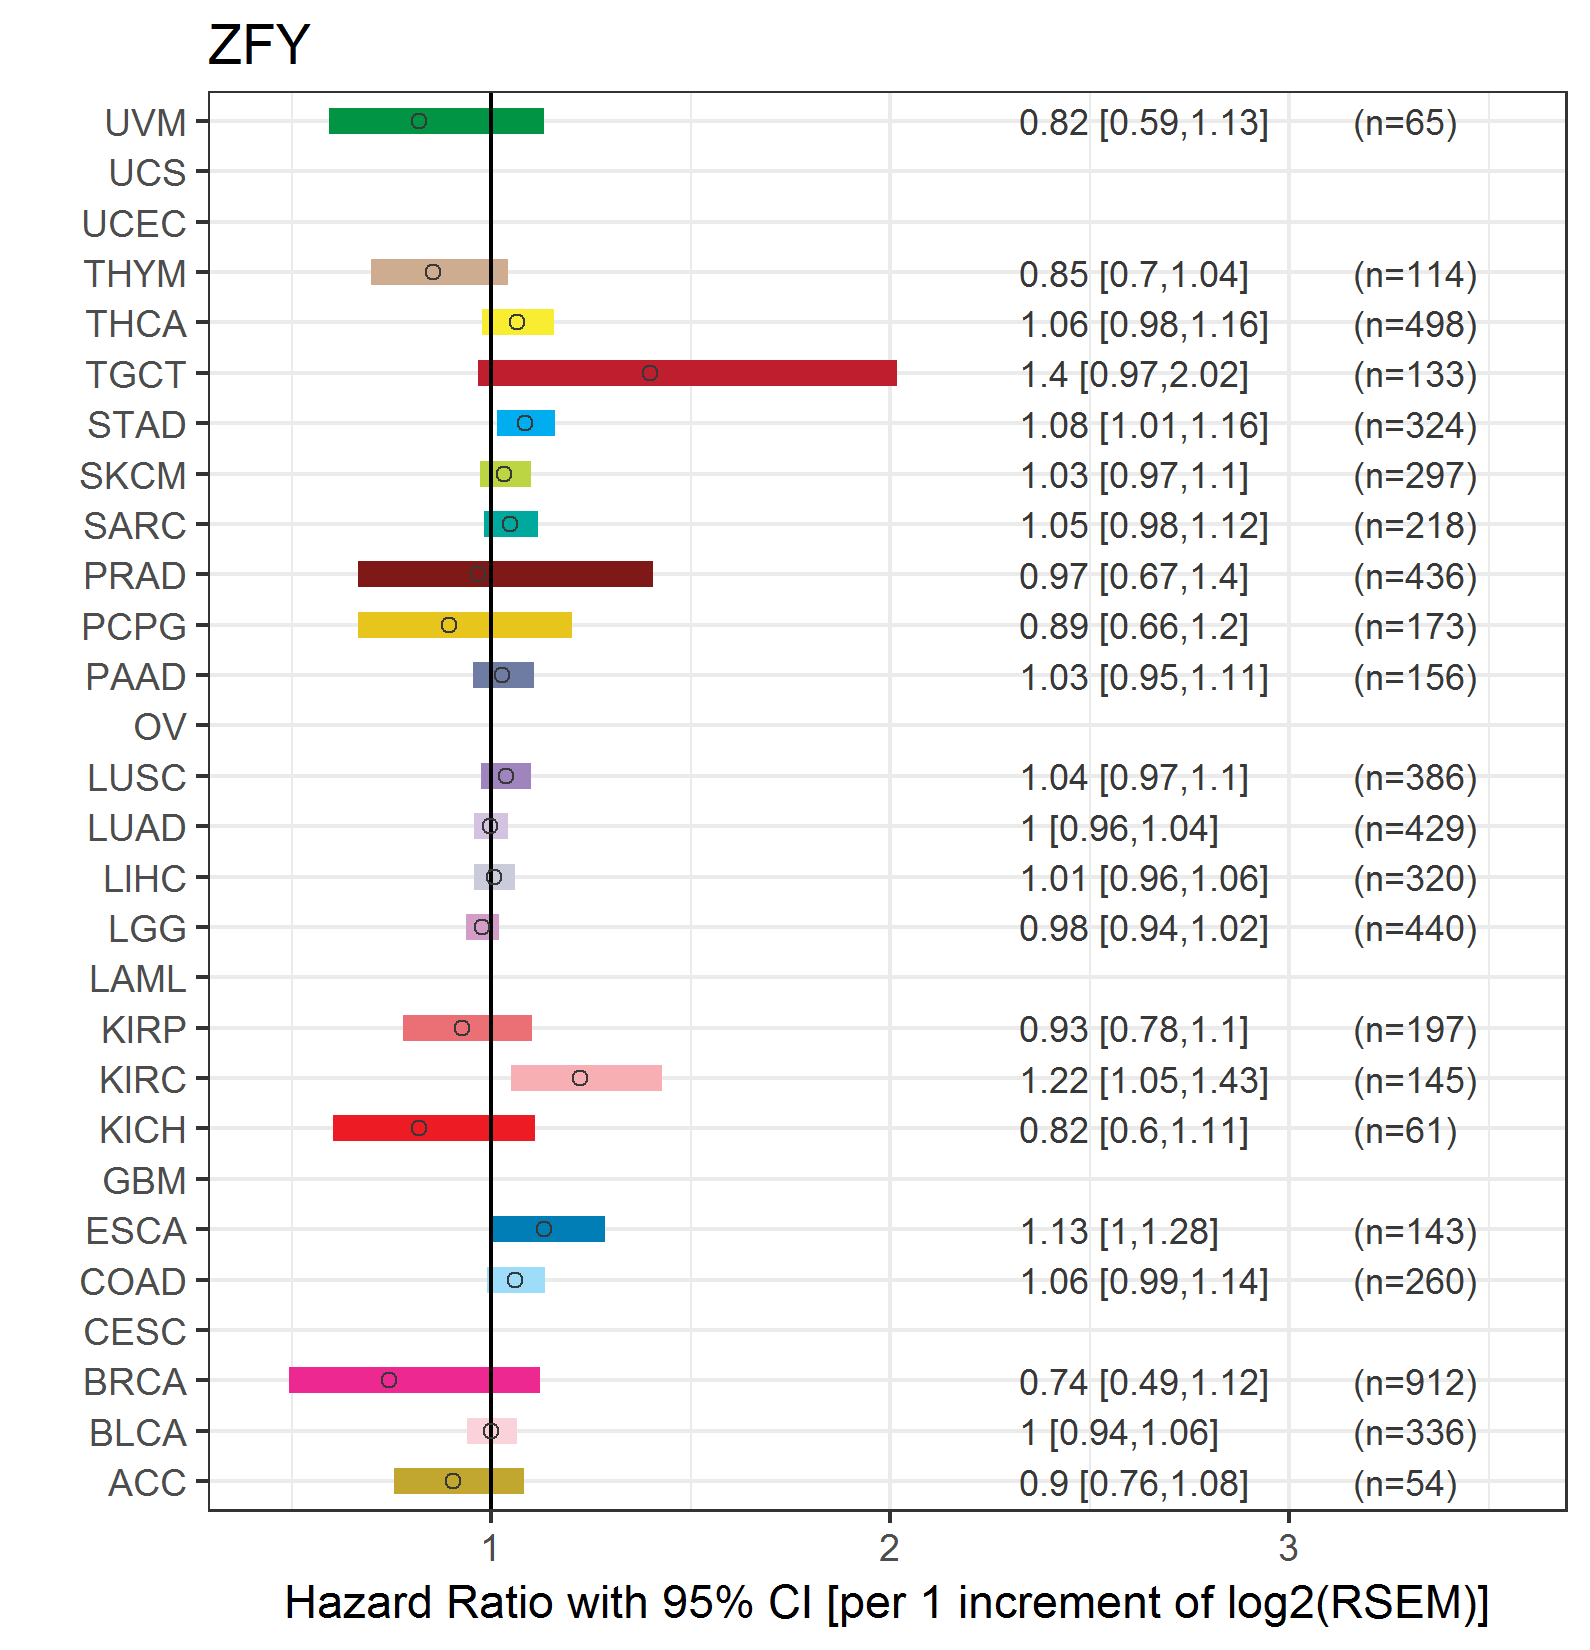
| Forest plot of Cox proportional hazard ratio (HR) and 95% CI of overall survival (OS) using 28 cancer types (TCGA IlluminaHiSeq_RNASeqV2, pan-cancer normalized log2(norm_counts+1) data, version 2016-08-16) (TCGA clinicalMatrix, phenotype data, version 2016-04-27) * Click on the image enlarge it in a new window. |
 |
| Forest plot of Cox proportional hazard ratio (HR) and 95% CI of relapse free survival (RFS) using 28 cancer types (TCGA IlluminaHiSeq_RNASeqV2, pan-cancer normalized log2(norm_counts+1) data, version 2016-08-16) (TCGA clinicalMatrix, phenotype data, version 2016-04-27) * Click on the image enlarge it in a new window. |
 |
| Top |
| TissGeneClin for ZFY |
| TissGeneDrug for ZFY |
| Drug information targeting TissGene (DrugBank Version 5.0.6, 2017-04-01) |
| DrugBank ID | Drug name | Drug activity | Drug type | Drug status |
| Top |
| TissGeneDisease for ZFY |
| Disease information associated with TissGene (DisGeNet, 2016-06-01) |
| Disease ID | Disease name | # pubmeds | Source |
| umls:C0041408 | Turner Syndrome | 3 | BeFree |
| umls:C0001418 | Adenocarcinoma | 1 | BeFree |
| umls:C0007112 | Adenocarcinoma of prostate | 1 | BeFree |
| umls:C0013080 | Down Syndrome | 1 | BeFree |
| umls:C0018051 | Gonadal Dysgenesis | 1 | BeFree |
| umls:C0018054 | Gonadal Dysgenesis, 46,XY | 1 | BeFree |
| umls:C0018055 | Gonadal Dysgenesis, Mixed | 1 | BeFree |
| umls:C0152096 | Complete trisomy 18 syndrome | 1 | BeFree |
| umls:C0432475 | XX males | 1 | BeFree |
| umls:C0432481 | 46, XX true hermaphrodite | 1 | BeFree |
| umls:C0848558 | Hypospadias | 1 | BeFree |
| umls:C1691215 | Penile hypospadias | 1 | BeFree |
| umls:C2936694 | Swyer Syndrome | 1 | BeFree |
|
Copyright 2016-Present - The University of Texas Health Science Center at Houston (UTHealth) Web File Viewing | How to Report, Fraud, Waste and Abuse | State of Texas | Statewide Search | Texas Homeland Security | Site Policies |