 |
| |
| |
| |
| |
| |
| |
|

| TissGeneSummary for MPPED1 |
 Gene summary Gene summary |
| Basic gene information | Gene symbol | MPPED1 |
| Gene name | metallophosphoesterase domain containing 1 | |
| Synonyms | 239AB|C22orf1|FAM1A | |
| Cytomap | UCSC genome browser: 22q13.31 | |
| Type of gene | protein-coding | |
| RefGenes | NM_001044370.1, | |
| Description | adult brain protein 239metallophosphoesterase domain-containing protein 1 | |
| Modification date | 20141216 | |
| dbXrefs | MIM : 602112 | |
| HGNC : HGNC | ||
| Ensembl : ENSG00000186732 | ||
| HPRD : 03663 | ||
| Protein | UniProt: go to UniProt's Cross Reference DB Table | |
| Expression | CleanEX: HS_MPPED1 | |
| BioGPS: 758 | ||
| Pathway | NCI Pathway Interaction Database: MPPED1 | |
| KEGG: MPPED1 | ||
| REACTOME: MPPED1 | ||
| Pathway Commons: MPPED1 | ||
| Context | iHOP: MPPED1 | |
| ligand binding site mutation search in PubMed: MPPED1 | ||
| UCL Cancer Institute: MPPED1 | ||
| Assigned class in TissGDB* | C | |
| Included tissue-specific gene expression resources | HPA,GTEx | |
| Specific-tissues in normal samples (assigned by TissGDB using HPA, TiGER, and GTEx) | BrainLiver | |
| Cancer types related to the specific-tissues in cancer samples (assigned by TissGDB using TCGA) | GBM,LGGLIHC | |
| Reference showing the relevant tissue of MPPED1 | ||
| Description by TissGene annotations | Have significant anti-correlated miRNA | |
| * Class A consists of genes with literature evidence and is part of the cTissGenes. Class B consists of only cTissGenes without additional evidence. The remaining genes belong to Class C. |
| Gene ontology having evidence of Inferred from Direct Assay (IDA) from Entrez |
| GO ID | GO term | PubMed ID |
| Top |
| TissGeneExp for MPPED1 |
| Gene expressions across 28 cancer types (X-axis: cancer type and Y-axis: log2(norm_counts+1)) (TCGA IlluminaHiSeq_RNASeqV2, pan-cancer normalized log2(norm_counts+1) data, version 2016-08-16) |
 |
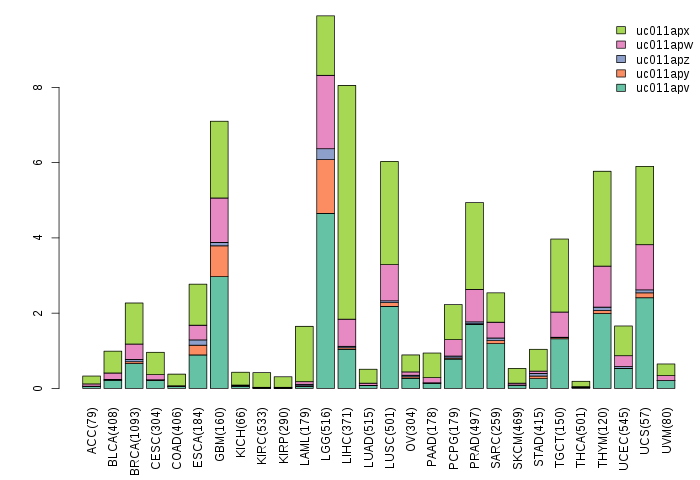
| Gene isoform expressions across 28 cancer types (X-axis: cancer type and Y-axis: log2(norm_counts+1)) (TCGA pan-cancer tcga_rsem_isoform_tpm, version 2016-09-01) |
 |
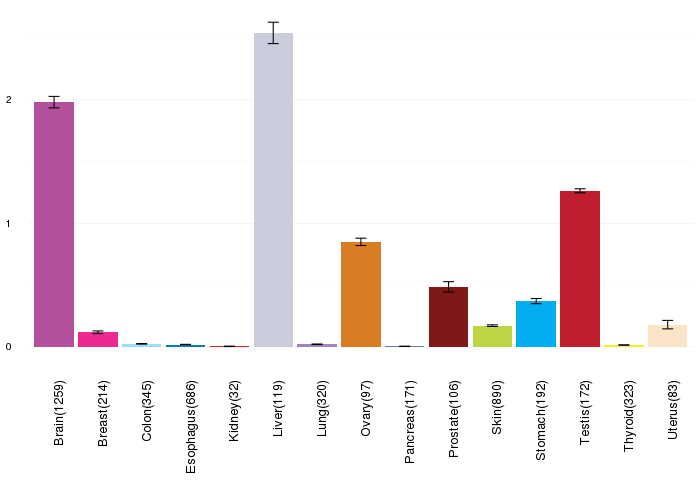
| Gene expressions across normal tissues of GTEx data (GTEx GTEx_Analysis_v6_RNA-seq_RNA-SeQCv1.1.8_gene_rpkm.gct) - Here, we shows the matched tissue types only among our 28 cancer types. |
 |
| Different expressions across 14 cancer types with more than 10 samples between matched tumors and normals (X-axis: cancer type and Y-axis: log2(norm_counts+1)) (TCGA IlluminaHiSeq_RNASeqV2, pan-cancer normalized log2(norm_counts+1) data, version 2016-08-16) |
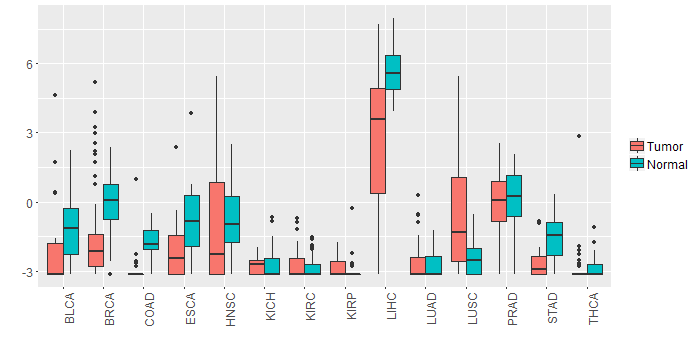 |
| - Significantly differentially expressed cancer types and information. (|Fold change|>1 and FDR<0.05) |
| Cancer type | Mean(exp) in tumor | Mean(exp) in matched normal | Log2FC | P-val. | FDR |
| COAD | -2.870628288 | -1.721482134 | -1.149146154 | 7.72E-07 | 4.43E-06 |
| STAD | -2.662138144 | -1.577822519 | -1.084315625 | 3.03E-06 | 4.26E-05 |
| LUSC | -0.42365242 | -2.449193597 | 2.025541176 | 1.70E-06 | 4.12E-06 |
| BRCA | -1.792079975 | -0.19542208 | -1.596657895 | 7.38E-14 | 3.52E-13 |
| LIHC | 2.707258481 | 5.680824481 | -2.973566 | 1.23E-08 | 1.06E-07 |
| Top |
| TissGene-miRNA for MPPED1 |
| Significantly anti-correlated miRNAs of TissGene across 28 cancer types (Gene-miRNA relations from TargetScanHuman Relsease 7.1, Conserved_Site_Context_Scores.txt.zip, 06.01.2016) (TCGA IlluminaHiSeq_miRNASeq, log2(RPM+1) data, version 2016-11-21) (TCGA IlluminaHiSeq_RNASeqV2, log2(normalized_count+1) data, version 2016-08-16) (Spearman’s Rank Correlation (p-value<0.05 and coefficient<-0.25)) |
| Cancer type | miRNA id | miRNA accession | P-val. | Coeff. | # samples |
| ACC | hsa-miR-6088 | MIMAT0023713 | 0.0064 | -0.31 | 78 |
| ACC | hsa-miR-6088 | MIMAT0023713 | 0.0064 | -0.31 | 78 |
| Top |
| TissGeneMut for MPPED1 |
| TissGeneSNV for MPPED1 |
| nsSNV counts per each loci. Different colors of circles represent different cancer types. Circle size denotes number of samples. (TCGA somatic mutation (SNPs and small INDELs) data, version 2016-04-25) * Click on the image to enlarge it in a new window. |
 |
 |
| Somatic nucleotide variants of TissGene across 28 cancer types (X-axis: cancer type and Y-axis: % of mutated samples) The numbers in parentheses are numbers of samples with mutation (nsSNVs). (TCGA somatic mutation (SNPs and small INDELs) data, version 2016-04-25) |
 |
| - nsSNVs sorted by frequency. |
| AAchange | Cancer type | # samples |
| p.D155G | LGG | 2 |
| p.V239I | UCEC | 2 |
| p.R67H | STAD | 1 |
| p.T59N | STAD | 1 |
| p.D352N | UCEC | 1 |
| p.E287K | LUAD | 1 |
| p.A35T | LGG | 1 |
| p.R224Q | UCEC | 1 |
| p.V201L | LUAD | 1 |
| p.E121D | THYM | 1 |
| p.P314T | LUAD | 1 |
| p.A34T | LGG | 1 |
| p.G263S | THCA | 1 |
| p.R274H | STAD | 1 |
| p.R278W | LUAD | 1 |
| p.P71L | COAD | 1 |
| p.R274S | LUAD | 1 |
| p.I105M | HNSC | 1 |
| p.R69W | CESC | 1 |
| p.R274H | LUAD | 1 |
| p.K129N | UCEC | 1 |
| p.N62K | LUAD | 1 |
| p.P256T | LGG | 1 |
| p.R3H | UCEC | 1 |
| p.P80H | COAD | 1 |
| p.P256L | SKCM | 1 |
| p.L122Q | LUAD | 1 |
| p.V145L | LIHC | 1 |
| p.E287K | SKCM | 1 |
| p.Y140* | LUAD | 1 |
| p.D77H | HNSC | 1 |
| p.Y309X | COAD | 1 |
| p.A26P | HNSC | 1 |
| p.P256L | LIHC | 1 |
| p.E141K | CHOL | 1 |
| p.I63N | UCEC | 1 |
| p.V95I | COAD | 1 |
| p.R36W | SKCM | 1 |
| p.L176Q | LIHC | 1 |
| p.V73M | PRAD | 1 |
| p.Q106H | UCEC | 1 |
| p.H115Y | SKCM | 1 |
| p.W2G | SKCM | 1 |
| p.A147T | ESCA | 1 |
| p.M75I | HNSC | 1 |
| p.R202W | UCEC | 1 |
| p.D111N | SKCM | 1 |
| p.G123W | BLCA | 1 |
| p.V93I | SKCM | 1 |
| p.G24S | SKCM | 1 |
| p.P20S | SKCM | 1 |
| p.R205W | STAD | 1 |
| p.V73L | LUAD | 1 |
| p.R278Q | STAD | 1 |
| p.D161N | LGG | 1 |
| p.L19F | SKCM | 1 |
| Top |
| TissGeneCNV for MPPED1 |
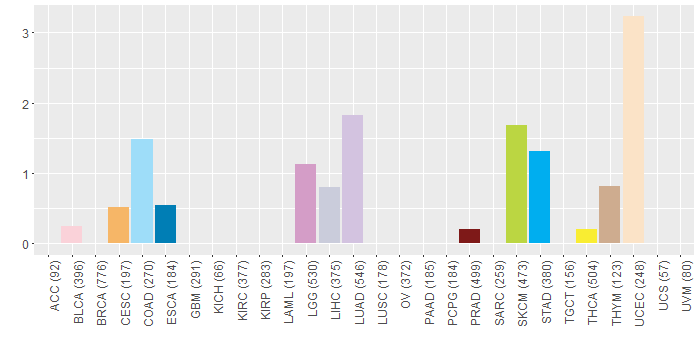
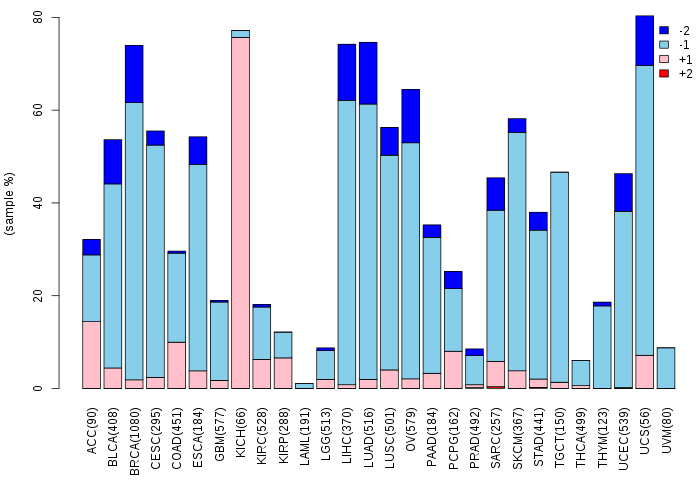
| Copy number variations of TissGene across 28 cancer types (X-axis: cancer type and Y-axis: % of CNV samples) (TCGA Gistic2_CopyNumber_Gistic2_all_data_by_genes, Gistic2 copy number data, version 2016-08-16) |
 |
| Top |
| TissGeneFusions for MPPED1 |
| Fusion genes including TissGene (ChimerDB 3.0, 2016-12-01 and TCGA fusion Portal 2015-12-01) |
| Database | Src | Cancer type | Sample | Fusion gene | ORF | 5'-gene BP | 3'-gene BP |
| Chimerdb3.0 | FusionScan | LGG | TCGA-S9-A7R7-01A | RBFOX2-MPPED1 | Out-of-Frame | chr22:36334894 | chr22:43870615 |
| Chimerdb3.0 | FusionScan | UCS | TCGA-NA-A4QY-01A | MPPED1-SCFD2 | Out-of-Frame | chr22:43870841 | chr4:53740228 |
| Top |
| TissGeneNet for MPPED1 |
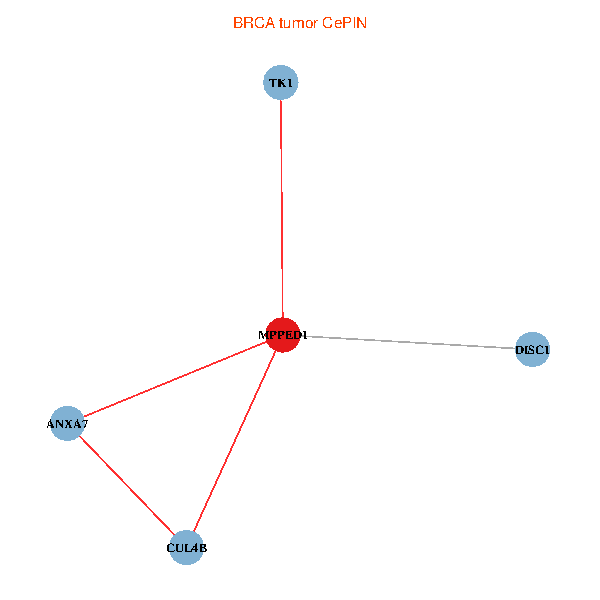
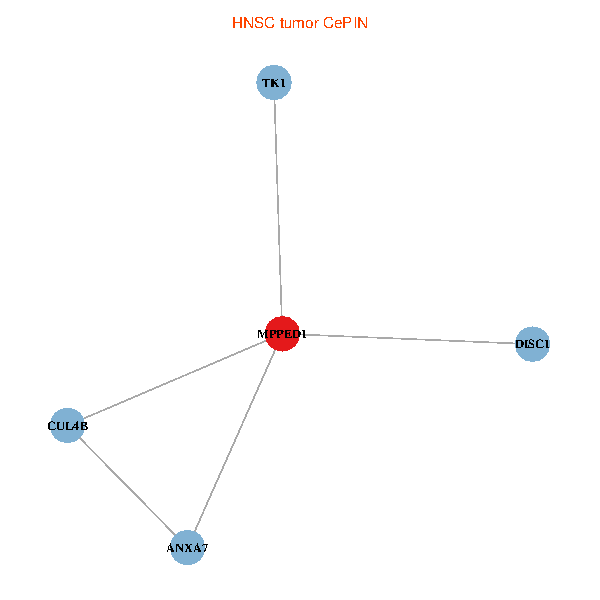
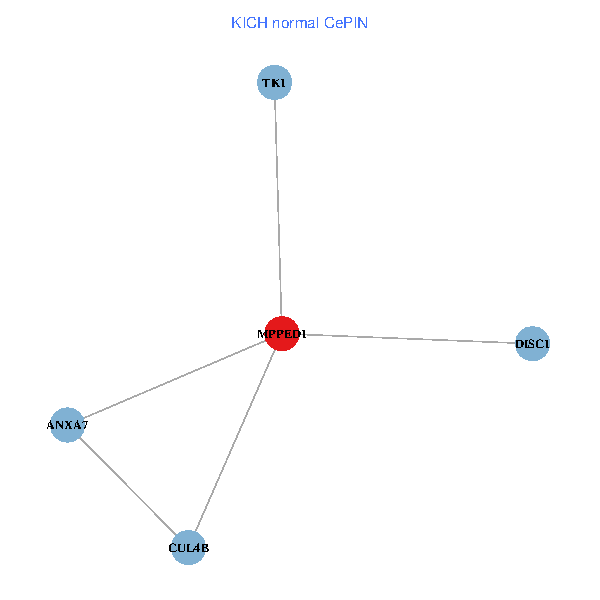
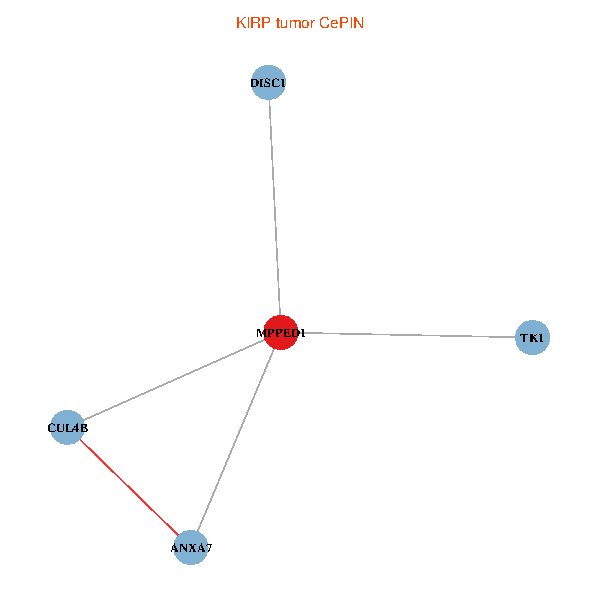
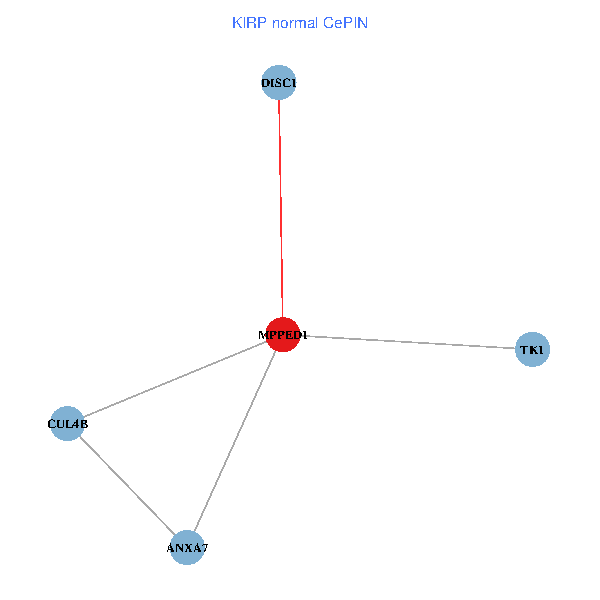
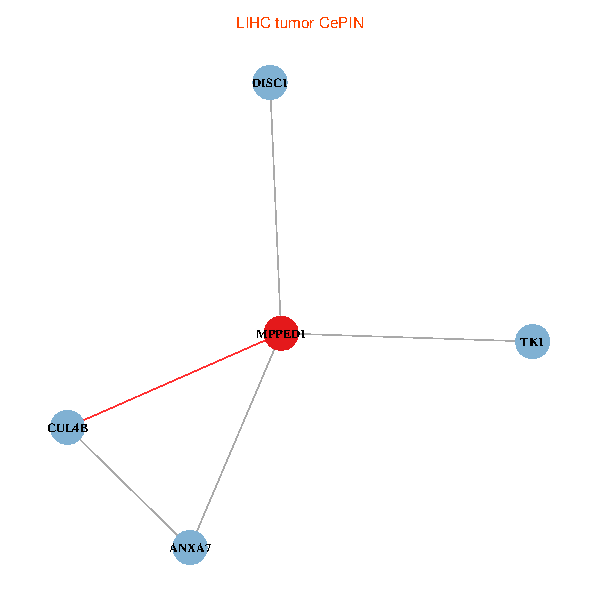
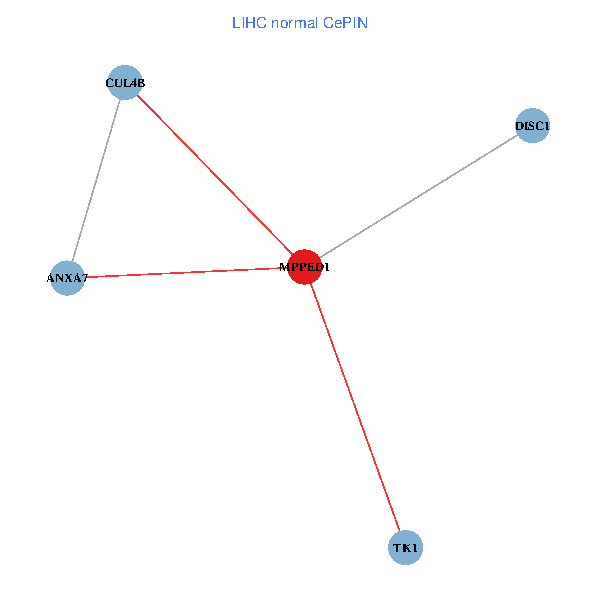
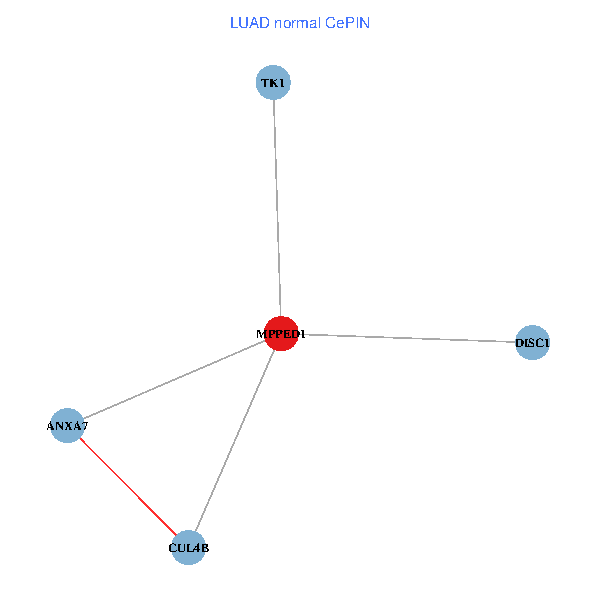
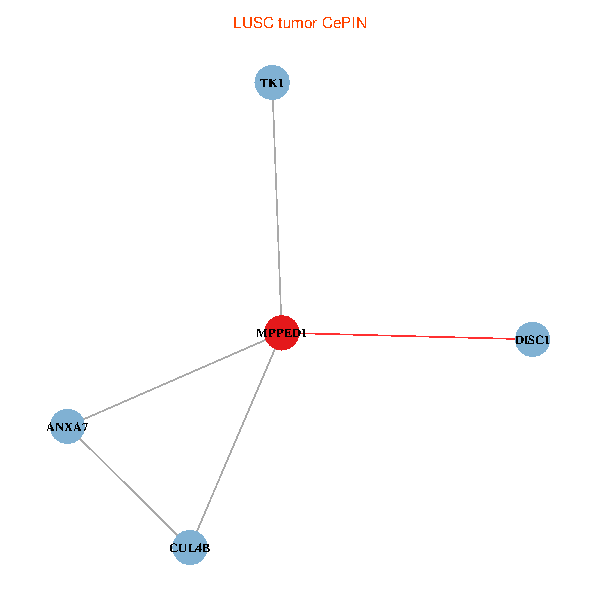
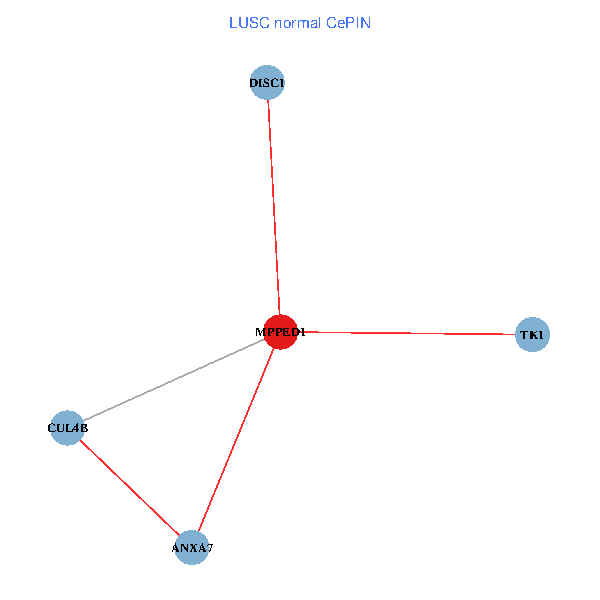
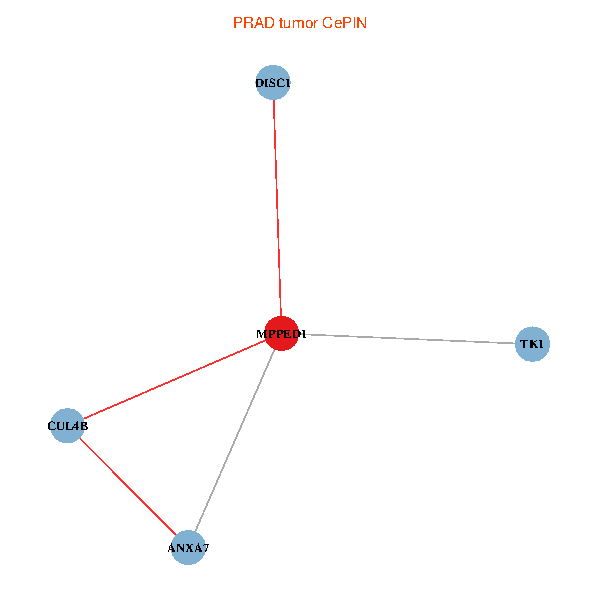
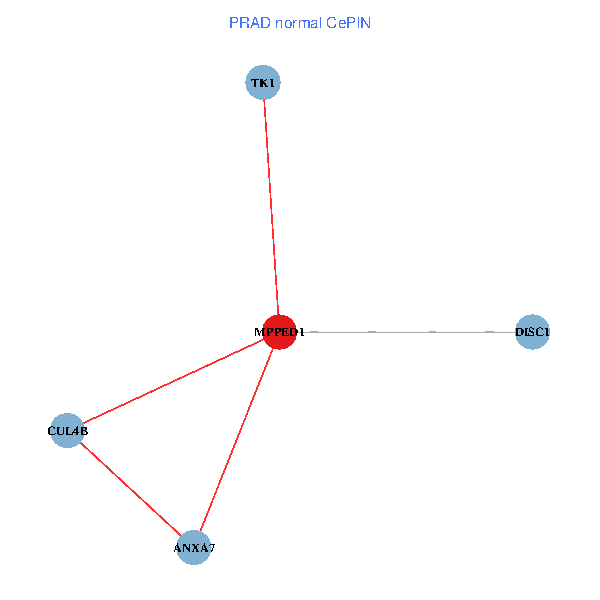
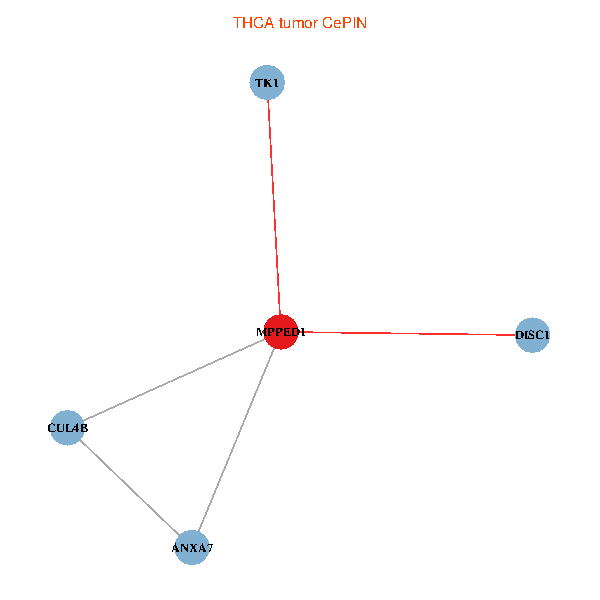
| Co-expressed gene networks based on protein-protein interaction data (CePIN) (TCGA IlluminaHiSeq_RNASeqV2, pan-cancer normalized log2(norm_counts+1) data, version 2016-08-16) (PINA2 ppi data) |
| BRCA (tumor) | BRCA (normal) |
| MPPED1, TK1, CUL4B, ANXA7, DISC1 (tumor) | MPPED1, TK1, CUL4B, ANXA7, DISC1 (normal) |
 |  |
| COAD (tumor) | COAD (normal) |
| MPPED1, TK1, CUL4B, ANXA7, DISC1 (tumor) | MPPED1, TK1, CUL4B, ANXA7, DISC1 (normal) |
 |  |
| HNSC (tumor) | HNSC (normal) |
| MPPED1, TK1, CUL4B, ANXA7, DISC1 (tumor) | MPPED1, TK1, CUL4B, ANXA7, DISC1 (normal) |
 |  |
| KICH (tumor) | KICH (normal) |
| MPPED1, TK1, CUL4B, ANXA7, DISC1 (tumor) | MPPED1, TK1, CUL4B, ANXA7, DISC1 (normal) |
 |  |
| KIRC (tumor) | KIRC (normal) |
| MPPED1, TK1, CUL4B, ANXA7, DISC1 (tumor) | MPPED1, TK1, CUL4B, ANXA7, DISC1 (normal) |
 |  |
| KIRP (tumor) | KIRP (normal) |
| MPPED1, TK1, CUL4B, ANXA7, DISC1 (tumor) | MPPED1, TK1, CUL4B, ANXA7, DISC1 (normal) |
 |  |
| LIHC (tumor) | LIHC (normal) |
| MPPED1, TK1, CUL4B, ANXA7, DISC1 (tumor) | MPPED1, TK1, CUL4B, ANXA7, DISC1 (normal) |
 |  |
| LUAD (tumor) | LUAD (normal) |
| MPPED1, TK1, CUL4B, ANXA7, DISC1 (tumor) | MPPED1, TK1, CUL4B, ANXA7, DISC1 (normal) |
 |  |
| LUSC (tumor) | LUSC (normal) |
| MPPED1, TK1, CUL4B, ANXA7, DISC1 (tumor) | MPPED1, TK1, CUL4B, ANXA7, DISC1 (normal) |
 |  |
| PRAD (tumor) | PRAD (normal) |
| MPPED1, TK1, CUL4B, ANXA7, DISC1 (tumor) | MPPED1, TK1, CUL4B, ANXA7, DISC1 (normal) |
 |  |
| STAD (tumor) | STAD (normal) |
| MPPED1, TK1, CUL4B, ANXA7, DISC1 (tumor) | MPPED1, TK1, CUL4B, ANXA7, DISC1 (normal) |
 |  |
| THCA (tumor) | THCA (normal) |
| MPPED1, TK1, CUL4B, ANXA7, DISC1 (tumor) | MPPED1, TK1, CUL4B, ANXA7, DISC1 (normal) |
 |  |
| Top |
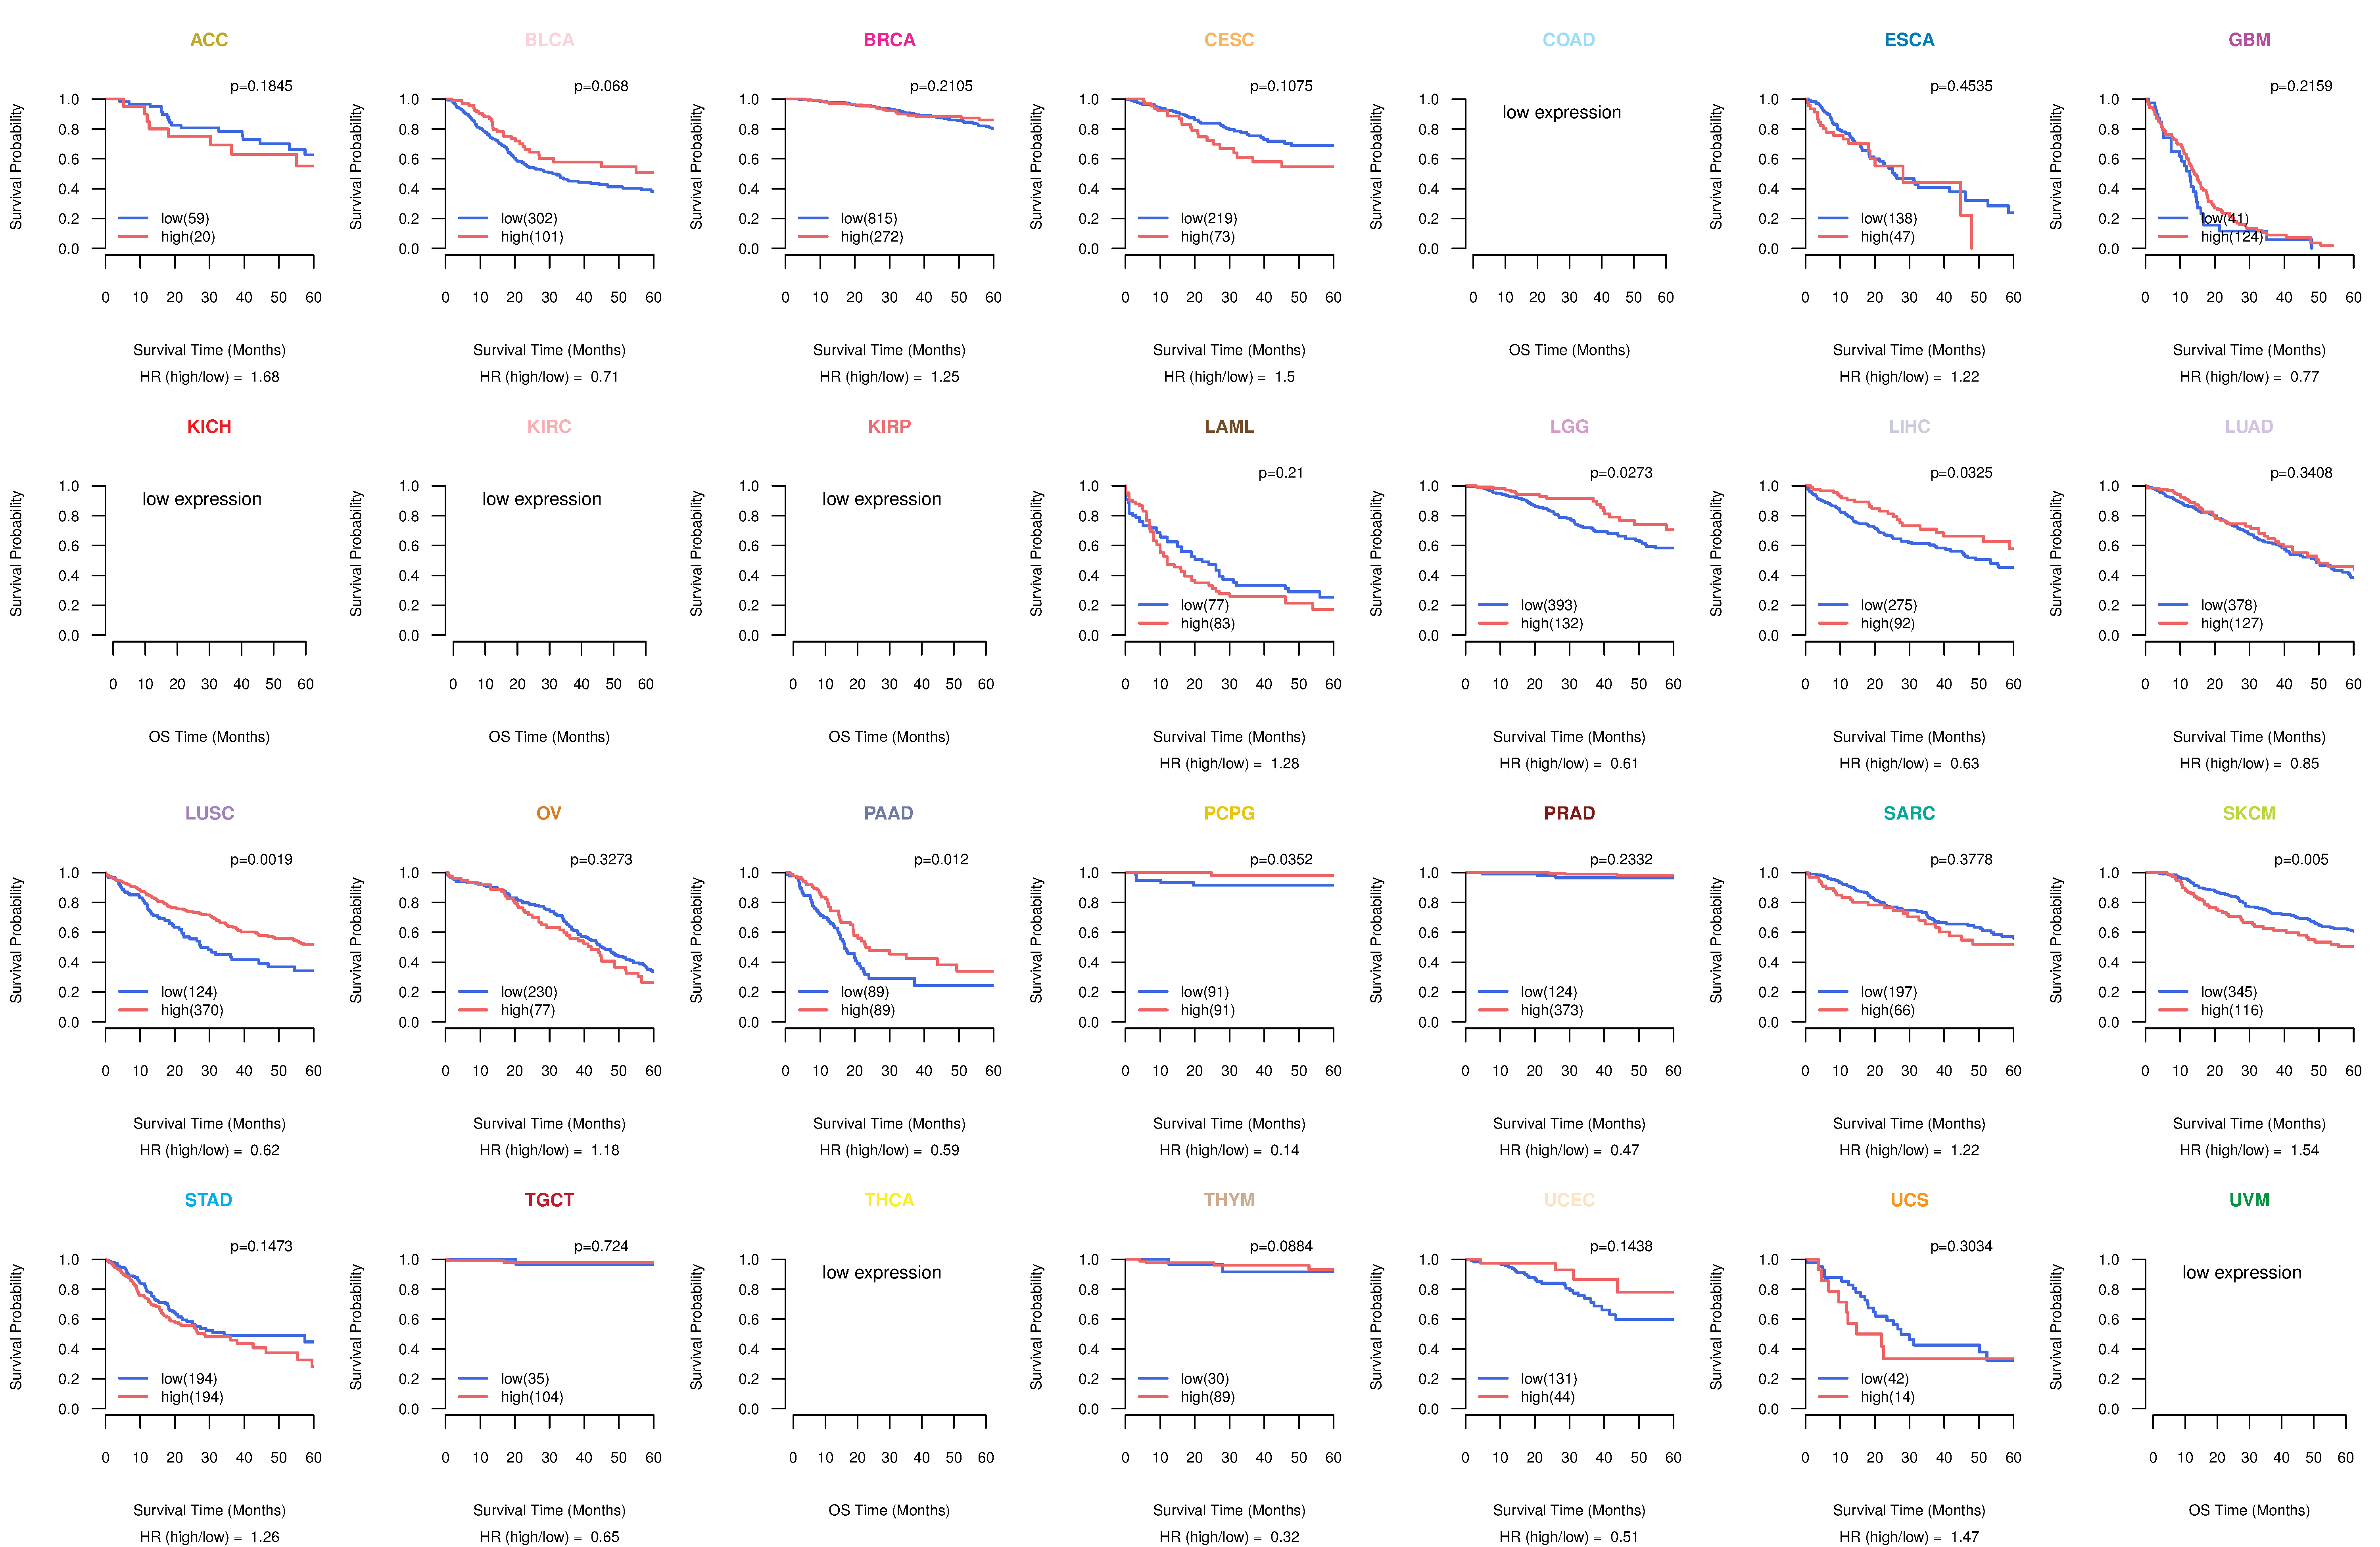
| TissGeneProg for MPPED1 |
| Kaplan-Meier plots with logrank tests of overall survival (OS) using 28 cancer types (TCGA IlluminaHiSeq_RNASeqV2, pan-cancer normalized log2(norm_counts+1) data, version 2016-08-16) (TCGA clinicalMatrix, phenotype data, version 2016-04-27) * Click on the image to enlarge it in a new window. |
 |
| Kaplan-Meier plots with logrank test of relapse free survival (RFS) using 28 cancer types (TCGA IlluminaHiSeq_RNASeqV2, pan-cancer normalized log2(norm_counts+1) data, version 2016-08-16) (TCGA clinicalMatrix, phenotype data, version 2016-04-27) * Click on the image enlarge it in a new window. |
 |
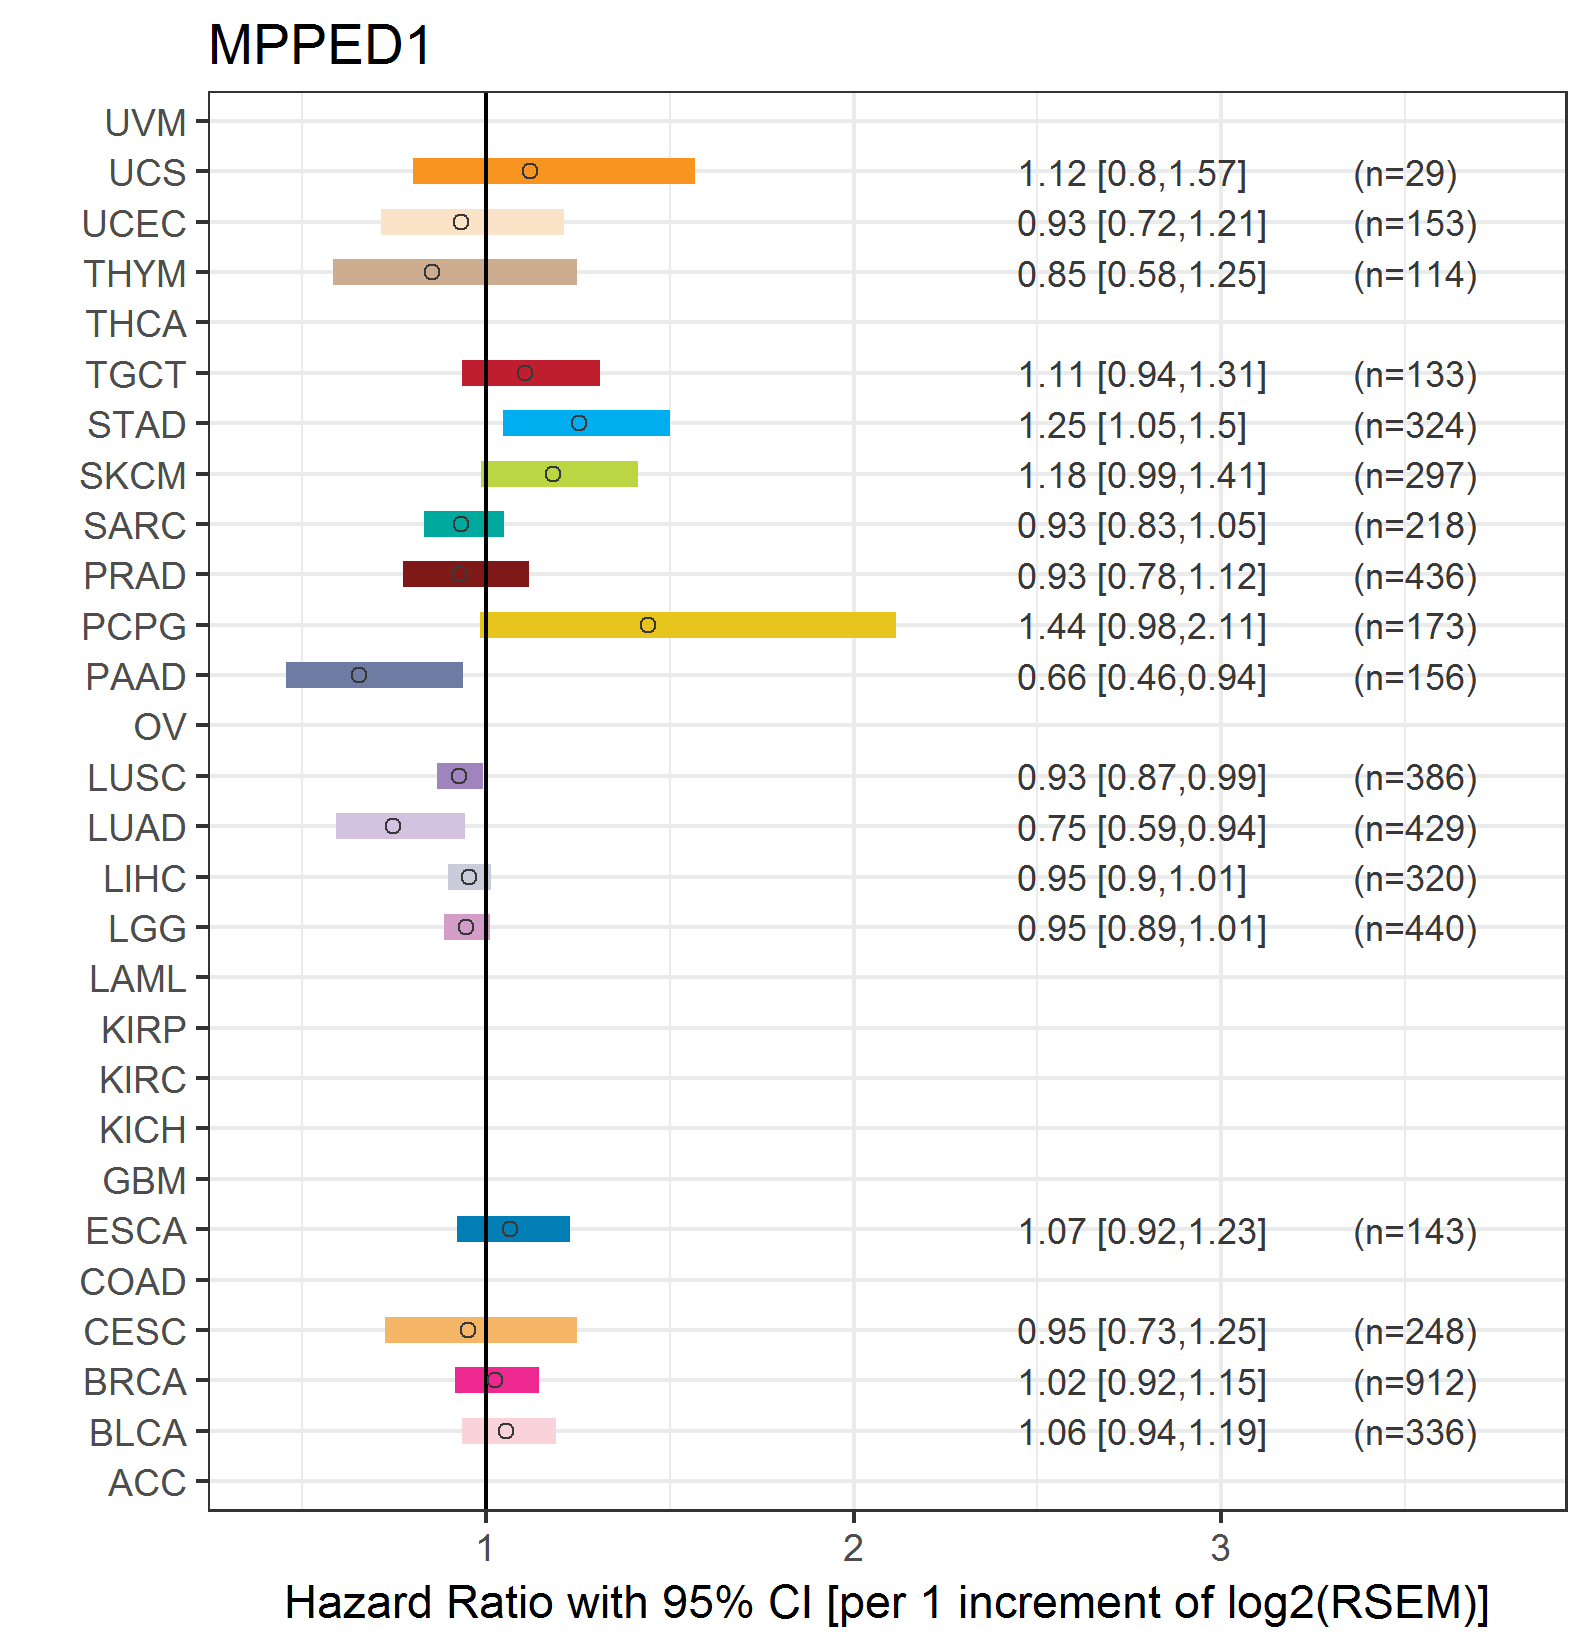
| Forest plot of Cox proportional hazard ratio (HR) and 95% CI of overall survival (OS) using 28 cancer types (TCGA IlluminaHiSeq_RNASeqV2, pan-cancer normalized log2(norm_counts+1) data, version 2016-08-16) (TCGA clinicalMatrix, phenotype data, version 2016-04-27) * Click on the image enlarge it in a new window. |
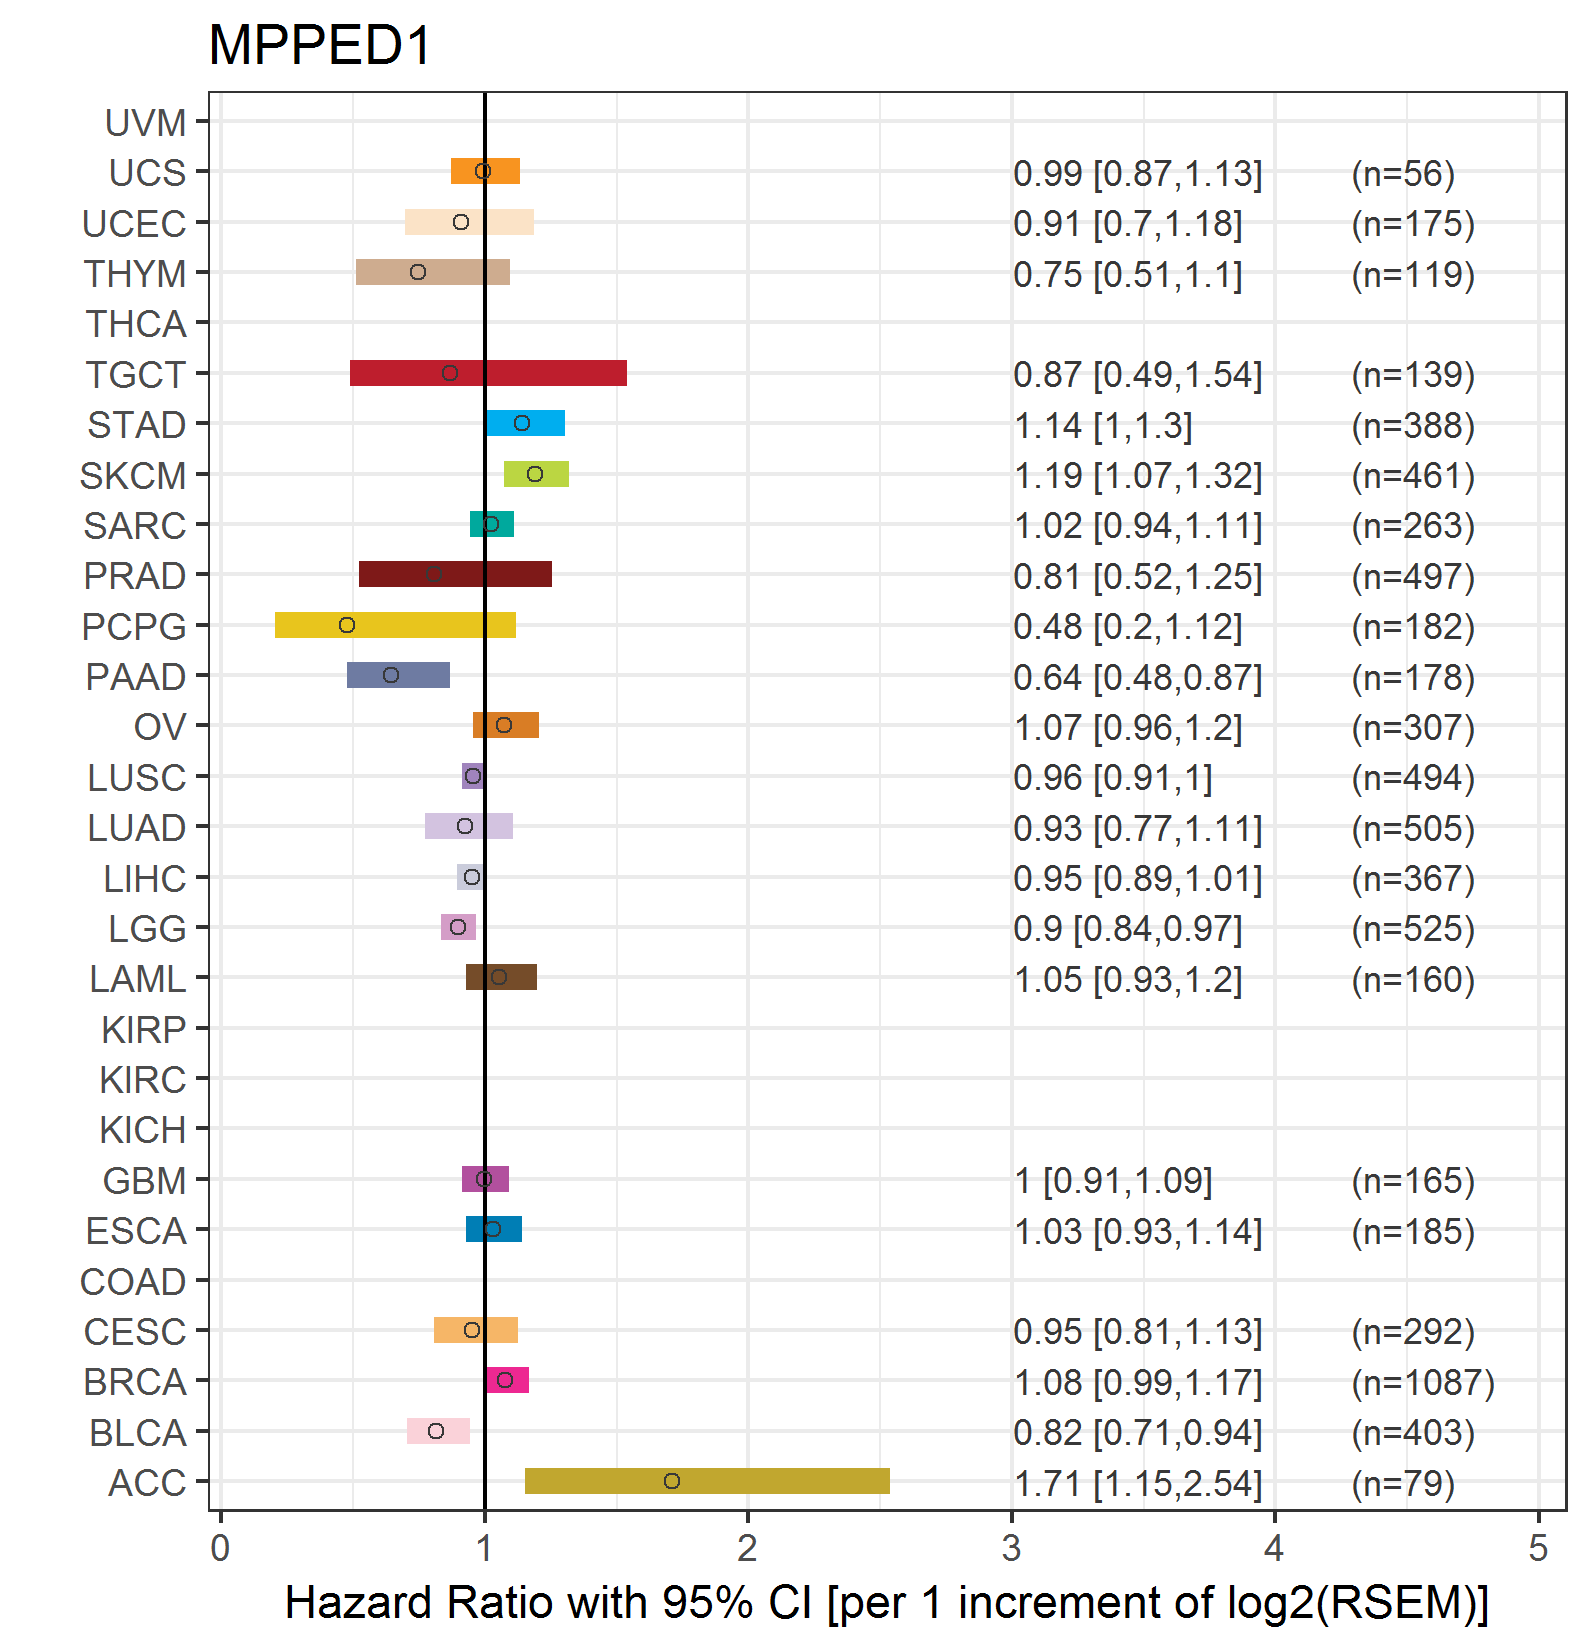 |
| Forest plot of Cox proportional hazard ratio (HR) and 95% CI of relapse free survival (RFS) using 28 cancer types (TCGA IlluminaHiSeq_RNASeqV2, pan-cancer normalized log2(norm_counts+1) data, version 2016-08-16) (TCGA clinicalMatrix, phenotype data, version 2016-04-27) * Click on the image enlarge it in a new window. |
 |
| Top |
| TissGeneClin for MPPED1 |
| TissGeneDrug for MPPED1 |
| Drug information targeting TissGene (DrugBank Version 5.0.6, 2017-04-01) |
| DrugBank ID | Drug name | Drug activity | Drug type | Drug status |
| Top |
| TissGeneDisease for MPPED1 |
| Disease information associated with TissGene (DisGeNet, 2016-06-01) |
| Disease ID | Disease name | # pubmeds | Source |
| umls:C0040336 | Tobacco Use Disorder | 1 | GAD |
|
Copyright 2016-Present - The University of Texas Health Science Center at Houston (UTHealth) Web File Viewing | How to Report, Fraud, Waste and Abuse | State of Texas | Statewide Search | Texas Homeland Security | Site Policies |