 |
| |
| |
| |
| |
| |
| |
|

| TissGeneSummary for SLC30A2 |
 Gene summary Gene summary |
| Basic gene information | Gene symbol | SLC30A2 |
| Gene name | solute carrier family 30 (zinc transporter), member 2 | |
| Synonyms | PP12488|TNZD|ZNT2|ZnT-2 | |
| Cytomap | UCSC genome browser: 1p35.3 | |
| Type of gene | protein-coding | |
| RefGenes | NM_001004434.1, NM_032513.3, | |
| Description | solute carrier family 30 member 2zinc transporter 2 | |
| Modification date | 20141207 | |
| dbXrefs | MIM : 609617 | |
| HGNC : HGNC | ||
| Ensembl : ENSG00000158014 | ||
| HPRD : 18057 | ||
| Vega : OTTHUMG00000007508 | ||
| Protein | UniProt: go to UniProt's Cross Reference DB Table | |
| Expression | CleanEX: HS_SLC30A2 | |
| BioGPS: 7780 | ||
| Pathway | NCI Pathway Interaction Database: SLC30A2 | |
| KEGG: SLC30A2 | ||
| REACTOME: SLC30A2 | ||
| Pathway Commons: SLC30A2 | ||
| Context | iHOP: SLC30A2 | |
| ligand binding site mutation search in PubMed: SLC30A2 | ||
| UCL Cancer Institute: SLC30A2 | ||
| Assigned class in TissGDB* | C | |
| Included tissue-specific gene expression resources | ||
| Specific-tissues in normal samples (assigned by TissGDB using HPA, TiGER, and GTEx) | KidneyPancreas | |
| Cancer types related to the specific-tissues in cancer samples (assigned by TissGDB using TCGA) | KIRC,KIRP,KICHPAAD | |
| Reference showing the relevant tissue of SLC30A2 | ||
| Description by TissGene annotations | ||
| * Class A consists of genes with literature evidence and is part of the cTissGenes. Class B consists of only cTissGenes without additional evidence. The remaining genes belong to Class C. |
| Gene ontology having evidence of Inferred from Direct Assay (IDA) from Entrez |
| GO ID | GO term | PubMed ID | GO:0061090 | positive regulation of sequestering of zinc ion | 17349999 | GO:0061090 | positive regulation of sequestering of zinc ion | 17349999 |
| Top |
| TissGeneExp for SLC30A2 |
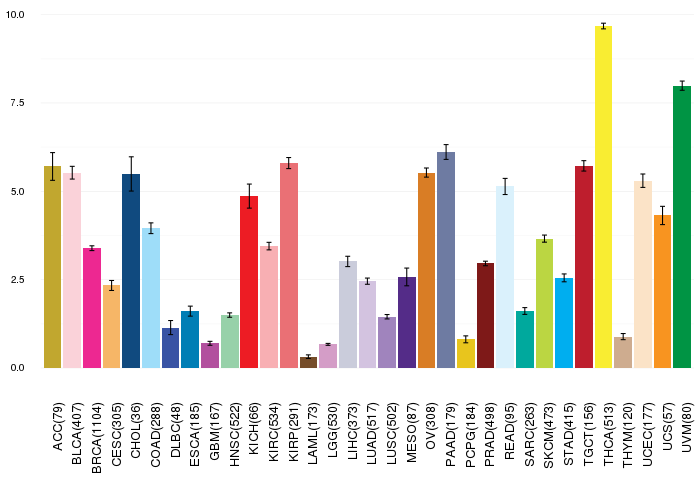
| Gene expressions across 28 cancer types (X-axis: cancer type and Y-axis: log2(norm_counts+1)) (TCGA IlluminaHiSeq_RNASeqV2, pan-cancer normalized log2(norm_counts+1) data, version 2016-08-16) |
 |
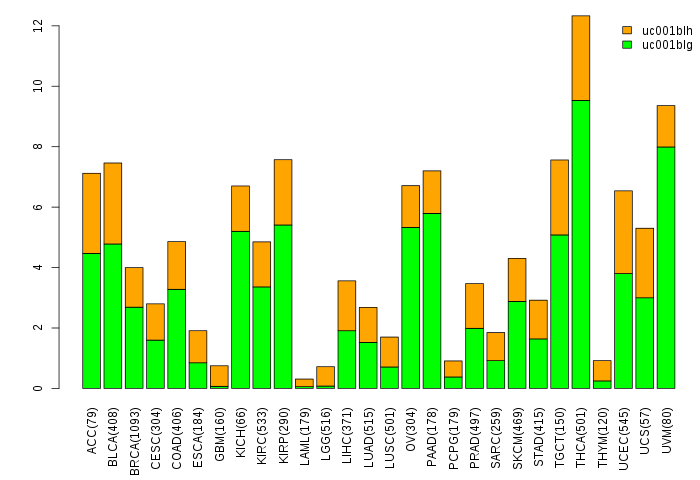
| Gene isoform expressions across 28 cancer types (X-axis: cancer type and Y-axis: log2(norm_counts+1)) (TCGA pan-cancer tcga_rsem_isoform_tpm, version 2016-09-01) |
 |
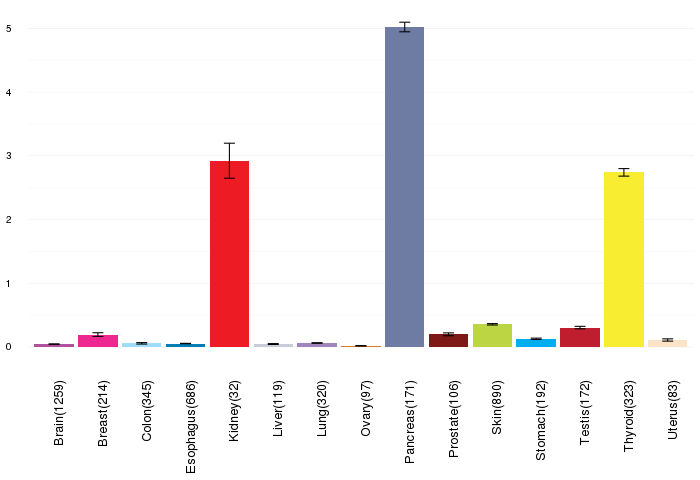
| Gene expressions across normal tissues of GTEx data (GTEx GTEx_Analysis_v6_RNA-seq_RNA-SeQCv1.1.8_gene_rpkm.gct) - Here, we shows the matched tissue types only among our 28 cancer types. |
 |
| Different expressions across 14 cancer types with more than 10 samples between matched tumors and normals (X-axis: cancer type and Y-axis: log2(norm_counts+1)) (TCGA IlluminaHiSeq_RNASeqV2, pan-cancer normalized log2(norm_counts+1) data, version 2016-08-16) |
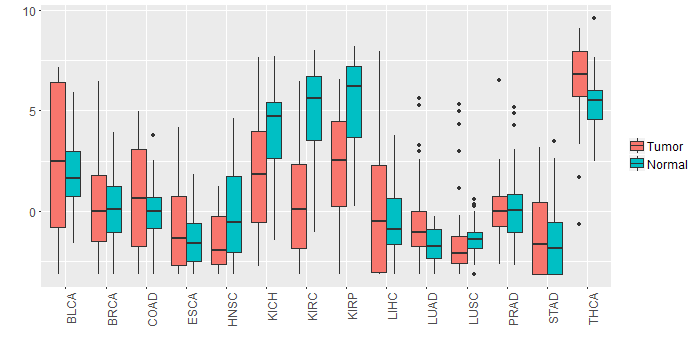 |
| - Significantly differentially expressed cancer types and information. (|Fold change|>1 and FDR<0.05) |
| Cancer type | Mean(exp) in tumor | Mean(exp) in matched normal | Log2FC | P-val. | FDR |
| KIRC | 0.383105972 | 5.035293472 | -4.6521875 | 7.87E-23 | 7.67E-22 |
| KICH | 1.977311139 | 4.251807139 | -2.274496 | 0.00425 | 0.008145217 |
| HNSC | -1.538413699 | 0.009267697 | -1.547681395 | 0.000249 | 0.000993351 |
| LUAD | -0.656990724 | -1.756442448 | 1.099451724 | 0.000281 | 0.000658603 |
| THCA | 6.588421579 | 5.407136833 | 1.181284746 | 4.66E-05 | 0.000134514 |
| KIRP | 2.171885139 | 5.148050764 | -2.976165625 | 3.56E-05 | 0.000134143 |
| Top |
| TissGene-miRNA for SLC30A2 |
| Significantly anti-correlated miRNAs of TissGene across 28 cancer types (Gene-miRNA relations from TargetScanHuman Relsease 7.1, Conserved_Site_Context_Scores.txt.zip, 06.01.2016) (TCGA IlluminaHiSeq_miRNASeq, log2(RPM+1) data, version 2016-11-21) (TCGA IlluminaHiSeq_RNASeqV2, log2(normalized_count+1) data, version 2016-08-16) (Spearman’s Rank Correlation (p-value<0.05 and coefficient<-0.25)) |
| Cancer type | miRNA id | miRNA accession | P-val. | Coeff. | # samples |
| Top |
| TissGeneMut for SLC30A2 |
| TissGeneSNV for SLC30A2 |
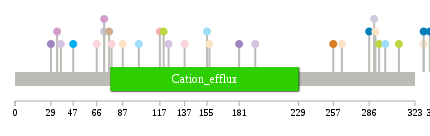
| nsSNV counts per each loci. Different colors of circles represent different cancer types. Circle size denotes number of samples. (TCGA somatic mutation (SNPs and small INDELs) data, version 2016-04-25) * Click on the image to enlarge it in a new window. |
 |
 |
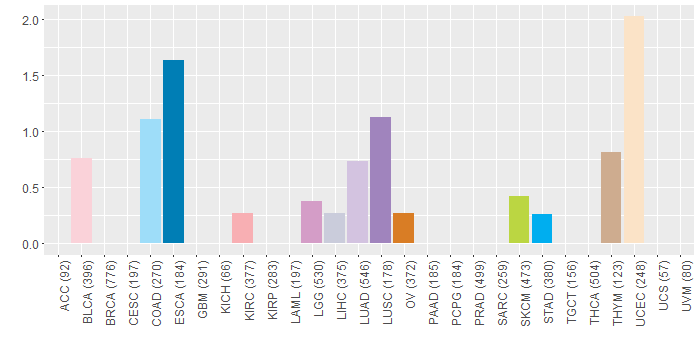
| Somatic nucleotide variants of TissGene across 28 cancer types (X-axis: cancer type and Y-axis: % of mutated samples) The numbers in parentheses are numbers of samples with mutation (nsSNVs). (TCGA somatic mutation (SNPs and small INDELs) data, version 2016-04-25) |
 |
| - nsSNVs sorted by frequency. |
| AAchange | Cancer type | # samples |
| p.V100A | COAD | 1 |
| p.E310G | SKCM | 1 |
| p.R72C | LUAD | 1 |
| p.F194V | HNSC | 1 |
| p.F194L | LUAD | 1 |
| p.K335M | ESCA | 1 |
| p.G37V | LUAD | 1 |
| p.G29C | LUSC | 1 |
| p.G294E | SKCM | 1 |
| p.A330T | UCEC | 1 |
| p.S124C | LUAD | 1 |
| p.L108I | HNSC | 1 |
| p.R72C | LGG | 1 |
| p.H348N | ESCA | 1 |
| p.S117T | KIRC | 1 |
| p.V257G | OV | 1 |
| p.Q137H | BLCA | 1 |
| p.P34A | LGG | 1 |
| p.T181M | LUSC | 1 |
| p.H299Y | COAD | 1 |
| p.V76E | THYM | 1 |
| p.A47V | STAD | 1 |
| p.S78C | BLCA | 1 |
| p.A330S | ESCA | 1 |
| p.S339C | LIHC | 1 |
| p.K286M | ESCA | 1 |
| p.G87R | UCEC | 1 |
| p.G264W | UCEC | 1 |
| p.K66N | BLCA | 1 |
| p.V157A | UCEC | 1 |
| p.R291C | UCEC | 1 |
| p.S120F | SKCM | 1 |
| p.S290C | LIHC | 1 |
| p.S155N | COAD | 1 |
| Top |
| TissGeneCNV for SLC30A2 |
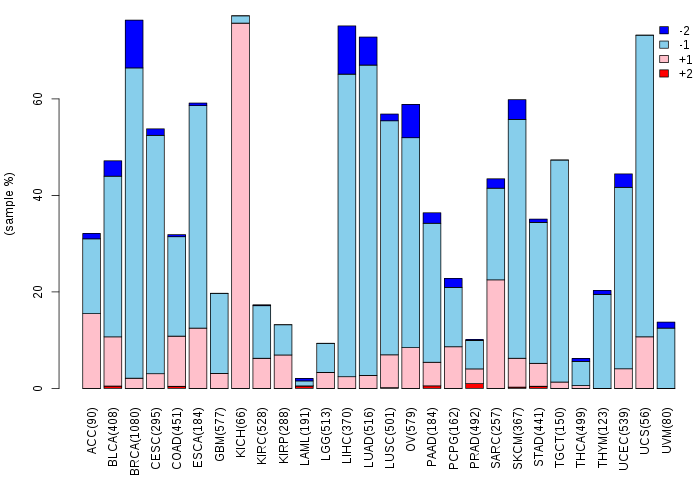
| Copy number variations of TissGene across 28 cancer types (X-axis: cancer type and Y-axis: % of CNV samples) (TCGA Gistic2_CopyNumber_Gistic2_all_data_by_genes, Gistic2 copy number data, version 2016-08-16) |
 |
| Top |
| TissGeneFusions for SLC30A2 |
| Fusion genes including TissGene (ChimerDB 3.0, 2016-12-01 and TCGA fusion Portal 2015-12-01) |
| Database | Src | Cancer type | Sample | Fusion gene | ORF | 5'-gene BP | 3'-gene BP |
| Top |
| TissGeneNet for SLC30A2 |
| Co-expressed gene networks based on protein-protein interaction data (CePIN) (TCGA IlluminaHiSeq_RNASeqV2, pan-cancer normalized log2(norm_counts+1) data, version 2016-08-16) (PINA2 ppi data) |
| Top |
| TissGeneProg for SLC30A2 |
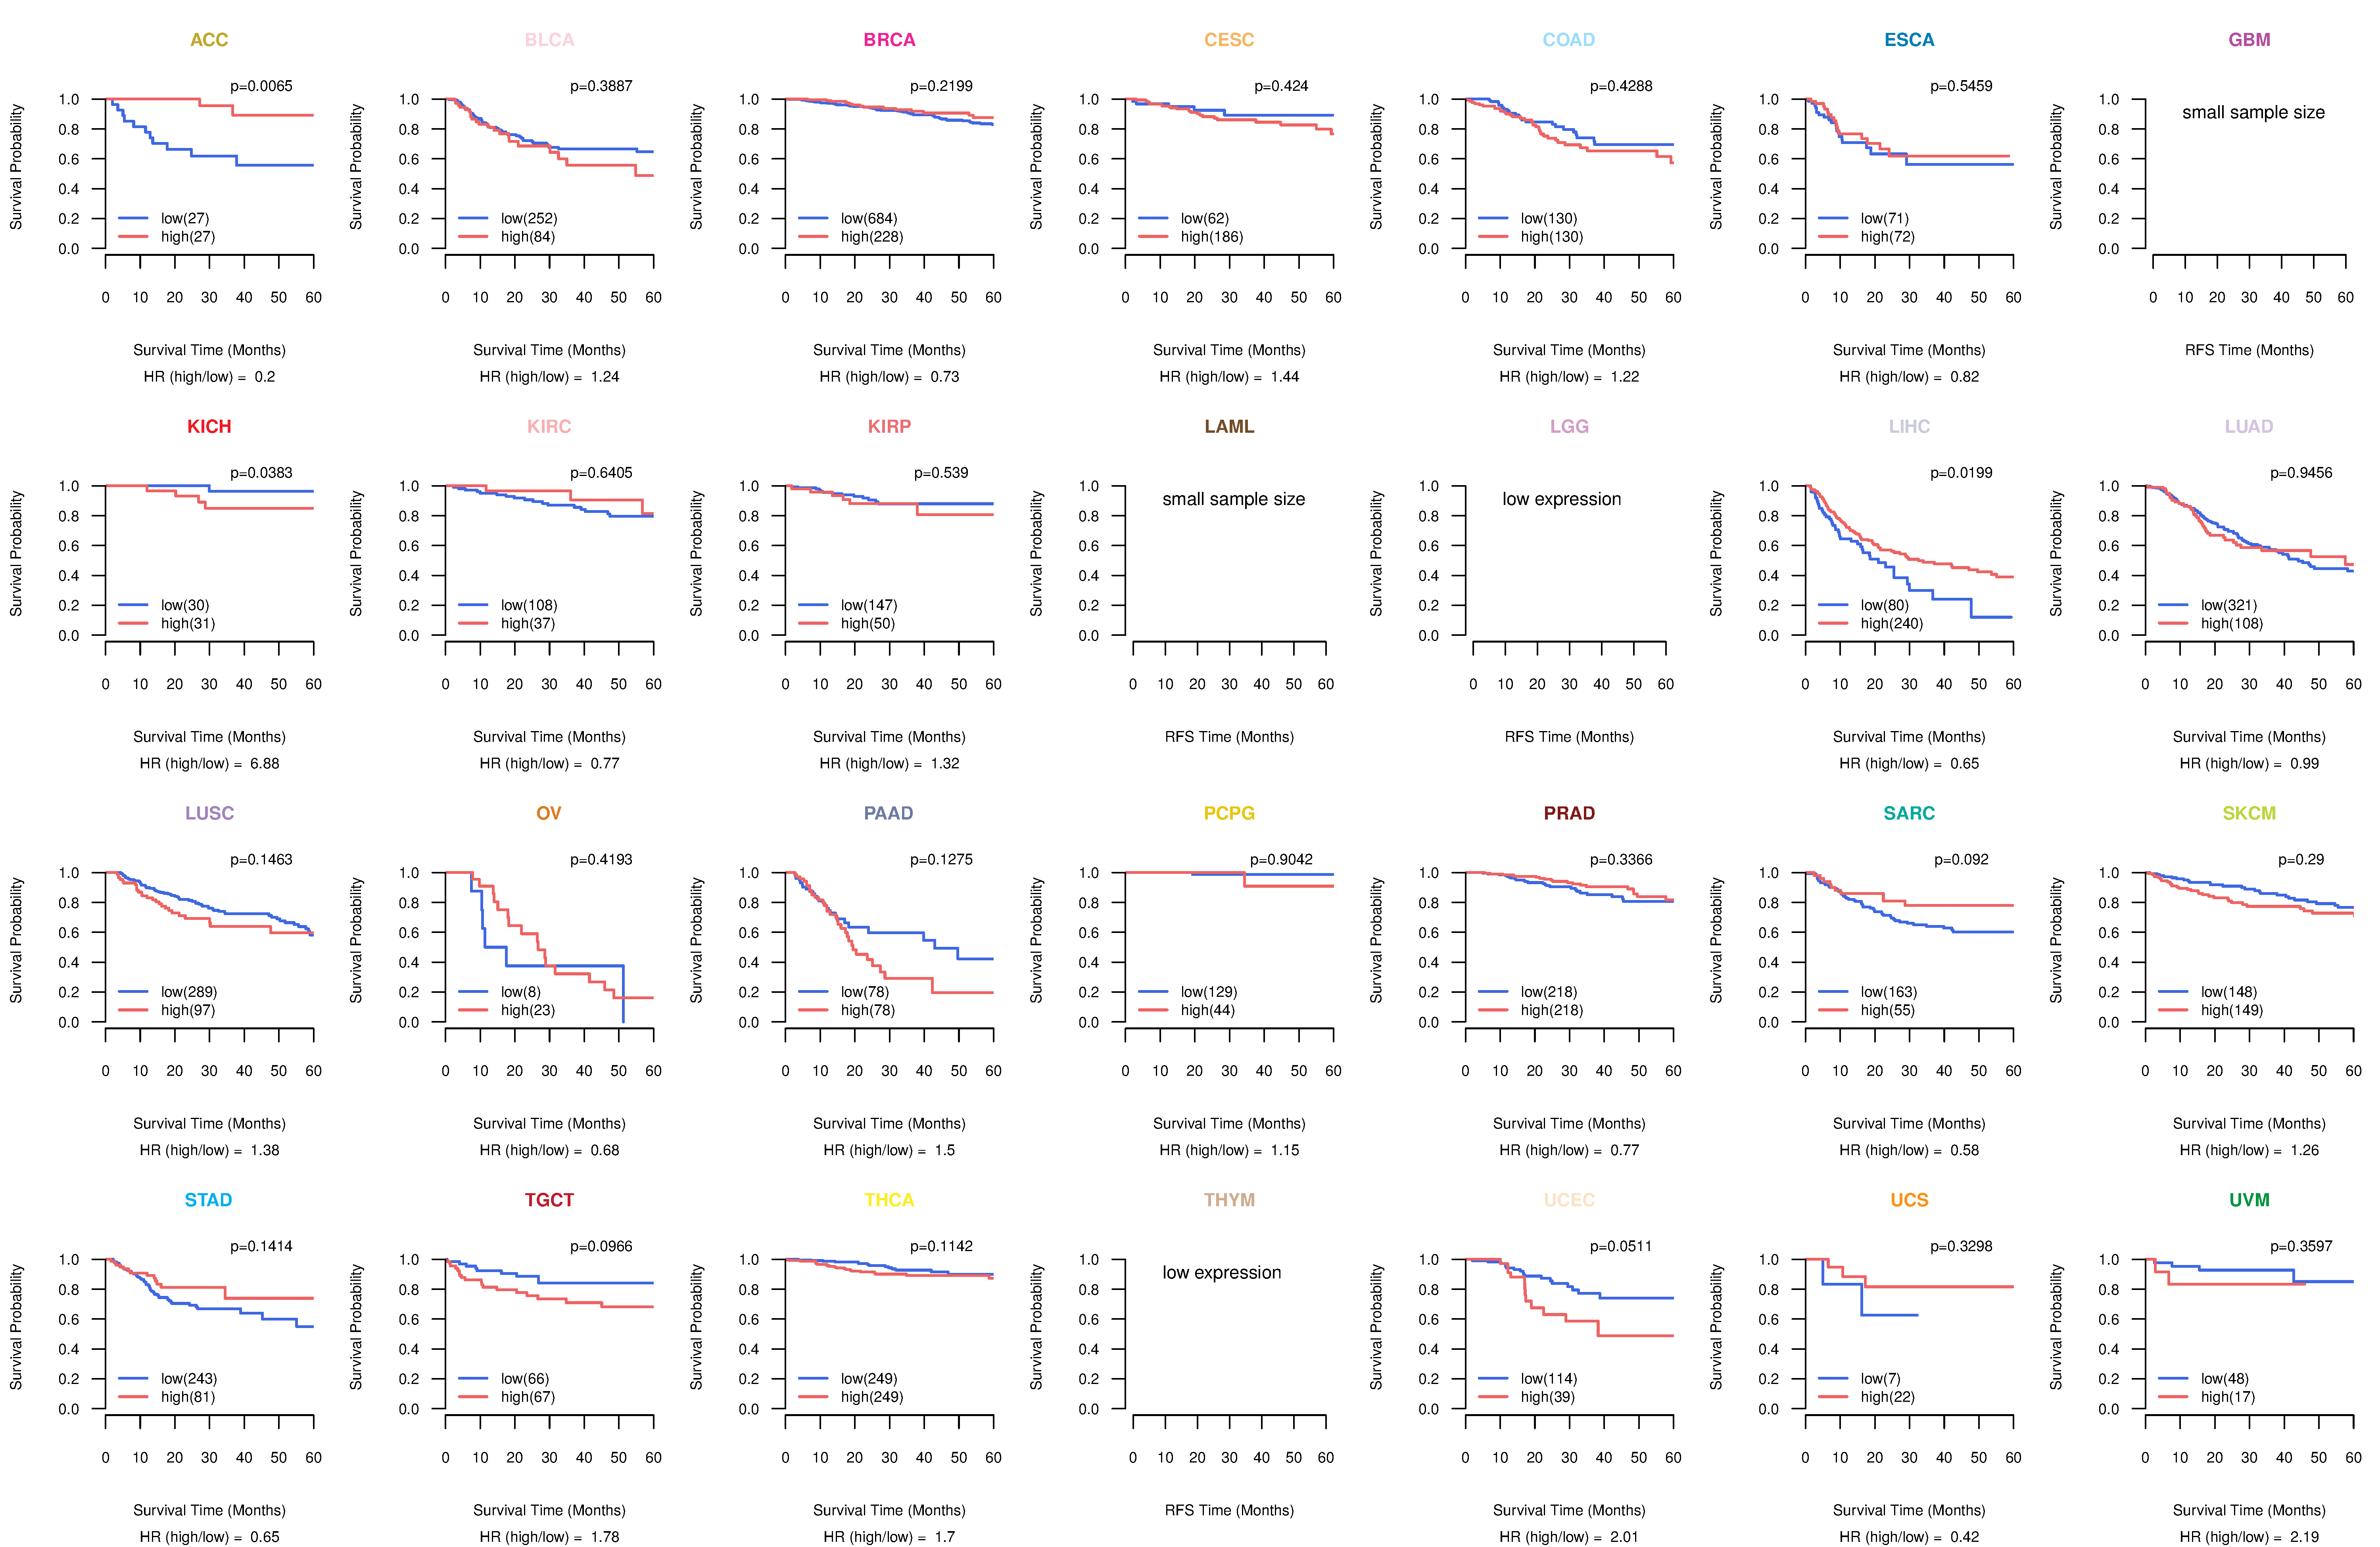
| Kaplan-Meier plots with logrank tests of overall survival (OS) using 28 cancer types (TCGA IlluminaHiSeq_RNASeqV2, pan-cancer normalized log2(norm_counts+1) data, version 2016-08-16) (TCGA clinicalMatrix, phenotype data, version 2016-04-27) * Click on the image to enlarge it in a new window. |
 |
| Kaplan-Meier plots with logrank test of relapse free survival (RFS) using 28 cancer types (TCGA IlluminaHiSeq_RNASeqV2, pan-cancer normalized log2(norm_counts+1) data, version 2016-08-16) (TCGA clinicalMatrix, phenotype data, version 2016-04-27) * Click on the image enlarge it in a new window. |
 |
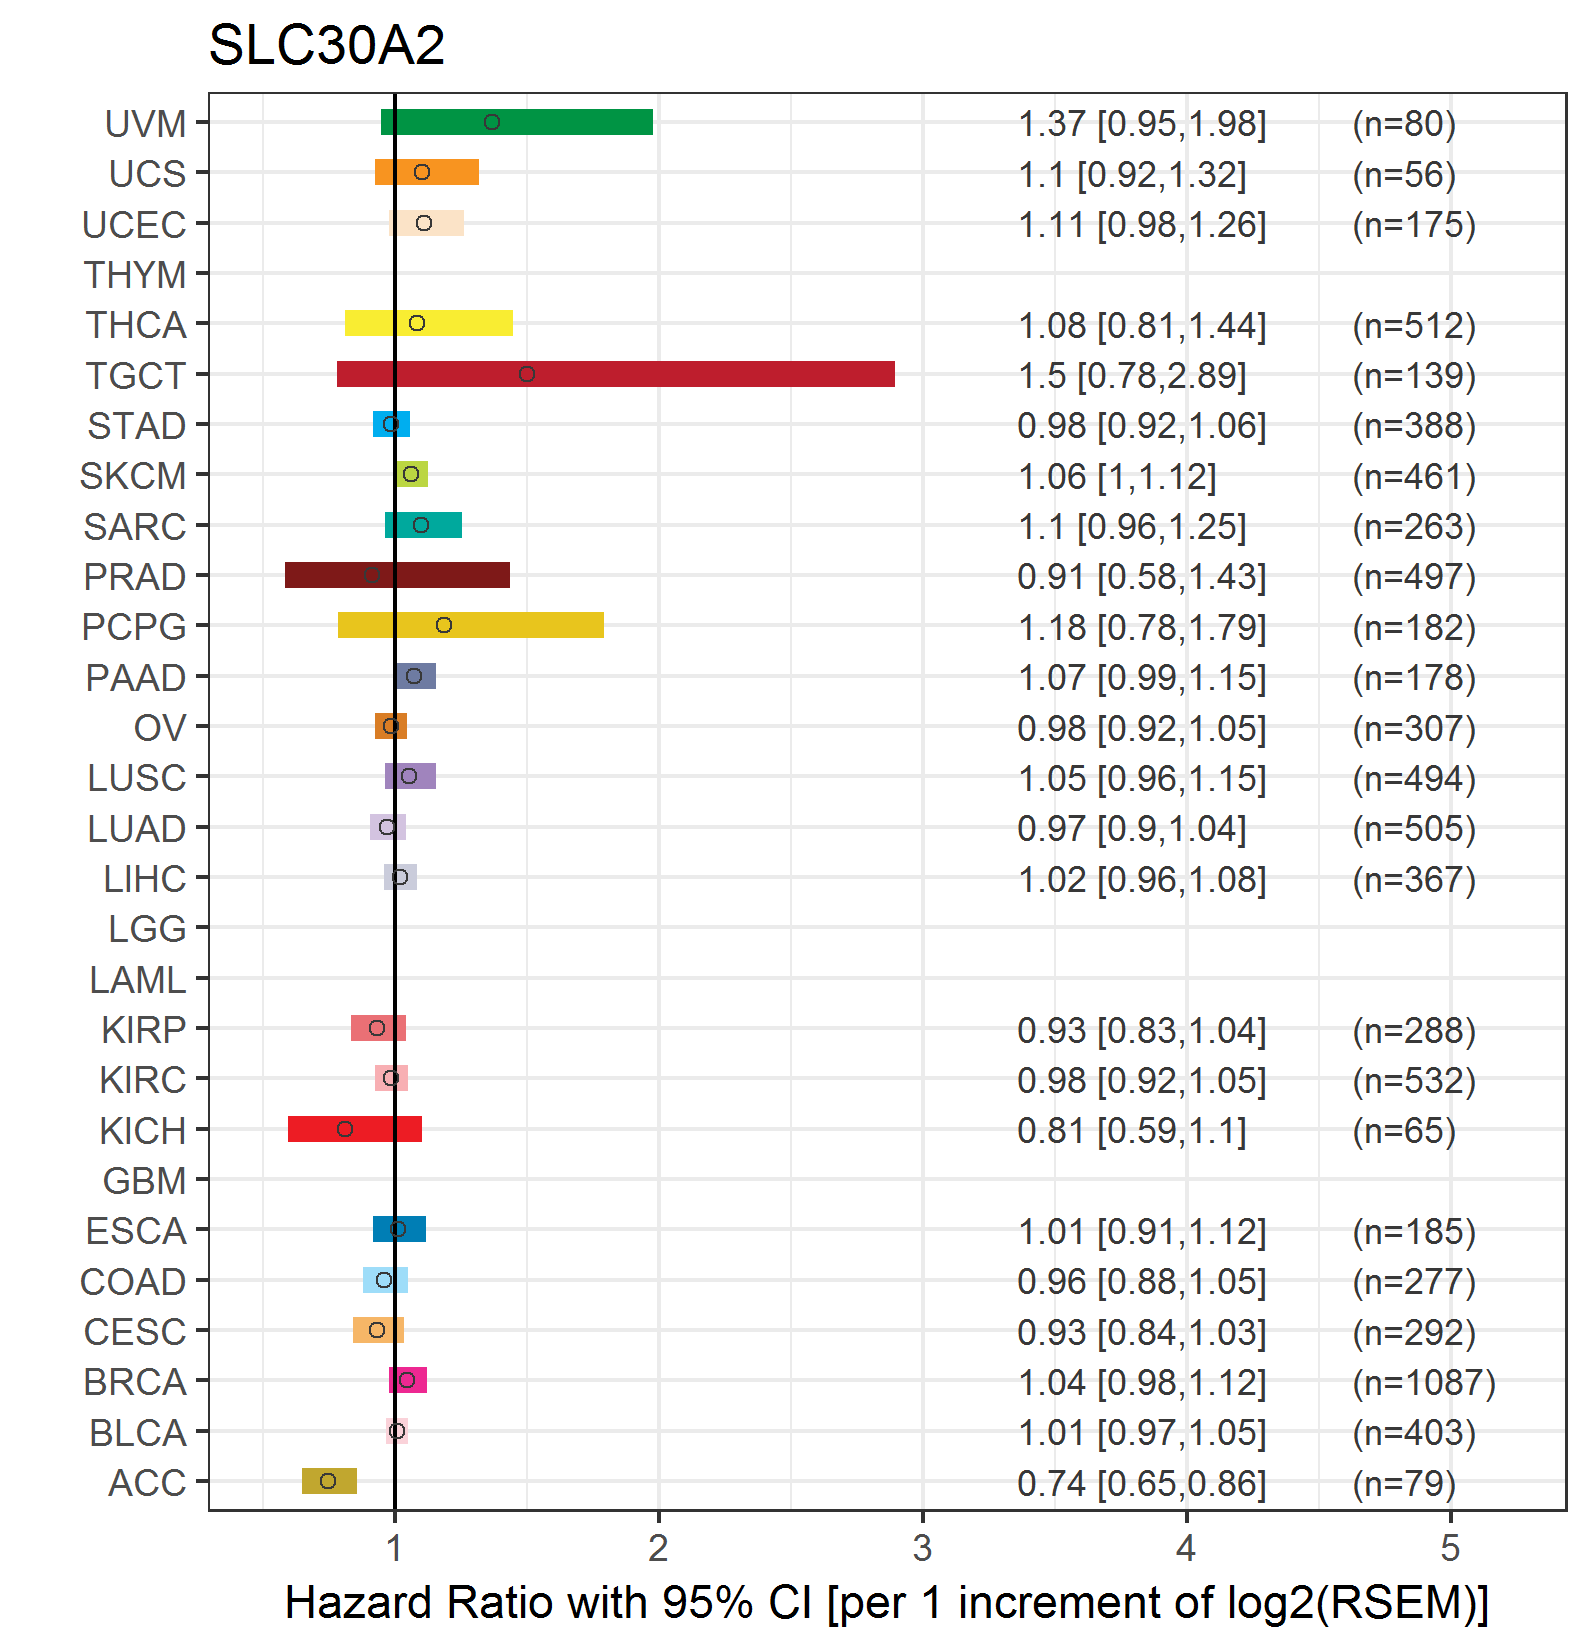
| Forest plot of Cox proportional hazard ratio (HR) and 95% CI of overall survival (OS) using 28 cancer types (TCGA IlluminaHiSeq_RNASeqV2, pan-cancer normalized log2(norm_counts+1) data, version 2016-08-16) (TCGA clinicalMatrix, phenotype data, version 2016-04-27) * Click on the image enlarge it in a new window. |
 |
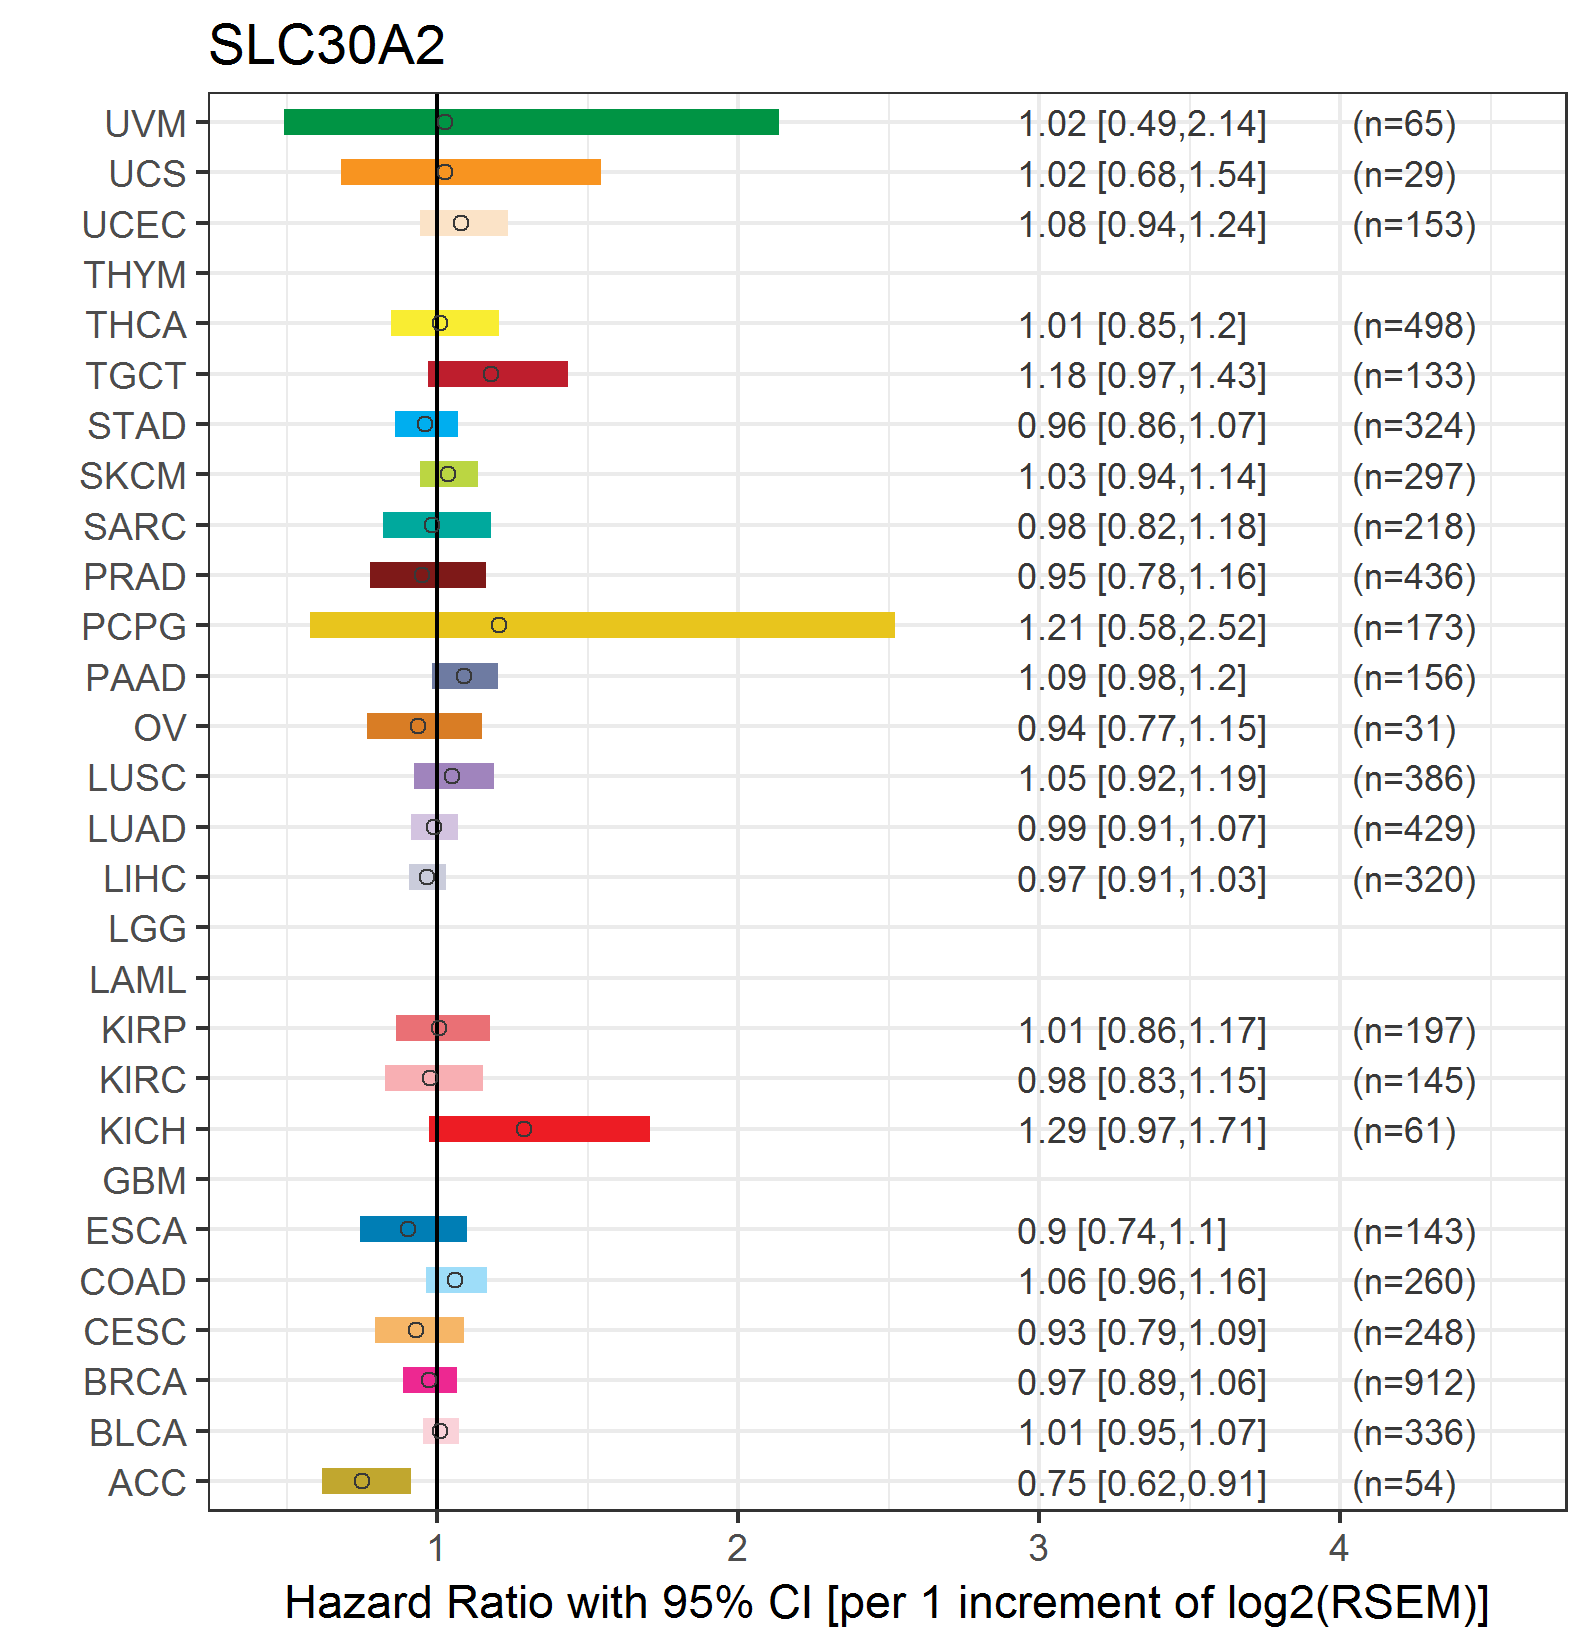
| Forest plot of Cox proportional hazard ratio (HR) and 95% CI of relapse free survival (RFS) using 28 cancer types (TCGA IlluminaHiSeq_RNASeqV2, pan-cancer normalized log2(norm_counts+1) data, version 2016-08-16) (TCGA clinicalMatrix, phenotype data, version 2016-04-27) * Click on the image enlarge it in a new window. |
 |
| Top |
| TissGeneClin for SLC30A2 |
| TissGeneDrug for SLC30A2 |
| Drug information targeting TissGene (DrugBank Version 5.0.6, 2017-04-01) |
| DrugBank ID | Drug name | Drug activity | Drug type | Drug status |
| Top |
| TissGeneDisease for SLC30A2 |
| Disease information associated with TissGene (DisGeNet, 2016-06-01) |
| Disease ID | Disease name | # pubmeds | Source |
| umls:C1842486 | Zinc Deficiency, Neonatal, due to Low Breast Milk Zinc | 3 | BeFree,CLINVAR,UNIPROT |
| umls:C0006142 | Malignant neoplasm of breast | 1 | BeFree |
| umls:C0006145 | Breast Diseases | 1 | BeFree |
| umls:C0376358 | Malignant neoplasm of prostate | 1 | GAD |
| umls:C1458155 | Mammary Neoplasms | 1 | BeFree |
|
Copyright 2016-Present - The University of Texas Health Science Center at Houston (UTHealth) Web File Viewing | How to Report, Fraud, Waste and Abuse | State of Texas | Statewide Search | Texas Homeland Security | Site Policies |