 |
| |
| |
| |
| |
| |
| |
|

| TissGeneSummary for SLC30A3 |
 Gene summary Gene summary |
| Basic gene information | Gene symbol | SLC30A3 |
| Gene name | solute carrier family 30 (zinc transporter), member 3 | |
| Synonyms | ZNT3 | |
| Cytomap | UCSC genome browser: 2p23.3 | |
| Type of gene | protein-coding | |
| RefGenes | NM_003459.4, | |
| Description | solute carrier family 30 member 3zinc transporter 3zinc transporter ZnT-3znT-3 | |
| Modification date | 20141207 | |
| dbXrefs | MIM : 602878 | |
| HGNC : HGNC | ||
| Ensembl : ENSG00000115194 | ||
| HPRD : 11924 | ||
| Vega : OTTHUMG00000128409 | ||
| Protein | UniProt: go to UniProt's Cross Reference DB Table | |
| Expression | CleanEX: HS_SLC30A3 | |
| BioGPS: 7781 | ||
| Pathway | NCI Pathway Interaction Database: SLC30A3 | |
| KEGG: SLC30A3 | ||
| REACTOME: SLC30A3 | ||
| Pathway Commons: SLC30A3 | ||
| Context | iHOP: SLC30A3 | |
| ligand binding site mutation search in PubMed: SLC30A3 | ||
| UCL Cancer Institute: SLC30A3 | ||
| Assigned class in TissGDB* | C | |
| Included tissue-specific gene expression resources | ||
| Specific-tissues in normal samples (assigned by TissGDB using HPA, TiGER, and GTEx) | Testis | |
| Cancer types related to the specific-tissues in cancer samples (assigned by TissGDB using TCGA) | TGCT | |
| Reference showing the relevant tissue of SLC30A3 | ||
| Description by TissGene annotations | ||
| * Class A consists of genes with literature evidence and is part of the cTissGenes. Class B consists of only cTissGenes without additional evidence. The remaining genes belong to Class C. |
| Gene ontology having evidence of Inferred from Direct Assay (IDA) from Entrez |
| GO ID | GO term | PubMed ID | GO:0061088 | regulation of sequestering of zinc ion | 17349999 | GO:0061088 | regulation of sequestering of zinc ion | 17349999 |
| Top |
| TissGeneExp for SLC30A3 |
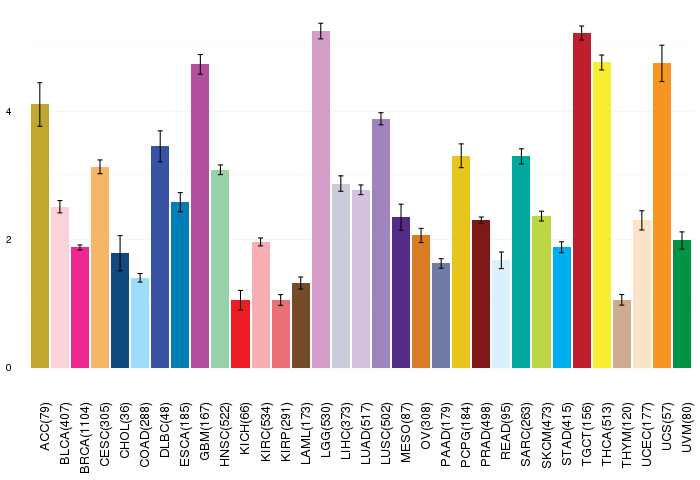
| Gene expressions across 28 cancer types (X-axis: cancer type and Y-axis: log2(norm_counts+1)) (TCGA IlluminaHiSeq_RNASeqV2, pan-cancer normalized log2(norm_counts+1) data, version 2016-08-16) |
 |
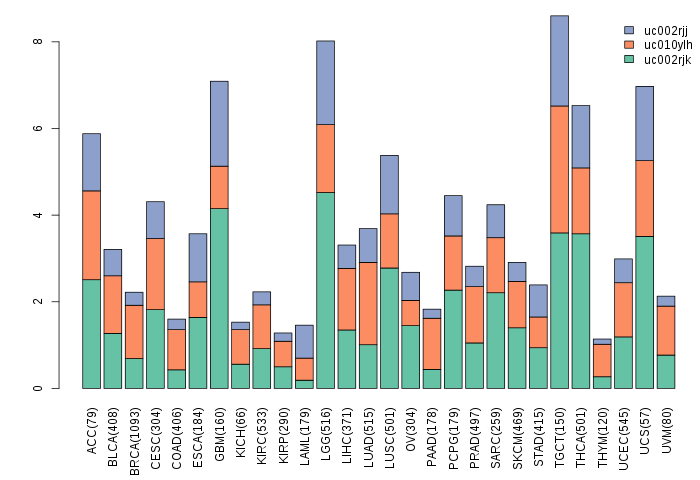
| Gene isoform expressions across 28 cancer types (X-axis: cancer type and Y-axis: log2(norm_counts+1)) (TCGA pan-cancer tcga_rsem_isoform_tpm, version 2016-09-01) |
 |
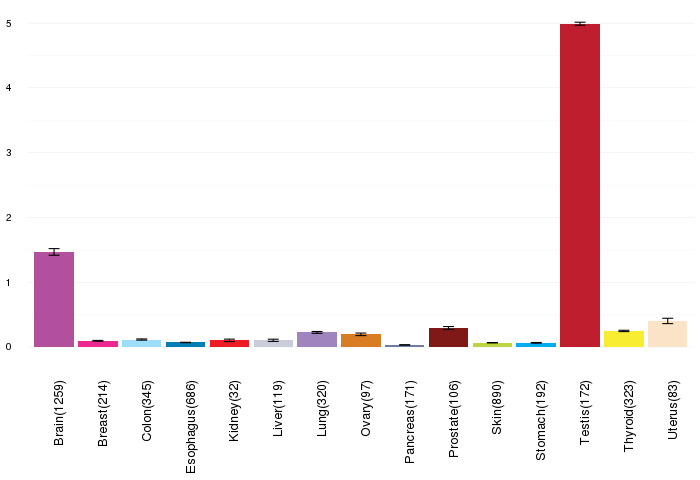
| Gene expressions across normal tissues of GTEx data (GTEx GTEx_Analysis_v6_RNA-seq_RNA-SeQCv1.1.8_gene_rpkm.gct) - Here, we shows the matched tissue types only among our 28 cancer types. |
 |
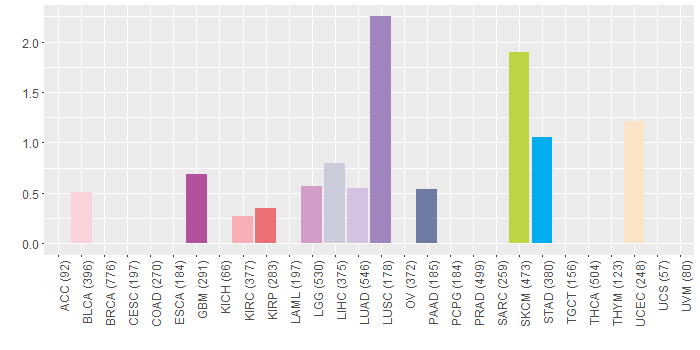
| Different expressions across 14 cancer types with more than 10 samples between matched tumors and normals (X-axis: cancer type and Y-axis: log2(norm_counts+1)) (TCGA IlluminaHiSeq_RNASeqV2, pan-cancer normalized log2(norm_counts+1) data, version 2016-08-16) |
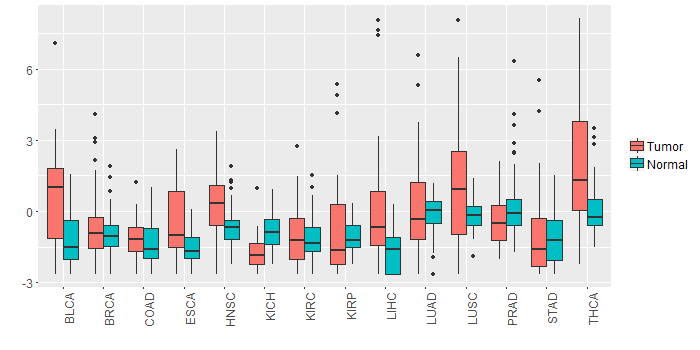 |
| - Significantly differentially expressed cancer types and information. (|Fold change|>1 and FDR<0.05) |
| Cancer type | Mean(exp) in tumor | Mean(exp) in matched normal | Log2FC | P-val. | FDR |
| LIHC | 0.068987156 | -1.672452844 | 1.74144 | 1.78E-05 | 7.10E-05 |
| THCA | 2.208208512 | 0.018879698 | 2.189328814 | 3.29E-07 | 1.34E-06 |
| BLCA | 0.698816629 | -1.220420213 | 1.919236842 | 0.0038 | 0.021504326 |
| LUSC | 0.989885979 | -0.119394413 | 1.109280392 | 0.00187 | 0.003339603 |
| Top |
| TissGene-miRNA for SLC30A3 |
| Significantly anti-correlated miRNAs of TissGene across 28 cancer types (Gene-miRNA relations from TargetScanHuman Relsease 7.1, Conserved_Site_Context_Scores.txt.zip, 06.01.2016) (TCGA IlluminaHiSeq_miRNASeq, log2(RPM+1) data, version 2016-11-21) (TCGA IlluminaHiSeq_RNASeqV2, log2(normalized_count+1) data, version 2016-08-16) (Spearman’s Rank Correlation (p-value<0.05 and coefficient<-0.25)) |
| Cancer type | miRNA id | miRNA accession | P-val. | Coeff. | # samples |
| Top |
| TissGeneMut for SLC30A3 |
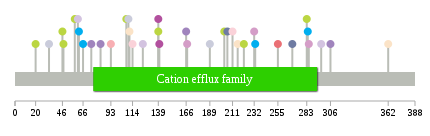
| TissGeneSNV for SLC30A3 |
| nsSNV counts per each loci. Different colors of circles represent different cancer types. Circle size denotes number of samples. (TCGA somatic mutation (SNPs and small INDELs) data, version 2016-04-25) * Click on the image to enlarge it in a new window. |
 |
 |
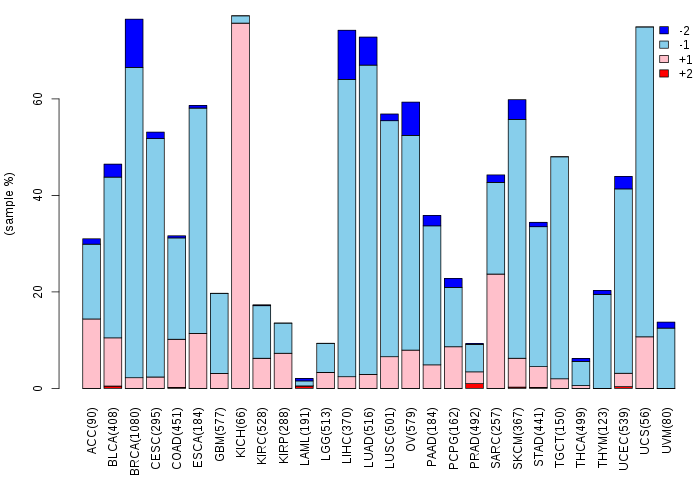
| Somatic nucleotide variants of TissGene across 28 cancer types (X-axis: cancer type and Y-axis: % of mutated samples) The numbers in parentheses are numbers of samples with mutation (nsSNVs). (TCGA somatic mutation (SNPs and small INDELs) data, version 2016-04-25) |
 |
| - nsSNVs sorted by frequency. |
| AAchange | Cancer type | # samples |
| p.L292F | READ | 1 |
| p.E222K | SKCM | 1 |
| p.L285F | LGG | 1 |
| p.R140H | GBM | 1 |
| p.P203S | SKCM | 1 |
| p.V166I | LUSC | 1 |
| p.A111V | UCEC | 1 |
| p.L33P | LIHC | 1 |
| p.K46E | SKCM | 1 |
| p.P297T | LUAD | 1 |
| p.L255V | KIRP | 1 |
| p.R167S | LGG | 1 |
| p.S206N | PAAD | 1 |
| p.E213K | HNSC | 1 |
| p.P47S | SKCM | 1 |
| p.R74S | LUSC | 1 |
| p.S269I | PAAD | 1 |
| p.G211E | BLCA | 1 |
| p.H139L | SKCM | 1 |
| p.P283L | SKCM | 1 |
| p.G114C | BLCA | 1 |
| p.R233W | STAD | 1 |
| p.T284A | STAD | 1 |
| p.C83F | LUSC | 1 |
| p.C189F | LIHC | 1 |
| p.P61Q | LUAD | 1 |
| p.W124* | LUAD | 1 |
| p.E68Q | HNSC | 1 |
| p.G93S | KIRC | 1 |
| p.D20N | SKCM | 1 |
| p.L110Q | LIHC | 1 |
| p.P62L | STAD | 1 |
| p.T66A | STAD | 1 |
| p.P216Q | UCEC | 1 |
| p.H139Y | GBM | 1 |
| p.V232I | LGG | 1 |
| p.G93D | READ | 1 |
| p.F362L | UCEC | 1 |
| p.D58N | SKCM | 1 |
| p.R306Q | LUSC | 1 |
| p.H108L | SKCM | 1 |
| Top |
| TissGeneCNV for SLC30A3 |
| Copy number variations of TissGene across 28 cancer types (X-axis: cancer type and Y-axis: % of CNV samples) (TCGA Gistic2_CopyNumber_Gistic2_all_data_by_genes, Gistic2 copy number data, version 2016-08-16) |
 |
| Top |
| TissGeneFusions for SLC30A3 |
| Fusion genes including TissGene (ChimerDB 3.0, 2016-12-01 and TCGA fusion Portal 2015-12-01) |
| Database | Src | Cancer type | Sample | Fusion gene | ORF | 5'-gene BP | 3'-gene BP |
| Top |
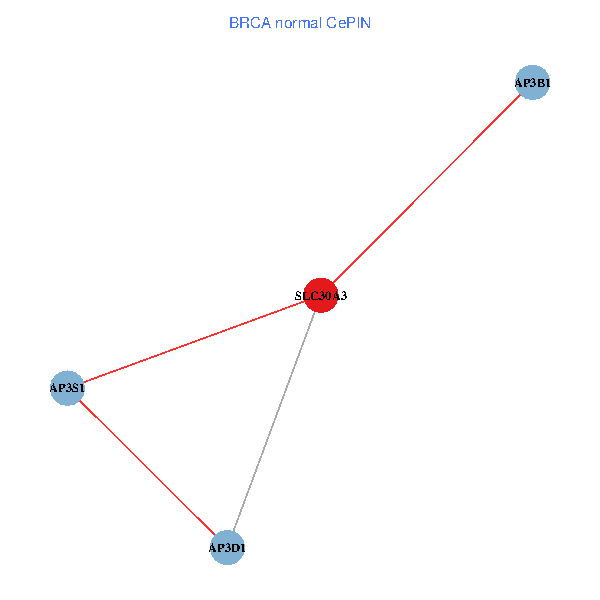
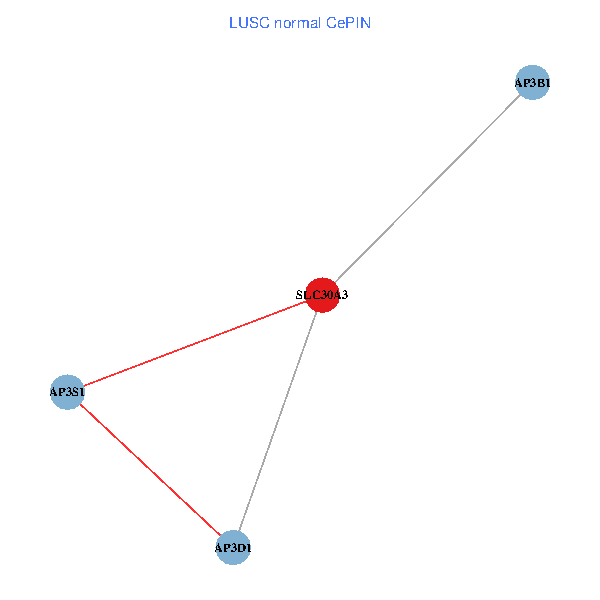
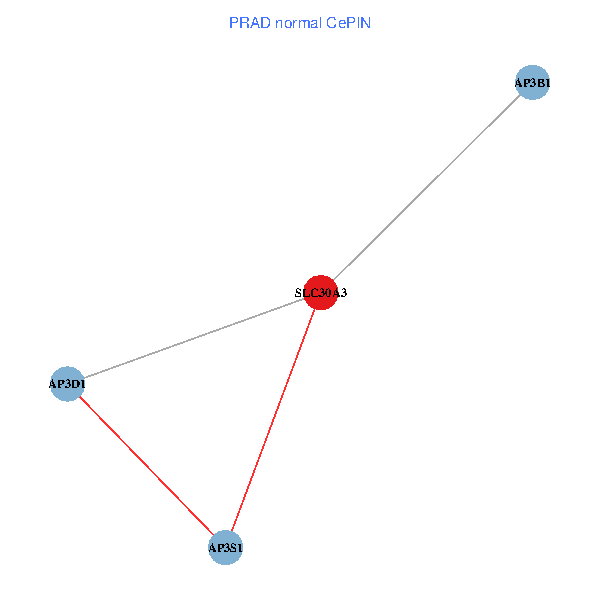
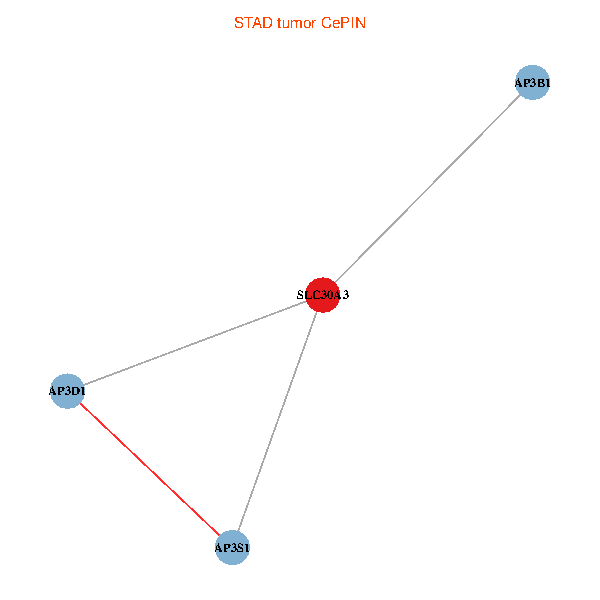
| TissGeneNet for SLC30A3 |
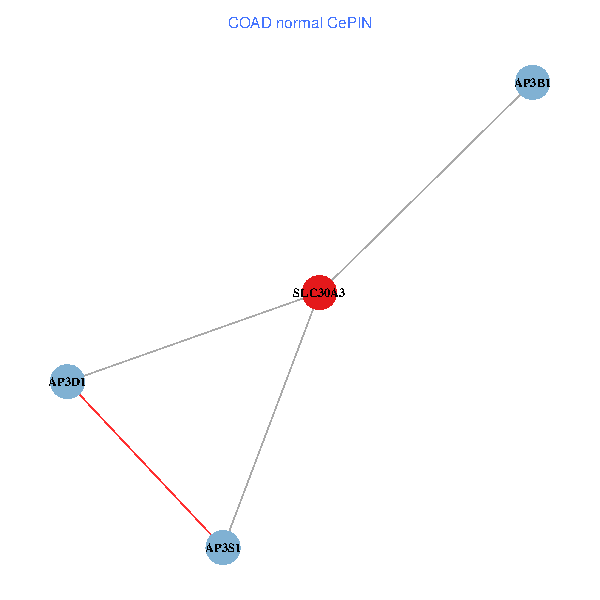
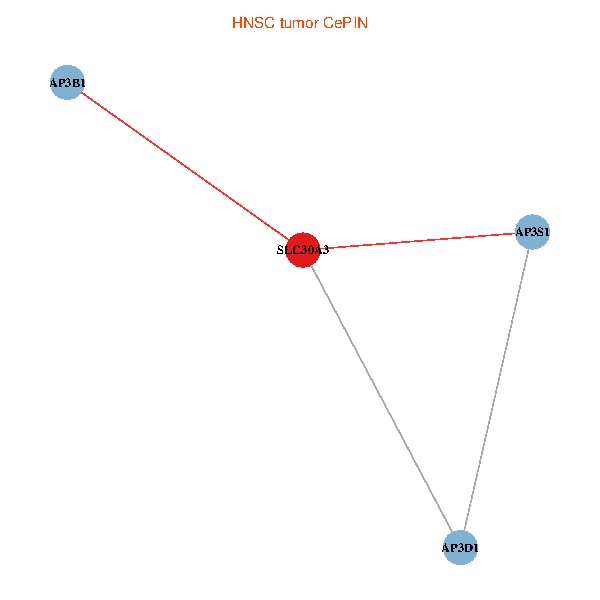
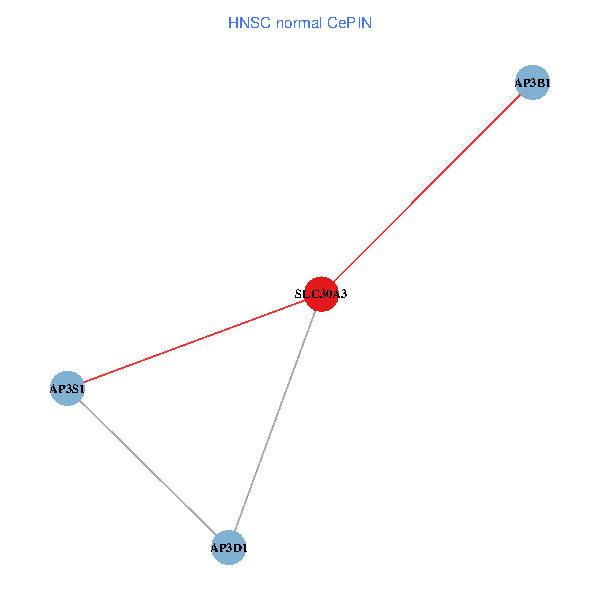
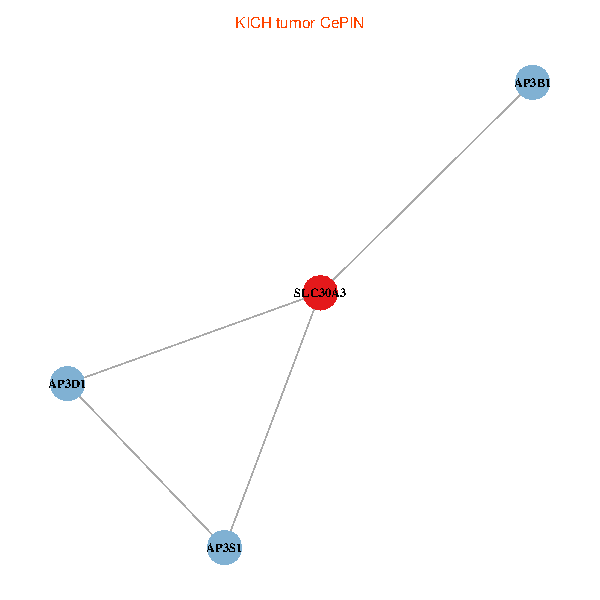
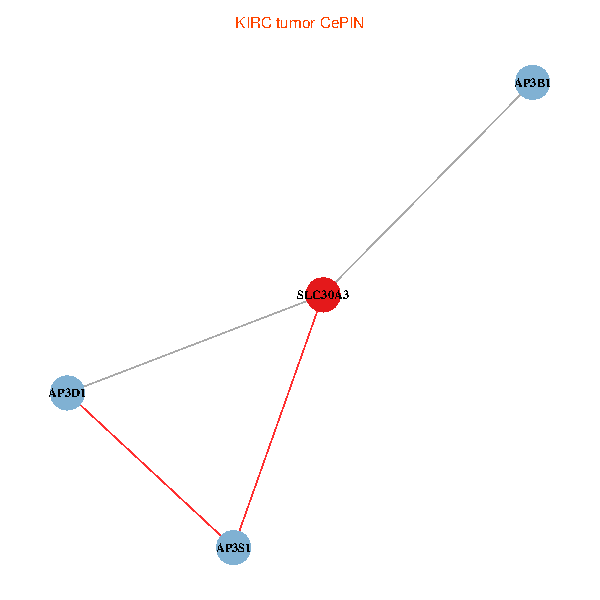
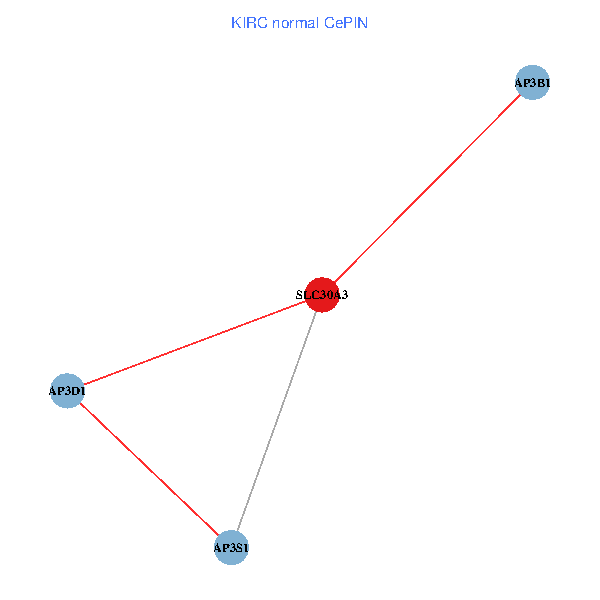
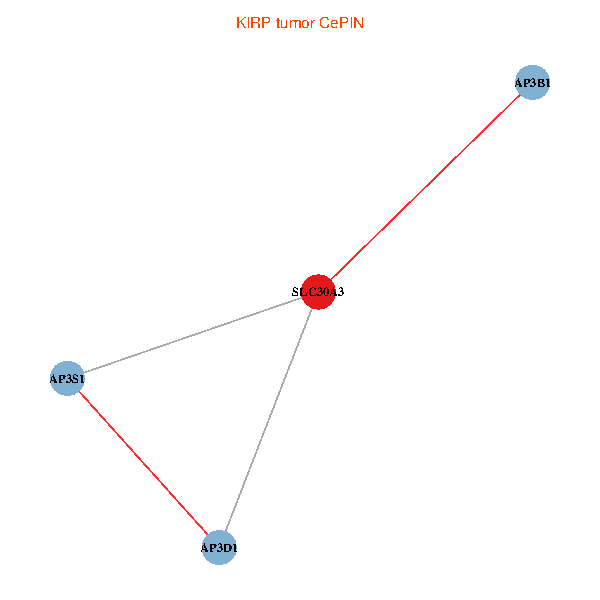
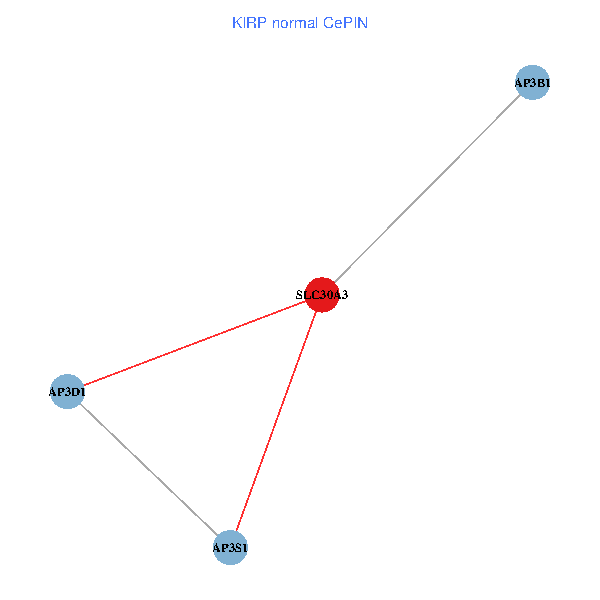
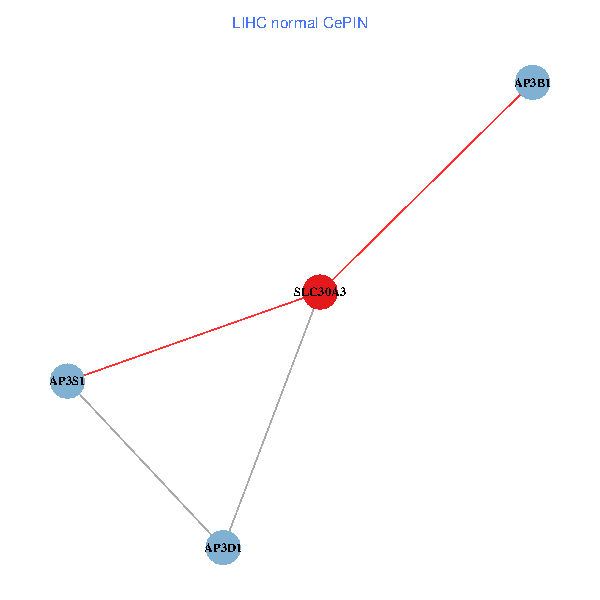
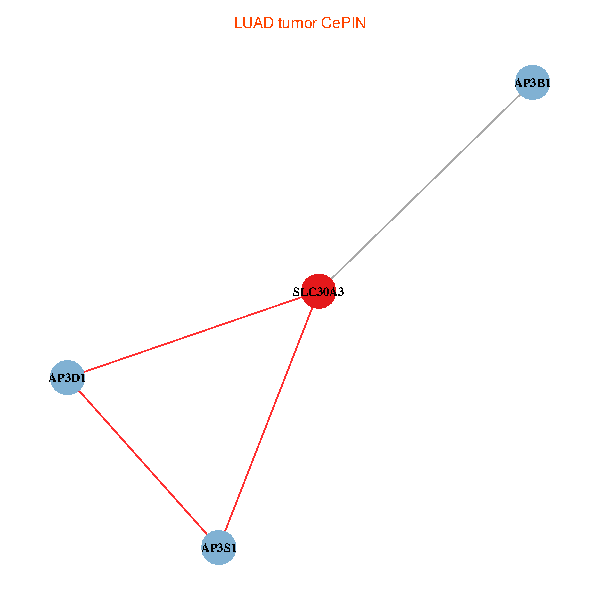
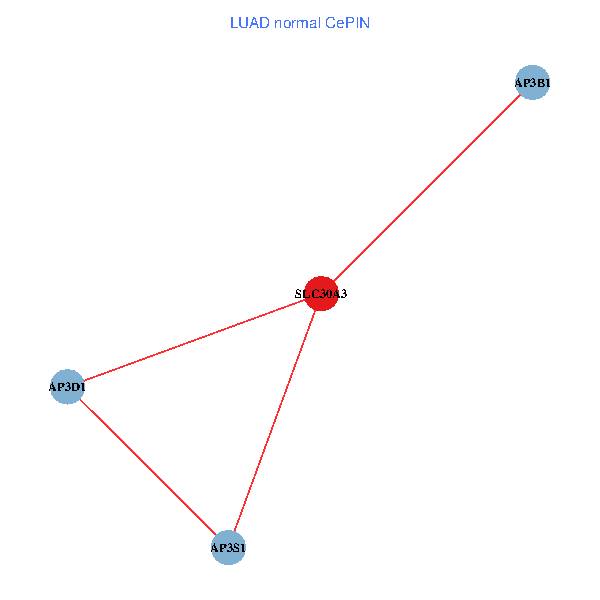
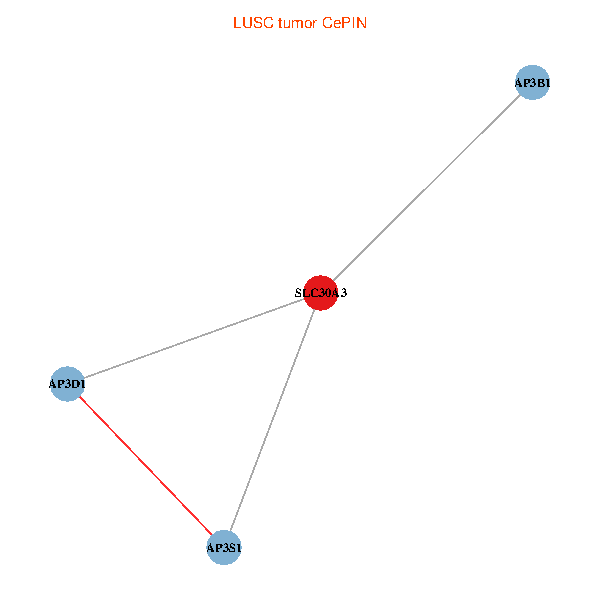
| Co-expressed gene networks based on protein-protein interaction data (CePIN) (TCGA IlluminaHiSeq_RNASeqV2, pan-cancer normalized log2(norm_counts+1) data, version 2016-08-16) (PINA2 ppi data) |
| BRCA (tumor) | BRCA (normal) |
| SLC30A3, AP3S1, AP3D1, AP3B1 (tumor) | SLC30A3, AP3S1, AP3D1, AP3B1 (normal) |
 |  |
| COAD (tumor) | COAD (normal) |
| SLC30A3, AP3S1, AP3D1, AP3B1 (tumor) | SLC30A3, AP3S1, AP3D1, AP3B1 (normal) |
 |  |
| HNSC (tumor) | HNSC (normal) |
| SLC30A3, AP3S1, AP3D1, AP3B1 (tumor) | SLC30A3, AP3S1, AP3D1, AP3B1 (normal) |
 |  |
| KICH (tumor) | KICH (normal) |
| SLC30A3, AP3S1, AP3D1, AP3B1 (tumor) | SLC30A3, AP3S1, AP3D1, AP3B1 (normal) |
 |  |
| KIRC (tumor) | KIRC (normal) |
| SLC30A3, AP3S1, AP3D1, AP3B1 (tumor) | SLC30A3, AP3S1, AP3D1, AP3B1 (normal) |
 |  |
| KIRP (tumor) | KIRP (normal) |
| SLC30A3, AP3S1, AP3D1, AP3B1 (tumor) | SLC30A3, AP3S1, AP3D1, AP3B1 (normal) |
 |  |
| LIHC (tumor) | LIHC (normal) |
| SLC30A3, AP3S1, AP3D1, AP3B1 (tumor) | SLC30A3, AP3S1, AP3D1, AP3B1 (normal) |
 |  |
| LUAD (tumor) | LUAD (normal) |
| SLC30A3, AP3S1, AP3D1, AP3B1 (tumor) | SLC30A3, AP3S1, AP3D1, AP3B1 (normal) |
 |  |
| LUSC (tumor) | LUSC (normal) |
| SLC30A3, AP3S1, AP3D1, AP3B1 (tumor) | SLC30A3, AP3S1, AP3D1, AP3B1 (normal) |
 |  |
| PRAD (tumor) | PRAD (normal) |
| SLC30A3, AP3S1, AP3D1, AP3B1 (tumor) | SLC30A3, AP3S1, AP3D1, AP3B1 (normal) |
 |  |
| STAD (tumor) | STAD (normal) |
| SLC30A3, AP3S1, AP3D1, AP3B1 (tumor) | SLC30A3, AP3S1, AP3D1, AP3B1 (normal) |
 |  |
| THCA (tumor) | THCA (normal) |
| SLC30A3, AP3S1, AP3D1, AP3B1 (tumor) | SLC30A3, AP3S1, AP3D1, AP3B1 (normal) |
 |  |
| Top |
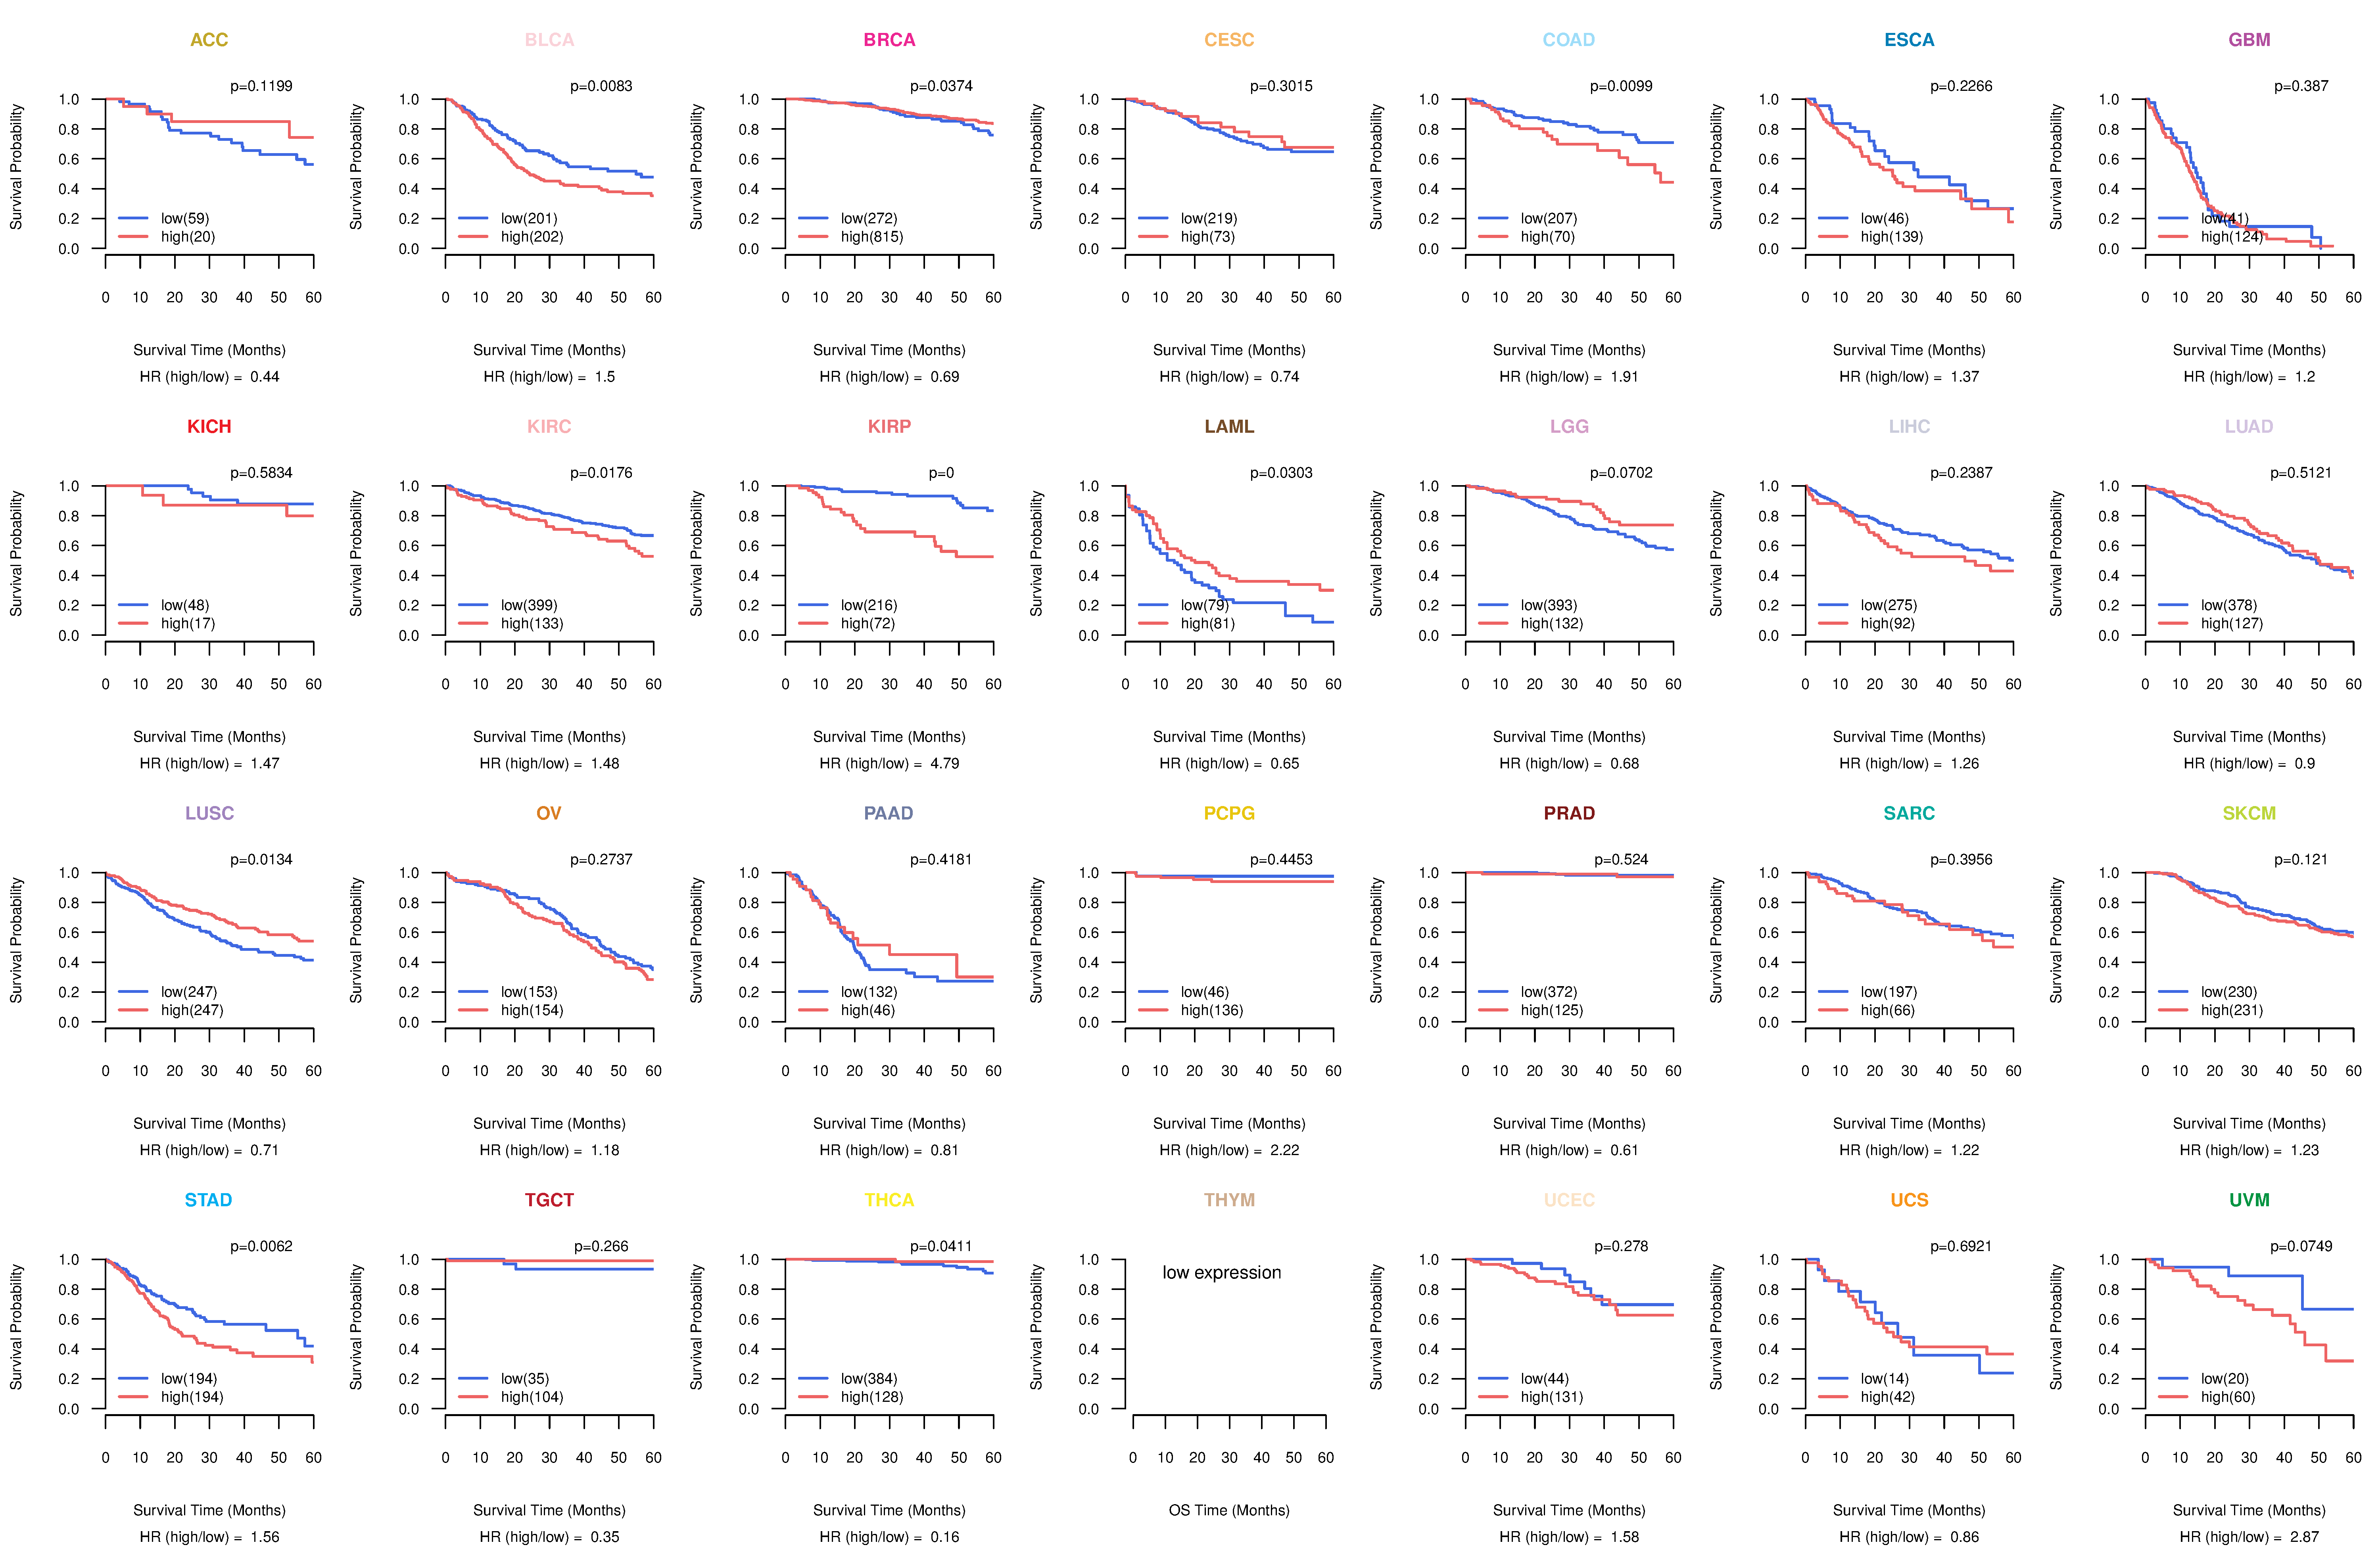
| TissGeneProg for SLC30A3 |
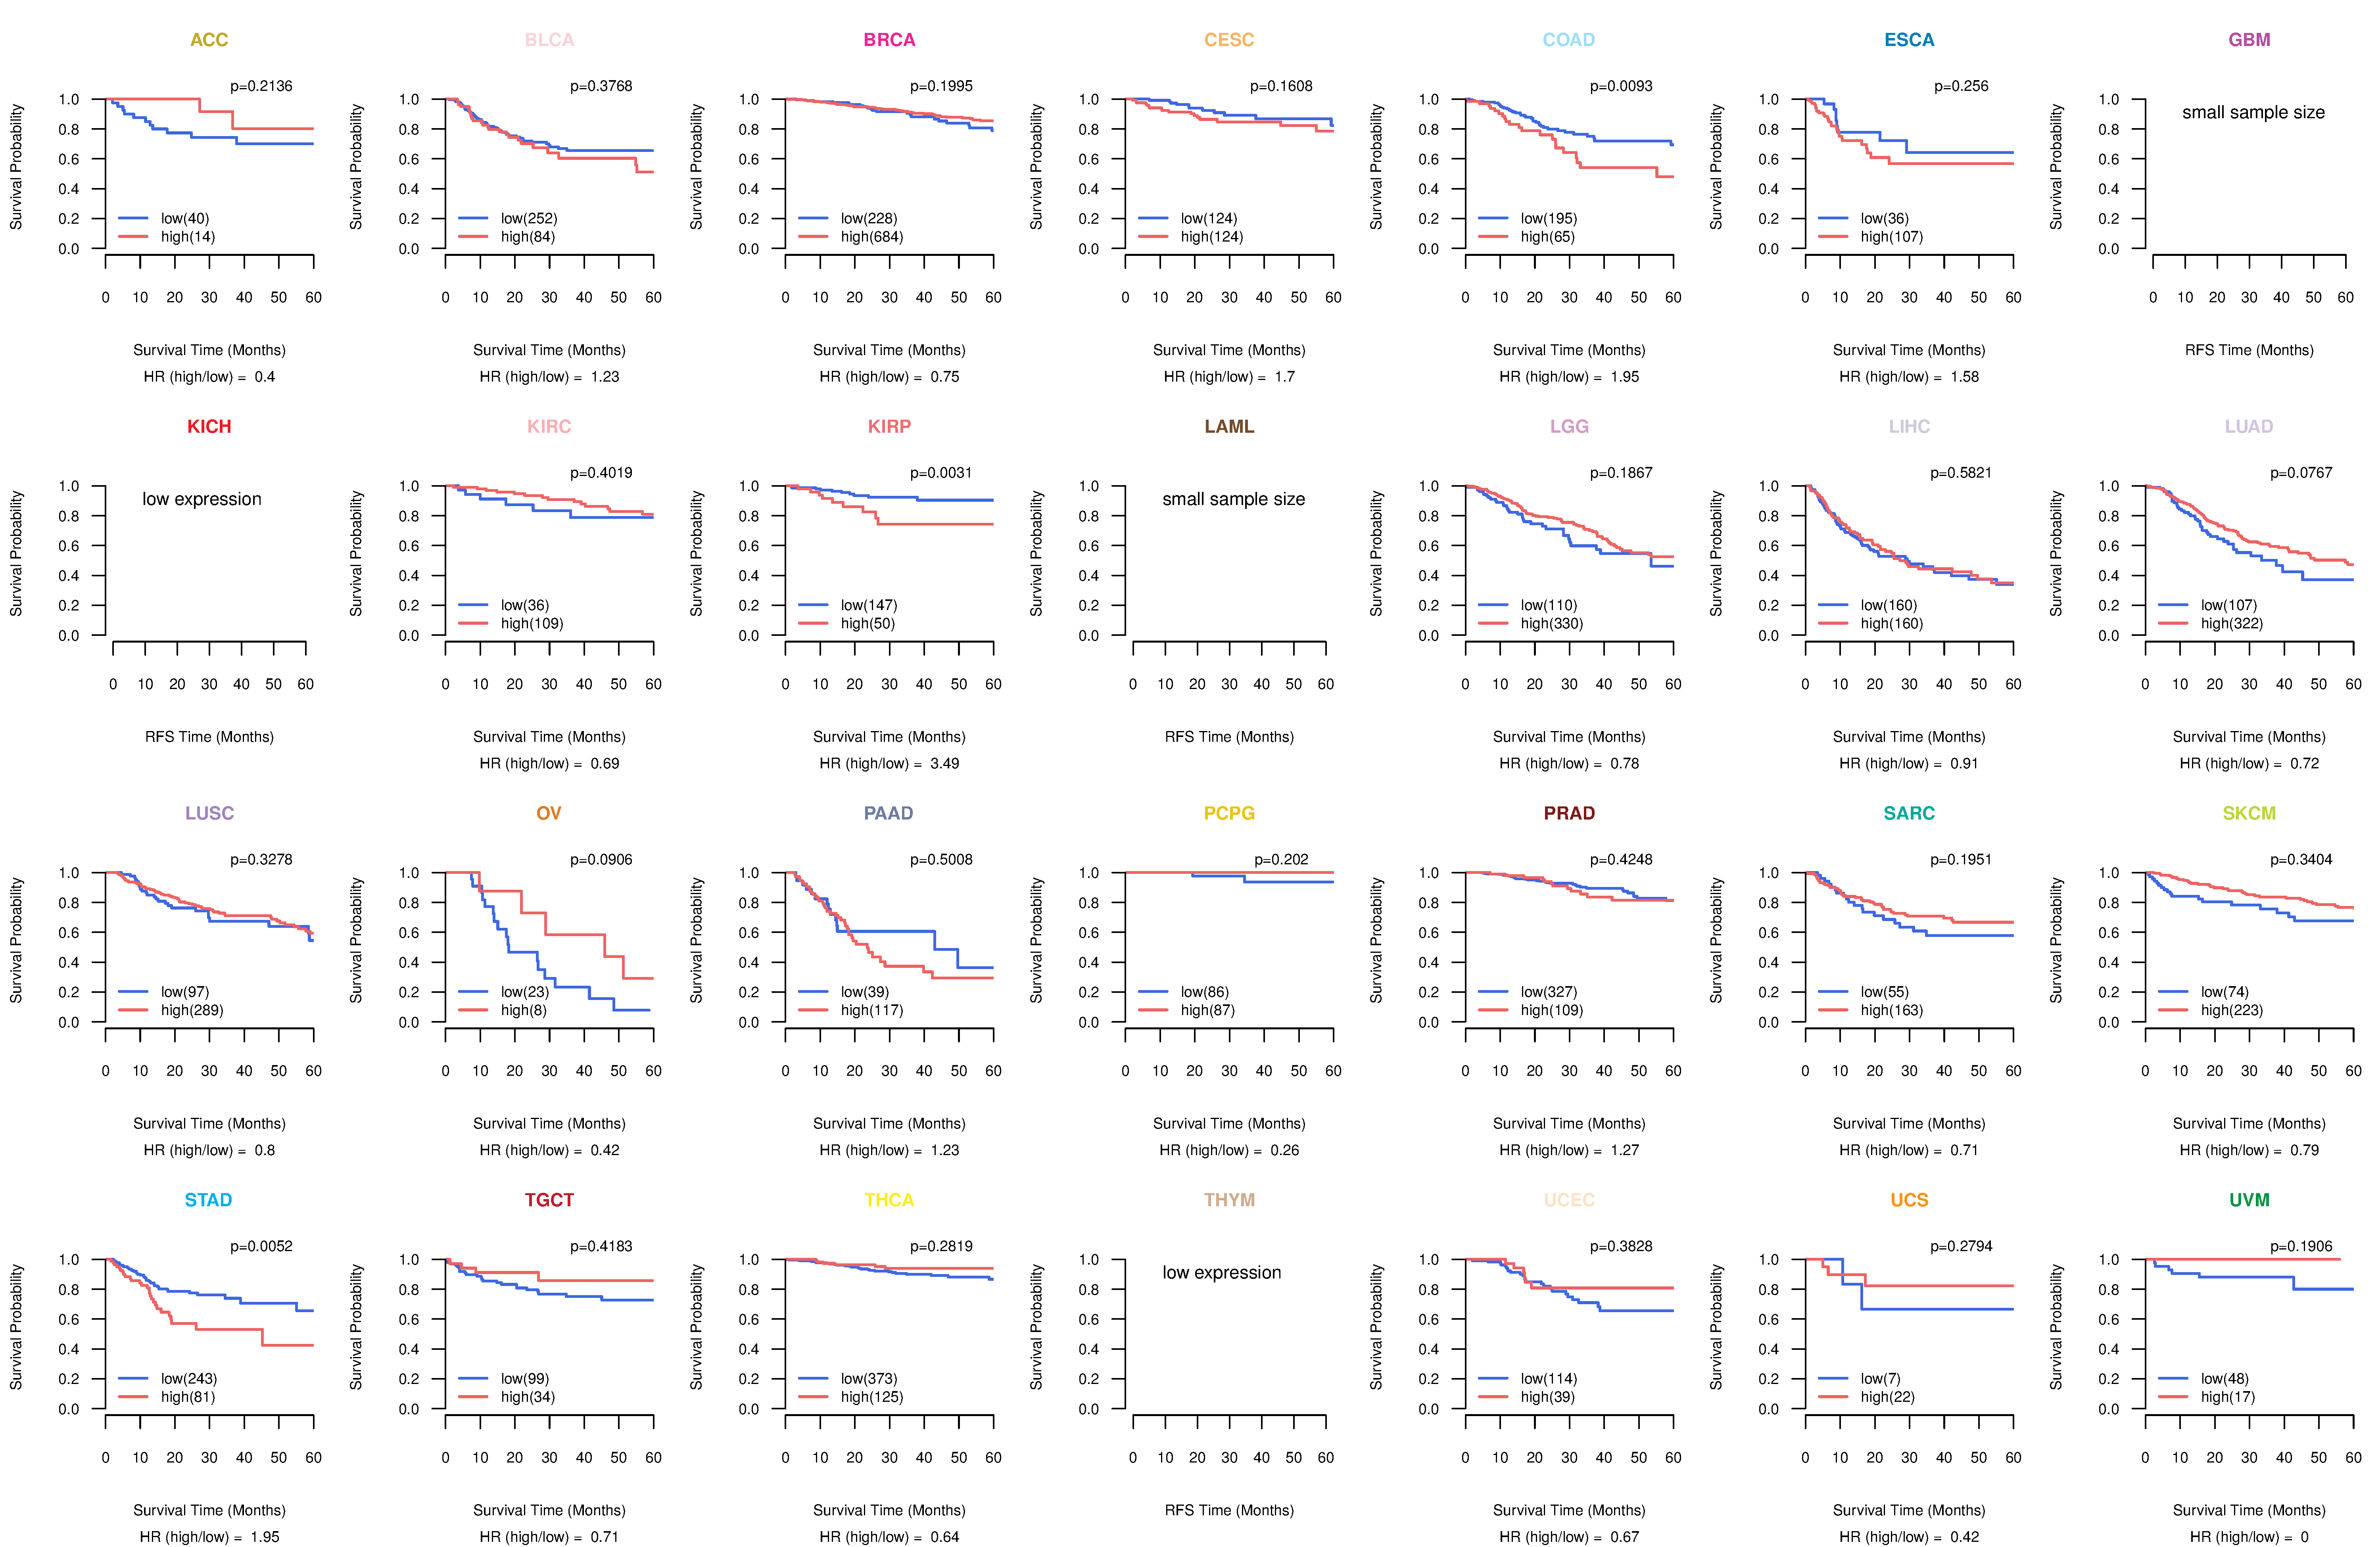
| Kaplan-Meier plots with logrank tests of overall survival (OS) using 28 cancer types (TCGA IlluminaHiSeq_RNASeqV2, pan-cancer normalized log2(norm_counts+1) data, version 2016-08-16) (TCGA clinicalMatrix, phenotype data, version 2016-04-27) * Click on the image to enlarge it in a new window. |
 |
| Kaplan-Meier plots with logrank test of relapse free survival (RFS) using 28 cancer types (TCGA IlluminaHiSeq_RNASeqV2, pan-cancer normalized log2(norm_counts+1) data, version 2016-08-16) (TCGA clinicalMatrix, phenotype data, version 2016-04-27) * Click on the image enlarge it in a new window. |
 |
| Forest plot of Cox proportional hazard ratio (HR) and 95% CI of overall survival (OS) using 28 cancer types (TCGA IlluminaHiSeq_RNASeqV2, pan-cancer normalized log2(norm_counts+1) data, version 2016-08-16) (TCGA clinicalMatrix, phenotype data, version 2016-04-27) * Click on the image enlarge it in a new window. |
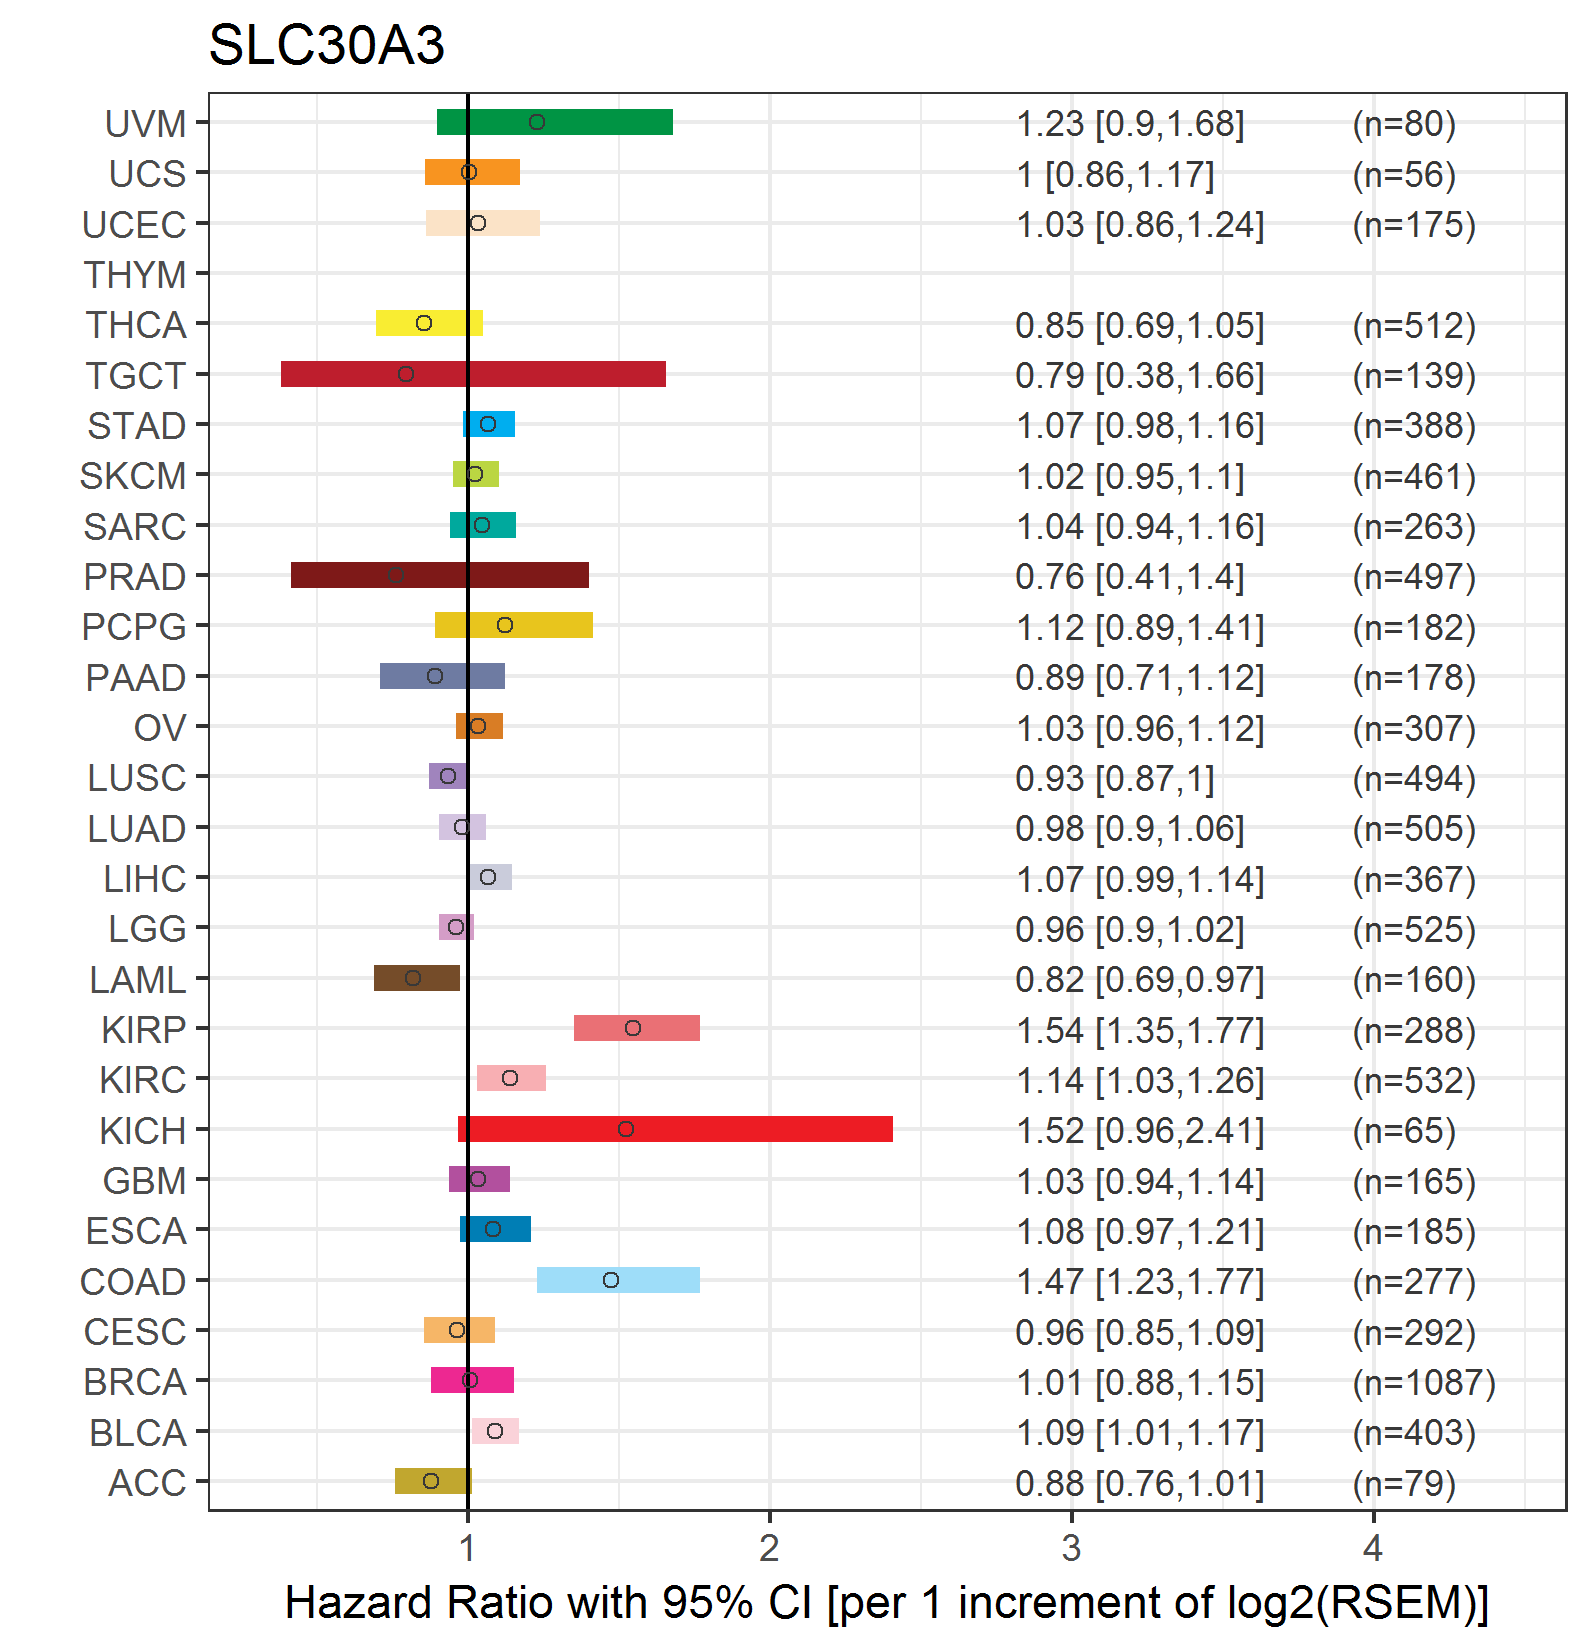 |
| Forest plot of Cox proportional hazard ratio (HR) and 95% CI of relapse free survival (RFS) using 28 cancer types (TCGA IlluminaHiSeq_RNASeqV2, pan-cancer normalized log2(norm_counts+1) data, version 2016-08-16) (TCGA clinicalMatrix, phenotype data, version 2016-04-27) * Click on the image enlarge it in a new window. |
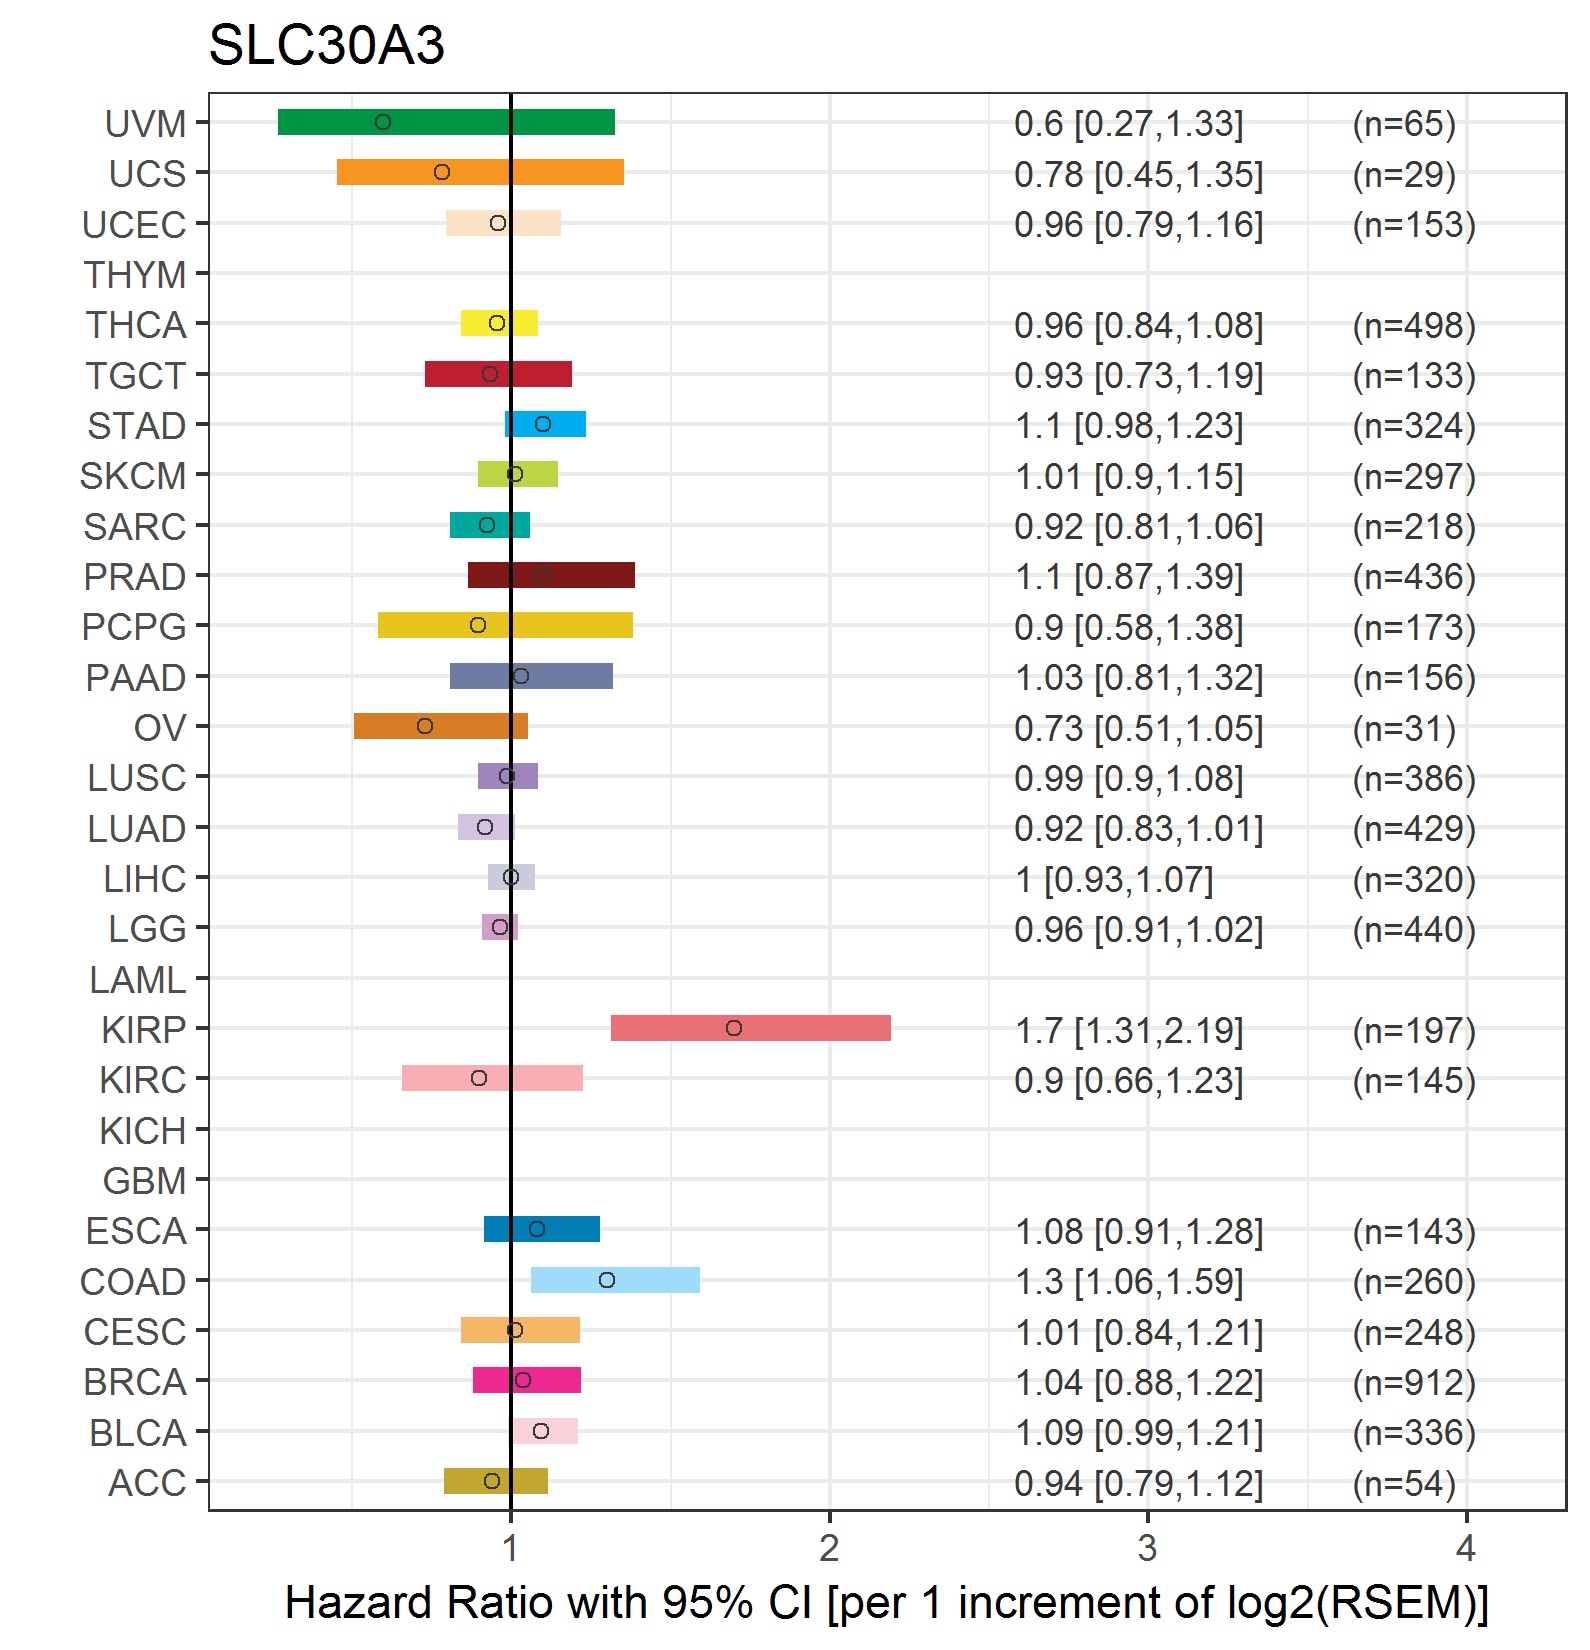 |
| Top |
| TissGeneClin for SLC30A3 |
| TissGeneDrug for SLC30A3 |
| Drug information targeting TissGene (DrugBank Version 5.0.6, 2017-04-01) |
| DrugBank ID | Drug name | Drug activity | Drug type | Drug status |
| Top |
| TissGeneDisease for SLC30A3 |
| Disease information associated with TissGene (DisGeNet, 2016-06-01) |
| Disease ID | Disease name | # pubmeds | Source |
| umls:C0333463 | Senile Plaques | 3 | BeFree |
| umls:C2936349 | Plaque, Amyloid | 3 | BeFree |
| umls:C0002736 | Amyotrophic Lateral Sclerosis | 1 | BeFree |
| umls:C0011847 | Diabetes | 1 | BeFree |
| umls:C0011849 | Diabetes Mellitus | 1 | BeFree |
| umls:C0036341 | Schizophrenia | 1 | BeFree |
| umls:C0233794 | Memory impairment | 1 | BeFree |
| umls:C0699949 | airway disease | 1 | BeFree |
| umls:C1842937 | AURAL ATRESIA, CONGENITAL | 1 | BeFree |
| umls:C1862941 | Amyotrophic Lateral Sclerosis, Sporadic | 1 | BeFree |
|
Copyright 2016-Present - The University of Texas Health Science Center at Houston (UTHealth) Web File Viewing | How to Report, Fraud, Waste and Abuse | State of Texas | Statewide Search | Texas Homeland Security | Site Policies |