 |
| |
| |
| |
| |
| |
| |
|

| TissGeneSummary for COLEC11 |
 Gene summary Gene summary |
| Basic gene information | Gene symbol | COLEC11 |
| Gene name | collectin sub-family member 11 | |
| Synonyms | 3MC2|CL-K1-I|CL-K1-II|CL-K1-IIa|CL-K1-IIb|CLK1 | |
| Cytomap | UCSC genome browser: 2p25.3 | |
| Type of gene | protein-coding | |
| RefGenes | NM_001255982.1, NM_001255983.1,NM_001255984.1,NM_001255985.1,NM_001255986.1, NM_001255987.1,NM_001255988.1,NM_001255989.1,NM_024027.4, NM_199235.2,NR_045659.1, | |
| Description | Collectin K1collectin kidney protein 1collectin-11 | |
| Modification date | 20141207 | |
| dbXrefs | MIM : 612502 | |
| HGNC : HGNC | ||
| Ensembl : ENSG00000118004 | ||
| HPRD : 10847 | ||
| Vega : OTTHUMG00000090304 | ||
| Protein | UniProt: go to UniProt's Cross Reference DB Table | |
| Expression | CleanEX: HS_COLEC11 | |
| BioGPS: 78989 | ||
| Pathway | NCI Pathway Interaction Database: COLEC11 | |
| KEGG: COLEC11 | ||
| REACTOME: COLEC11 | ||
| Pathway Commons: COLEC11 | ||
| Context | iHOP: COLEC11 | |
| ligand binding site mutation search in PubMed: COLEC11 | ||
| UCL Cancer Institute: COLEC11 | ||
| Assigned class in TissGDB* | C | |
| Included tissue-specific gene expression resources | TiGER,GTEx | |
| Specific-tissues in normal samples (assigned by TissGDB using HPA, TiGER, and GTEx) | BrainLiver | |
| Cancer types related to the specific-tissues in cancer samples (assigned by TissGDB using TCGA) | GBM,LGGLIHC | |
| Reference showing the relevant tissue of COLEC11 | ||
| Description by TissGene annotations | ||
| * Class A consists of genes with literature evidence and is part of the cTissGenes. Class B consists of only cTissGenes without additional evidence. The remaining genes belong to Class C. |
| Gene ontology having evidence of Inferred from Direct Assay (IDA) from Entrez |
| GO ID | GO term | PubMed ID |
| Top |
| TissGeneExp for COLEC11 |
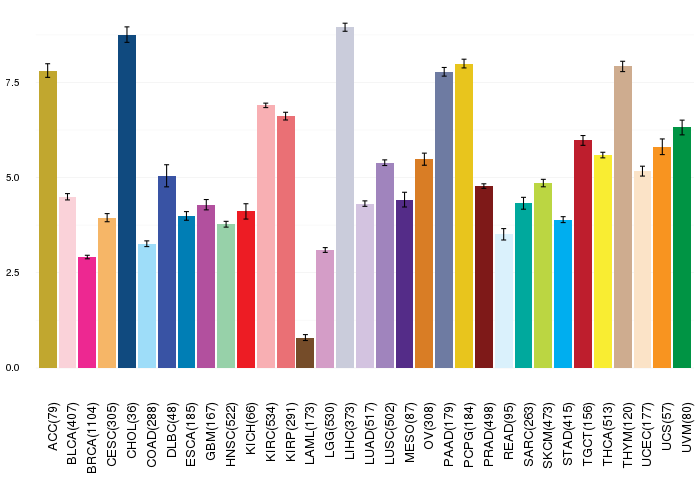
| Gene expressions across 28 cancer types (X-axis: cancer type and Y-axis: log2(norm_counts+1)) (TCGA IlluminaHiSeq_RNASeqV2, pan-cancer normalized log2(norm_counts+1) data, version 2016-08-16) |
 |
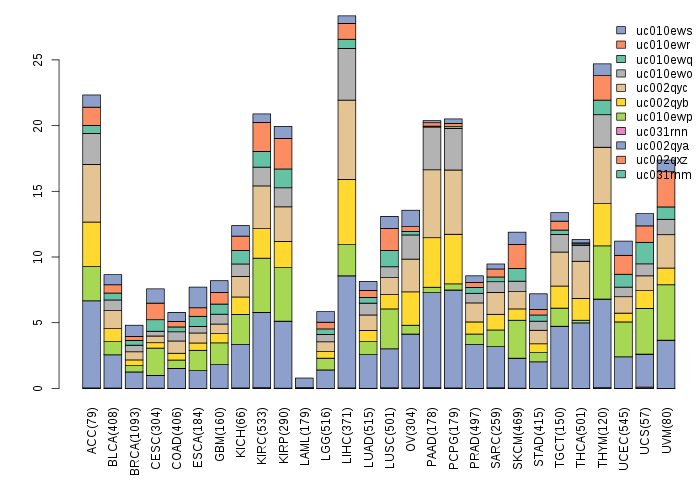
| Gene isoform expressions across 28 cancer types (X-axis: cancer type and Y-axis: log2(norm_counts+1)) (TCGA pan-cancer tcga_rsem_isoform_tpm, version 2016-09-01) |
 |
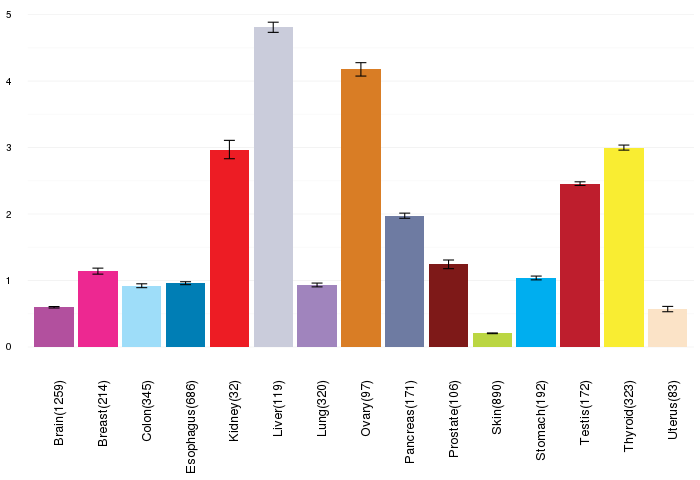
| Gene expressions across normal tissues of GTEx data (GTEx GTEx_Analysis_v6_RNA-seq_RNA-SeQCv1.1.8_gene_rpkm.gct) - Here, we shows the matched tissue types only among our 28 cancer types. |
 |
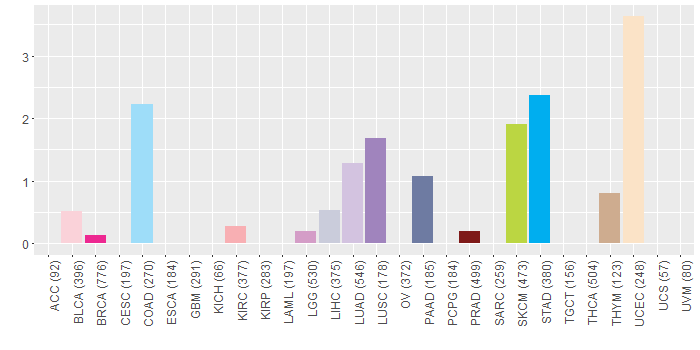
| Different expressions across 14 cancer types with more than 10 samples between matched tumors and normals (X-axis: cancer type and Y-axis: log2(norm_counts+1)) (TCGA IlluminaHiSeq_RNASeqV2, pan-cancer normalized log2(norm_counts+1) data, version 2016-08-16) |
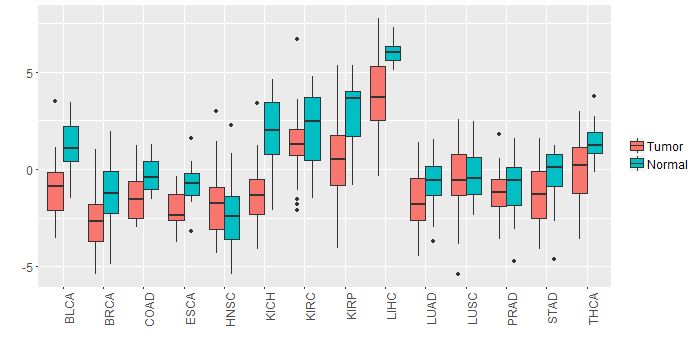 |
| - Significantly differentially expressed cancer types and information. (|Fold change|>1 and FDR<0.05) |
| Cancer type | Mean(exp) in tumor | Mean(exp) in matched normal | Log2FC | P-val. | FDR |
| BRCA | -2.678924549 | -1.197732443 | -1.481192105 | 1.98E-14 | 9.94E-14 |
| LIHC | 3.894872329 | 6.019114329 | -2.124242 | 6.26E-10 | 7.09E-09 |
| THCA | -0.108587231 | 1.332768701 | -1.441355932 | 1.68E-07 | 7.07E-07 |
| KICH | -1.363425671 | 2.036834329 | -3.40026 | 7.76E-09 | 4.23E-08 |
| STAD | -1.355770546 | -0.283523671 | -1.072246875 | 0.00386 | 0.015812641 |
| COAD | -1.366027518 | -0.229715979 | -1.136311538 | 0.000821 | 0.00242396 |
| BLCA | -0.94750525 | 1.193184223 | -2.140689474 | 8.02E-05 | 0.000926475 |
| KIRP | 0.521538829 | 2.718848204 | -2.197309375 | 3.05E-05 | 0.000116492 |
| LUAD | -1.639458154 | -0.639401258 | -1.000056897 | 4.37E-05 | 0.000116412 |
| Top |
| TissGene-miRNA for COLEC11 |
| Significantly anti-correlated miRNAs of TissGene across 28 cancer types (Gene-miRNA relations from TargetScanHuman Relsease 7.1, Conserved_Site_Context_Scores.txt.zip, 06.01.2016) (TCGA IlluminaHiSeq_miRNASeq, log2(RPM+1) data, version 2016-11-21) (TCGA IlluminaHiSeq_RNASeqV2, log2(normalized_count+1) data, version 2016-08-16) (Spearman’s Rank Correlation (p-value<0.05 and coefficient<-0.25)) |
| Cancer type | miRNA id | miRNA accession | P-val. | Coeff. | # samples |
| Top |
| TissGeneMut for COLEC11 |
| TissGeneSNV for COLEC11 |
| nsSNV counts per each loci. Different colors of circles represent different cancer types. Circle size denotes number of samples. (TCGA somatic mutation (SNPs and small INDELs) data, version 2016-04-25) * Click on the image to enlarge it in a new window. |
 |
 |
| Somatic nucleotide variants of TissGene across 28 cancer types (X-axis: cancer type and Y-axis: % of mutated samples) The numbers in parentheses are numbers of samples with mutation (nsSNVs). (TCGA somatic mutation (SNPs and small INDELs) data, version 2016-04-25) |
 |
| - nsSNVs sorted by frequency. |
| AAchange | Cancer type | # samples |
| p.G130S | COAD | 1 |
| p.R119H | HNSC | 1 |
| p.R119H | UCEC | 1 |
| p.R17Q | STAD | 1 |
| p.R126C | SKCM | 1 |
| p.R17Q | PAAD | 1 |
| p.A165T | PAAD | 1 |
| p.A164V | STAD | 1 |
| p.S57F | LUAD | 1 |
| p.R121P | LUAD | 1 |
| p.L193Q | STAD | 1 |
| p.S146F | SKCM | 1 |
| p.G187D | HNSC | 1 |
| p.S23F | SKCM | 1 |
| p.A191T | BRCA | 1 |
| p.A46V | UCEC | 1 |
| p.E60* | UCEC | 1 |
| p.C54R | STAD | 1 |
| p.G161D | HNSC | 1 |
| p.S32L | COAD | 1 |
| p.D156N | SKCM | 1 |
| p.L13P | UCEC | 1 |
| p.G245S | STAD | 1 |
| p.G231S | STAD | 1 |
| p.A205T | STAD | 1 |
| p.A28D | LUSC | 1 |
| p.A140T | LGG | 1 |
| p.A165T | PRAD | 1 |
| p.P25S | SKCM | 1 |
| p.A165T | KIRC | 1 |
| p.R162H | PAAD | 1 |
| p.S71F | SKCM | 1 |
| p.G30R | HNSC | 1 |
| p.A205T | KIRC | 1 |
| p.Q41H | UCEC | 1 |
| p.L28P | STAD | 1 |
| p.A191T | UCEC | 1 |
| p.S52I | LUAD | 1 |
| p.D73Y | LUAD | 1 |
| p.P77S | SKCM | 1 |
| p.P6L | THYM | 1 |
| p.R147T | LUAD | 1 |
| p.R34T | BLCA | 1 |
| p.V215A | LIHC | 1 |
| p.R7I | LUAD | 1 |
| p.R121S | LUAD | 1 |
| p.T64M | UCEC | 1 |
| p.E22K | SKCM | 1 |
| p.K51N | SKCM | 1 |
| p.R60T | BLCA | 1 |
| p.R176H | PAAD | 1 |
| p.L14P | STAD | 1 |
| p.K137* | LUSC | 1 |
| p.A92V | SKCM | 1 |
| p.R136H | PAAD | 1 |
| p.S78I | LUAD | 1 |
| p.V53I | LIHC | 1 |
| p.A92T | LGG | 1 |
| p.H193N | BLCA | 1 |
| p.M70T | LUSC | 1 |
| p.A205T | PAAD | 1 |
| p.P27L | UCEC | 1 |
| p.H24Q | UCEC | 1 |
| p.A168V | HNSC | 1 |
| p.A140V | SKCM | 1 |
| p.S194F | SKCM | 1 |
| p.E61K | COAD | 1 |
| p.A118V | LUAD | 1 |
| p.A164S | LUAD | 1 |
| p.L207Q | STAD | 1 |
| p.L11Q | LUAD | 1 |
| p.A178V | STAD | 1 |
| p.R174C | SKCM | 1 |
| p.G94D | COAD | 1 |
| p.P26L | COAD | 1 |
| p.A121D | STAD | 1 |
| p.A213T | STAD | 1 |
| p.R93H | HNSC | 1 |
| p.R95H | COAD | 1 |
| p.A144T | HNSC | 1 |
| Top |
| TissGeneCNV for COLEC11 |
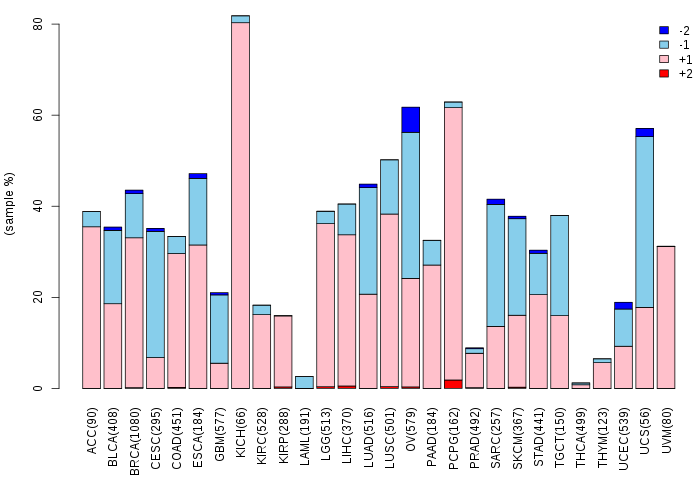
| Copy number variations of TissGene across 28 cancer types (X-axis: cancer type and Y-axis: % of CNV samples) (TCGA Gistic2_CopyNumber_Gistic2_all_data_by_genes, Gistic2 copy number data, version 2016-08-16) |
 |
| Top |
| TissGeneFusions for COLEC11 |
| Fusion genes including TissGene (ChimerDB 3.0, 2016-12-01 and TCGA fusion Portal 2015-12-01) |
| Database | Src | Cancer type | Sample | Fusion gene | ORF | 5'-gene BP | 3'-gene BP |
| Chimerdb3.0 | ChiTaRs | NA | AA742449 | COLEC11-PITPNC1 | chr2:3692045 | chr17:65473099 |
| Top |
| TissGeneNet for COLEC11 |
| Co-expressed gene networks based on protein-protein interaction data (CePIN) (TCGA IlluminaHiSeq_RNASeqV2, pan-cancer normalized log2(norm_counts+1) data, version 2016-08-16) (PINA2 ppi data) |
| Top |
| TissGeneProg for COLEC11 |
| Kaplan-Meier plots with logrank tests of overall survival (OS) using 28 cancer types (TCGA IlluminaHiSeq_RNASeqV2, pan-cancer normalized log2(norm_counts+1) data, version 2016-08-16) (TCGA clinicalMatrix, phenotype data, version 2016-04-27) * Click on the image to enlarge it in a new window. |
 |
| Kaplan-Meier plots with logrank test of relapse free survival (RFS) using 28 cancer types (TCGA IlluminaHiSeq_RNASeqV2, pan-cancer normalized log2(norm_counts+1) data, version 2016-08-16) (TCGA clinicalMatrix, phenotype data, version 2016-04-27) * Click on the image enlarge it in a new window. |
 |
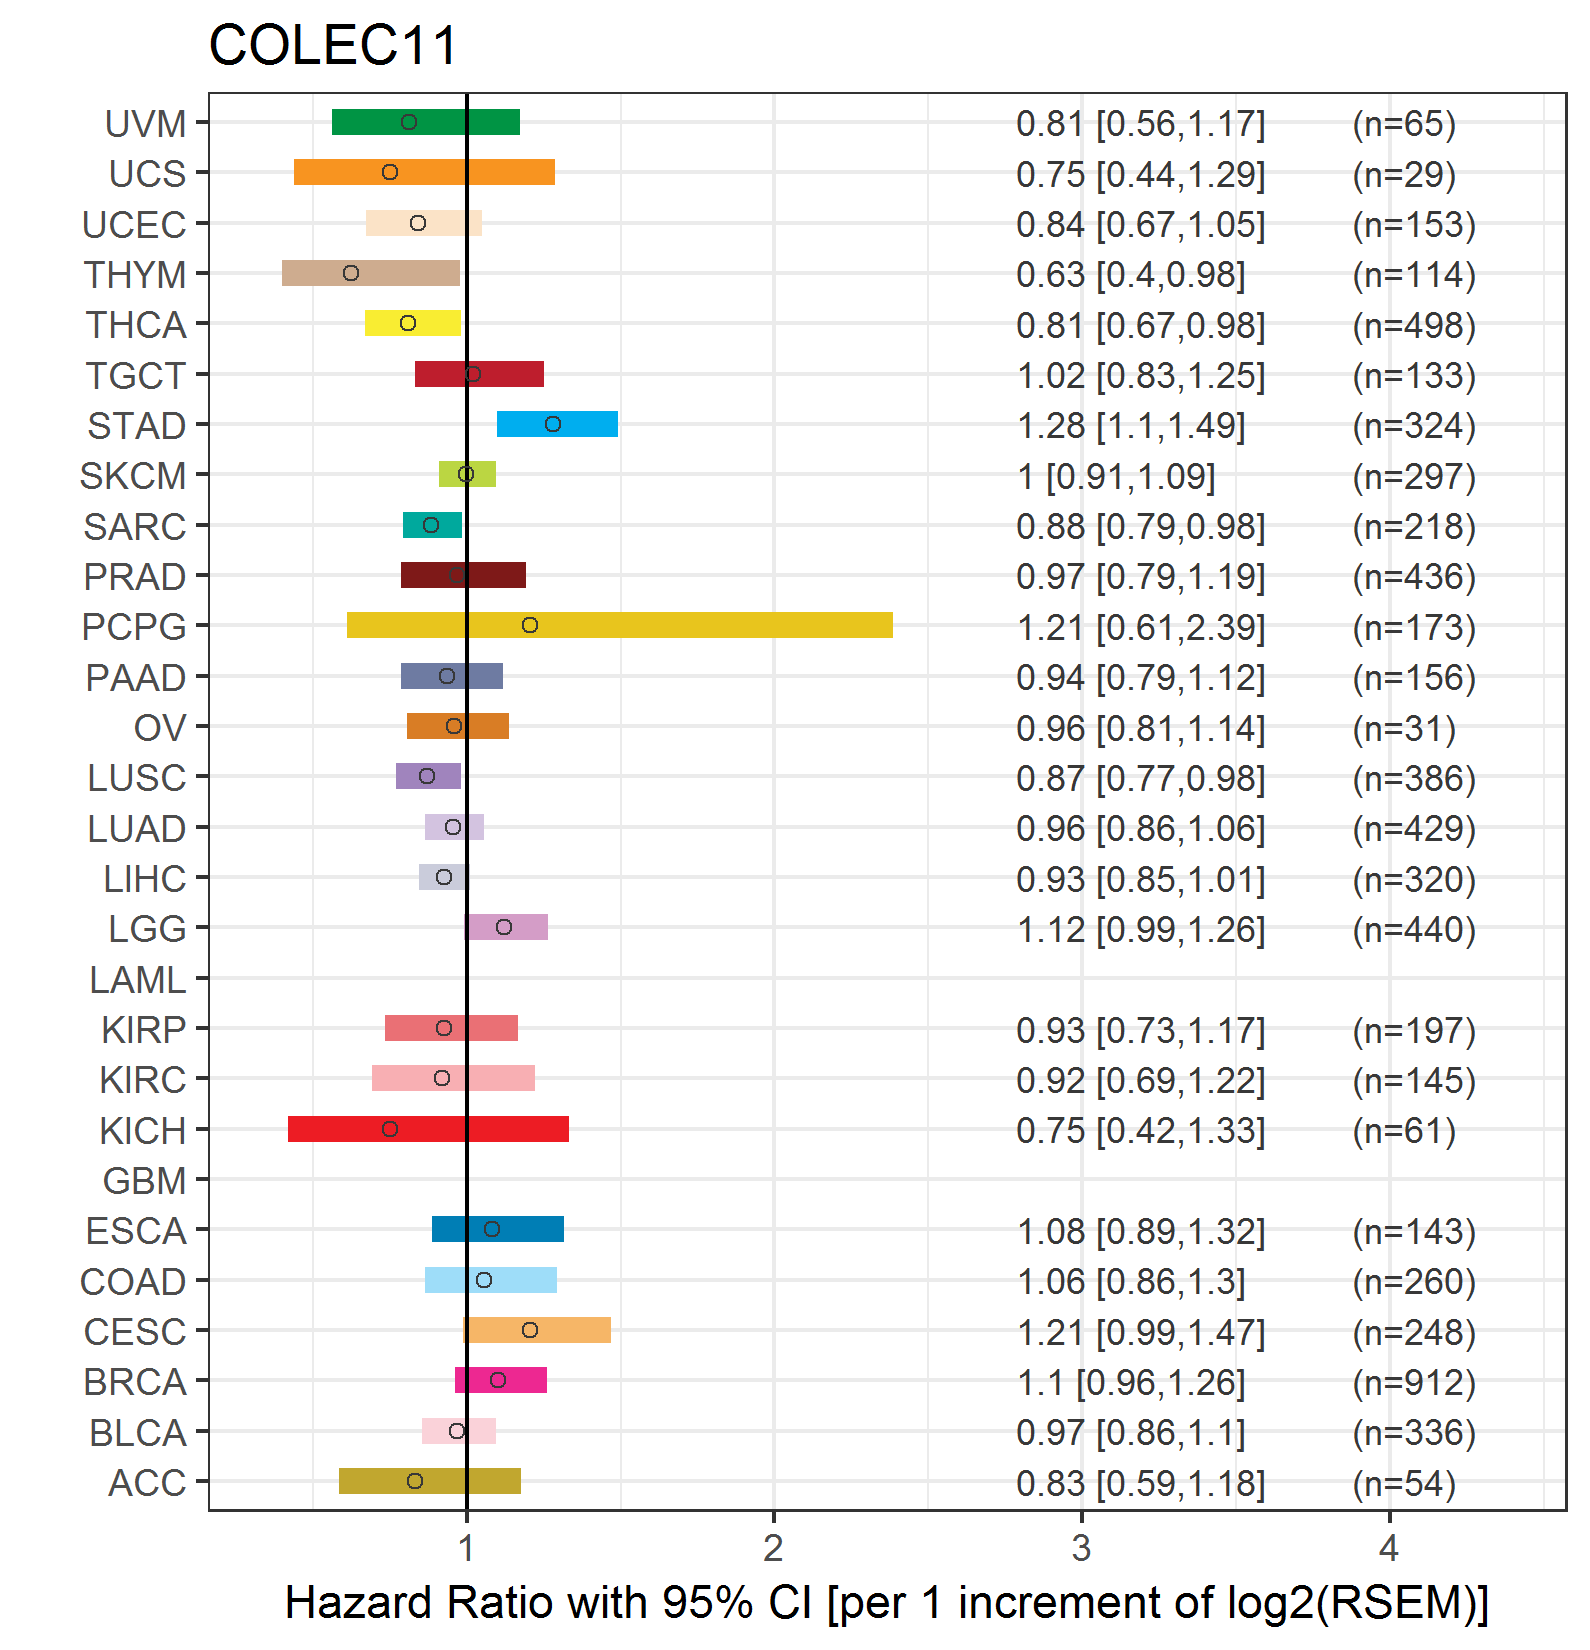
| Forest plot of Cox proportional hazard ratio (HR) and 95% CI of overall survival (OS) using 28 cancer types (TCGA IlluminaHiSeq_RNASeqV2, pan-cancer normalized log2(norm_counts+1) data, version 2016-08-16) (TCGA clinicalMatrix, phenotype data, version 2016-04-27) * Click on the image enlarge it in a new window. |
 |
| Forest plot of Cox proportional hazard ratio (HR) and 95% CI of relapse free survival (RFS) using 28 cancer types (TCGA IlluminaHiSeq_RNASeqV2, pan-cancer normalized log2(norm_counts+1) data, version 2016-08-16) (TCGA clinicalMatrix, phenotype data, version 2016-04-27) * Click on the image enlarge it in a new window. |
 |
| Top |
| TissGeneClin for COLEC11 |
| TissGeneDrug for COLEC11 |
| Drug information targeting TissGene (DrugBank Version 5.0.6, 2017-04-01) |
| DrugBank ID | Drug name | Drug activity | Drug type | Drug status |
| Top |
| TissGeneDisease for COLEC11 |
| Disease information associated with TissGene (DisGeNet, 2016-06-01) |
| Disease ID | Disease name | # pubmeds | Source |
| umls:C0008073 | Developmental Disabilities | 1 | BeFree |
| umls:C0018889 | Helminthiasis | 1 | BeFree |
| umls:C0019693 | HIV Infections | 1 | BeFree |
| umls:C0022658 | Kidney Diseases | 1 | GAD |
| umls:C0033626 | Protein Deficiency | 1 | BeFree |
| umls:C0036323 | Schistosomiasis | 1 | BeFree |
| umls:C0038454 | Cerebrovascular accident | 1 | GAD |
| umls:C0038525 | Subarachnoid Hemorrhage | 1 | GAD |
| umls:C0151699 | Intracranial Hemorrhages | 1 | GAD |
| umls:C0239337 | Deformity of limb | 1 | BeFree |
| umls:C0376634 | Craniofacial Abnormalities | 1 | CTD_human |
| umls:C0524851 | Neurodegenerative Disorders | 1 | BeFree |
| umls:C0549567 | Pigmentation Disorders | 1 | CTD_human |
| umls:C0796032 | Malpuech facial clefting syndrome | 1 | CTD_human |
| umls:C0796059 | Oculopalatoskeletal syndrome | 1 | CTD_human |
| umls:C0796279 | Carnevale syndrome | 1 | CLINVAR,CTD_human,UNIPROT |
| umls:C1704430 | Urinary Schistosomiasis | 1 | BeFree |
| umls:C2937358 | Cerebral Hemorrhage | 1 | GAD |
|
Copyright 2016-Present - The University of Texas Health Science Center at Houston (UTHealth) Web File Viewing | How to Report, Fraud, Waste and Abuse | State of Texas | Statewide Search | Texas Homeland Security | Site Policies |