 |
| |
| |
| |
| |
| |
| |
|

| TissGeneSummary for KDELC1 |
 Gene summary Gene summary |
| Basic gene information | Gene symbol | KDELC1 |
| Gene name | KDEL (Lys-Asp-Glu-Leu) containing 1 | |
| Synonyms | EP58|KDEL1 | |
| Cytomap | UCSC genome browser: 13q33 | |
| Type of gene | protein-coding | |
| RefGenes | NM_024089.2, | |
| Description | ER protein 58ERp58KDEL motif-containing 1KDEL motif-containing protein 1endoplasmic reticulum resident protein 58 | |
| Modification date | 20141207 | |
| dbXrefs | MIM : 611613 | |
| HGNC : HGNC | ||
| Ensembl : ENSG00000134901 | ||
| HPRD : 11061 | ||
| Vega : OTTHUMG00000017307 | ||
| Protein | UniProt: go to UniProt's Cross Reference DB Table | |
| Expression | CleanEX: HS_KDELC1 | |
| BioGPS: 79070 | ||
| Pathway | NCI Pathway Interaction Database: KDELC1 | |
| KEGG: KDELC1 | ||
| REACTOME: KDELC1 | ||
| Pathway Commons: KDELC1 | ||
| Context | iHOP: KDELC1 | |
| ligand binding site mutation search in PubMed: KDELC1 | ||
| UCL Cancer Institute: KDELC1 | ||
| Assigned class in TissGDB* | C | |
| Included tissue-specific gene expression resources | TiGER,GTEx | |
| Specific-tissues in normal samples (assigned by TissGDB using HPA, TiGER, and GTEx) | CervixUterus | |
| Cancer types related to the specific-tissues in cancer samples (assigned by TissGDB using TCGA) | CESCUCEC,UCS | |
| Reference showing the relevant tissue of KDELC1 | ||
| Description by TissGene annotations | Protective TissGene in RFS | |
| * Class A consists of genes with literature evidence and is part of the cTissGenes. Class B consists of only cTissGenes without additional evidence. The remaining genes belong to Class C. |
| Gene ontology having evidence of Inferred from Direct Assay (IDA) from Entrez |
| GO ID | GO term | PubMed ID |
| Top |
| TissGeneExp for KDELC1 |
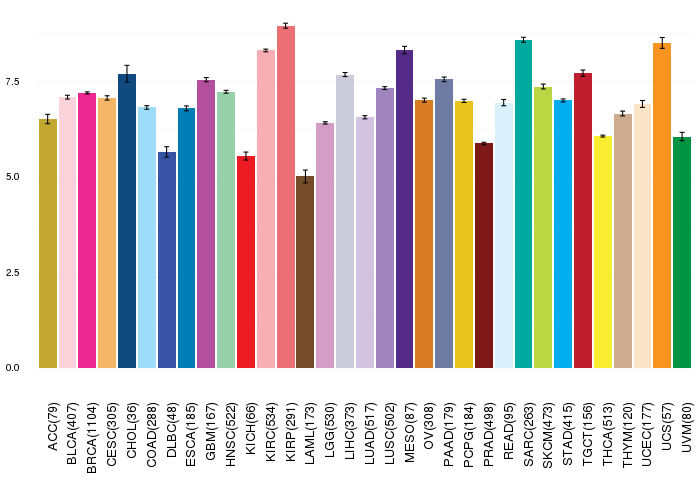
| Gene expressions across 28 cancer types (X-axis: cancer type and Y-axis: log2(norm_counts+1)) (TCGA IlluminaHiSeq_RNASeqV2, pan-cancer normalized log2(norm_counts+1) data, version 2016-08-16) |
 |
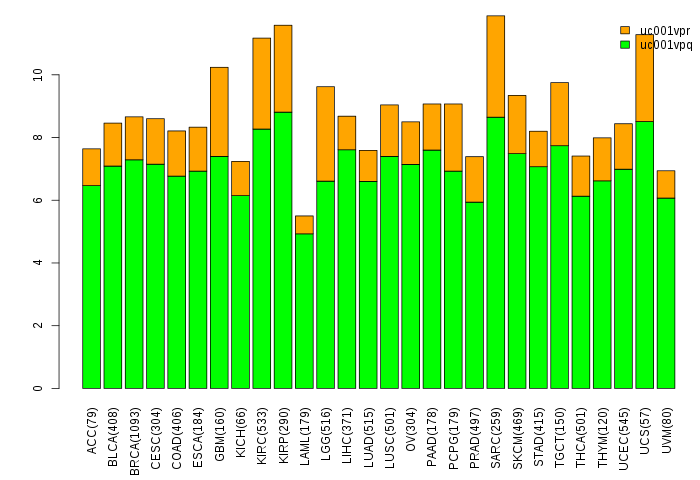
| Gene isoform expressions across 28 cancer types (X-axis: cancer type and Y-axis: log2(norm_counts+1)) (TCGA pan-cancer tcga_rsem_isoform_tpm, version 2016-09-01) |
 |
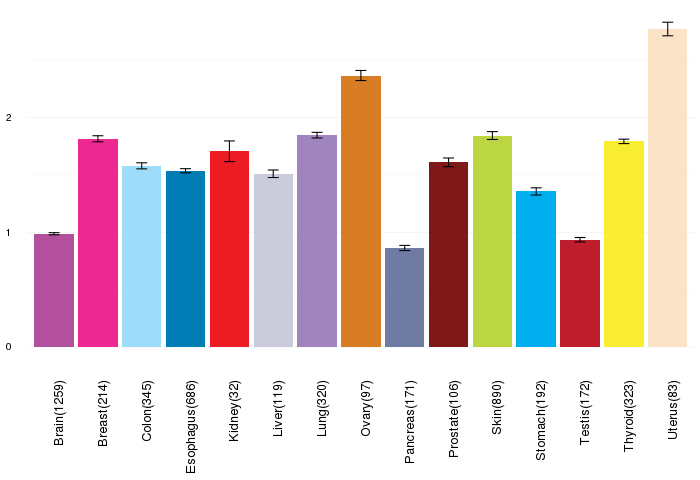
| Gene expressions across normal tissues of GTEx data (GTEx GTEx_Analysis_v6_RNA-seq_RNA-SeQCv1.1.8_gene_rpkm.gct) - Here, we shows the matched tissue types only among our 28 cancer types. |
 |
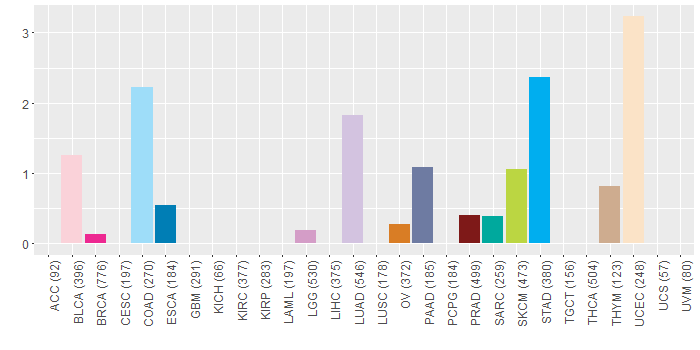
| Different expressions across 14 cancer types with more than 10 samples between matched tumors and normals (X-axis: cancer type and Y-axis: log2(norm_counts+1)) (TCGA IlluminaHiSeq_RNASeqV2, pan-cancer normalized log2(norm_counts+1) data, version 2016-08-16) |
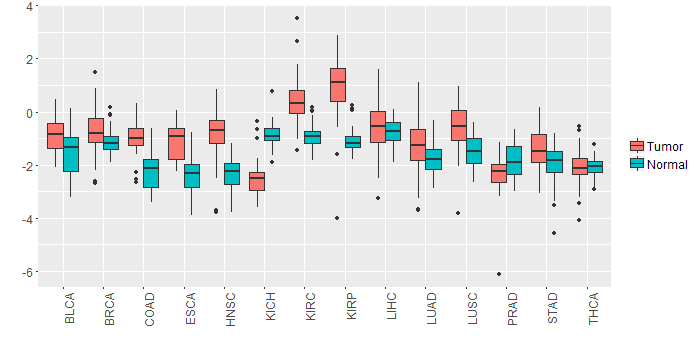 |
| - Significantly differentially expressed cancer types and information. (|Fold change|>1 and FDR<0.05) |
| Cancer type | Mean(exp) in tumor | Mean(exp) in matched normal | Log2FC | P-val. | FDR |
| HNSC | -0.831500125 | -2.291104776 | 1.459604651 | 1.65E-12 | 5.63E-11 |
| COAD | -1.023180089 | -2.24579932 | 1.222619231 | 7.40E-08 | 5.33E-07 |
| KIRC | 0.421017026 | -0.907007974 | 1.328025 | 3.67E-23 | 3.76E-22 |
| KICH | -2.444027474 | -0.874311474 | -1.569716 | 3.67E-10 | 2.57E-09 |
| KIRP | 0.854326401 | -1.078279849 | 1.93260625 | 2.22E-09 | 1.96E-08 |
| ESCA | -1.11135002 | -2.39905911 | 1.287709091 | 0.00111 | 0.015723822 |
| Top |
| TissGene-miRNA for KDELC1 |
| Significantly anti-correlated miRNAs of TissGene across 28 cancer types (Gene-miRNA relations from TargetScanHuman Relsease 7.1, Conserved_Site_Context_Scores.txt.zip, 06.01.2016) (TCGA IlluminaHiSeq_miRNASeq, log2(RPM+1) data, version 2016-11-21) (TCGA IlluminaHiSeq_RNASeqV2, log2(normalized_count+1) data, version 2016-08-16) (Spearman’s Rank Correlation (p-value<0.05 and coefficient<-0.25)) |
| Cancer type | miRNA id | miRNA accession | P-val. | Coeff. | # samples |
| Top |
| TissGeneMut for KDELC1 |
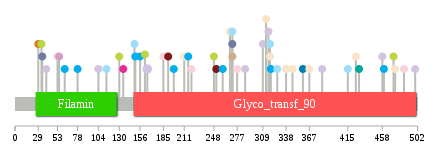
| TissGeneSNV for KDELC1 |
| nsSNV counts per each loci. Different colors of circles represent different cancer types. Circle size denotes number of samples. (TCGA somatic mutation (SNPs and small INDELs) data, version 2016-04-25) * Click on the image to enlarge it in a new window. |
 |
 |
| Somatic nucleotide variants of TissGene across 28 cancer types (X-axis: cancer type and Y-axis: % of mutated samples) The numbers in parentheses are numbers of samples with mutation (nsSNVs). (TCGA somatic mutation (SNPs and small INDELs) data, version 2016-04-25) |
 |
| - nsSNVs sorted by frequency. |
| AAchange | Cancer type | # samples |
| p.A165S | LUAD | 2 |
| p.F62I | STAD | 1 |
| p.H191Q | PRAD | 1 |
| p.I114V | COAD | 1 |
| p.Y364* | HNSC | 1 |
| p.D271N | COAD | 1 |
| p.R474Q | UCEC | 1 |
| p.P327Q | COAD | 1 |
| p.R313C | UCEC | 1 |
| p.I34M | PAAD | 1 |
| p.D429N | SARC | 1 |
| p.G59E | READ | 1 |
| p.L39I | LUAD | 1 |
| p.G281V | HNSC | 1 |
| p.R211I | UCEC | 1 |
| p.L346M | UCEC | 1 |
| p.N367H | UCEC | 1 |
| p.E318G | UCEC | 1 |
| p.R316S | LUAD | 1 |
| p.V55M | LGG | 1 |
| p.R149W | COAD | 1 |
| p.S259T | STAD | 1 |
| p.E135K | BRCA | 1 |
| p.T156I | STAD | 1 |
| p.P29L | OV | 1 |
| p.E150K | STAD | 1 |
| p.K499* | LUAD | 1 |
| p.Q53* | BLCA | 1 |
| p.H251N | PRAD | 1 |
| p.Y104N | LUAD | 1 |
| p.E33K | SKCM | 1 |
| p.E318K | COAD | 1 |
| p.K198T | STAD | 1 |
| p.S248L | SKCM | 1 |
| p.F460I | STAD | 1 |
| p.P78T | STAD | 1 |
| p.A425V | UCEC | 1 |
| p.R162K | SKCM | 1 |
| p.G130R | SKCM | 1 |
| p.E24Q | HNSC | 1 |
| p.D271Y | PAAD | 1 |
| p.A216V | STAD | 1 |
| p.L319Q | STAD | 1 |
| p.L415M | COAD | 1 |
| p.Q472E | SKCM | 1 |
| p.G309V | LUAD | 1 |
| p.L277V | BLCA | 1 |
| p.E485K | BLCA | 1 |
| p.S220P | BLCA | 1 |
| p.F338L | UCEC | 1 |
| p.G383S | LUAD | 1 |
| p.D271N | THYM | 1 |
| p.P268S | UCEC | 1 |
| p.F359L | ESCA | 1 |
| p.R474Q | CHOL | 1 |
| p.L447I | READ | 1 |
| p.N293S | READ | 1 |
| p.S220Y | READ | 1 |
| p.K458R | LUAD | 1 |
| p.M287I | LUAD | 1 |
| p.Q185H | BLCA | 1 |
| Top |
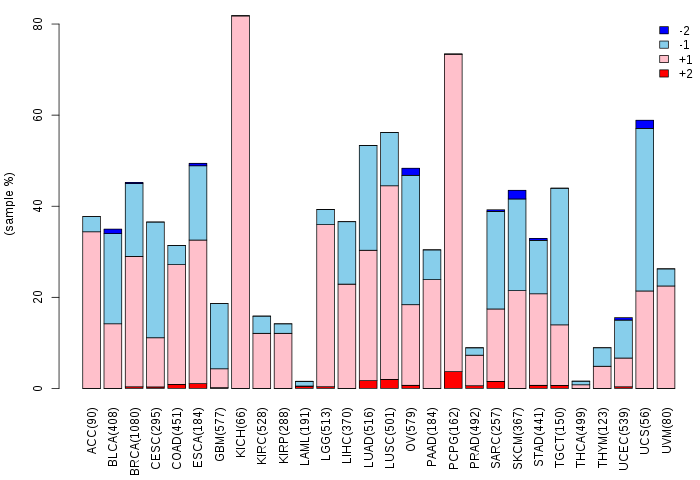
| TissGeneCNV for KDELC1 |
| Copy number variations of TissGene across 28 cancer types (X-axis: cancer type and Y-axis: % of CNV samples) (TCGA Gistic2_CopyNumber_Gistic2_all_data_by_genes, Gistic2 copy number data, version 2016-08-16) |
 |
| Top |
| TissGeneFusions for KDELC1 |
| Fusion genes including TissGene (ChimerDB 3.0, 2016-12-01 and TCGA fusion Portal 2015-12-01) |
| Database | Src | Cancer type | Sample | Fusion gene | ORF | 5'-gene BP | 3'-gene BP |
| Top |
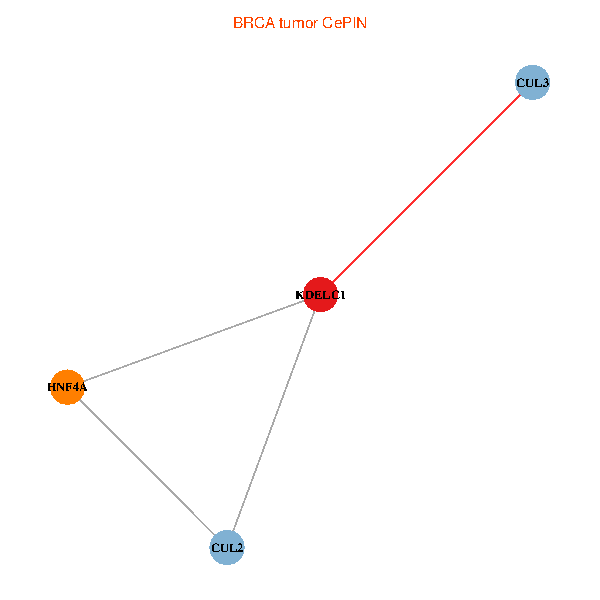
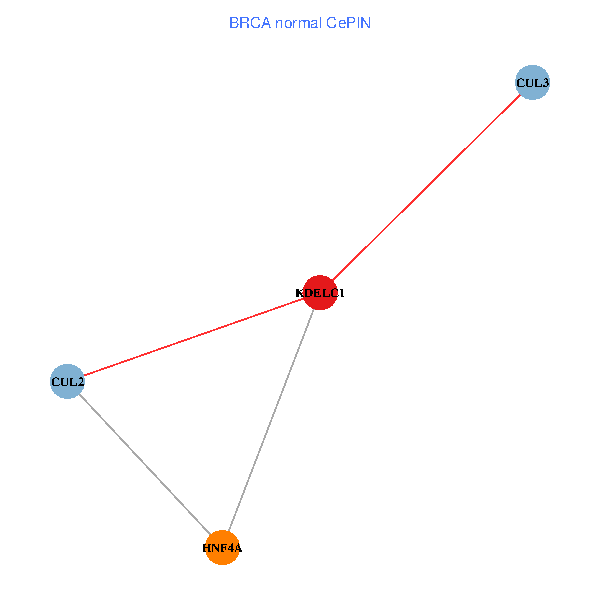
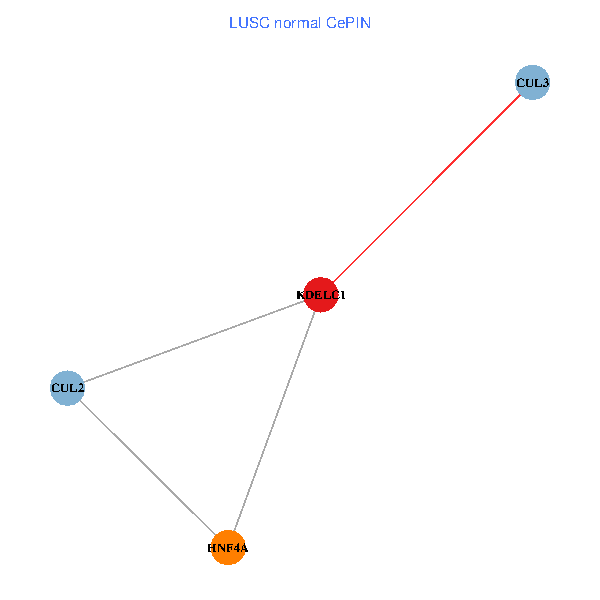
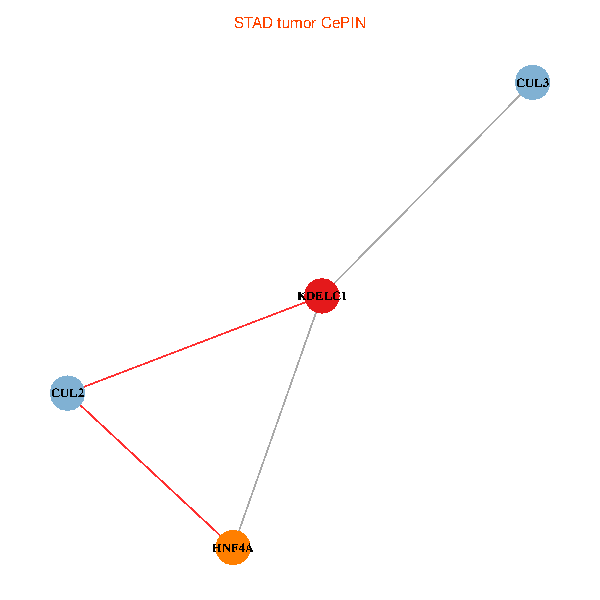
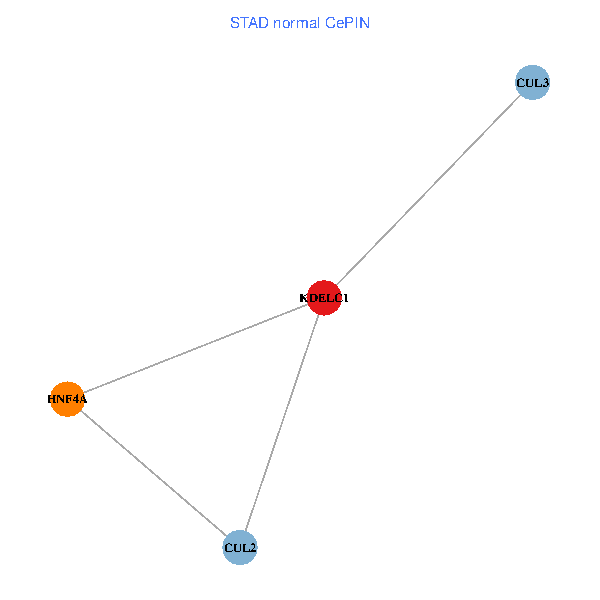
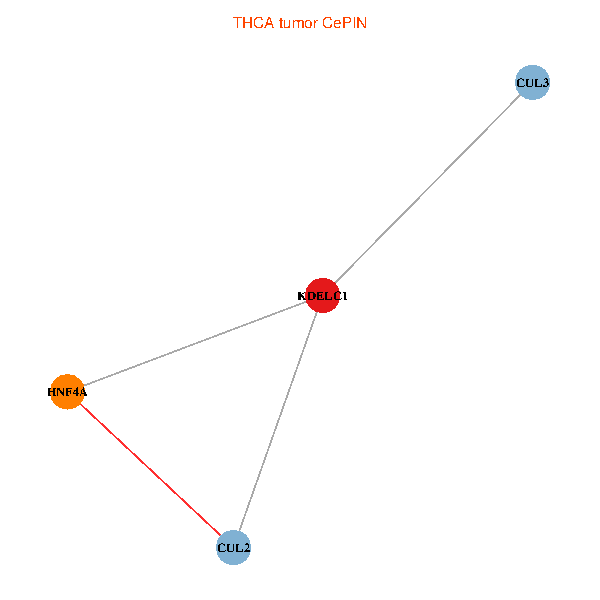
| TissGeneNet for KDELC1 |
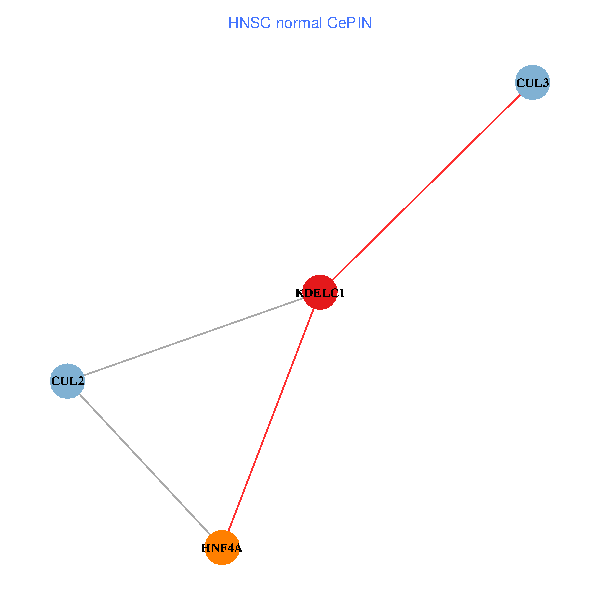
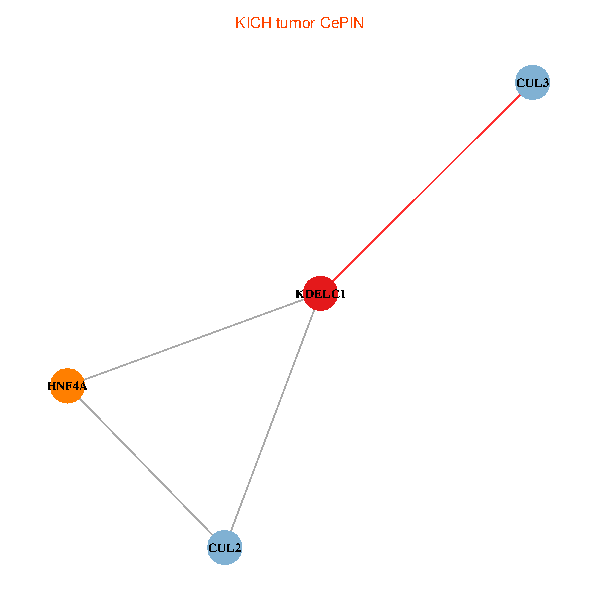
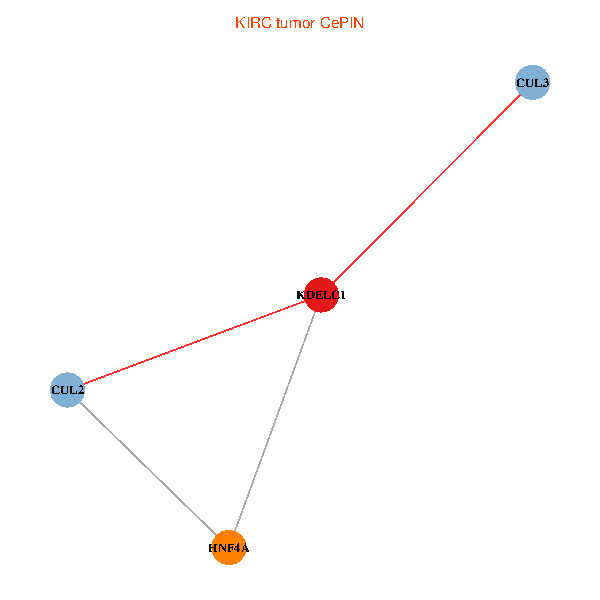
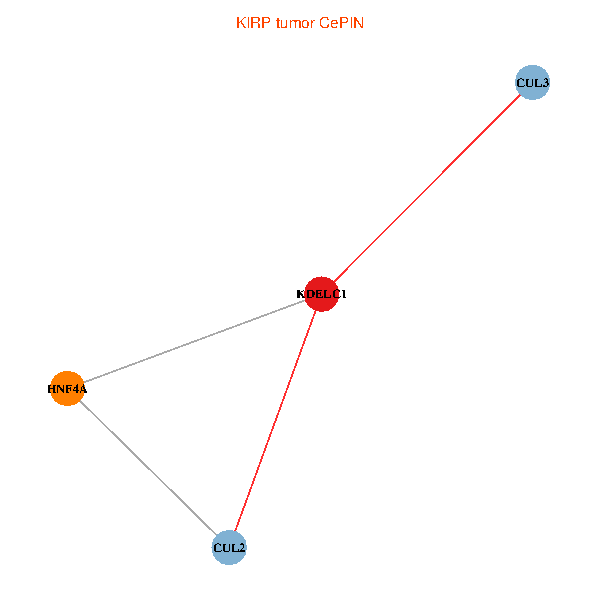
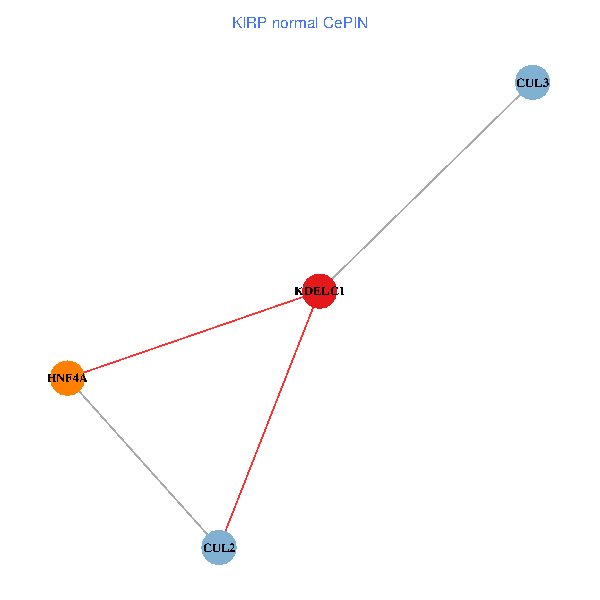
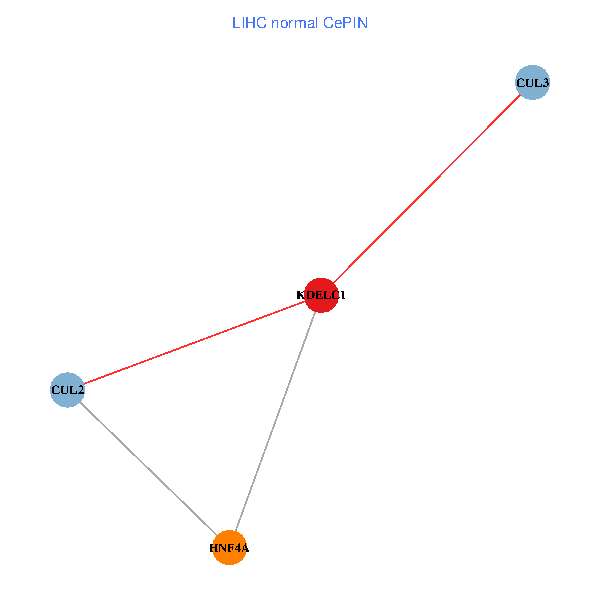
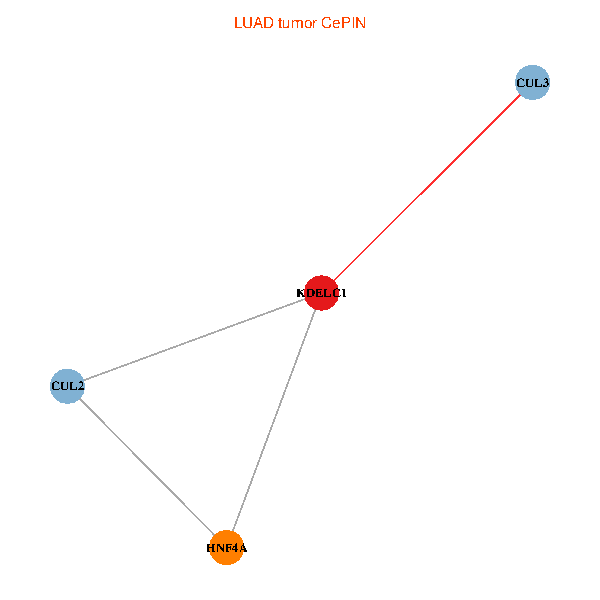
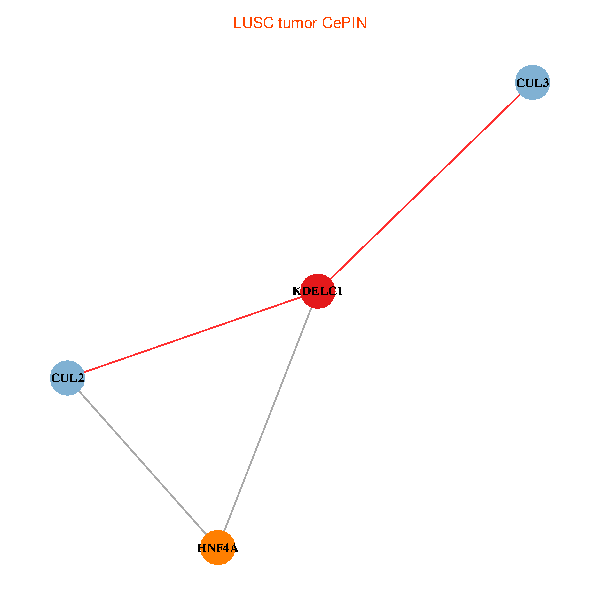
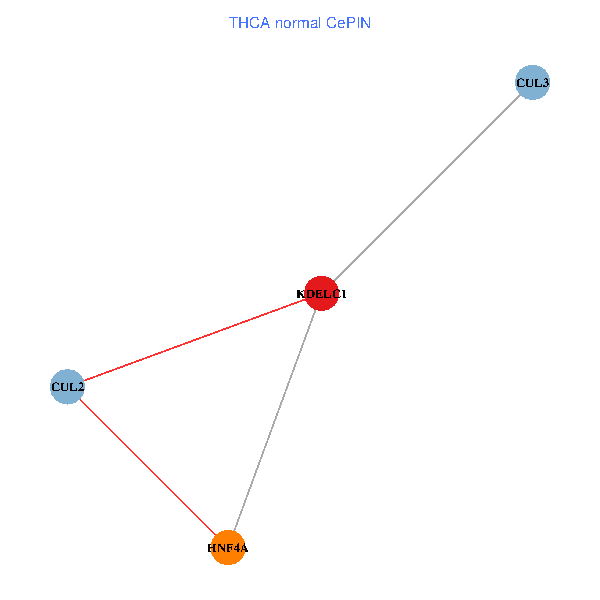
| Co-expressed gene networks based on protein-protein interaction data (CePIN) (TCGA IlluminaHiSeq_RNASeqV2, pan-cancer normalized log2(norm_counts+1) data, version 2016-08-16) (PINA2 ppi data) |
| BRCA (tumor) | BRCA (normal) |
| KDELC1, CUL2, HNF4A, CUL3 (tumor) | KDELC1, CUL2, HNF4A, CUL3 (normal) |
 |  |
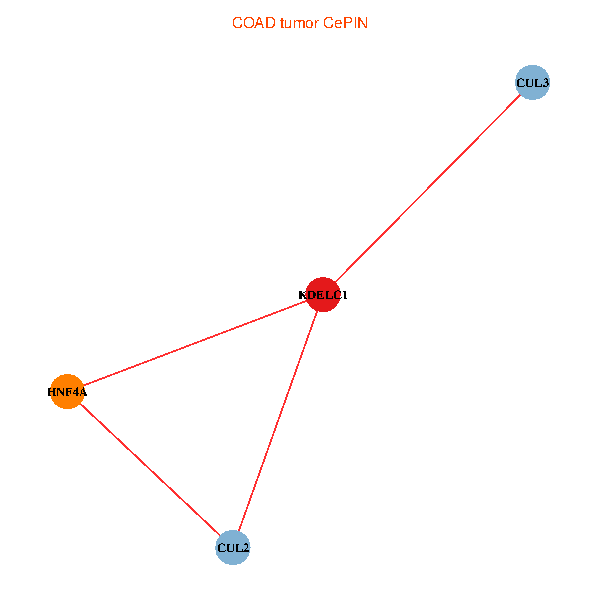
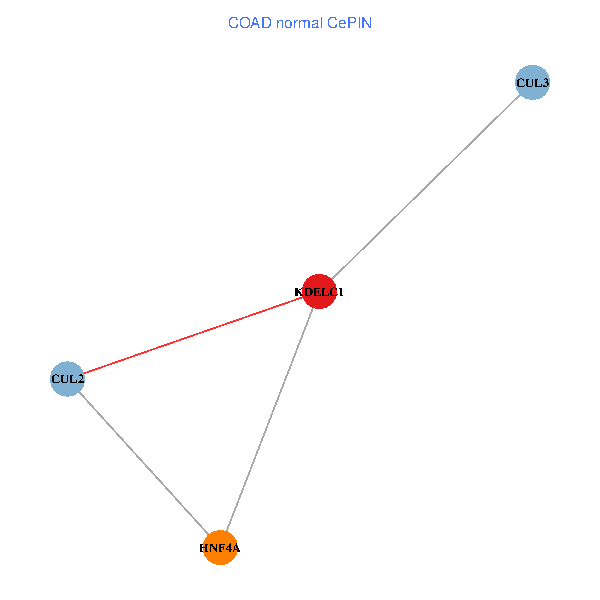
| COAD (tumor) | COAD (normal) |
| KDELC1, CUL2, HNF4A, CUL3 (tumor) | KDELC1, CUL2, HNF4A, CUL3 (normal) |
 |  |
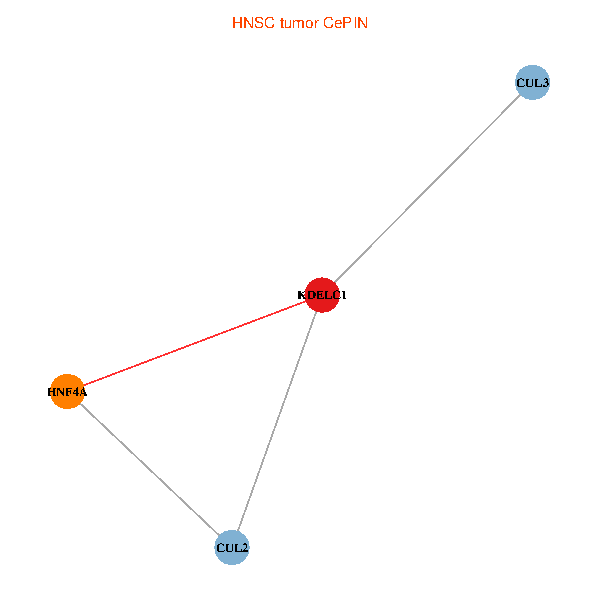
| HNSC (tumor) | HNSC (normal) |
| KDELC1, CUL2, HNF4A, CUL3 (tumor) | KDELC1, CUL2, HNF4A, CUL3 (normal) |
 |  |
| KICH (tumor) | KICH (normal) |
| KDELC1, CUL2, HNF4A, CUL3 (tumor) | KDELC1, CUL2, HNF4A, CUL3 (normal) |
 |  |
| KIRC (tumor) | KIRC (normal) |
| KDELC1, CUL2, HNF4A, CUL3 (tumor) | KDELC1, CUL2, HNF4A, CUL3 (normal) |
 |  |
| KIRP (tumor) | KIRP (normal) |
| KDELC1, CUL2, HNF4A, CUL3 (tumor) | KDELC1, CUL2, HNF4A, CUL3 (normal) |
 |  |
| LIHC (tumor) | LIHC (normal) |
| KDELC1, CUL2, HNF4A, CUL3 (tumor) | KDELC1, CUL2, HNF4A, CUL3 (normal) |
 |  |
| LUAD (tumor) | LUAD (normal) |
| KDELC1, CUL2, HNF4A, CUL3 (tumor) | KDELC1, CUL2, HNF4A, CUL3 (normal) |
 |  |
| LUSC (tumor) | LUSC (normal) |
| KDELC1, CUL2, HNF4A, CUL3 (tumor) | KDELC1, CUL2, HNF4A, CUL3 (normal) |
 |  |
| PRAD (tumor) | PRAD (normal) |
| KDELC1, CUL2, HNF4A, CUL3 (tumor) | KDELC1, CUL2, HNF4A, CUL3 (normal) |
 |  |
| STAD (tumor) | STAD (normal) |
| KDELC1, CUL2, HNF4A, CUL3 (tumor) | KDELC1, CUL2, HNF4A, CUL3 (normal) |
 |  |
| THCA (tumor) | THCA (normal) |
| KDELC1, CUL2, HNF4A, CUL3 (tumor) | KDELC1, CUL2, HNF4A, CUL3 (normal) |
 |  |
| Top |
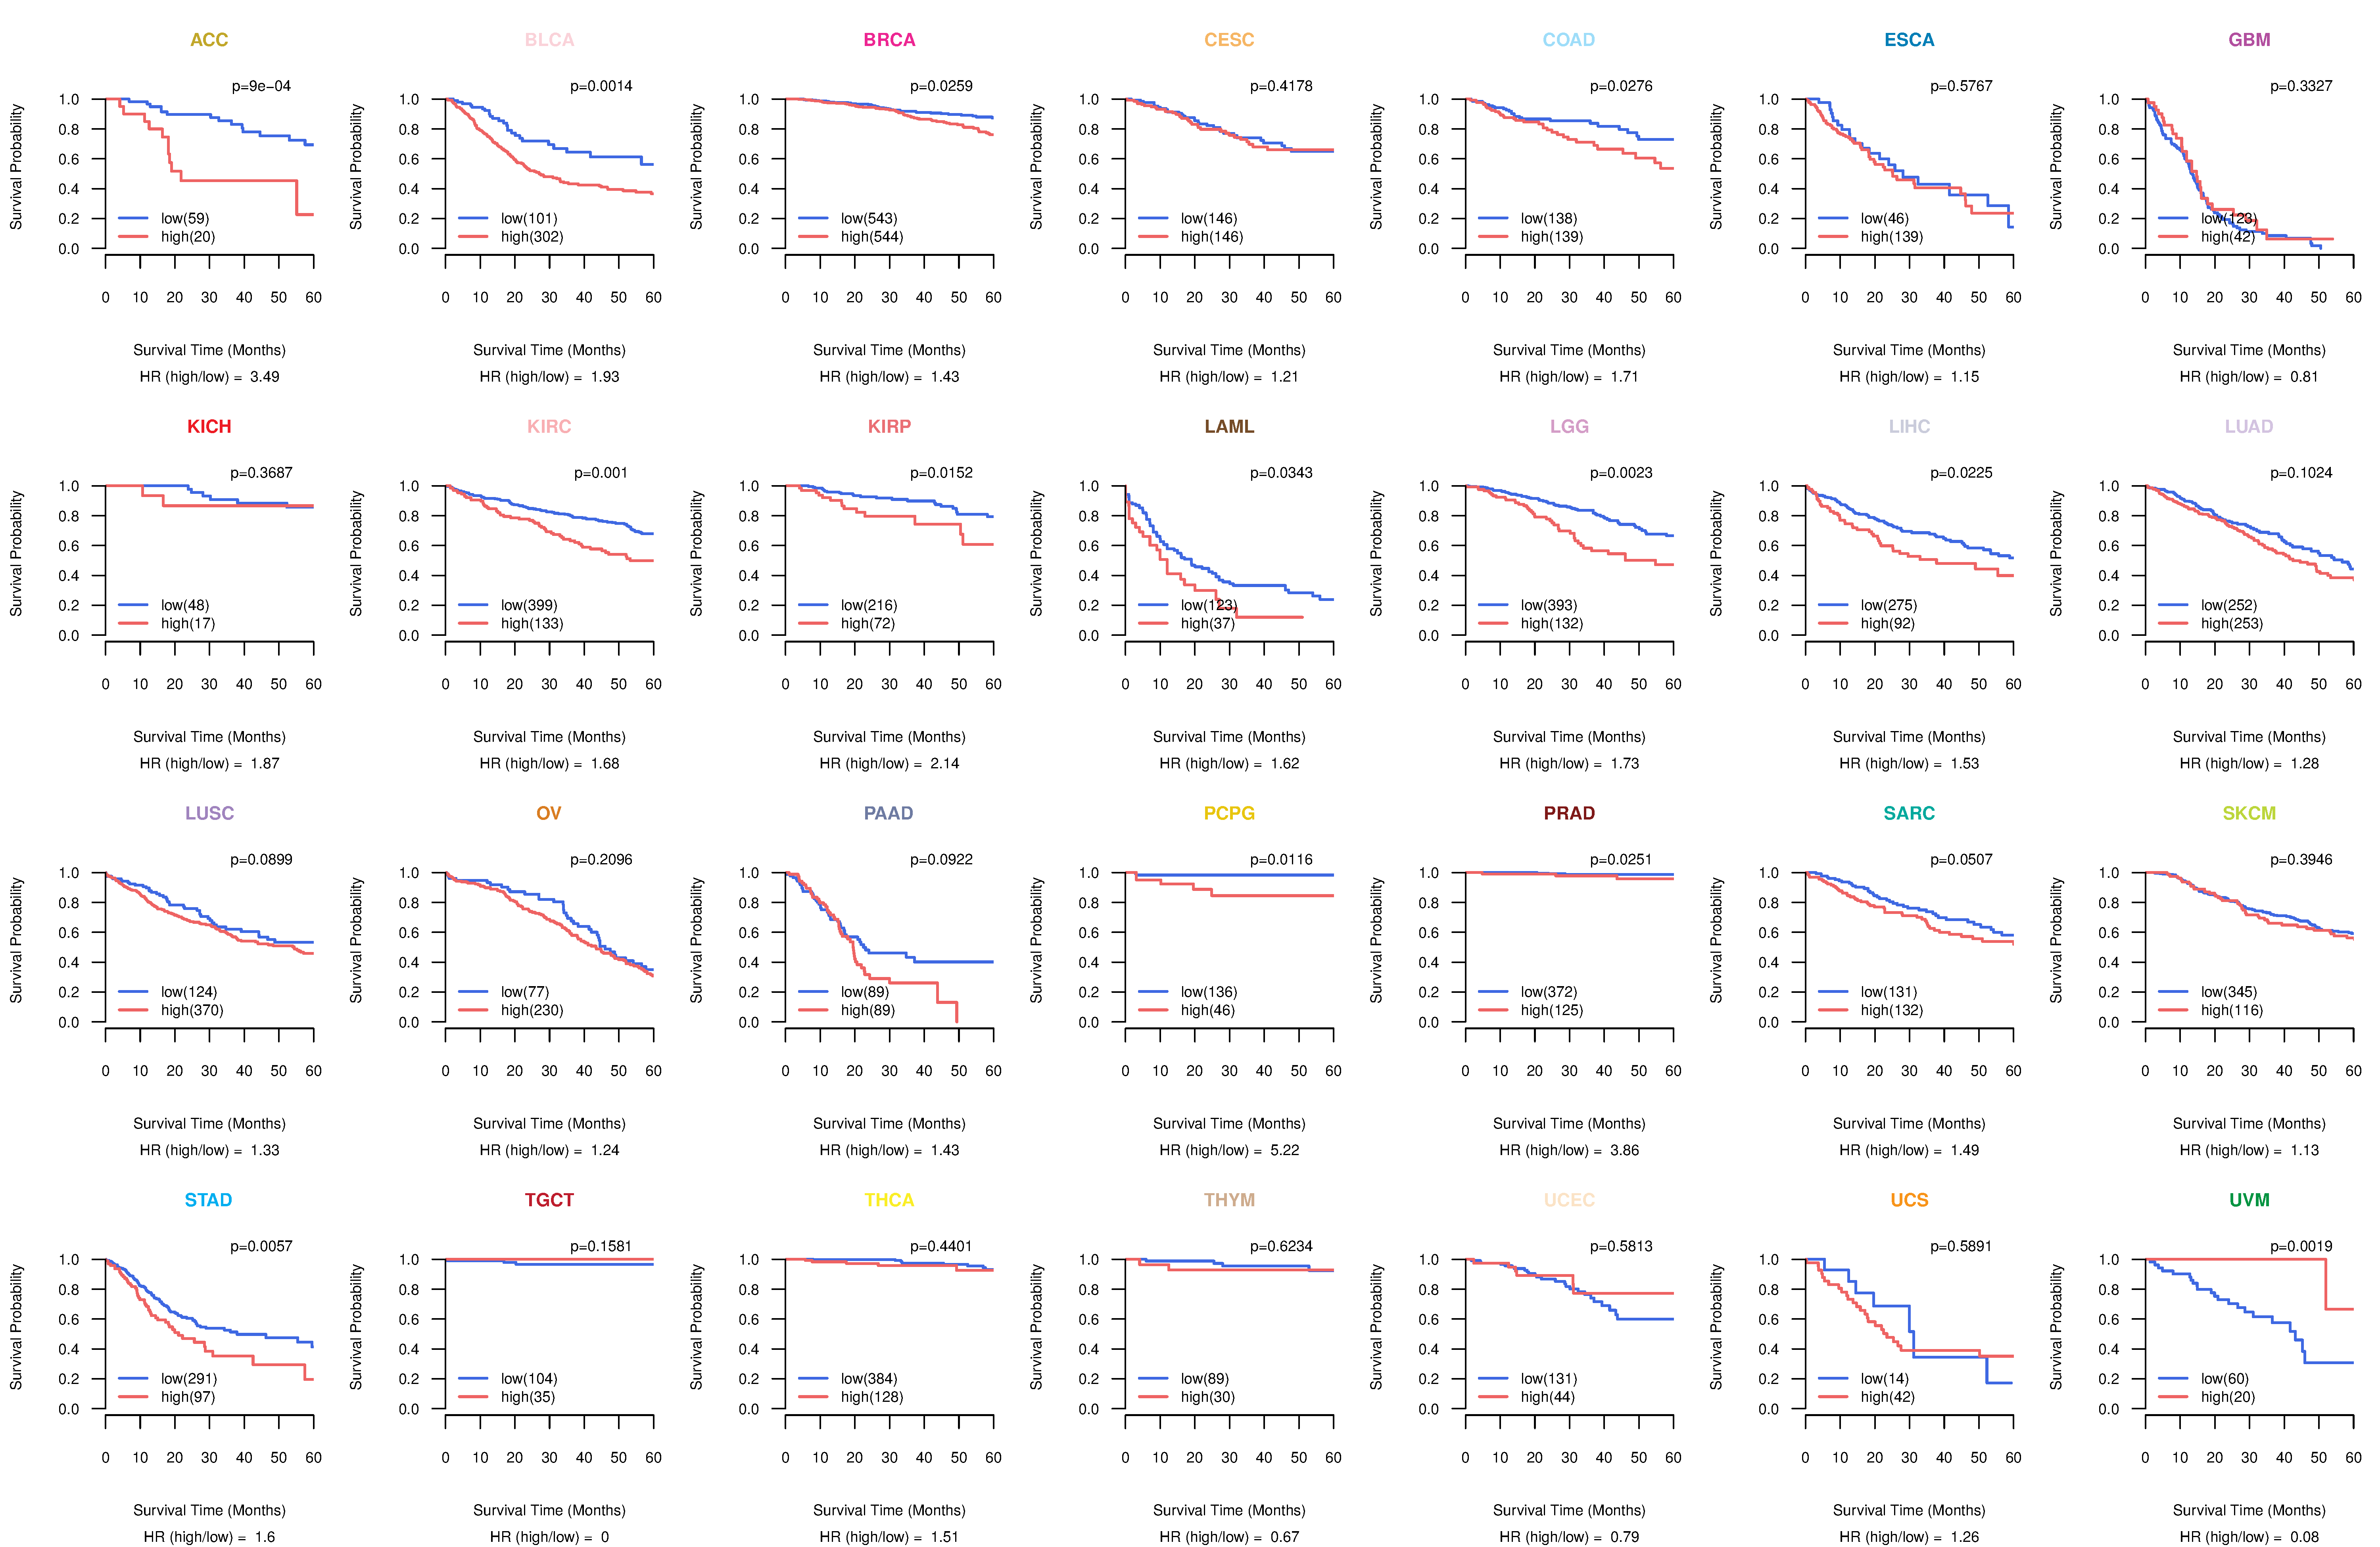
| TissGeneProg for KDELC1 |
| Kaplan-Meier plots with logrank tests of overall survival (OS) using 28 cancer types (TCGA IlluminaHiSeq_RNASeqV2, pan-cancer normalized log2(norm_counts+1) data, version 2016-08-16) (TCGA clinicalMatrix, phenotype data, version 2016-04-27) * Click on the image to enlarge it in a new window. |
 |
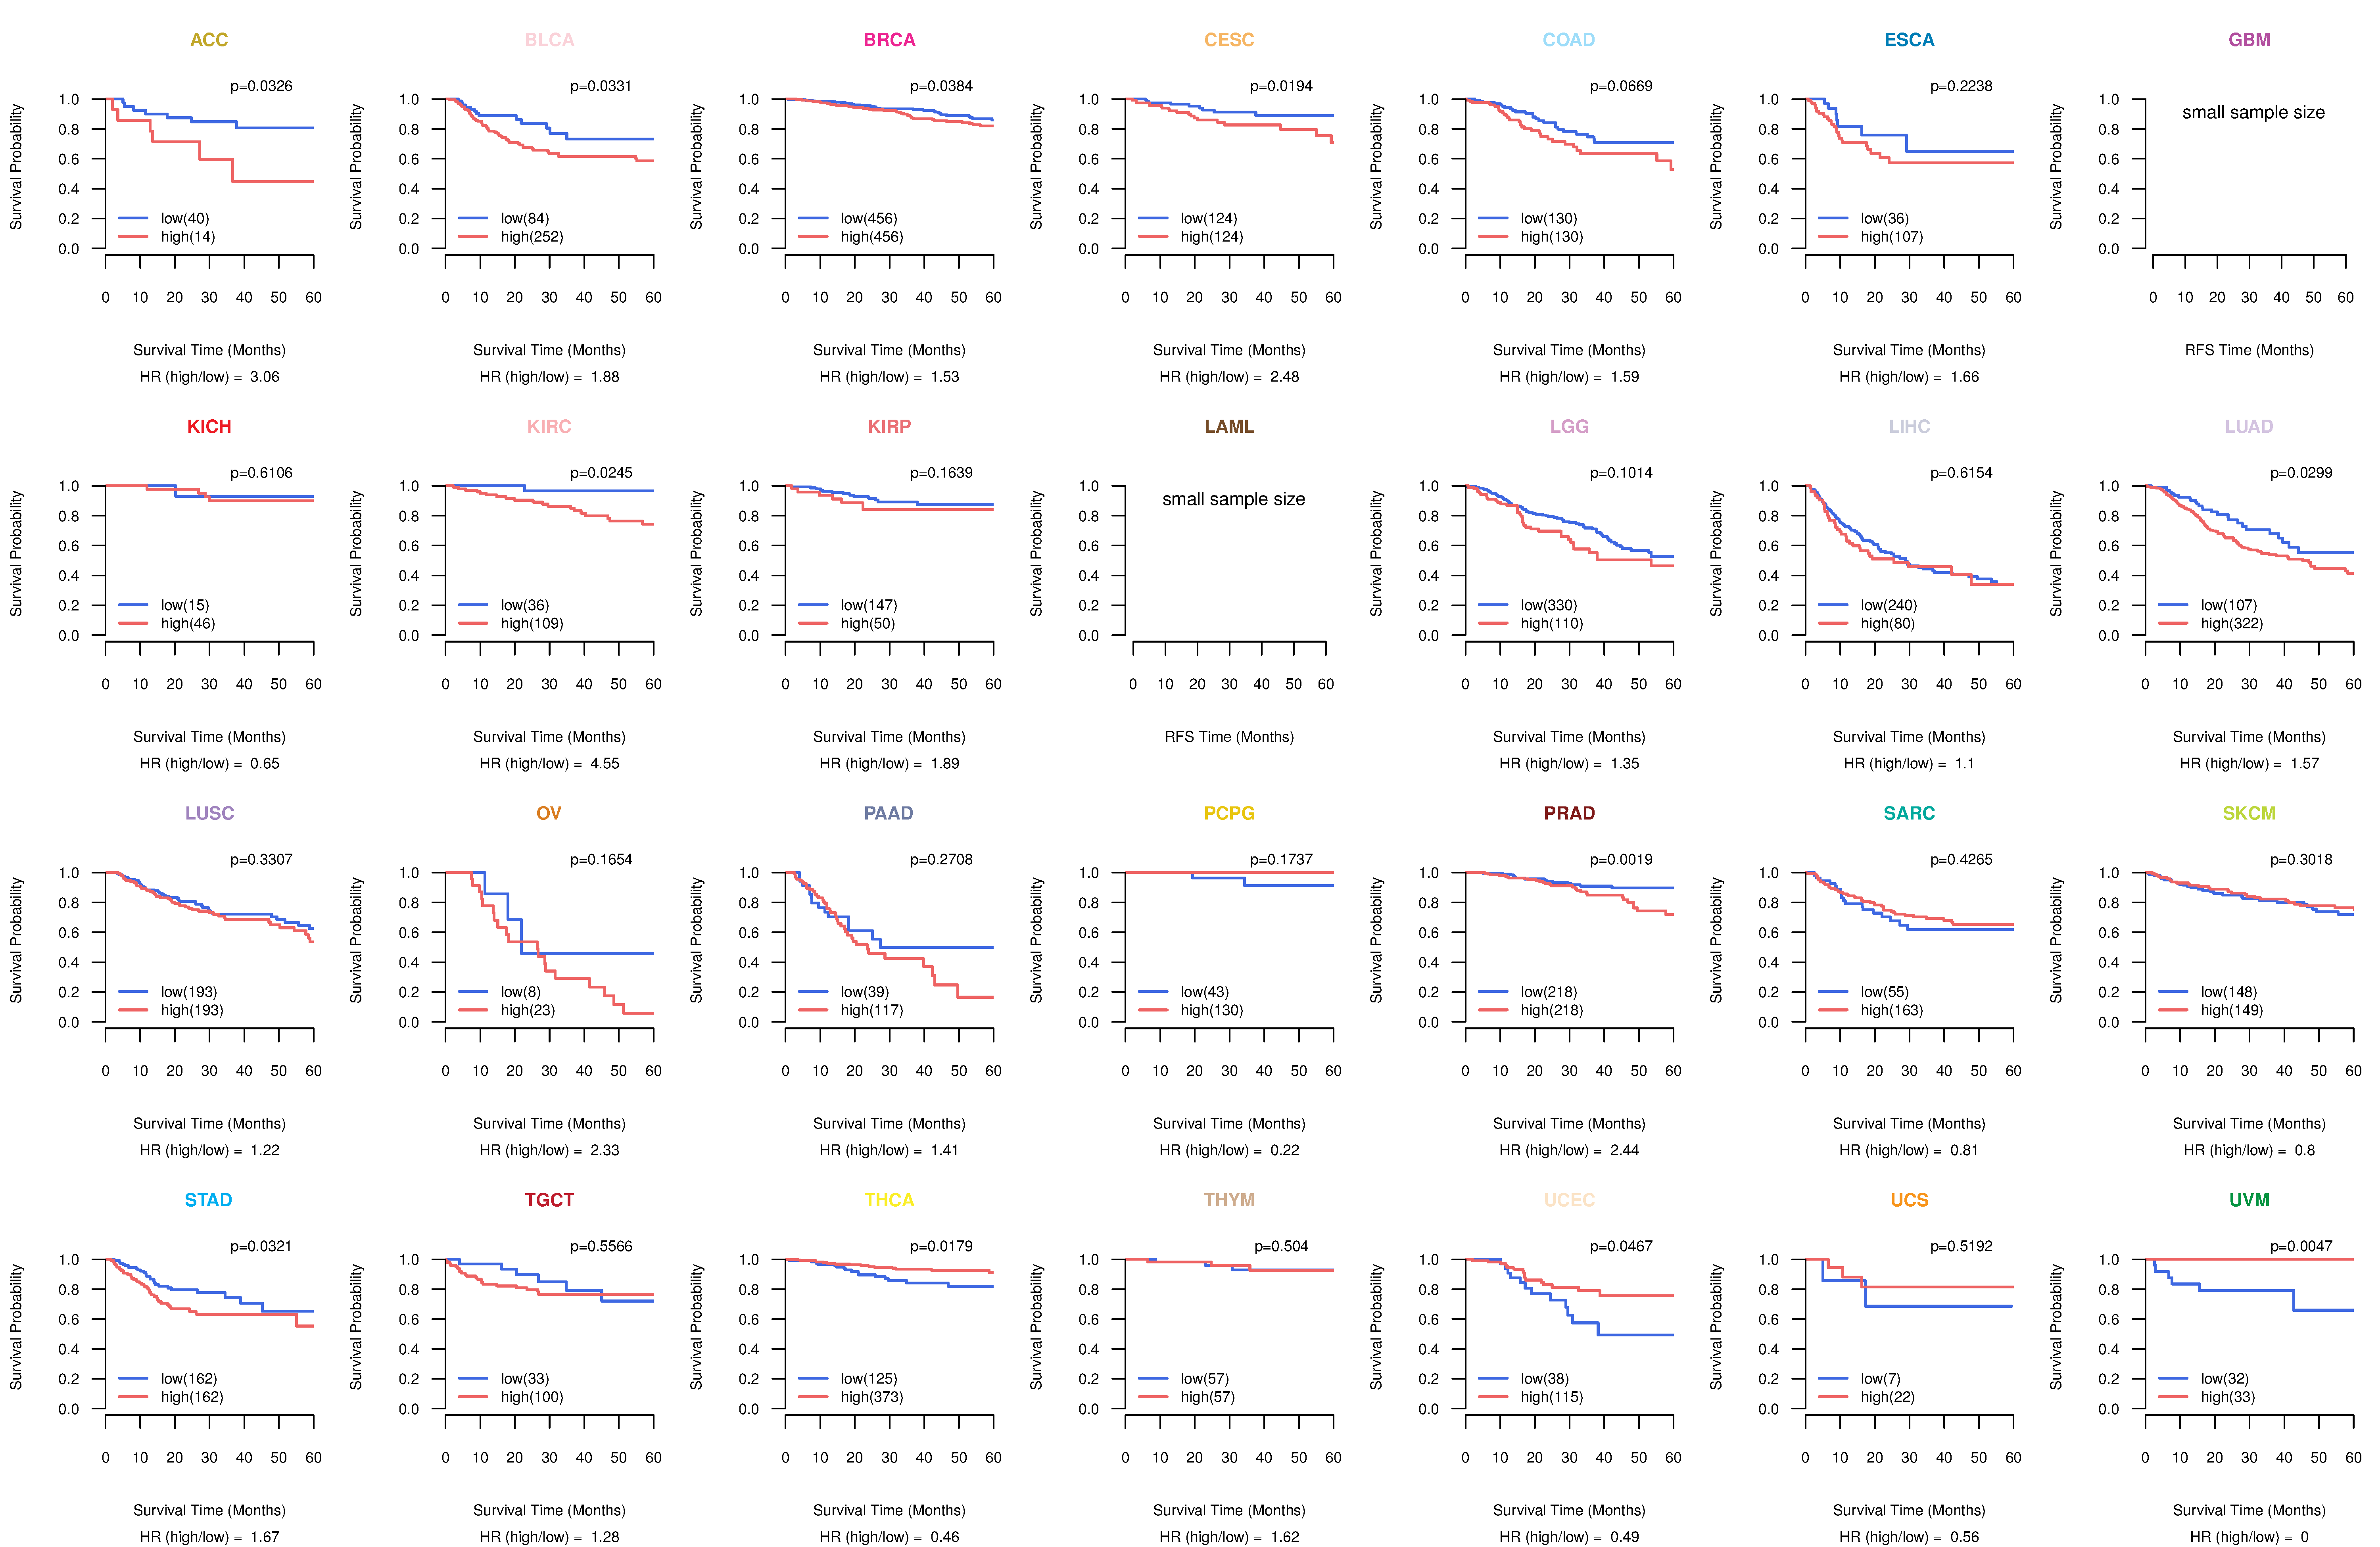
| Kaplan-Meier plots with logrank test of relapse free survival (RFS) using 28 cancer types (TCGA IlluminaHiSeq_RNASeqV2, pan-cancer normalized log2(norm_counts+1) data, version 2016-08-16) (TCGA clinicalMatrix, phenotype data, version 2016-04-27) * Click on the image enlarge it in a new window. |
 |
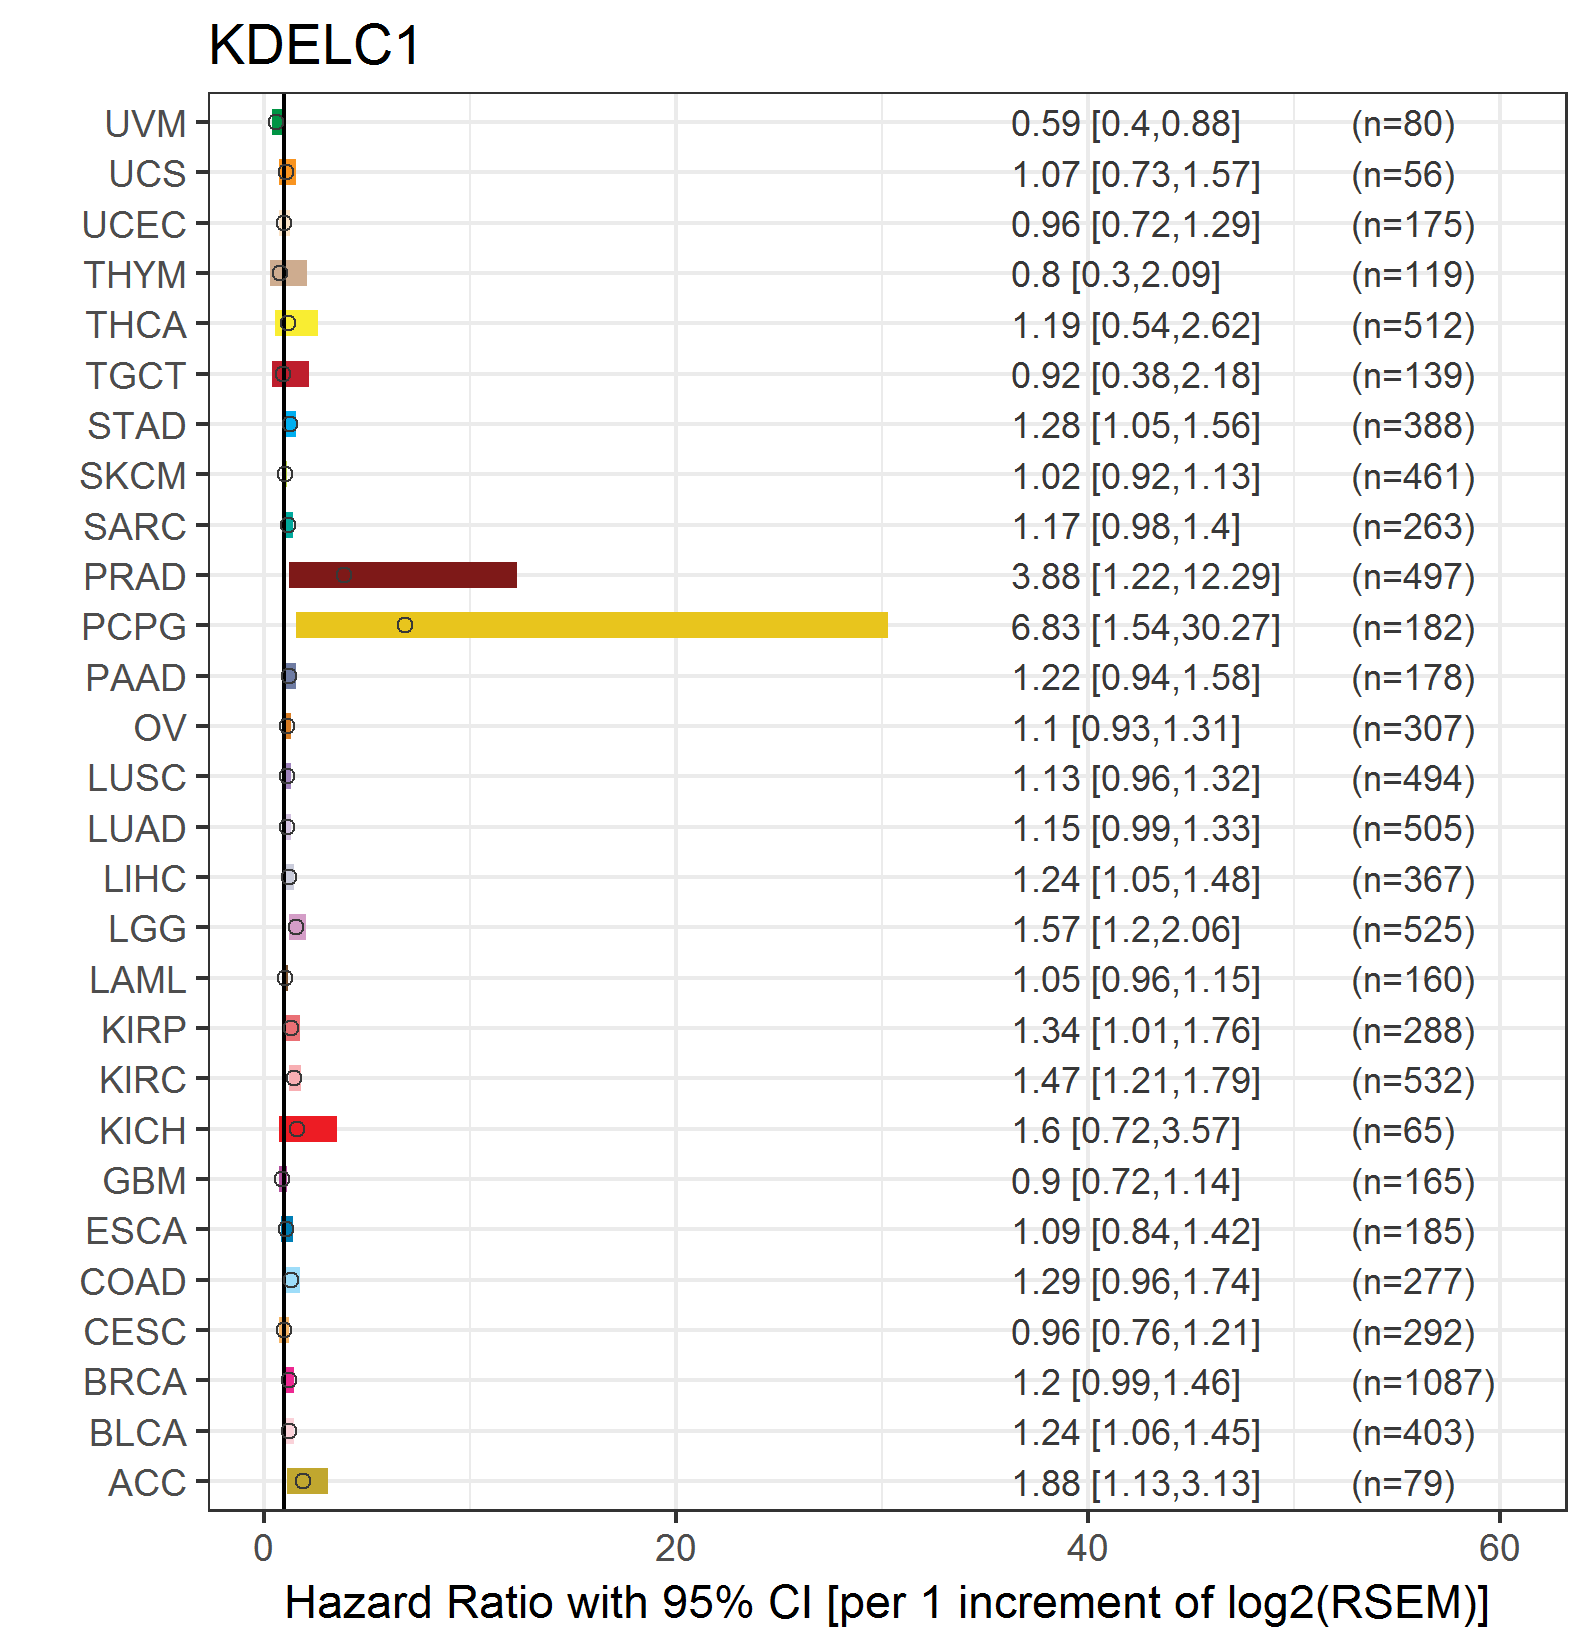
| Forest plot of Cox proportional hazard ratio (HR) and 95% CI of overall survival (OS) using 28 cancer types (TCGA IlluminaHiSeq_RNASeqV2, pan-cancer normalized log2(norm_counts+1) data, version 2016-08-16) (TCGA clinicalMatrix, phenotype data, version 2016-04-27) * Click on the image enlarge it in a new window. |
 |
| Forest plot of Cox proportional hazard ratio (HR) and 95% CI of relapse free survival (RFS) using 28 cancer types (TCGA IlluminaHiSeq_RNASeqV2, pan-cancer normalized log2(norm_counts+1) data, version 2016-08-16) (TCGA clinicalMatrix, phenotype data, version 2016-04-27) * Click on the image enlarge it in a new window. |
 |
| Top |
| TissGeneClin for KDELC1 |
| TissGeneDrug for KDELC1 |
| Drug information targeting TissGene (DrugBank Version 5.0.6, 2017-04-01) |
| DrugBank ID | Drug name | Drug activity | Drug type | Drug status |
| Top |
| TissGeneDisease for KDELC1 |
| Disease information associated with TissGene (DisGeNet, 2016-06-01) |
| Disease ID | Disease name | # pubmeds | Source |
|
Copyright 2016-Present - The University of Texas Health Science Center at Houston (UTHealth) Web File Viewing | How to Report, Fraud, Waste and Abuse | State of Texas | Statewide Search | Texas Homeland Security | Site Policies |