 |
| |
| |
| |
| |
| |
| |
|

| TissGeneSummary for HMGN5 |
 Gene summary Gene summary |
| Basic gene information | Gene symbol | HMGN5 |
| Gene name | high mobility group nucleosome binding domain 5 | |
| Synonyms | NBP-45|NSBP1 | |
| Cytomap | UCSC genome browser: Xq13.3 | |
| Type of gene | protein-coding | |
| RefGenes | NM_030763.2, | |
| Description | high mobility group nucleosome-binding domain-containing protein 5high-mobility group nucleosome binding domain 5nucleosomal binding protein 1nucleosome-binding protein 1 | |
| Modification date | 20141207 | |
| dbXrefs | MIM : 300385 | |
| HGNC : HGNC | ||
| Ensembl : ENSG00000198157 | ||
| HPRD : 02310 | ||
| Vega : OTTHUMG00000021911 | ||
| Protein | UniProt: go to UniProt's Cross Reference DB Table | |
| Expression | CleanEX: HS_HMGN5 | |
| BioGPS: 79366 | ||
| Pathway | NCI Pathway Interaction Database: HMGN5 | |
| KEGG: HMGN5 | ||
| REACTOME: HMGN5 | ||
| Pathway Commons: HMGN5 | ||
| Context | iHOP: HMGN5 | |
| ligand binding site mutation search in PubMed: HMGN5 | ||
| UCL Cancer Institute: HMGN5 | ||
| Assigned class in TissGDB* | C | |
| Included tissue-specific gene expression resources | TiGER,GTEx | |
| Specific-tissues in normal samples (assigned by TissGDB using HPA, TiGER, and GTEx) | Bone marrowTestis | |
| Cancer types related to the specific-tissues in cancer samples (assigned by TissGDB using TCGA) | LAMLTGCT | |
| Reference showing the relevant tissue of HMGN5 | ||
| Description by TissGene annotations | ||
| * Class A consists of genes with literature evidence and is part of the cTissGenes. Class B consists of only cTissGenes without additional evidence. The remaining genes belong to Class C. |
| Gene ontology having evidence of Inferred from Direct Assay (IDA) from Entrez |
| GO ID | GO term | PubMed ID |
| Top |
| TissGeneExp for HMGN5 |
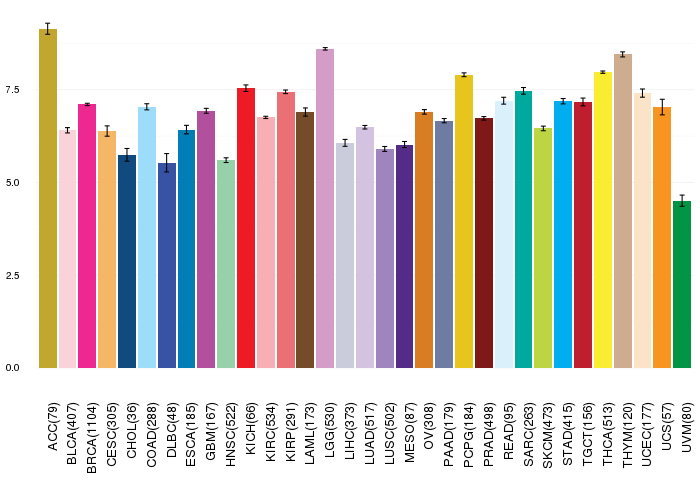
| Gene expressions across 28 cancer types (X-axis: cancer type and Y-axis: log2(norm_counts+1)) (TCGA IlluminaHiSeq_RNASeqV2, pan-cancer normalized log2(norm_counts+1) data, version 2016-08-16) |
 |
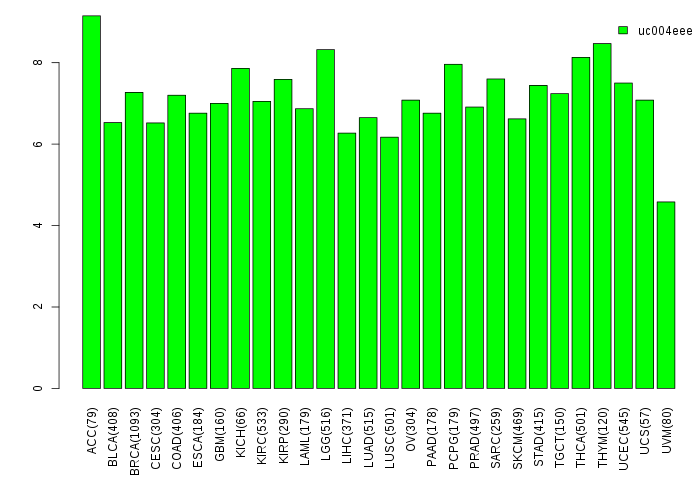
| Gene isoform expressions across 28 cancer types (X-axis: cancer type and Y-axis: log2(norm_counts+1)) (TCGA pan-cancer tcga_rsem_isoform_tpm, version 2016-09-01) |
 |
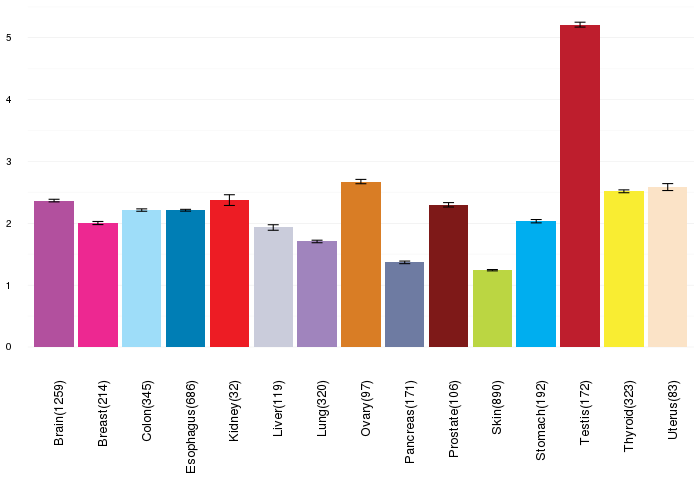
| Gene expressions across normal tissues of GTEx data (GTEx GTEx_Analysis_v6_RNA-seq_RNA-SeQCv1.1.8_gene_rpkm.gct) - Here, we shows the matched tissue types only among our 28 cancer types. |
 |
| Different expressions across 14 cancer types with more than 10 samples between matched tumors and normals (X-axis: cancer type and Y-axis: log2(norm_counts+1)) (TCGA IlluminaHiSeq_RNASeqV2, pan-cancer normalized log2(norm_counts+1) data, version 2016-08-16) |
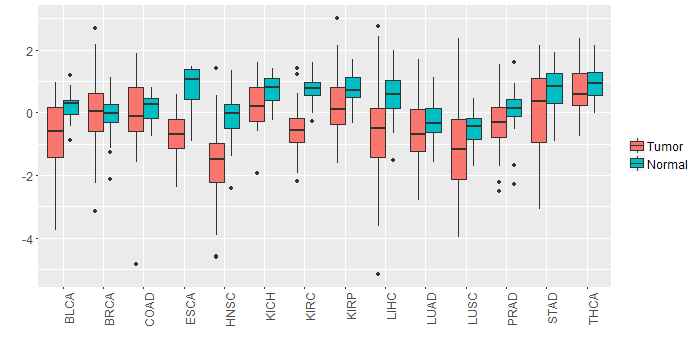 |
| - Significantly differentially expressed cancer types and information. (|Fold change|>1 and FDR<0.05) |
| Cancer type | Mean(exp) in tumor | Mean(exp) in matched normal | Log2FC | P-val. | FDR |
| HNSC | -1.562684756 | -0.164789408 | -1.397895349 | 2.23E-08 | 2.46E-07 |
| KIRC | -0.510199324 | 0.74453401 | -1.254733333 | 9.39E-28 | 1.45E-26 |
| LIHC | -0.722771268 | 0.533184732 | -1.255956 | 2.77E-06 | 1.35E-05 |
| ESCA | -0.694613086 | 0.762323277 | -1.456936364 | 0.000678 | 0.011169422 |
| Top |
| TissGene-miRNA for HMGN5 |
| Significantly anti-correlated miRNAs of TissGene across 28 cancer types (Gene-miRNA relations from TargetScanHuman Relsease 7.1, Conserved_Site_Context_Scores.txt.zip, 06.01.2016) (TCGA IlluminaHiSeq_miRNASeq, log2(RPM+1) data, version 2016-11-21) (TCGA IlluminaHiSeq_RNASeqV2, log2(normalized_count+1) data, version 2016-08-16) (Spearman’s Rank Correlation (p-value<0.05 and coefficient<-0.25)) |
| Cancer type | miRNA id | miRNA accession | P-val. | Coeff. | # samples |
| Top |
| TissGeneMut for HMGN5 |
| TissGeneSNV for HMGN5 |
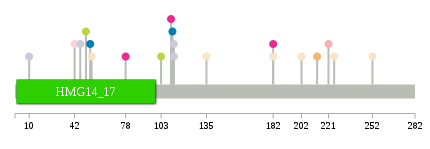
| nsSNV counts per each loci. Different colors of circles represent different cancer types. Circle size denotes number of samples. (TCGA somatic mutation (SNPs and small INDELs) data, version 2016-04-25) * Click on the image to enlarge it in a new window. |
 |
 |
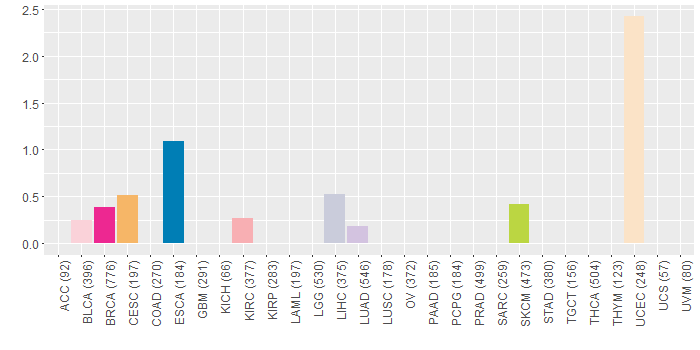
| Somatic nucleotide variants of TissGene across 28 cancer types (X-axis: cancer type and Y-axis: % of mutated samples) The numbers in parentheses are numbers of samples with mutation (nsSNVs). (TCGA somatic mutation (SNPs and small INDELs) data, version 2016-04-25) |
 |
| - nsSNVs sorted by frequency. |
| AAchange | Cancer type | # samples |
| p.E53D | ESCA | 1 |
| p.E110A | BRCA | 1 |
| p.E103K | SKCM | 1 |
| p.E135G | UCEC | 1 |
| p.D225Y | UCEC | 1 |
| p.G112X | LIHC | 1 |
| p.K221I | KIRC | 1 |
| p.E139K | READ | 1 |
| p.R202I | UCEC | 1 |
| p.S42L | BLCA | 1 |
| p.E78* | BRCA | 1 |
| p.G182R | UCEC | 1 |
| p.G10C | LUAD | 1 |
| p.D213N | CESC | 1 |
| p.K46R | LIHC | 1 |
| p.K111R | ESCA | 1 |
| p.E252D | UCEC | 1 |
| p.D50N | SKCM | 1 |
| p.G112* | LIHC | 1 |
| p.G182R | BRCA | 1 |
| p.E54* | UCEC | 1 |
| Top |
| TissGeneCNV for HMGN5 |
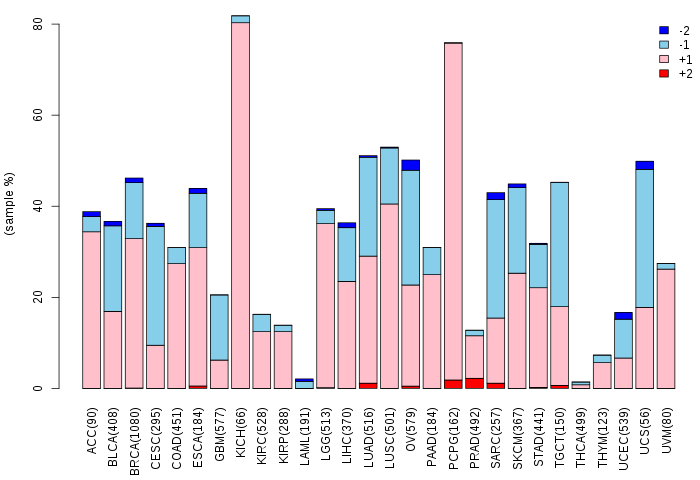
| Copy number variations of TissGene across 28 cancer types (X-axis: cancer type and Y-axis: % of CNV samples) (TCGA Gistic2_CopyNumber_Gistic2_all_data_by_genes, Gistic2 copy number data, version 2016-08-16) |
 |
| Top |
| TissGeneFusions for HMGN5 |
| Fusion genes including TissGene (ChimerDB 3.0, 2016-12-01 and TCGA fusion Portal 2015-12-01) |
| Database | Src | Cancer type | Sample | Fusion gene | ORF | 5'-gene BP | 3'-gene BP |
| Chimerdb3.0 | ChiTaRs | NA | BF812950 | OPTN-HMGN5 | chr10:13161040 | chrX:80371707 |
| Top |
| TissGeneNet for HMGN5 |
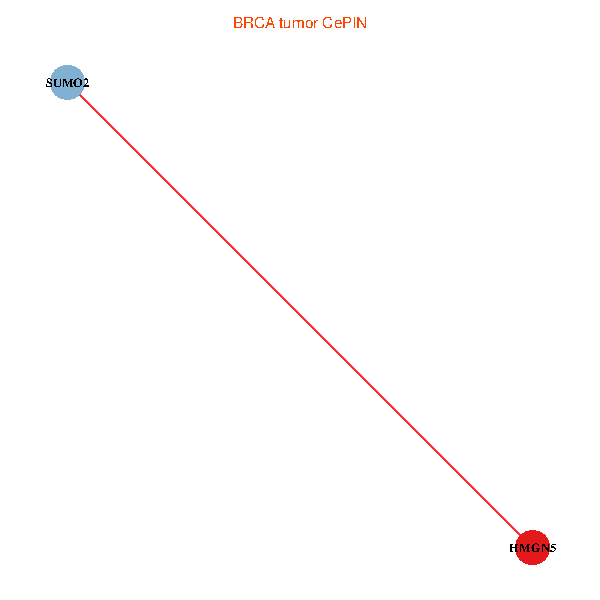
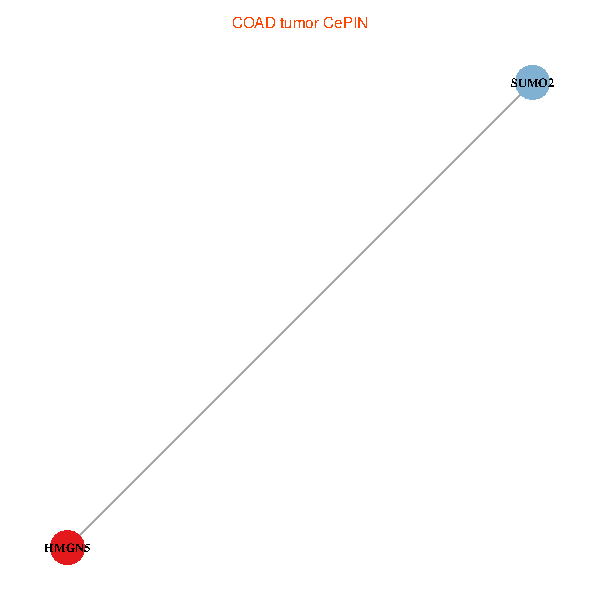
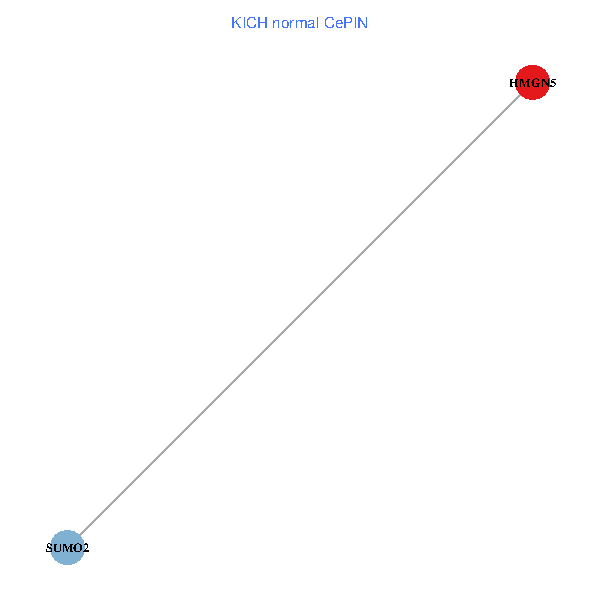
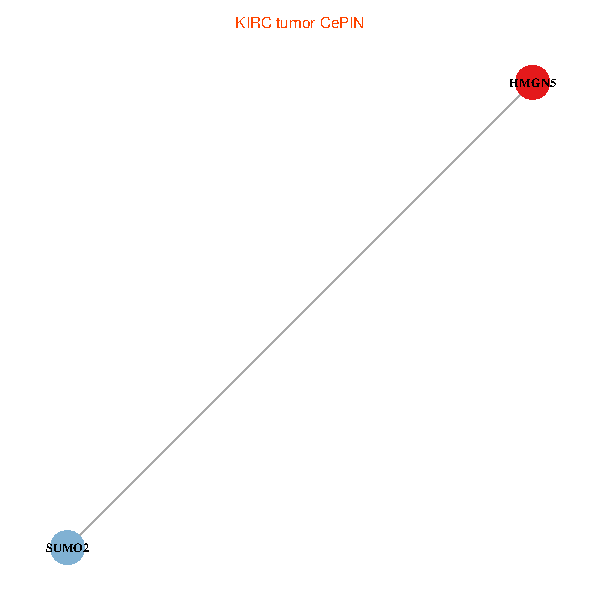
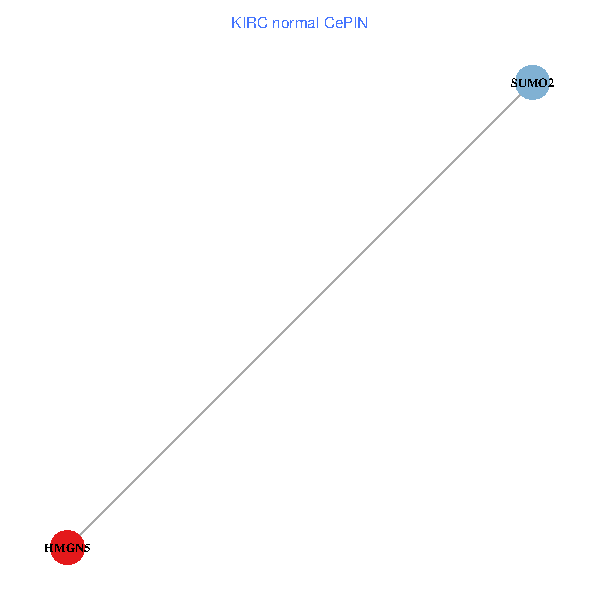
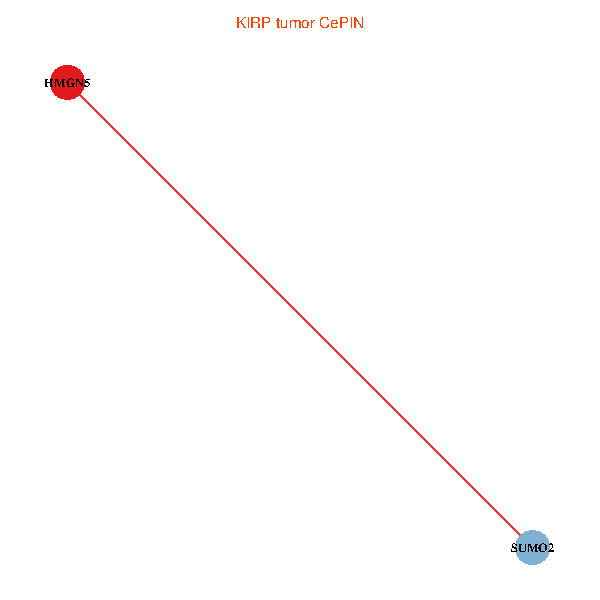
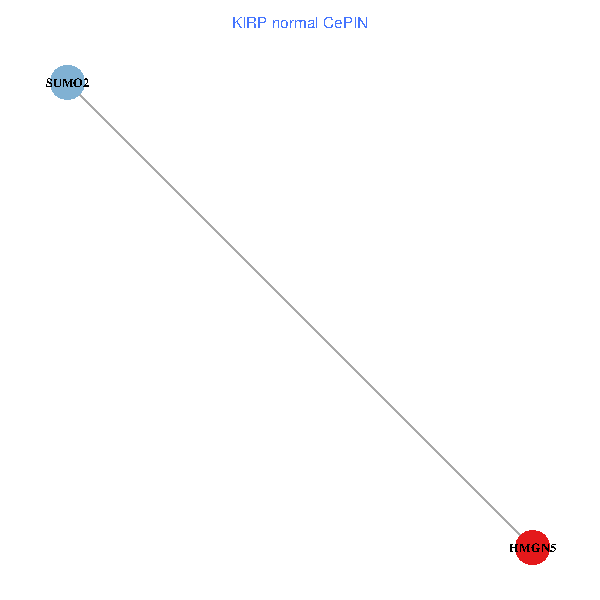
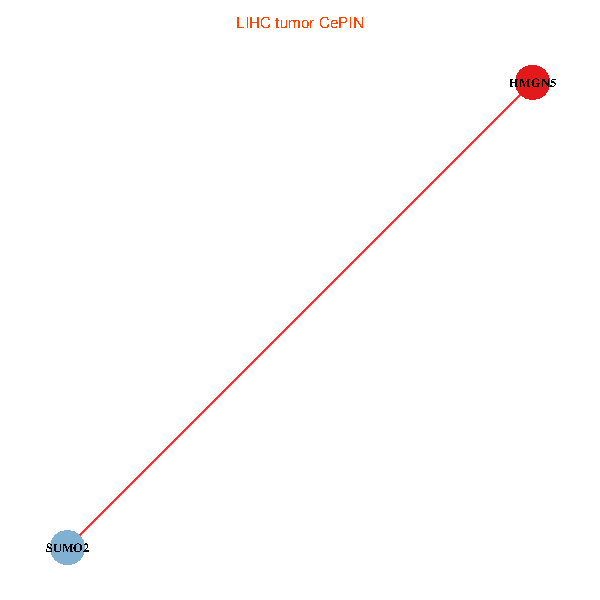
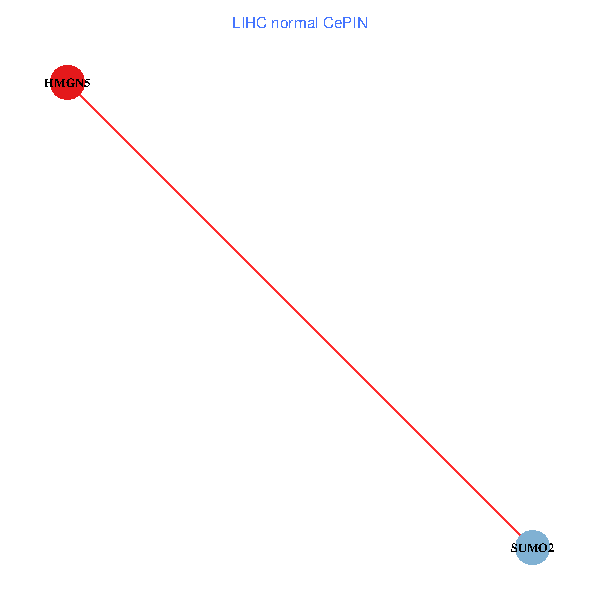
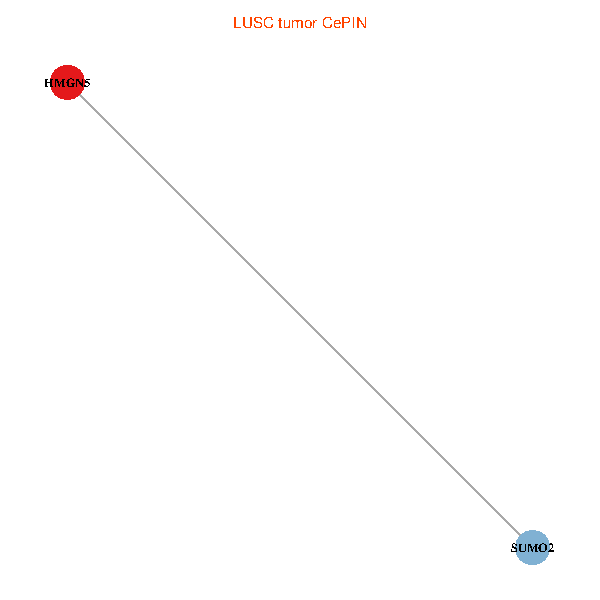
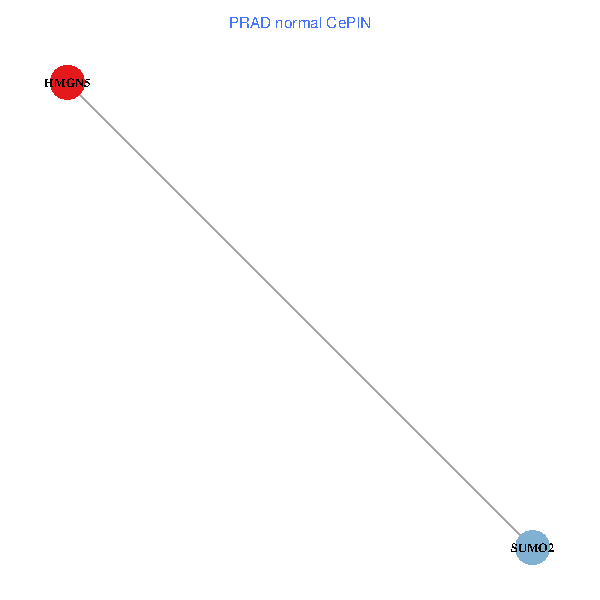
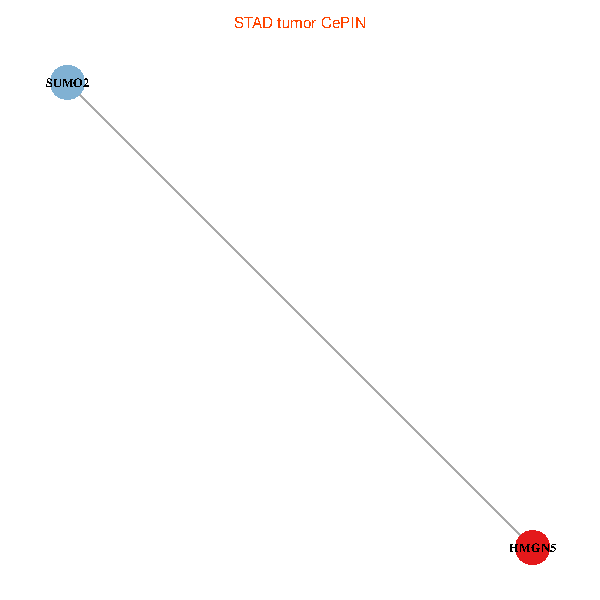
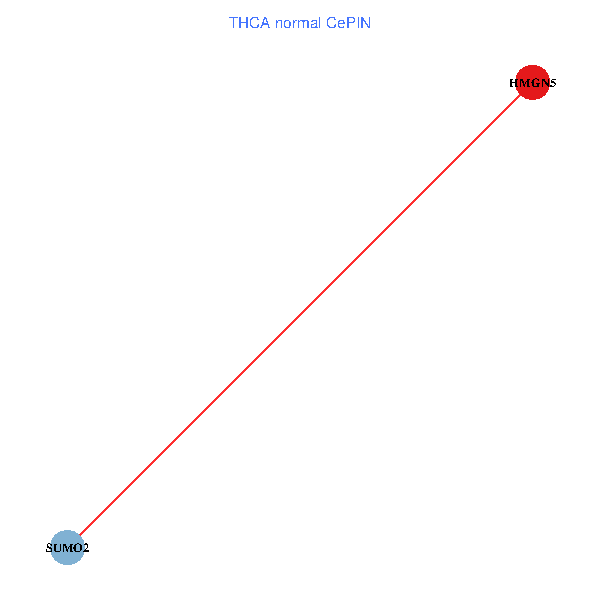
| Co-expressed gene networks based on protein-protein interaction data (CePIN) (TCGA IlluminaHiSeq_RNASeqV2, pan-cancer normalized log2(norm_counts+1) data, version 2016-08-16) (PINA2 ppi data) |
| BRCA (tumor) | BRCA (normal) |
| HMGN5, SUMO2 (tumor) | HMGN5, SUMO2 (normal) |
 |  |
| COAD (tumor) | COAD (normal) |
| HMGN5, SUMO2 (tumor) | HMGN5, SUMO2 (normal) |
 |  |
| HNSC (tumor) | HNSC (normal) |
| HMGN5, SUMO2 (tumor) | HMGN5, SUMO2 (normal) |
 |  |
| KICH (tumor) | KICH (normal) |
| HMGN5, SUMO2 (tumor) | HMGN5, SUMO2 (normal) |
 |  |
| KIRC (tumor) | KIRC (normal) |
| HMGN5, SUMO2 (tumor) | HMGN5, SUMO2 (normal) |
 |  |
| KIRP (tumor) | KIRP (normal) |
| HMGN5, SUMO2 (tumor) | HMGN5, SUMO2 (normal) |
 |  |
| LIHC (tumor) | LIHC (normal) |
| HMGN5, SUMO2 (tumor) | HMGN5, SUMO2 (normal) |
 |  |
| LUAD (tumor) | LUAD (normal) |
| HMGN5, SUMO2 (tumor) | HMGN5, SUMO2 (normal) |
 |  |
| LUSC (tumor) | LUSC (normal) |
| HMGN5, SUMO2 (tumor) | HMGN5, SUMO2 (normal) |
 |  |
| PRAD (tumor) | PRAD (normal) |
| HMGN5, SUMO2 (tumor) | HMGN5, SUMO2 (normal) |
 |  |
| STAD (tumor) | STAD (normal) |
| HMGN5, SUMO2 (tumor) | HMGN5, SUMO2 (normal) |
 |  |
| THCA (tumor) | THCA (normal) |
| HMGN5, SUMO2 (tumor) | HMGN5, SUMO2 (normal) |
 |  |
| Top |
| TissGeneProg for HMGN5 |
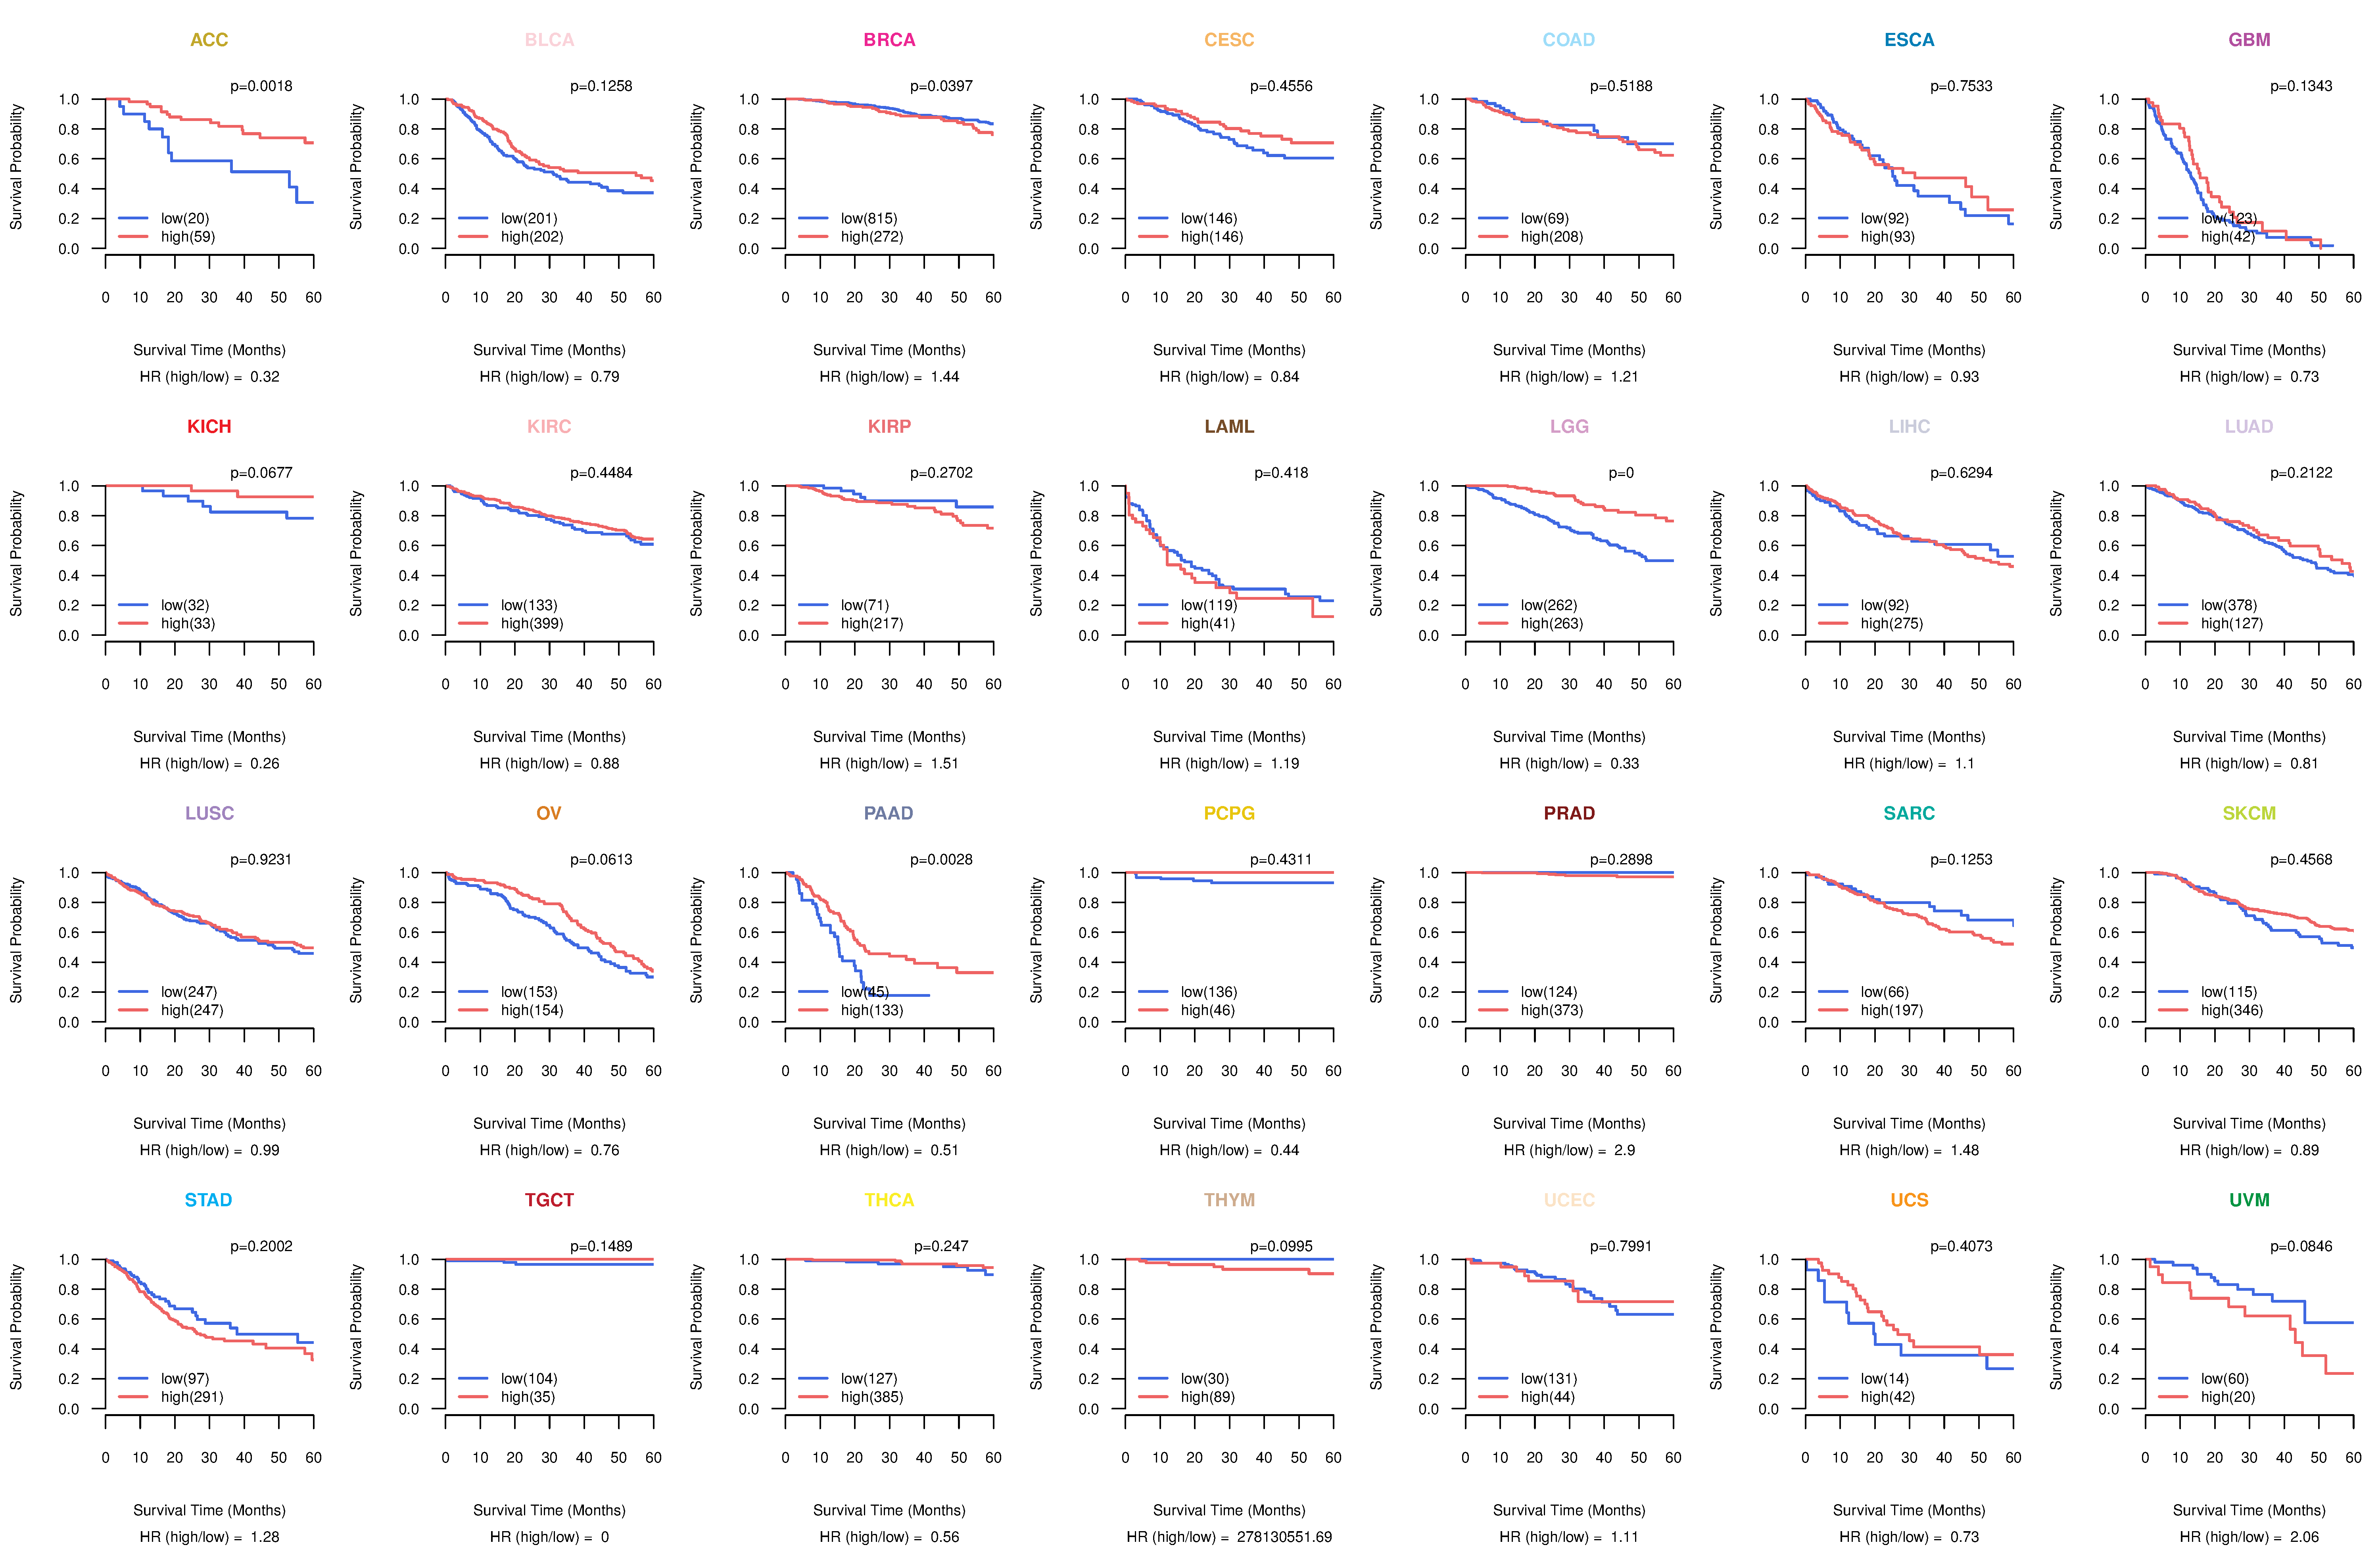
| Kaplan-Meier plots with logrank tests of overall survival (OS) using 28 cancer types (TCGA IlluminaHiSeq_RNASeqV2, pan-cancer normalized log2(norm_counts+1) data, version 2016-08-16) (TCGA clinicalMatrix, phenotype data, version 2016-04-27) * Click on the image to enlarge it in a new window. |
 |
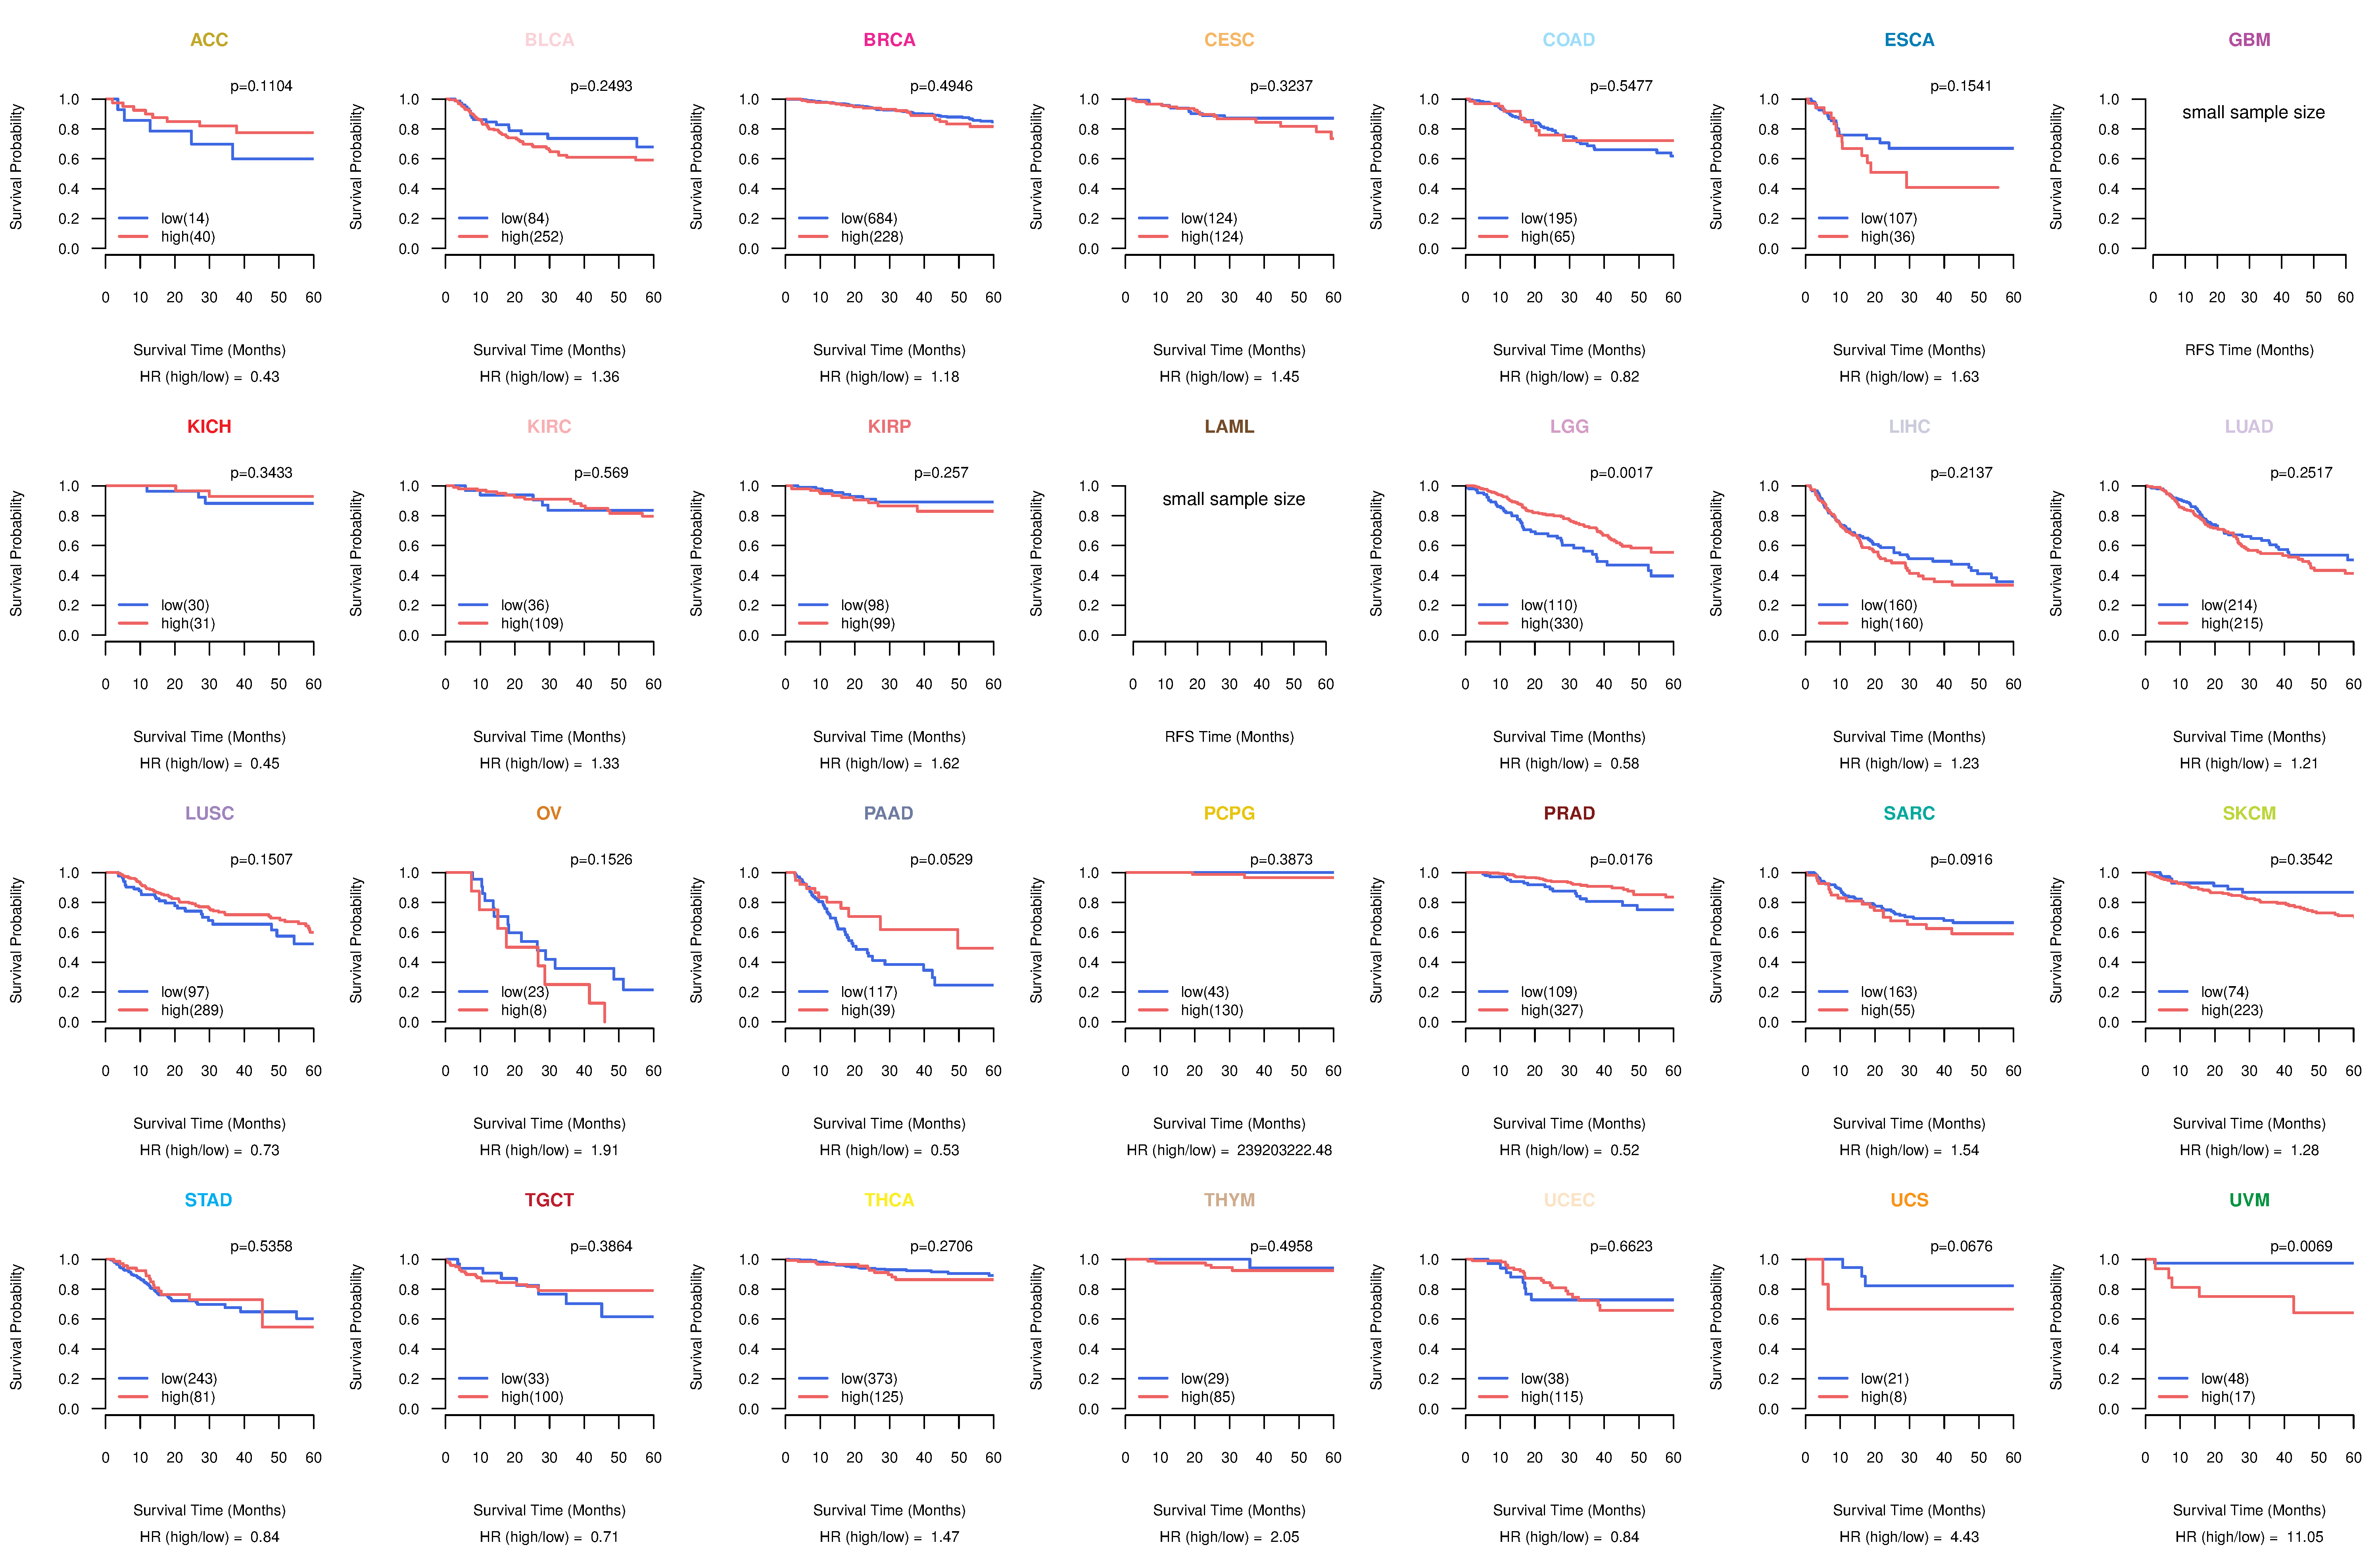
| Kaplan-Meier plots with logrank test of relapse free survival (RFS) using 28 cancer types (TCGA IlluminaHiSeq_RNASeqV2, pan-cancer normalized log2(norm_counts+1) data, version 2016-08-16) (TCGA clinicalMatrix, phenotype data, version 2016-04-27) * Click on the image enlarge it in a new window. |
 |
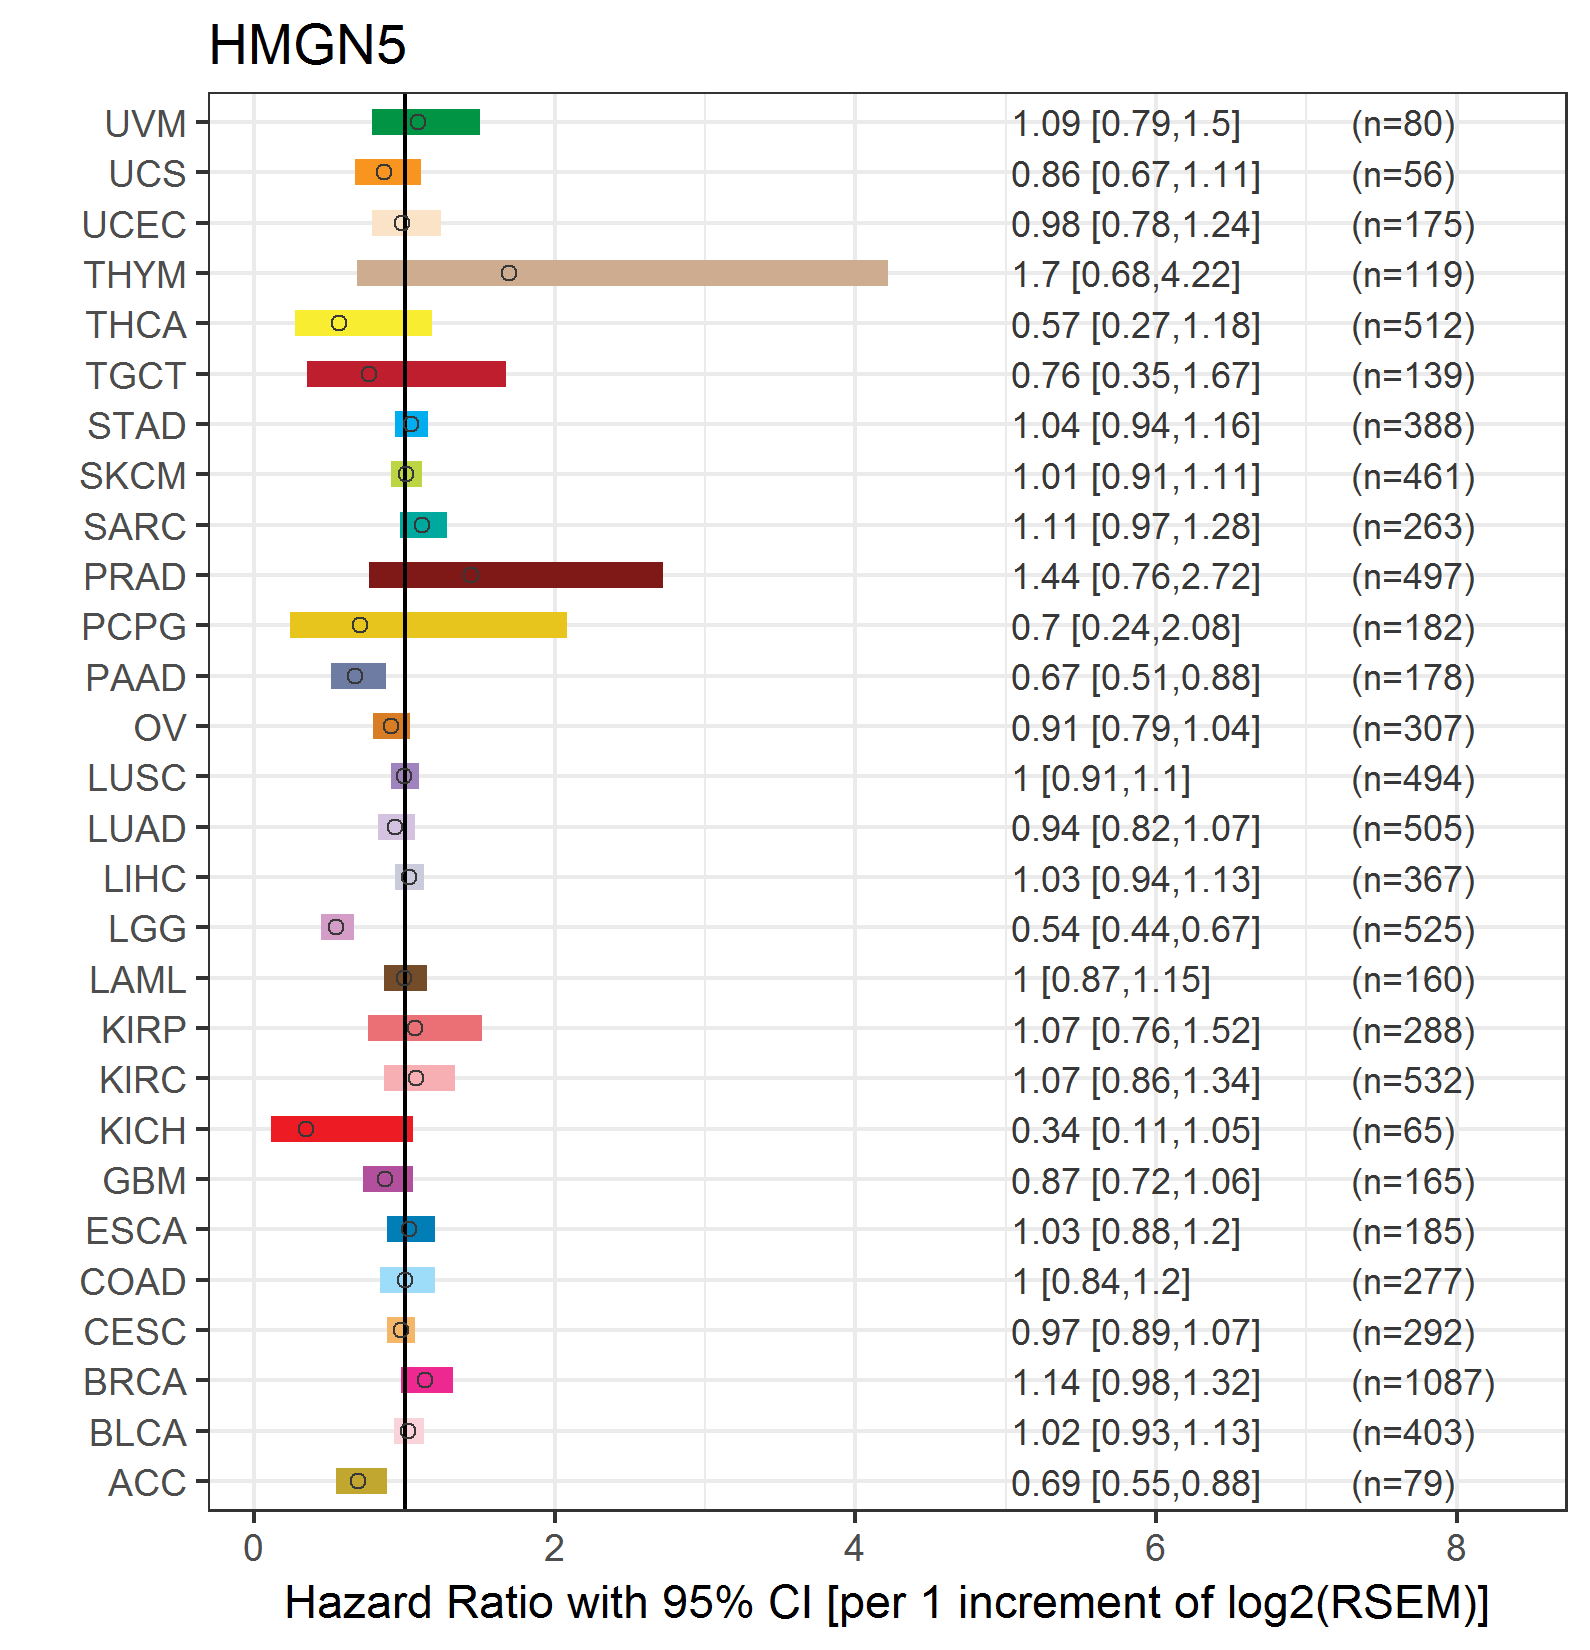
| Forest plot of Cox proportional hazard ratio (HR) and 95% CI of overall survival (OS) using 28 cancer types (TCGA IlluminaHiSeq_RNASeqV2, pan-cancer normalized log2(norm_counts+1) data, version 2016-08-16) (TCGA clinicalMatrix, phenotype data, version 2016-04-27) * Click on the image enlarge it in a new window. |
 |
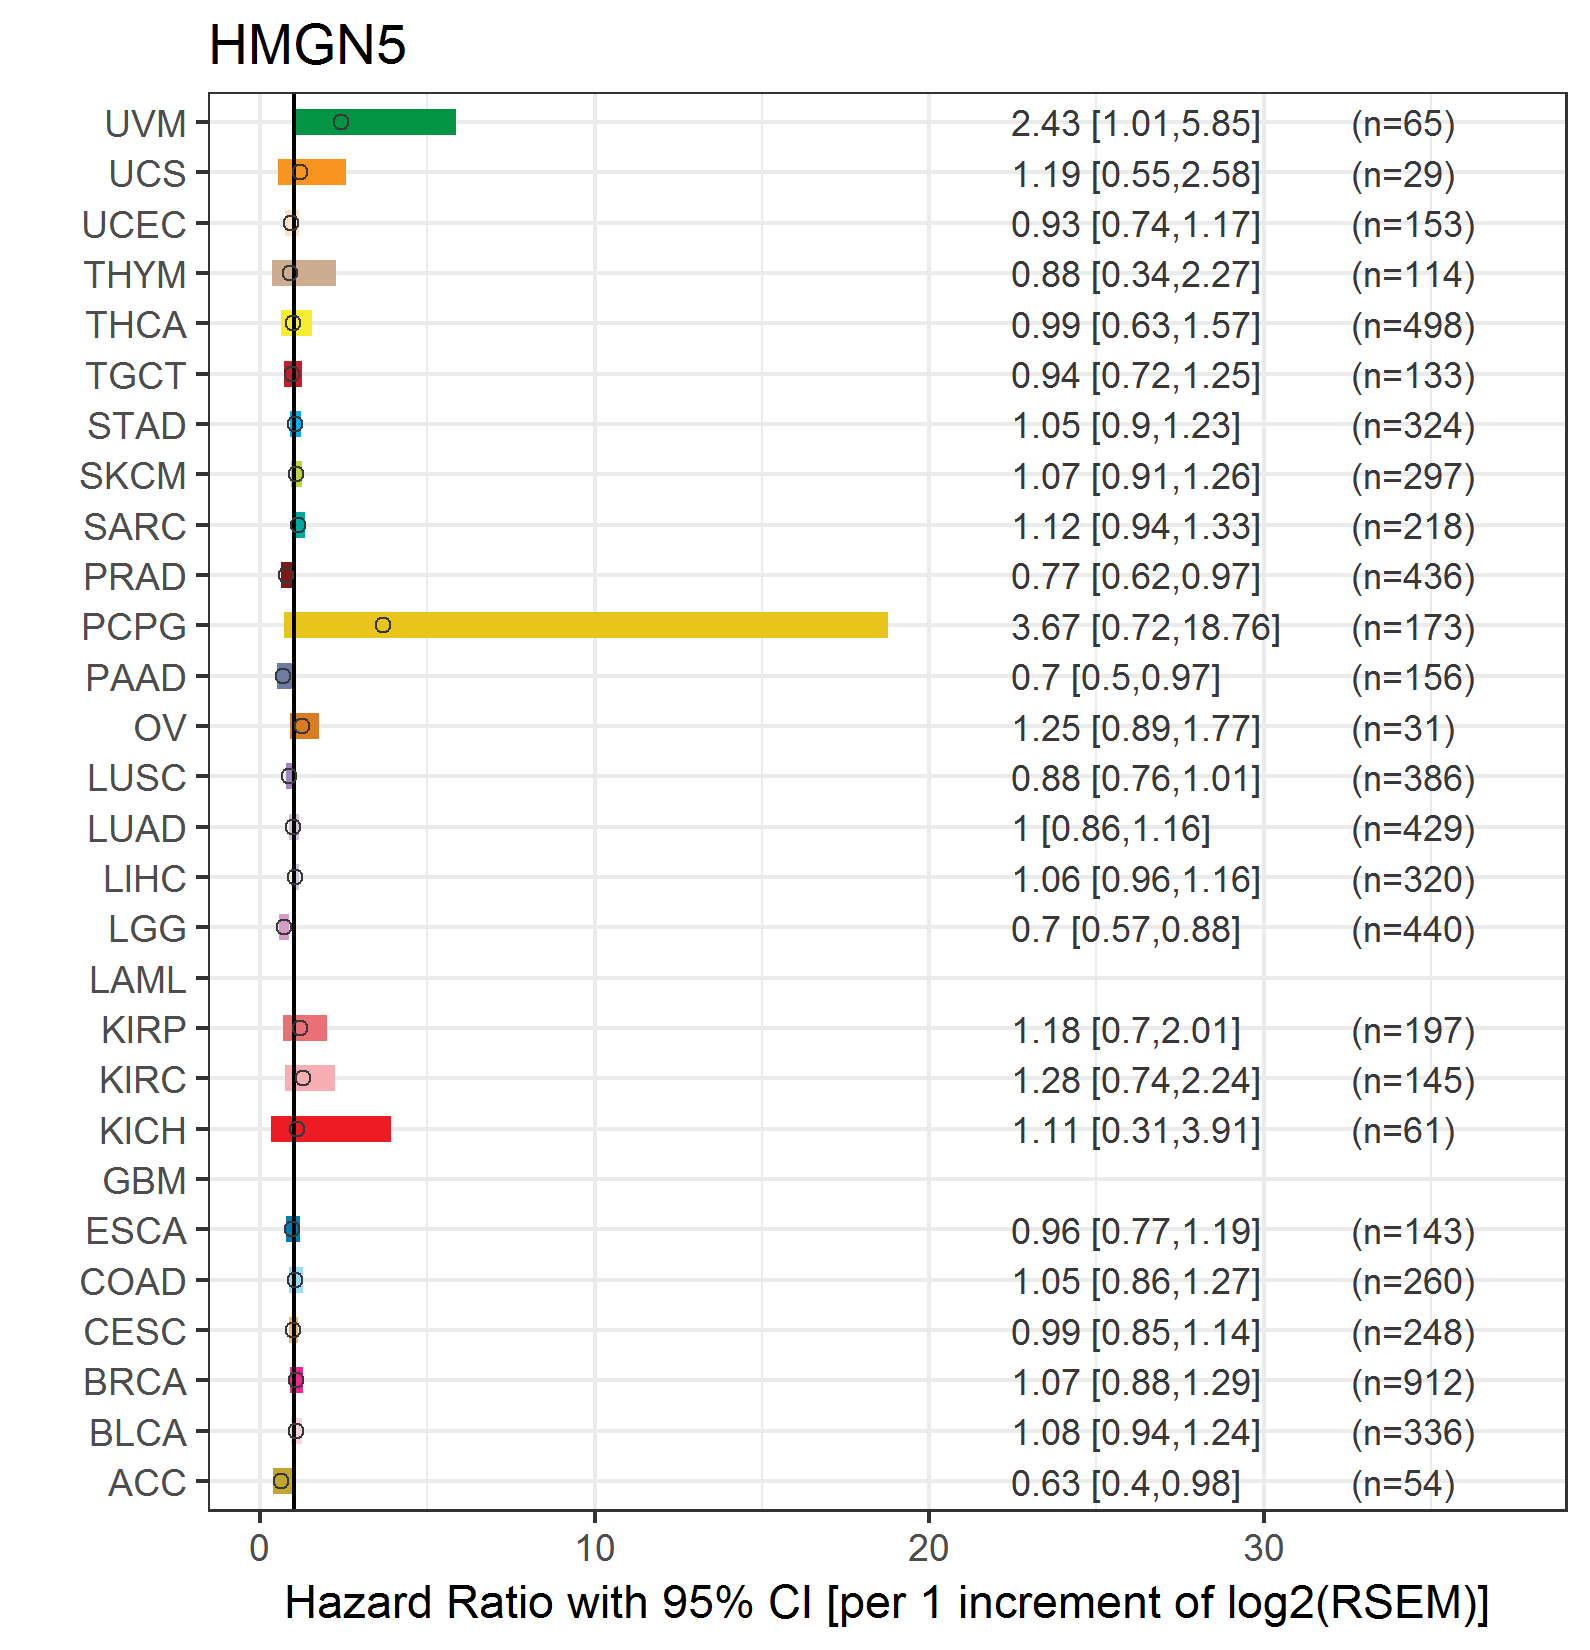
| Forest plot of Cox proportional hazard ratio (HR) and 95% CI of relapse free survival (RFS) using 28 cancer types (TCGA IlluminaHiSeq_RNASeqV2, pan-cancer normalized log2(norm_counts+1) data, version 2016-08-16) (TCGA clinicalMatrix, phenotype data, version 2016-04-27) * Click on the image enlarge it in a new window. |
 |
| Top |
| TissGeneClin for HMGN5 |
| TissGeneDrug for HMGN5 |
| Drug information targeting TissGene (DrugBank Version 5.0.6, 2017-04-01) |
| DrugBank ID | Drug name | Drug activity | Drug type | Drug status |
| Top |
| TissGeneDisease for HMGN5 |
| Disease information associated with TissGene (DisGeNet, 2016-06-01) |
| Disease ID | Disease name | # pubmeds | Source |
| umls:C0029463 | Osteosarcoma | 4 | BeFree |
| umls:C0376358 | Malignant neoplasm of prostate | 4 | BeFree |
| umls:C0585442 | Osteosarcoma of bone | 4 | BeFree |
| umls:C0596263 | Carcinogenesis | 4 | BeFree |
| umls:C0600139 | Prostate carcinoma | 4 | BeFree |
| umls:C0006142 | Malignant neoplasm of breast | 2 | BeFree |
| umls:C0027627 | Neoplasm Metastasis | 2 | BeFree |
| umls:C0678222 | Breast Carcinoma | 2 | BeFree |
| umls:C0005684 | Malignant neoplasm of urinary bladder | 1 | BeFree |
| umls:C0007137 | Squamous cell carcinoma | 1 | BeFree |
| umls:C0017638 | Glioma | 1 | BeFree |
| umls:C0279702 | Conventional (Clear Cell) Renal Cell Carcinoma | 1 | BeFree |
| umls:C0521857 | Increased drug resistance | 1 | BeFree |
| umls:C0686619 | Secondary malignant neoplasm of lymph node | 1 | BeFree |
| umls:C0699885 | Carcinoma of bladder | 1 | BeFree |
| umls:C1153706 | Endometrial adenocarcinoma | 1 | BeFree |
| umls:C1997217 | Low grade glioma | 1 | BeFree |
|
Copyright 2016-Present - The University of Texas Health Science Center at Houston (UTHealth) Web File Viewing | How to Report, Fraud, Waste and Abuse | State of Texas | Statewide Search | Texas Homeland Security | Site Policies |