 |
| |
| |
| |
| |
| |
| |
|

| TissGeneSummary for GLB1L |
 Gene summary Gene summary |
| Basic gene information | Gene symbol | GLB1L |
| Gene name | galactosidase, beta 1-like | |
| Synonyms | - | |
| Cytomap | UCSC genome browser: 2q35 | |
| Type of gene | protein-coding | |
| RefGenes | NM_001286423.1, NM_001286427.1,NM_024506.4, | |
| Description | beta-galactosidase-1-like protein | |
| Modification date | 20141207 | |
| dbXrefs | HGNC : HGNC | |
| Ensembl : ENSG00000163521 | ||
| HPRD : 11004 | ||
| Vega : OTTHUMG00000133133 | ||
| Protein | UniProt: go to UniProt's Cross Reference DB Table | |
| Expression | CleanEX: HS_GLB1L | |
| BioGPS: 79411 | ||
| Pathway | NCI Pathway Interaction Database: GLB1L | |
| KEGG: GLB1L | ||
| REACTOME: GLB1L | ||
| Pathway Commons: GLB1L | ||
| Context | iHOP: GLB1L | |
| ligand binding site mutation search in PubMed: GLB1L | ||
| UCL Cancer Institute: GLB1L | ||
| Assigned class in TissGDB* | C | |
| Included tissue-specific gene expression resources | TiGER,GTEx | |
| Specific-tissues in normal samples (assigned by TissGDB using HPA, TiGER, and GTEx) | Testis | |
| Cancer types related to the specific-tissues in cancer samples (assigned by TissGDB using TCGA) | TGCT | |
| Reference showing the relevant tissue of GLB1L | ||
| Description by TissGene annotations | Have significant anti-correlated miRNA | |
| * Class A consists of genes with literature evidence and is part of the cTissGenes. Class B consists of only cTissGenes without additional evidence. The remaining genes belong to Class C. |
| Gene ontology having evidence of Inferred from Direct Assay (IDA) from Entrez |
| GO ID | GO term | PubMed ID |
| Top |
| TissGeneExp for GLB1L |
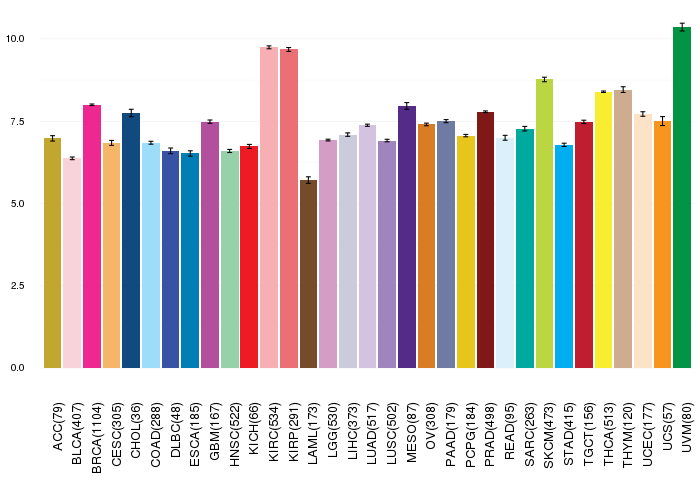
| Gene expressions across 28 cancer types (X-axis: cancer type and Y-axis: log2(norm_counts+1)) (TCGA IlluminaHiSeq_RNASeqV2, pan-cancer normalized log2(norm_counts+1) data, version 2016-08-16) |
 |
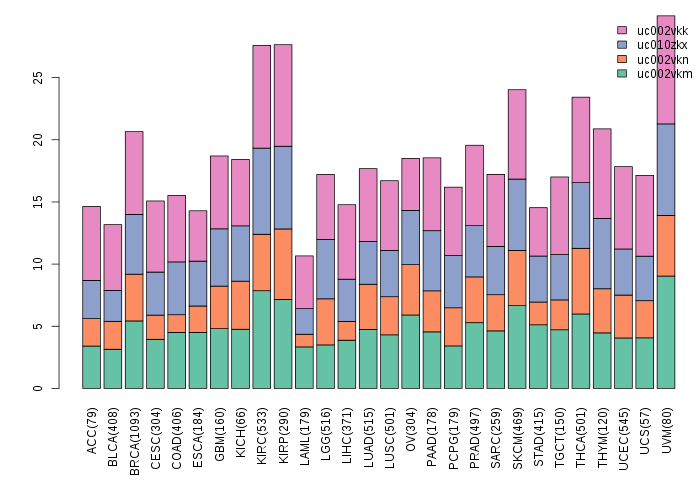
| Gene isoform expressions across 28 cancer types (X-axis: cancer type and Y-axis: log2(norm_counts+1)) (TCGA pan-cancer tcga_rsem_isoform_tpm, version 2016-09-01) |
 |
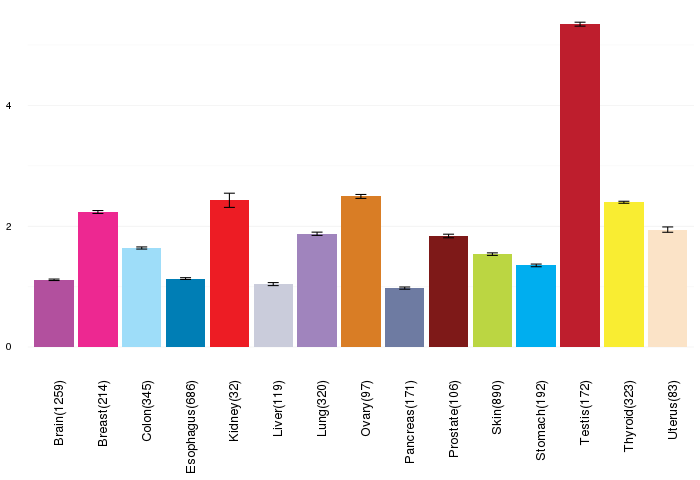
| Gene expressions across normal tissues of GTEx data (GTEx GTEx_Analysis_v6_RNA-seq_RNA-SeQCv1.1.8_gene_rpkm.gct) - Here, we shows the matched tissue types only among our 28 cancer types. |
 |
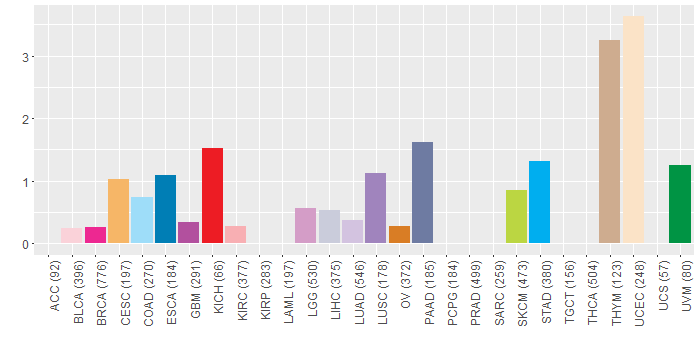
| Different expressions across 14 cancer types with more than 10 samples between matched tumors and normals (X-axis: cancer type and Y-axis: log2(norm_counts+1)) (TCGA IlluminaHiSeq_RNASeqV2, pan-cancer normalized log2(norm_counts+1) data, version 2016-08-16) |
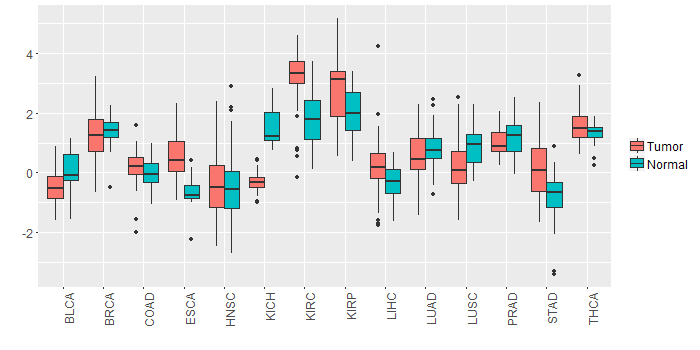 |
| - Significantly differentially expressed cancer types and information. (|Fold change|>1 and FDR<0.05) |
| Cancer type | Mean(exp) in tumor | Mean(exp) in matched normal | Log2FC | P-val. | FDR |
| KICH | -0.324798013 | 1.566997987 | -1.891796 | 2.14E-14 | 3.60E-13 |
| KIRC | 3.22571882 | 1.799377153 | 1.426341667 | 1.50E-18 | 1.04E-17 |
| ESCA | 0.56323435 | -0.68256565 | 1.2458 | 0.00296 | 0.0287469 |
| Top |
| TissGene-miRNA for GLB1L |
| Significantly anti-correlated miRNAs of TissGene across 28 cancer types (Gene-miRNA relations from TargetScanHuman Relsease 7.1, Conserved_Site_Context_Scores.txt.zip, 06.01.2016) (TCGA IlluminaHiSeq_miRNASeq, log2(RPM+1) data, version 2016-11-21) (TCGA IlluminaHiSeq_RNASeqV2, log2(normalized_count+1) data, version 2016-08-16) (Spearman’s Rank Correlation (p-value<0.05 and coefficient<-0.25)) |
| Cancer type | miRNA id | miRNA accession | P-val. | Coeff. | # samples |
| UCS | hsa-miR-29c-3p | MIMAT0000681 | 0.025 | -0.3 | 56 |
| Top |
| TissGeneMut for GLB1L |
| TissGeneSNV for GLB1L |
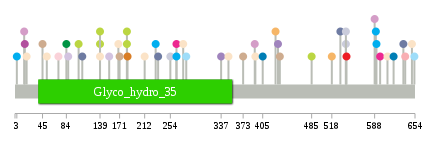
| nsSNV counts per each loci. Different colors of circles represent different cancer types. Circle size denotes number of samples. (TCGA somatic mutation (SNPs and small INDELs) data, version 2016-04-25) * Click on the image to enlarge it in a new window. |
 |
 |
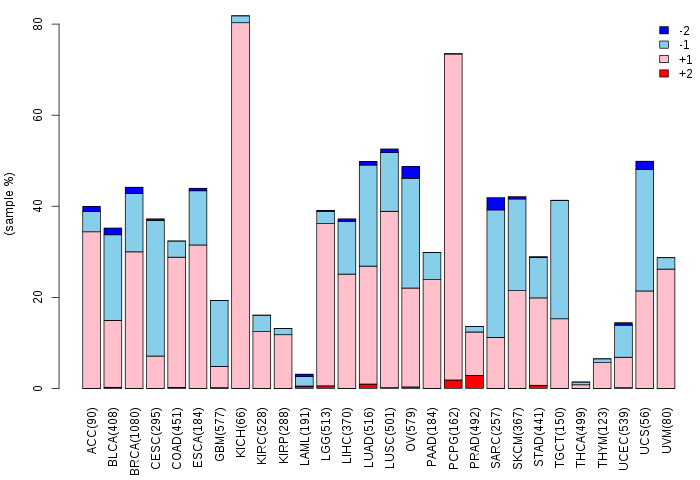
| Somatic nucleotide variants of TissGene across 28 cancer types (X-axis: cancer type and Y-axis: % of mutated samples) The numbers in parentheses are numbers of samples with mutation (nsSNVs). (TCGA somatic mutation (SNPs and small INDELs) data, version 2016-04-25) |
 |
| - nsSNVs sorted by frequency. |
| AAchange | Cancer type | # samples |
| p.G373R | THYM | 1 |
| p.A104V | SKCM | 1 |
| p.R71Q | BLCA | 1 |
| p.L512V | HNSC | 1 |
| p.S542P | KICH | 1 |
| p.M649I | UCEC | 1 |
| p.T234P | PAAD | 1 |
| p.R139* | UCEC | 1 |
| p.K513N | READ | 1 |
| p.E264K | STAD | 1 |
| p.P392S | LGG | 1 |
| p.Y541X | LIHC | 1 |
| p.R230W | STAD | 1 |
| p.H87L | LUAD | 1 |
| p.Y254X | LIHC | 1 |
| p.V518L | CESC | 1 |
| p.E337Q | LUSC | 1 |
| p.R139X | SKCM | 1 |
| p.P3H | STAD | 1 |
| p.R139* | SKCM | 1 |
| p.P532H | PAAD | 1 |
| p.R417Q | READ | 1 |
| p.P45R | THYM | 1 |
| p.F591S | STAD | 1 |
| p.Q275H | UCEC | 1 |
| p.E184D | OV | 1 |
| p.I473V | HNSC | 1 |
| p.R590G | STAD | 1 |
| p.A110D | PAAD | 1 |
| p.E405D | ESCA | 1 |
| p.L638P | KIRC | 1 |
| p.R280Q | COAD | 1 |
| p.V183M | SKCM | 1 |
| p.S52R | UCEC | 1 |
| p.A154D | LUAD | 1 |
| p.P169Q | UCEC | 1 |
| p.W84R | UVM | 1 |
| p.L619F | ESCA | 1 |
| p.Y541* | LIHC | 1 |
| p.V183E | SKCM | 1 |
| p.P433S | THYM | 1 |
| p.P15L | LGG | 1 |
| p.T19M | UCEC | 1 |
| p.F430L | LUSC | 1 |
| p.G653E | COAD | 1 |
| p.D609Y | UCEC | 1 |
| p.K212N | UCEC | 1 |
| p.R393H | UCEC | 1 |
| p.G597E | BRCA | 1 |
| p.E426Q | CESC | 1 |
| p.L16H | GBM | 1 |
| p.L171I | THYM | 1 |
| p.R349Q | UCEC | 1 |
| p.S485F | SKCM | 1 |
| p.E264K | BRCA | 1 |
| p.I635V | PAAD | 1 |
| p.V588M | LGG | 1 |
| Top |
| TissGeneCNV for GLB1L |
| Copy number variations of TissGene across 28 cancer types (X-axis: cancer type and Y-axis: % of CNV samples) (TCGA Gistic2_CopyNumber_Gistic2_all_data_by_genes, Gistic2 copy number data, version 2016-08-16) |
 |
| Top |
| TissGeneFusions for GLB1L |
| Fusion genes including TissGene (ChimerDB 3.0, 2016-12-01 and TCGA fusion Portal 2015-12-01) |
| Database | Src | Cancer type | Sample | Fusion gene | ORF | 5'-gene BP | 3'-gene BP |
| Top |
| TissGeneNet for GLB1L |
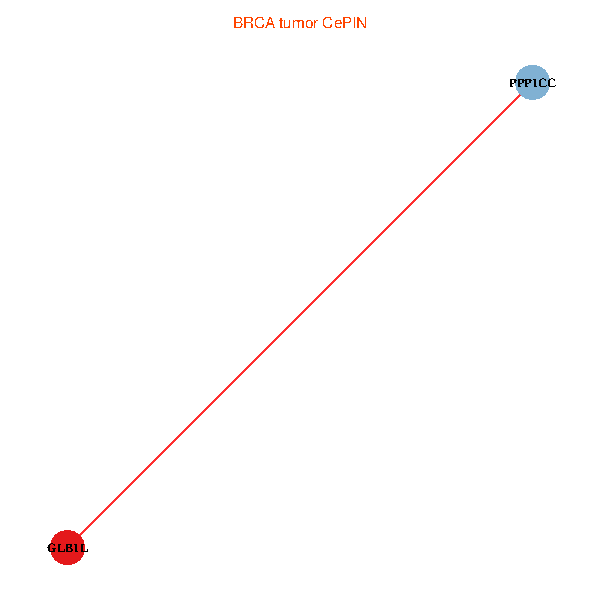
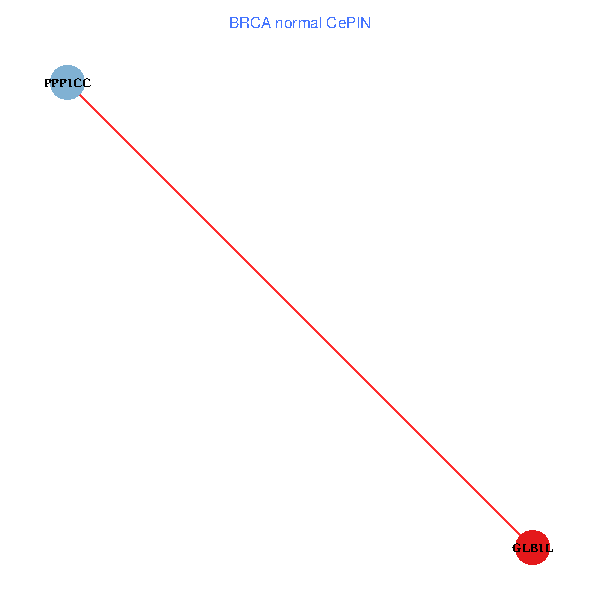
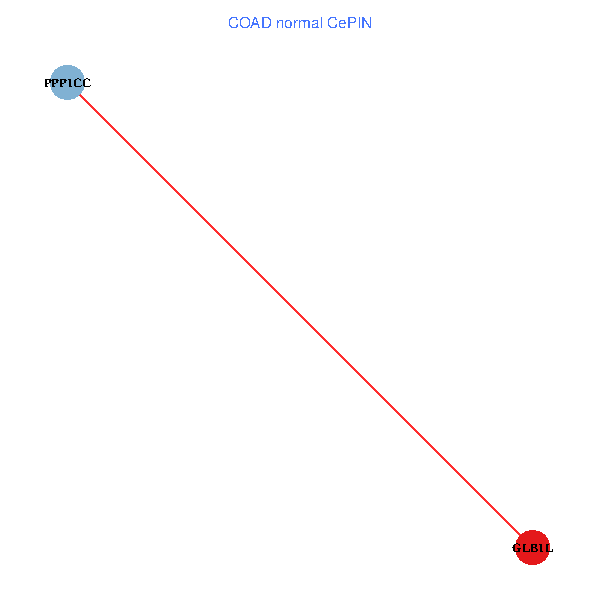
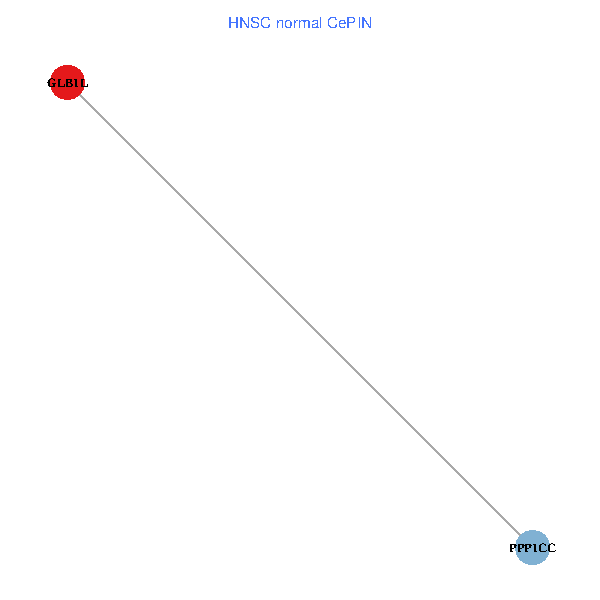
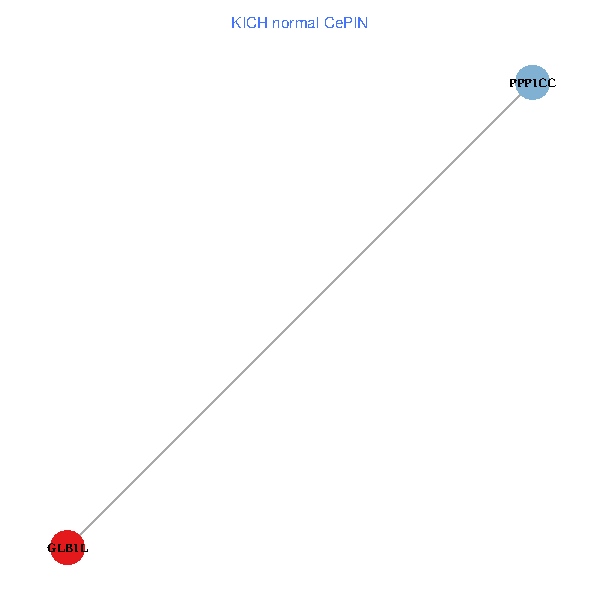
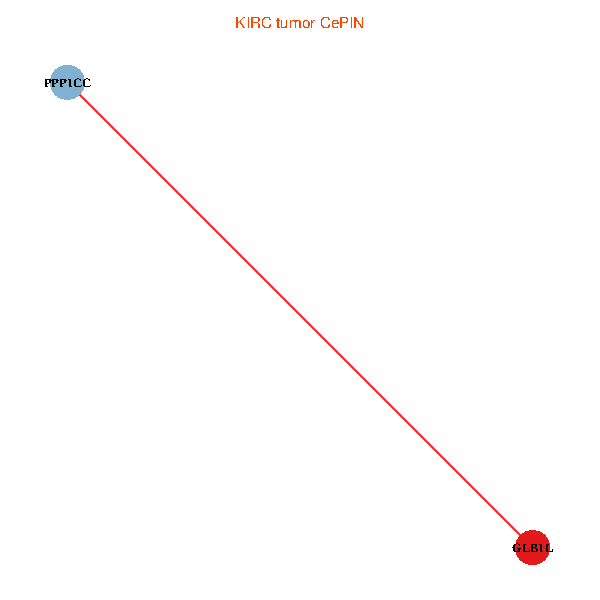
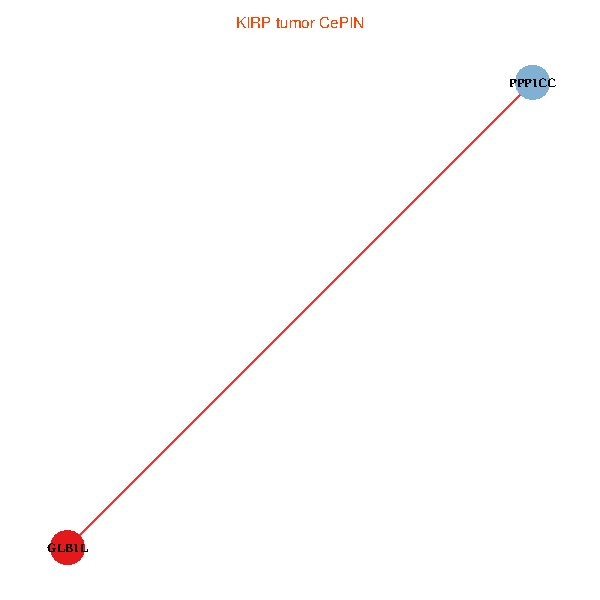
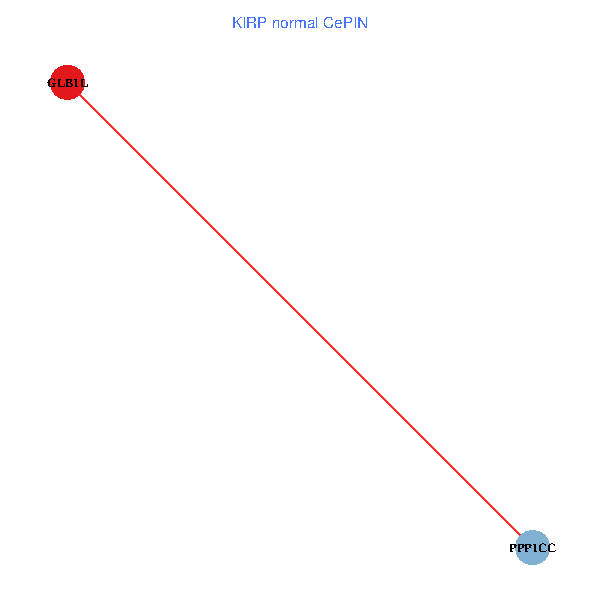
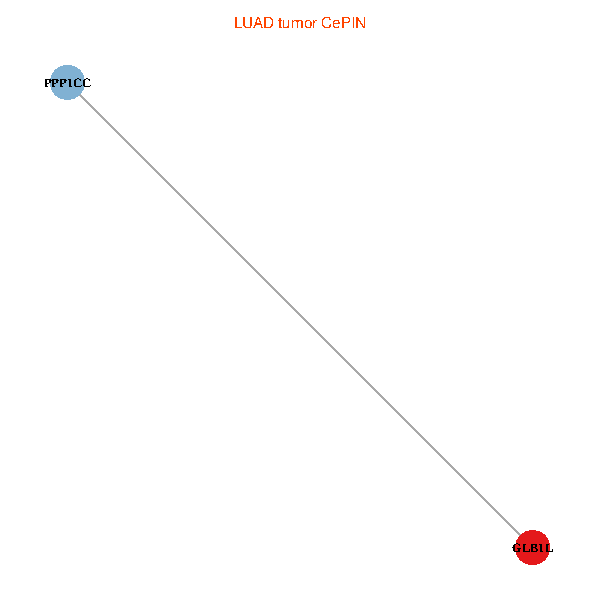
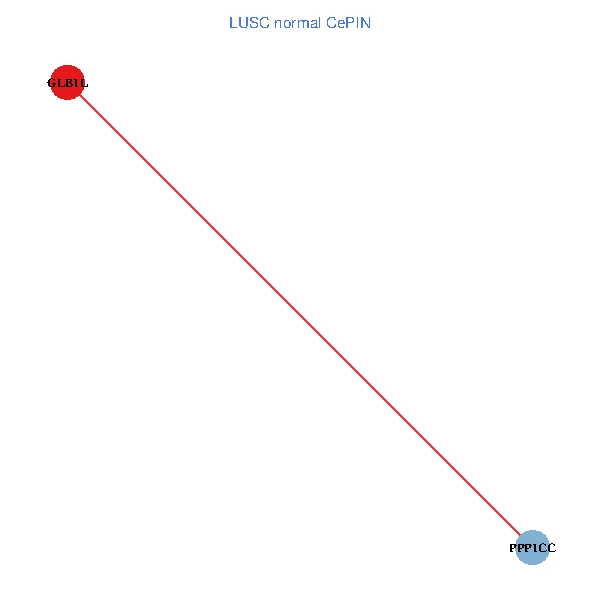
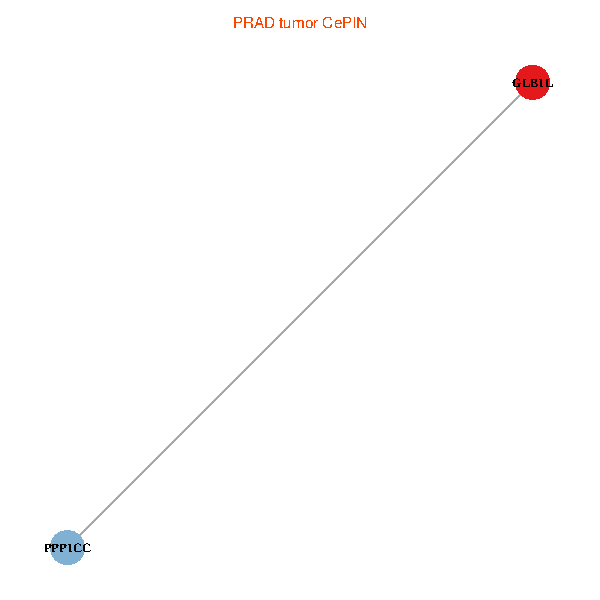
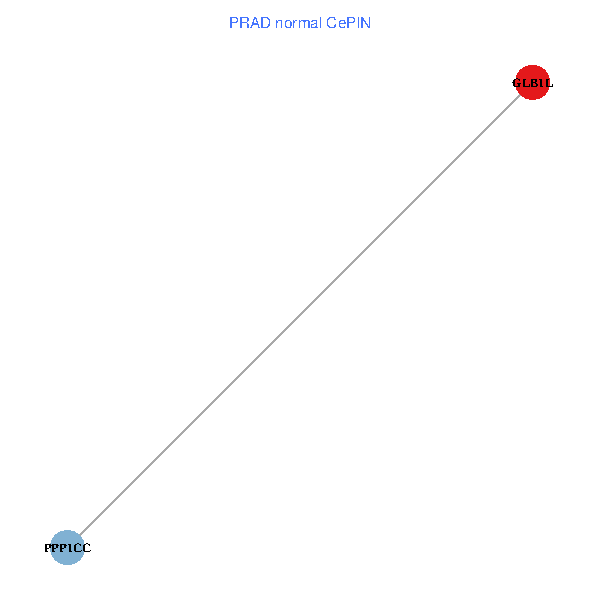
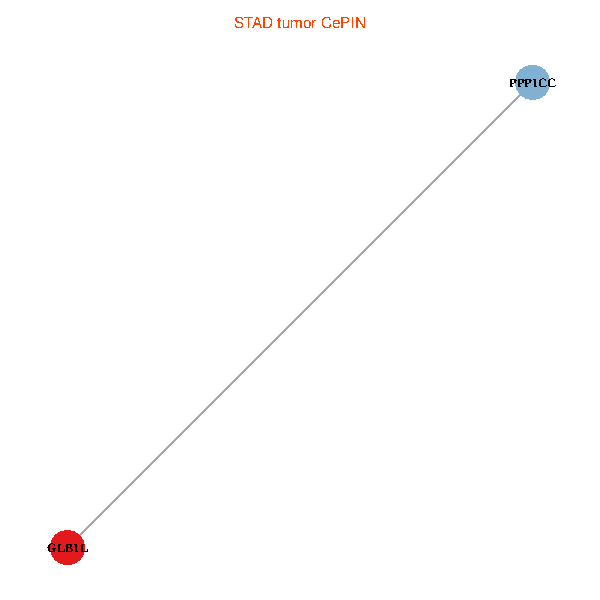
| Co-expressed gene networks based on protein-protein interaction data (CePIN) (TCGA IlluminaHiSeq_RNASeqV2, pan-cancer normalized log2(norm_counts+1) data, version 2016-08-16) (PINA2 ppi data) |
| BRCA (tumor) | BRCA (normal) |
| GLB1L, PPP1CC (tumor) | GLB1L, PPP1CC (normal) |
 |  |
| COAD (tumor) | COAD (normal) |
| GLB1L, PPP1CC (tumor) | GLB1L, PPP1CC (normal) |
 |  |
| HNSC (tumor) | HNSC (normal) |
| GLB1L, PPP1CC (tumor) | GLB1L, PPP1CC (normal) |
 |  |
| KICH (tumor) | KICH (normal) |
| GLB1L, PPP1CC (tumor) | GLB1L, PPP1CC (normal) |
 |  |
| KIRC (tumor) | KIRC (normal) |
| GLB1L, PPP1CC (tumor) | GLB1L, PPP1CC (normal) |
 |  |
| KIRP (tumor) | KIRP (normal) |
| GLB1L, PPP1CC (tumor) | GLB1L, PPP1CC (normal) |
 |  |
| LIHC (tumor) | LIHC (normal) |
| GLB1L, PPP1CC (tumor) | GLB1L, PPP1CC (normal) |
 |  |
| LUAD (tumor) | LUAD (normal) |
| GLB1L, PPP1CC (tumor) | GLB1L, PPP1CC (normal) |
 |  |
| LUSC (tumor) | LUSC (normal) |
| GLB1L, PPP1CC (tumor) | GLB1L, PPP1CC (normal) |
 |  |
| PRAD (tumor) | PRAD (normal) |
| GLB1L, PPP1CC (tumor) | GLB1L, PPP1CC (normal) |
 |  |
| STAD (tumor) | STAD (normal) |
| GLB1L, PPP1CC (tumor) | GLB1L, PPP1CC (normal) |
 | 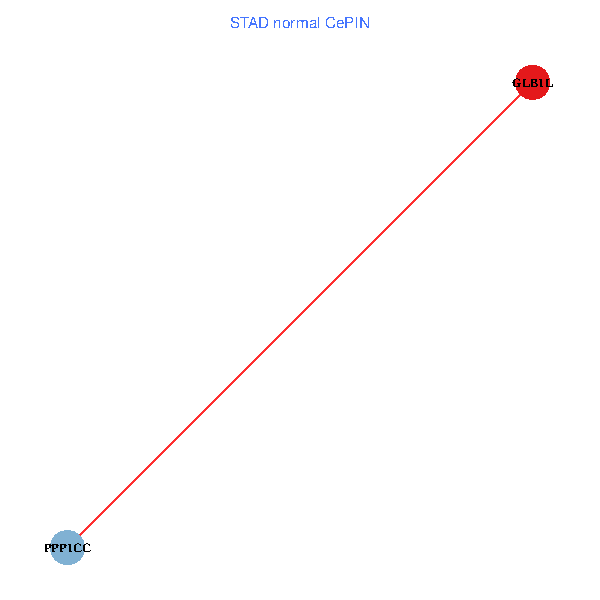 |
| THCA (tumor) | THCA (normal) |
| GLB1L, PPP1CC (tumor) | GLB1L, PPP1CC (normal) |
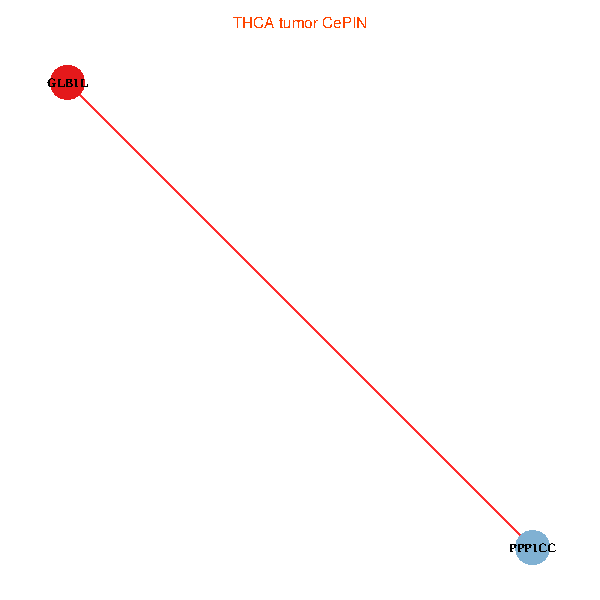 |  |
| Top |
| TissGeneProg for GLB1L |
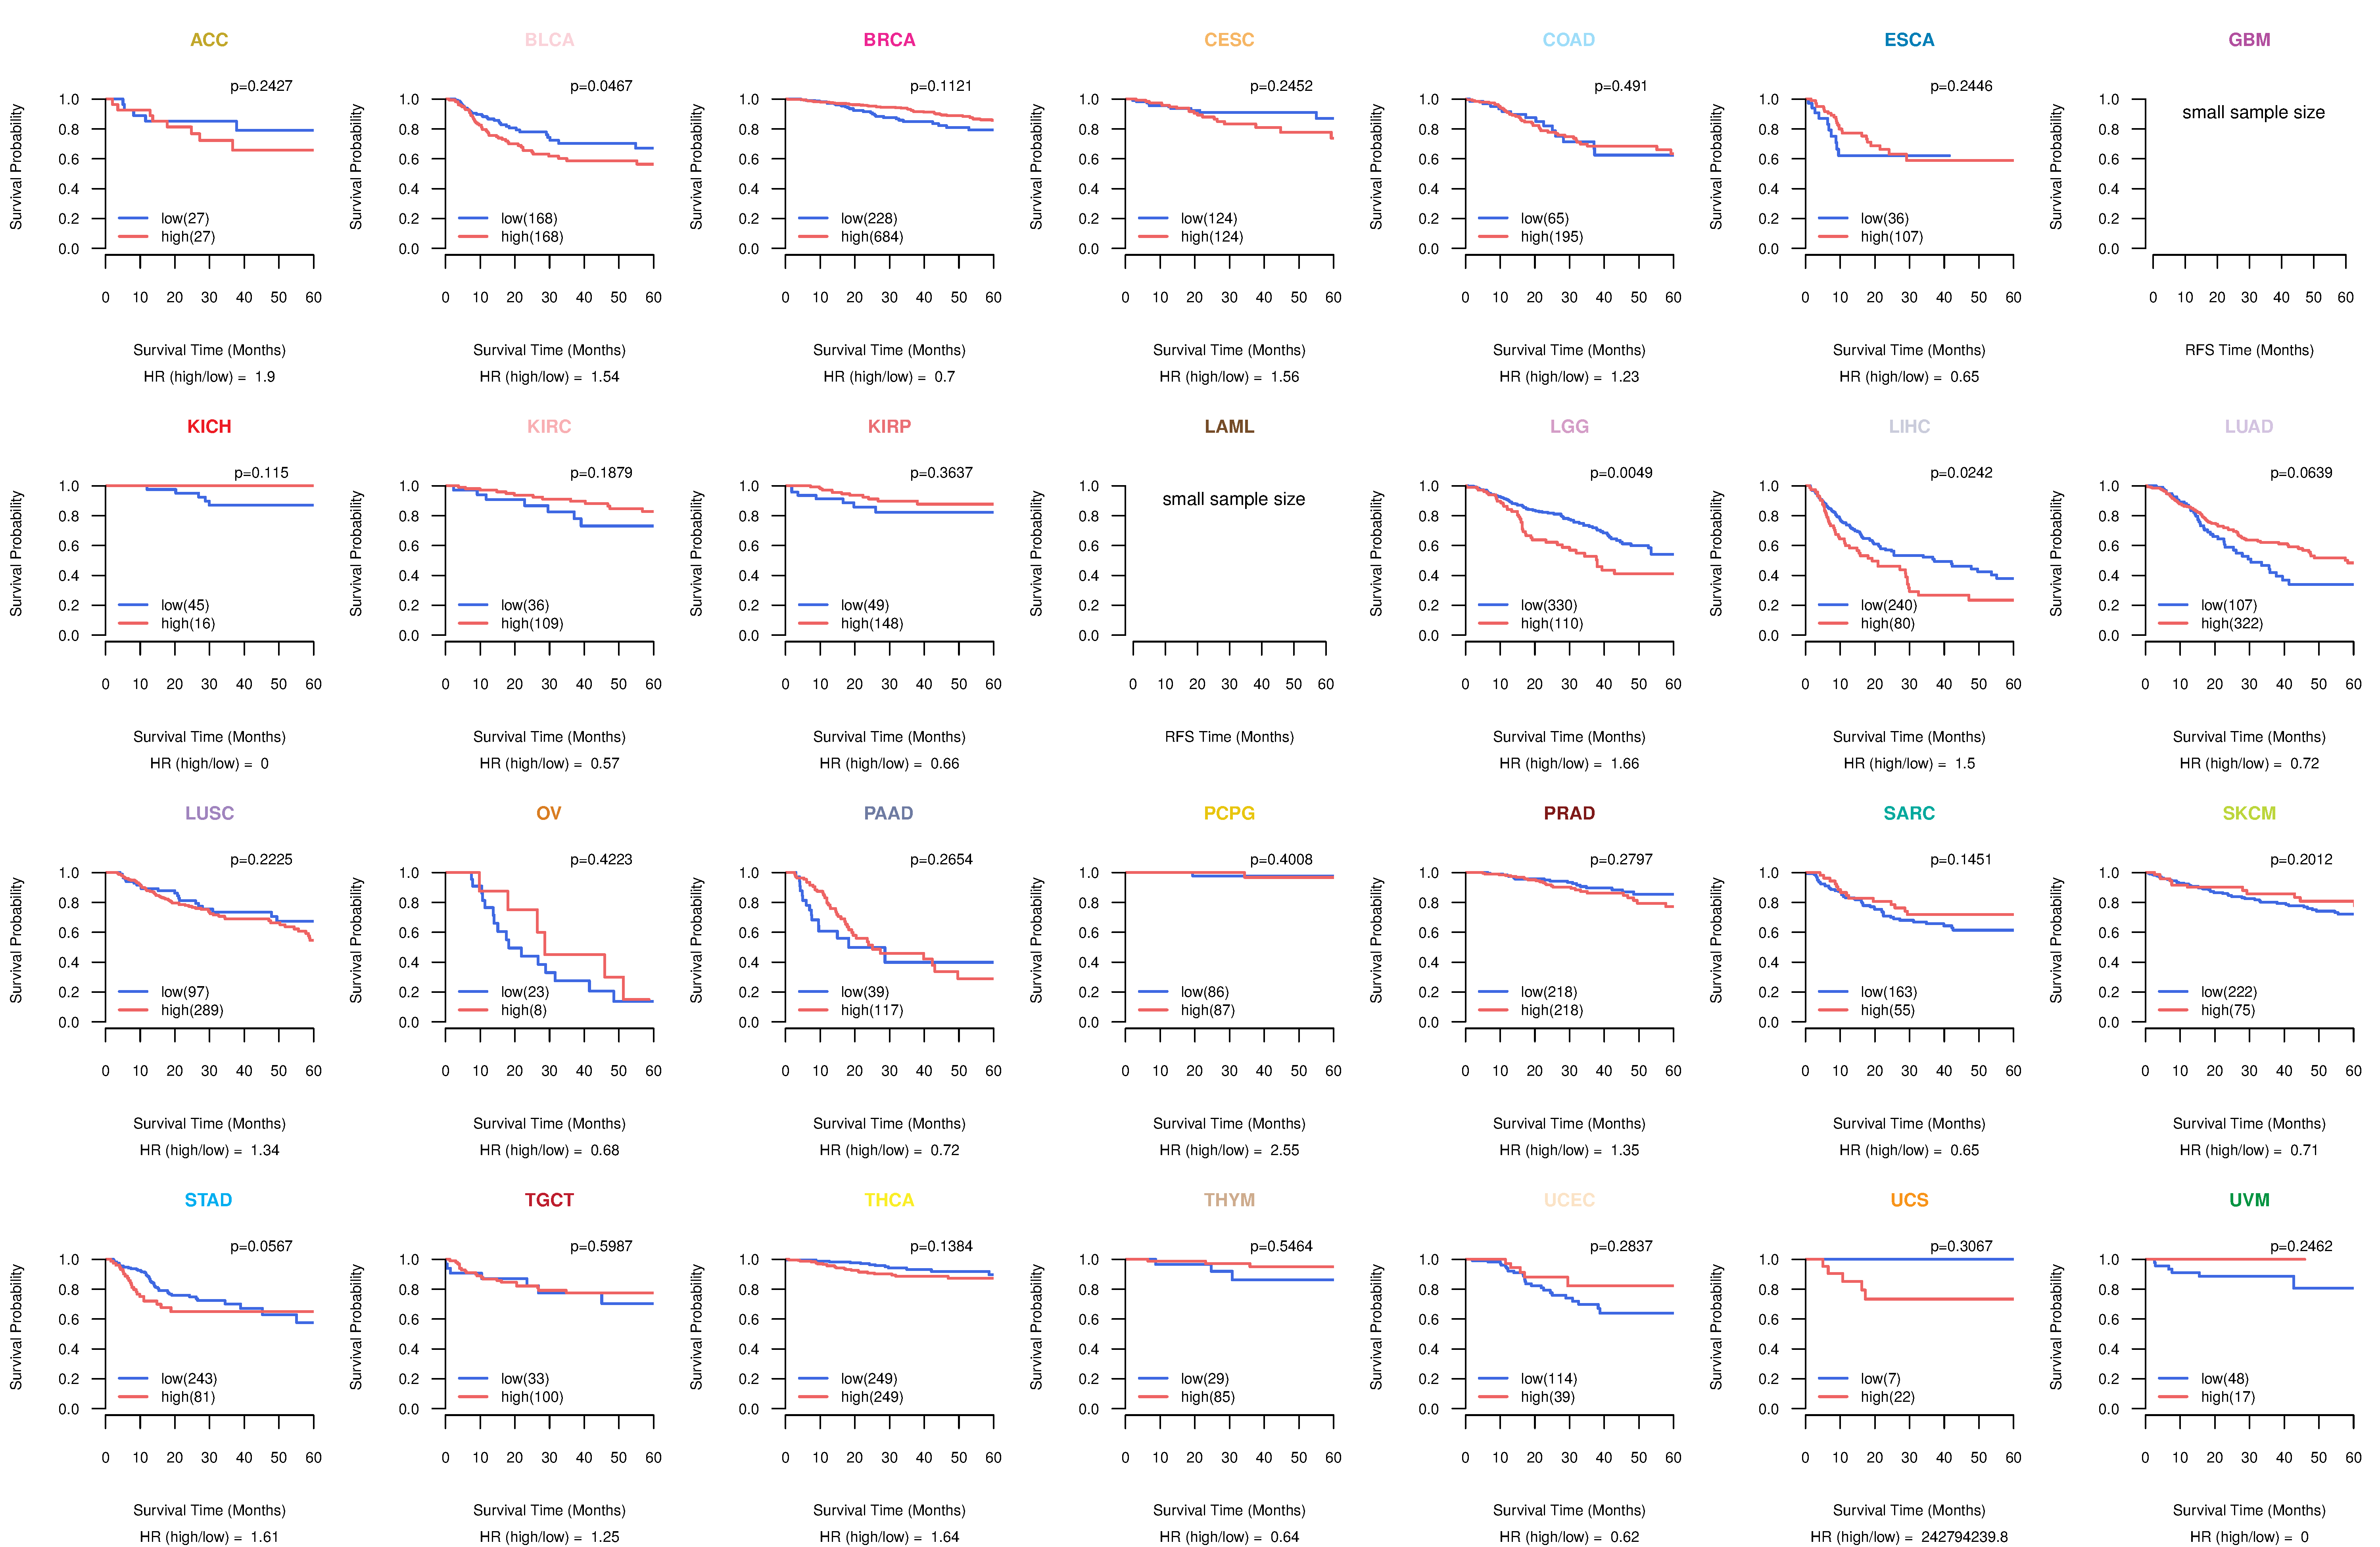
| Kaplan-Meier plots with logrank tests of overall survival (OS) using 28 cancer types (TCGA IlluminaHiSeq_RNASeqV2, pan-cancer normalized log2(norm_counts+1) data, version 2016-08-16) (TCGA clinicalMatrix, phenotype data, version 2016-04-27) * Click on the image to enlarge it in a new window. |
 |
| Kaplan-Meier plots with logrank test of relapse free survival (RFS) using 28 cancer types (TCGA IlluminaHiSeq_RNASeqV2, pan-cancer normalized log2(norm_counts+1) data, version 2016-08-16) (TCGA clinicalMatrix, phenotype data, version 2016-04-27) * Click on the image enlarge it in a new window. |
 |
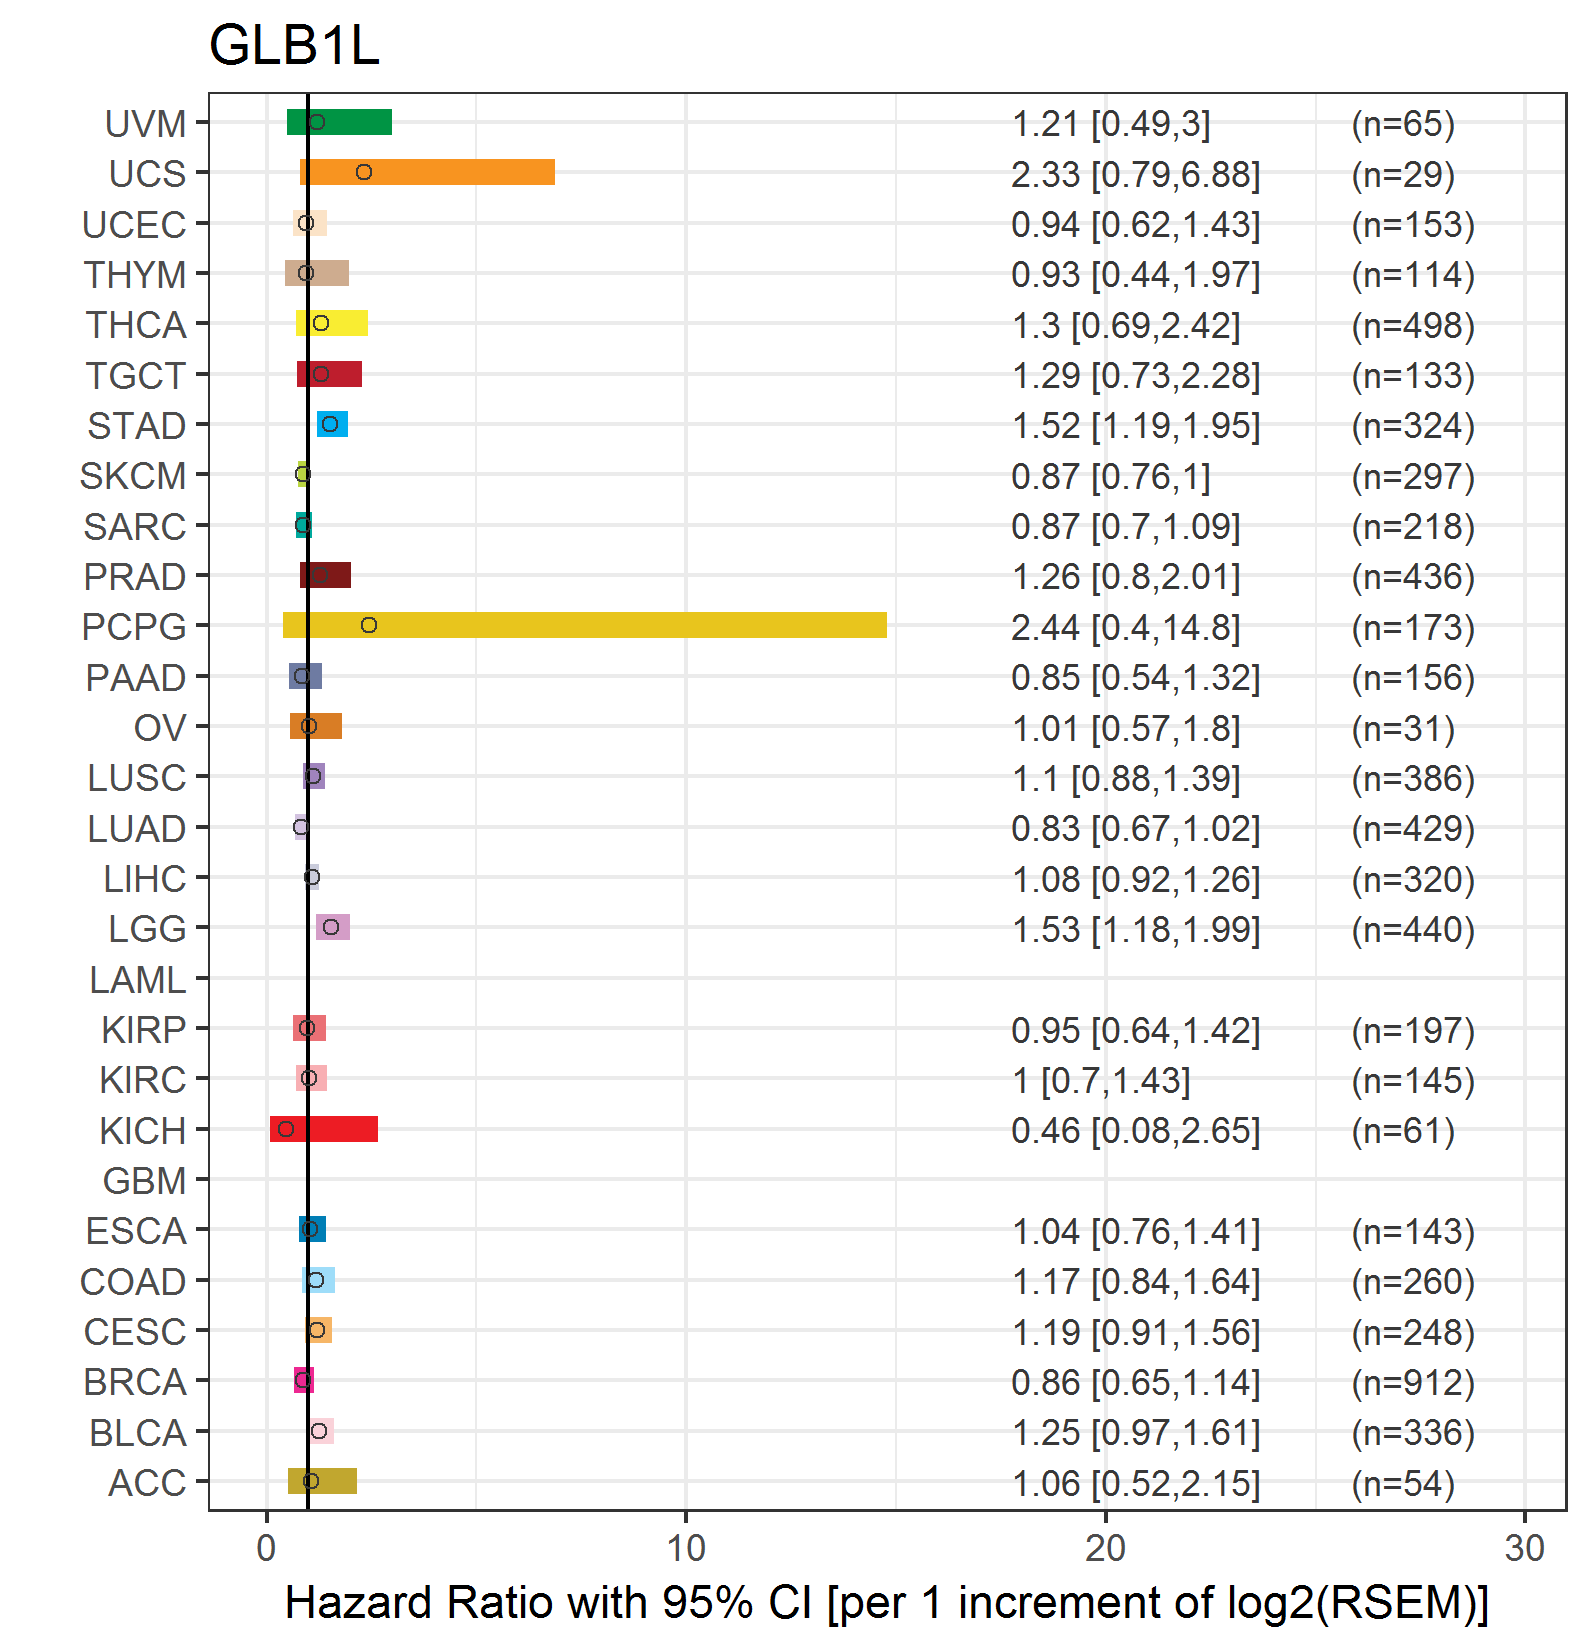
| Forest plot of Cox proportional hazard ratio (HR) and 95% CI of overall survival (OS) using 28 cancer types (TCGA IlluminaHiSeq_RNASeqV2, pan-cancer normalized log2(norm_counts+1) data, version 2016-08-16) (TCGA clinicalMatrix, phenotype data, version 2016-04-27) * Click on the image enlarge it in a new window. |
 |
| Forest plot of Cox proportional hazard ratio (HR) and 95% CI of relapse free survival (RFS) using 28 cancer types (TCGA IlluminaHiSeq_RNASeqV2, pan-cancer normalized log2(norm_counts+1) data, version 2016-08-16) (TCGA clinicalMatrix, phenotype data, version 2016-04-27) * Click on the image enlarge it in a new window. |
 |
| Top |
| TissGeneClin for GLB1L |
| TissGeneDrug for GLB1L |
| Drug information targeting TissGene (DrugBank Version 5.0.6, 2017-04-01) |
| DrugBank ID | Drug name | Drug activity | Drug type | Drug status |
| Top |
| TissGeneDisease for GLB1L |
| Disease information associated with TissGene (DisGeNet, 2016-06-01) |
| Disease ID | Disease name | # pubmeds | Source |
|
Copyright 2016-Present - The University of Texas Health Science Center at Houston (UTHealth) Web File Viewing | How to Report, Fraud, Waste and Abuse | State of Texas | Statewide Search | Texas Homeland Security | Site Policies |