 |
| |
| |
| |
| |
| |
| |
|

| TissGeneSummary for IQCA1 |
 Gene summary Gene summary |
| Basic gene information | Gene symbol | IQCA1 |
| Gene name | IQ motif containing with AAA domain 1 | |
| Synonyms | 4930465P12Rik|DRC11|IQCA | |
| Cytomap | UCSC genome browser: 2q37.3 | |
| Type of gene | protein-coding | |
| RefGenes | NM_001270584.1, NM_001270585.1,NM_024726.4,NR_073043.1, | |
| Description | IQ and AAA domain-containing protein 1dynein regulatory complex subunit 11 | |
| Modification date | 20141207 | |
| dbXrefs | HGNC : HGNC | |
| Ensembl : ENSG00000132321 | ||
| HPRD : 13743 | ||
| Vega : OTTHUMG00000153058 | ||
| Protein | UniProt: go to UniProt's Cross Reference DB Table | |
| Expression | CleanEX: HS_IQCA1 | |
| BioGPS: 79781 | ||
| Pathway | NCI Pathway Interaction Database: IQCA1 | |
| KEGG: IQCA1 | ||
| REACTOME: IQCA1 | ||
| Pathway Commons: IQCA1 | ||
| Context | iHOP: IQCA1 | |
| ligand binding site mutation search in PubMed: IQCA1 | ||
| UCL Cancer Institute: IQCA1 | ||
| Assigned class in TissGDB* | C | |
| Included tissue-specific gene expression resources | TiGER,GTEx | |
| Specific-tissues in normal samples (assigned by TissGDB using HPA, TiGER, and GTEx) | KidneyThyroid gland | |
| Cancer types related to the specific-tissues in cancer samples (assigned by TissGDB using TCGA) | KIRC,KIRP,KICHTHCA | |
| Reference showing the relevant tissue of IQCA1 | ||
| Description by TissGene annotations | Protective TissGene in RFS | |
| * Class A consists of genes with literature evidence and is part of the cTissGenes. Class B consists of only cTissGenes without additional evidence. The remaining genes belong to Class C. |
| Gene ontology having evidence of Inferred from Direct Assay (IDA) from Entrez |
| GO ID | GO term | PubMed ID |
| Top |
| TissGeneExp for IQCA1 |
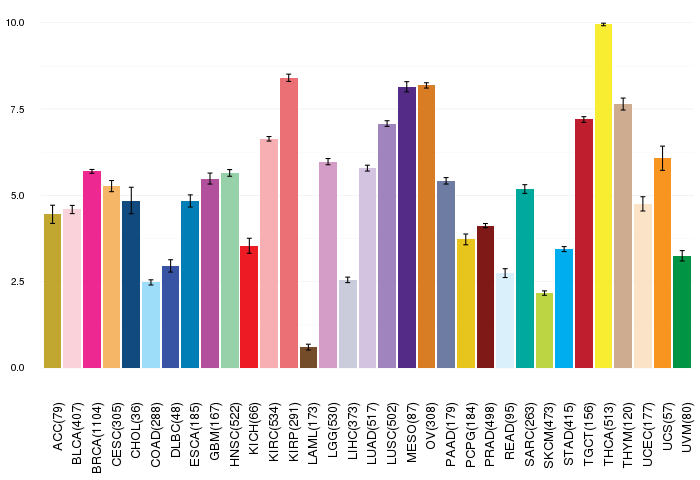
| Gene expressions across 28 cancer types (X-axis: cancer type and Y-axis: log2(norm_counts+1)) (TCGA IlluminaHiSeq_RNASeqV2, pan-cancer normalized log2(norm_counts+1) data, version 2016-08-16) |
 |
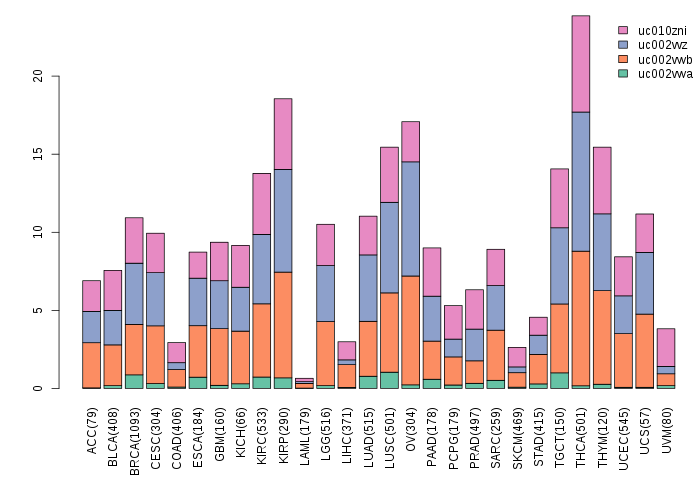
| Gene isoform expressions across 28 cancer types (X-axis: cancer type and Y-axis: log2(norm_counts+1)) (TCGA pan-cancer tcga_rsem_isoform_tpm, version 2016-09-01) |
 |
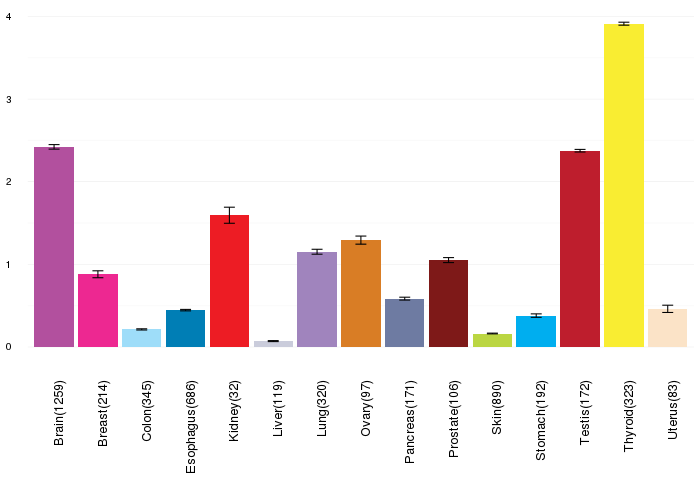
| Gene expressions across normal tissues of GTEx data (GTEx GTEx_Analysis_v6_RNA-seq_RNA-SeQCv1.1.8_gene_rpkm.gct) - Here, we shows the matched tissue types only among our 28 cancer types. |
 |
| Different expressions across 14 cancer types with more than 10 samples between matched tumors and normals (X-axis: cancer type and Y-axis: log2(norm_counts+1)) (TCGA IlluminaHiSeq_RNASeqV2, pan-cancer normalized log2(norm_counts+1) data, version 2016-08-16) |
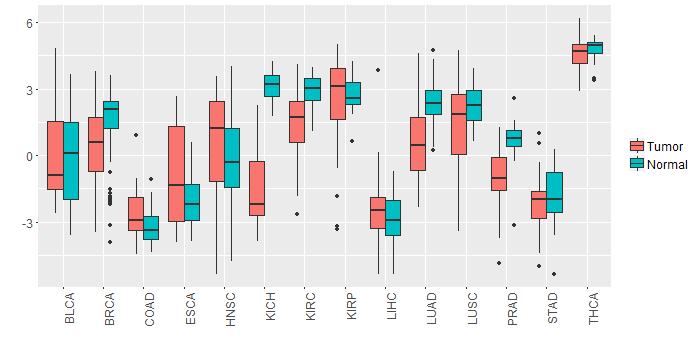 |
| - Significantly differentially expressed cancer types and information. (|Fold change|>1 and FDR<0.05) |
| Cancer type | Mean(exp) in tumor | Mean(exp) in matched normal | Log2FC | P-val. | FDR |
| LUAD | 0.581079615 | 2.370653753 | -1.789574138 | 1.54E-10 | 8.95E-10 |
| PRAD | -0.95374817 | 0.694340292 | -1.648088462 | 1.01E-12 | 5.66E-11 |
| KICH | -1.502388247 | 3.101603753 | -4.603992 | 2.29E-13 | 3.00E-12 |
| KIRC | 1.470239865 | 2.921538476 | -1.451298611 | 2.60E-12 | 1.08E-11 |
| Top |
| TissGene-miRNA for IQCA1 |
| Significantly anti-correlated miRNAs of TissGene across 28 cancer types (Gene-miRNA relations from TargetScanHuman Relsease 7.1, Conserved_Site_Context_Scores.txt.zip, 06.01.2016) (TCGA IlluminaHiSeq_miRNASeq, log2(RPM+1) data, version 2016-11-21) (TCGA IlluminaHiSeq_RNASeqV2, log2(normalized_count+1) data, version 2016-08-16) (Spearman’s Rank Correlation (p-value<0.05 and coefficient<-0.25)) |
| Cancer type | miRNA id | miRNA accession | P-val. | Coeff. | # samples |
| Top |
| TissGeneMut for IQCA1 |
| TissGeneSNV for IQCA1 |
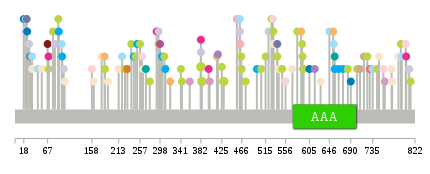
| nsSNV counts per each loci. Different colors of circles represent different cancer types. Circle size denotes number of samples. (TCGA somatic mutation (SNPs and small INDELs) data, version 2016-04-25) * Click on the image to enlarge it in a new window. |
 |
 |
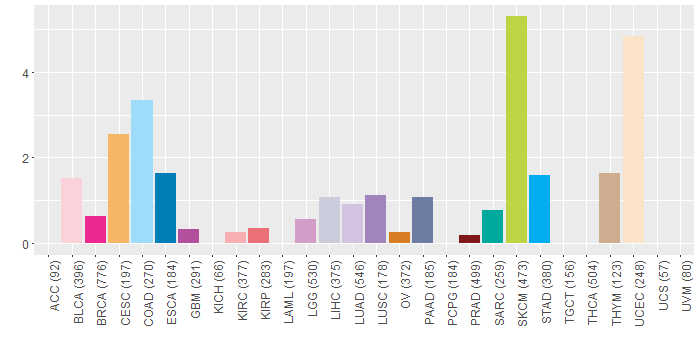
| Somatic nucleotide variants of TissGene across 28 cancer types (X-axis: cancer type and Y-axis: % of mutated samples) The numbers in parentheses are numbers of samples with mutation (nsSNVs). (TCGA somatic mutation (SNPs and small INDELs) data, version 2016-04-25) |
 |
| - nsSNVs sorted by frequency. |
| AAchange | Cancer type | # samples |
| p.W384* | SKCM | 2 |
| p.R429Q | SKCM | 2 |
| p.E382K | SKCM | 2 |
| p.M184I | CESC | 1 |
| p.Y616* | LUSC | 1 |
| p.D456A | KIRC | 1 |
| p.G703E | SKCM | 1 |
| p.T373A | READ | 1 |
| p.P684L | SKCM | 1 |
| p.R657C | SARC | 1 |
| p.R270W | DLBC | 1 |
| p.E307K | SKCM | 1 |
| p.S570L | UCEC | 1 |
| p.P251H | STAD | 1 |
| p.E89K | SKCM | 1 |
| p.R231C | OV | 1 |
| p.N55H | UCEC | 1 |
| p.R657H | STAD | 1 |
| p.T805N | CHOL | 1 |
| p.G539E | SKCM | 1 |
| p.T549I | SKCM | 1 |
| p.Q757H | BLCA | 1 |
| p.P462Q | LUAD | 1 |
| p.Q35R | COAD | 1 |
| p.G425E | SKCM | 1 |
| p.R531C | UCEC | 1 |
| p.A628V | UCEC | 1 |
| p.R213H | UCEC | 1 |
| p.V724I | SKCM | 1 |
| p.P462T | COAD | 1 |
| p.G25S | ESCA | 1 |
| p.E295K | SKCM | 1 |
| p.E591K | SKCM | 1 |
| p.M35T | UCEC | 1 |
| p.G527E | SKCM | 1 |
| p.L100P | LIHC | 1 |
| p.D463A | KIRC | 1 |
| p.E382A | BRCA | 1 |
| p.V47A | COAD | 1 |
| p.R69Q | SKCM | 1 |
| p.G744E | SKCM | 1 |
| p.A795T | COAD | 1 |
| p.R82H | LUAD | 1 |
| p.G593E | SKCM | 1 |
| p.D417Y | LUSC | 1 |
| p.A775V | UCEC | 1 |
| p.E295D | LUAD | 1 |
| p.K185R | SKCM | 1 |
| p.V646F | COAD | 1 |
| p.E226K | SKCM | 1 |
| p.A804S | BRCA | 1 |
| p.R690W | ESCA | 1 |
| p.D29N | LIHC | 1 |
| p.V298M | GBM | 1 |
| p.R665H | STAD | 1 |
| p.P244H | STAD | 1 |
| p.M97K | STAD | 1 |
| p.M199I | HNSC | 1 |
| p.S497P | STAD | 1 |
| p.P655S | COAD | 1 |
| p.G78R | SKCM | 1 |
| p.G465R | SKCM | 1 |
| p.R69* | BRCA | 1 |
| p.T96M | COAD | 1 |
| p.G18S | ESCA | 1 |
| p.R89H | THYM | 1 |
| p.E748K | UCEC | 1 |
| p.Q67* | PRAD | 1 |
| p.R261C | BLCA | 1 |
| p.S158G | BLCA | 1 |
| p.K269N | SARC | 1 |
| p.F605L | ESCA | 1 |
| p.S709Y | THYM | 1 |
| p.E788D | UCEC | 1 |
| p.E257K | SKCM | 1 |
| p.V291M | BRCA | 1 |
| p.F415L | CESC | 1 |
| p.R760W | LGG | 1 |
| p.G466E | SKCM | 1 |
| p.E191* | UCEC | 1 |
| p.L530V | BLCA | 1 |
| p.A277V | SKCM | 1 |
| p.G506R | SKCM | 1 |
| p.E248K | SKCM | 1 |
| p.G580E | SKCM | 1 |
| p.N400S | LGG | 1 |
| p.D162N | UCEC | 1 |
| p.L542M | UCEC | 1 |
| p.E382G | LUAD | 1 |
| p.N729S | KIRP | 1 |
| p.G398R | BRCA | 1 |
| p.K521X | LIHC | 1 |
| p.R539H | PAAD | 1 |
| p.N515S | SKCM | 1 |
| p.R531C | SKCM | 1 |
| p.W343X | SKCM | 1 |
| p.D22Y | LUAD | 1 |
| p.W793* | SKCM | 1 |
| p.M90K | STAD | 1 |
| p.R309Q | STAD | 1 |
| p.E341K | SKCM | 1 |
| p.T774M | UCEC | 1 |
| p.R674W | STAD | 1 |
| p.R302Q | STAD | 1 |
| p.E31D | PAAD | 1 |
| p.I588M | CESC | 1 |
| p.G239D | SKCM | 1 |
| p.D102N | UCEC | 1 |
| p.T592M | LGG | 1 |
| p.R803C | BLCA | 1 |
| p.E813D | SKCM | 1 |
| p.D22N | LIHC | 1 |
| p.A735V | COAD | 1 |
| p.T590I | SKCM | 1 |
| p.A620T | HNSC | 1 |
| p.P319S | CESC | 1 |
| p.R263Q | UCEC | 1 |
| p.L556S | BLCA | 1 |
| p.E654K | CESC | 1 |
| p.N359S | LGG | 1 |
| p.S717Y | THYM | 1 |
| p.R178C | UCEC | 1 |
| p.E24D | PAAD | 1 |
| p.N474S | SKCM | 1 |
| p.R220H | COAD | 1 |
| p.G810S | LIHC | 1 |
| p.D292Y | HNSC | 1 |
| Top |
| TissGeneCNV for IQCA1 |
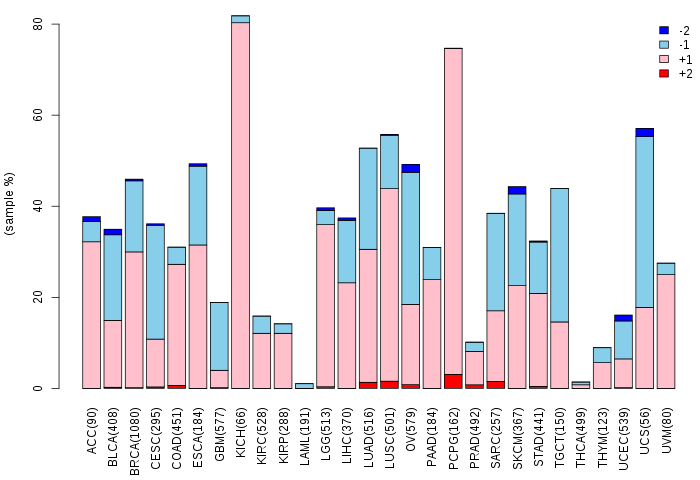
| Copy number variations of TissGene across 28 cancer types (X-axis: cancer type and Y-axis: % of CNV samples) (TCGA Gistic2_CopyNumber_Gistic2_all_data_by_genes, Gistic2 copy number data, version 2016-08-16) |
 |
| Top |
| TissGeneFusions for IQCA1 |
| Fusion genes including TissGene (ChimerDB 3.0, 2016-12-01 and TCGA fusion Portal 2015-12-01) |
| Database | Src | Cancer type | Sample | Fusion gene | ORF | 5'-gene BP | 3'-gene BP |
| Chimerdb3.0 | ChiTaRs | NA | BF944750 | IQCA1-PLEKHM3 | chr2:237349381 | chr2:208728111 | |
| Chimerdb3.0 | ChiTaRs | NA | AW772133 | IQCA1-SIK3 | chr2:237279338 | chr11:116933891 | |
| Chimerdb3.0 | FusionScan | BRCA | TCGA-BH-A0HB-01A | ANXA8L2-IQCA1 | In-Frame | chr10:47747132 | chr2:237247025 |
| TCGAfusionPortal | PRADA | BRCA | TCGA-AC-A6IW-01A | GALNT10-IQCA1 | Out-of-frame | Chr5:153677639 | Chr2:237289279 |
| Top |
| TissGeneNet for IQCA1 |
| Co-expressed gene networks based on protein-protein interaction data (CePIN) (TCGA IlluminaHiSeq_RNASeqV2, pan-cancer normalized log2(norm_counts+1) data, version 2016-08-16) (PINA2 ppi data) |
| Top |
| TissGeneProg for IQCA1 |
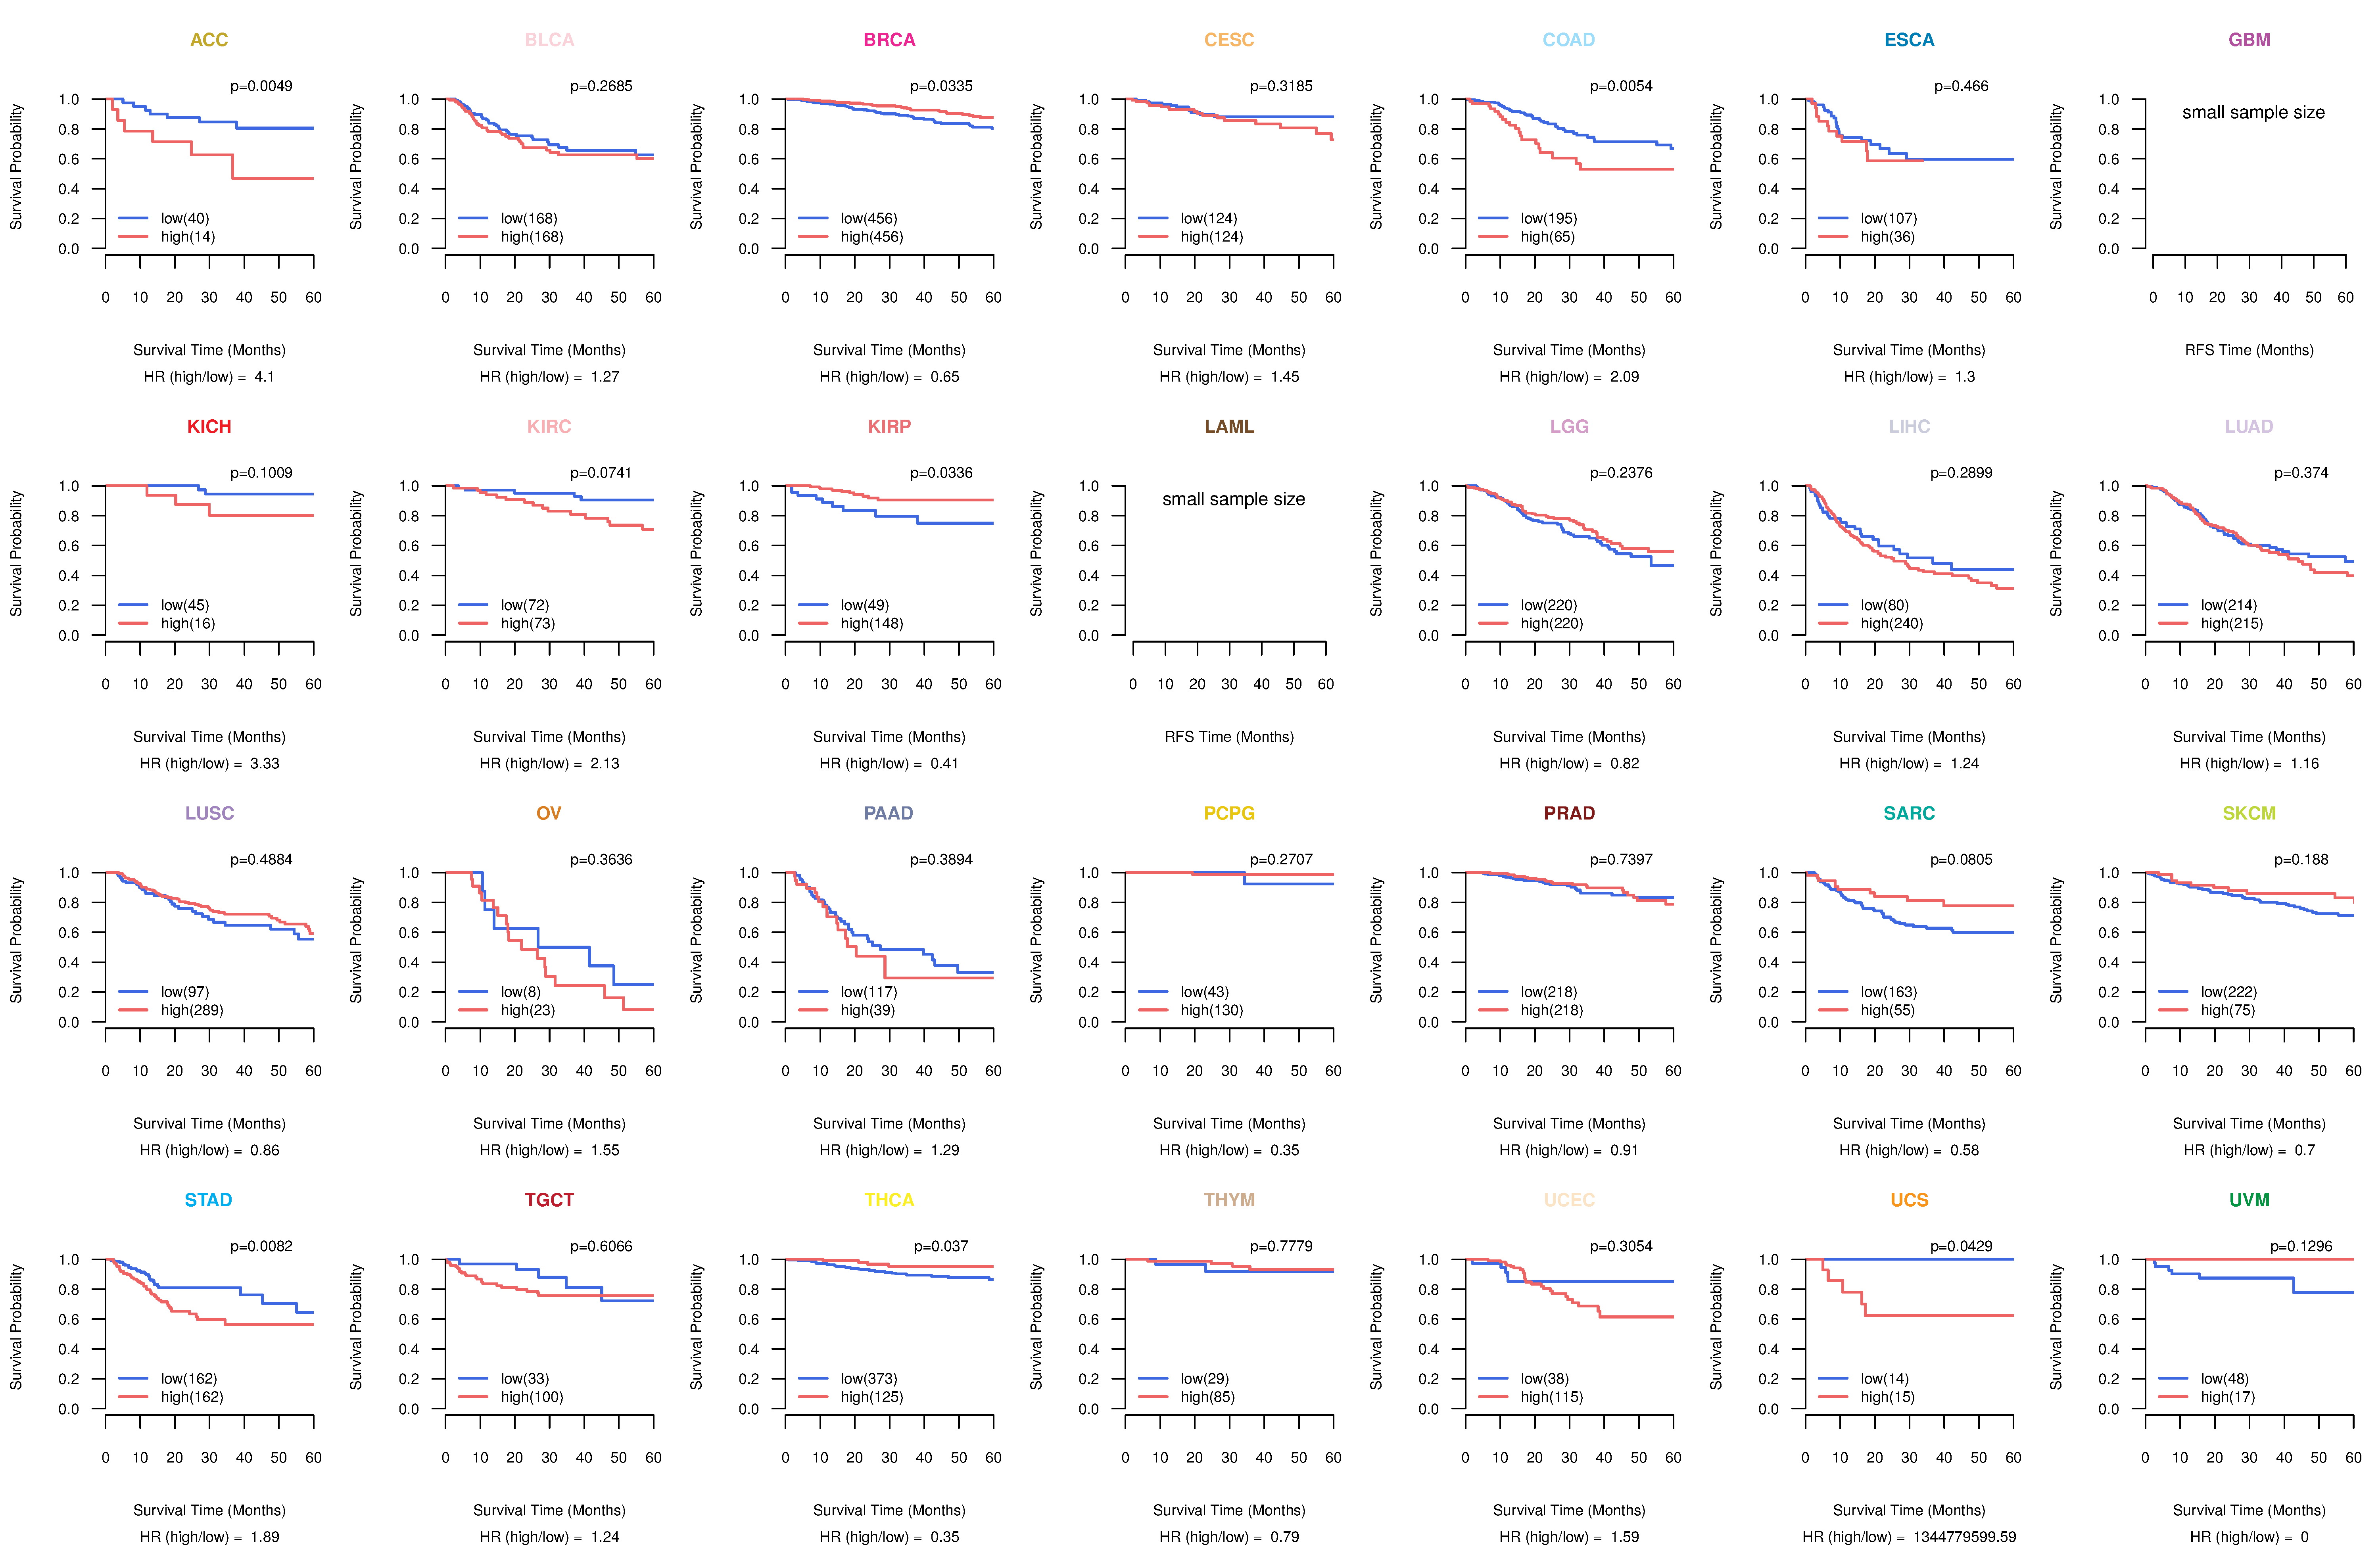
| Kaplan-Meier plots with logrank tests of overall survival (OS) using 28 cancer types (TCGA IlluminaHiSeq_RNASeqV2, pan-cancer normalized log2(norm_counts+1) data, version 2016-08-16) (TCGA clinicalMatrix, phenotype data, version 2016-04-27) * Click on the image to enlarge it in a new window. |
 |
| Kaplan-Meier plots with logrank test of relapse free survival (RFS) using 28 cancer types (TCGA IlluminaHiSeq_RNASeqV2, pan-cancer normalized log2(norm_counts+1) data, version 2016-08-16) (TCGA clinicalMatrix, phenotype data, version 2016-04-27) * Click on the image enlarge it in a new window. |
 |
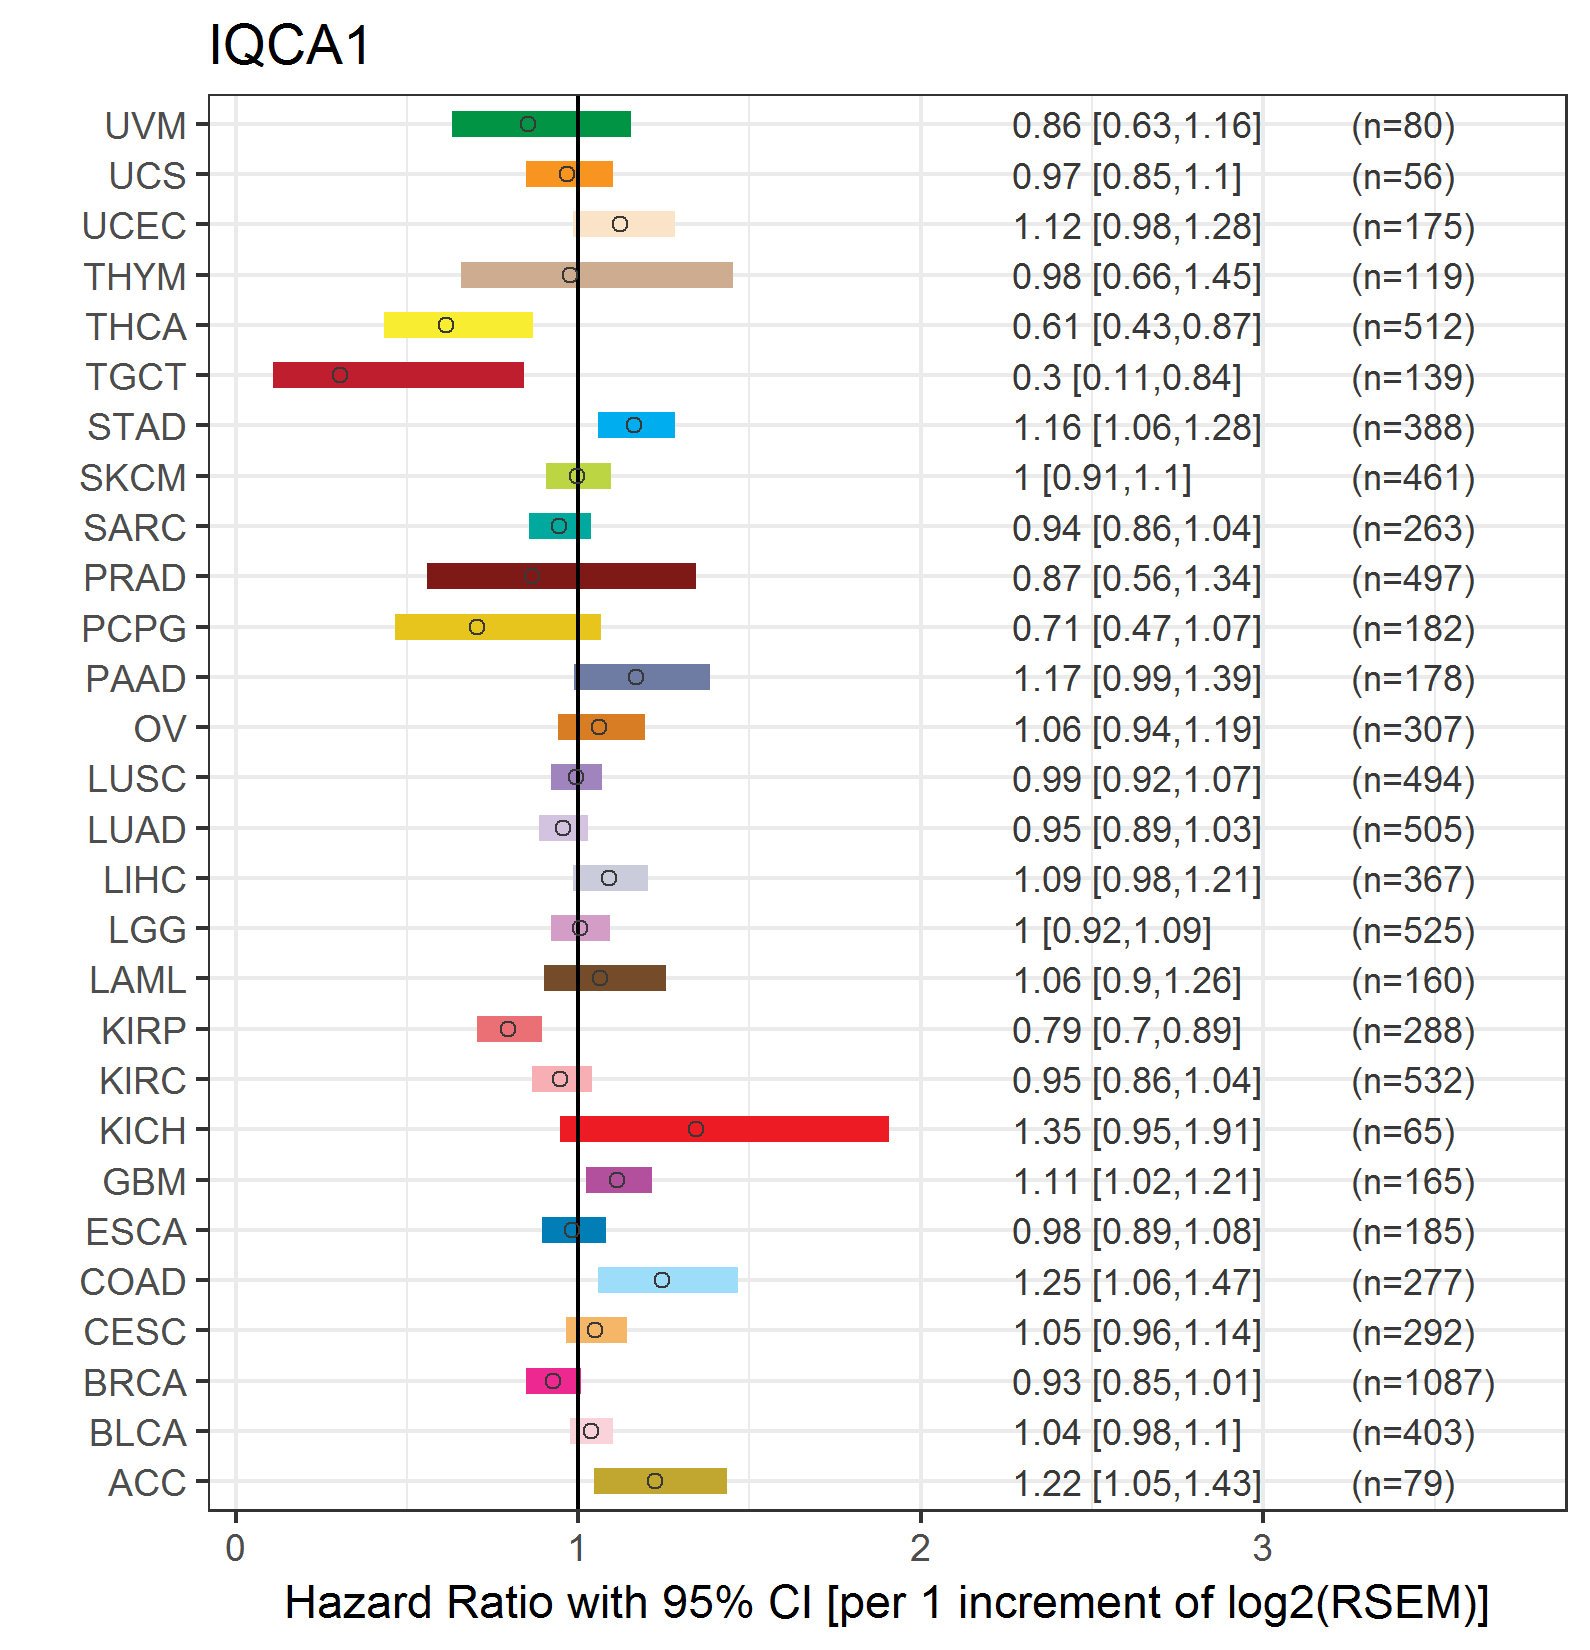
| Forest plot of Cox proportional hazard ratio (HR) and 95% CI of overall survival (OS) using 28 cancer types (TCGA IlluminaHiSeq_RNASeqV2, pan-cancer normalized log2(norm_counts+1) data, version 2016-08-16) (TCGA clinicalMatrix, phenotype data, version 2016-04-27) * Click on the image enlarge it in a new window. |
 |
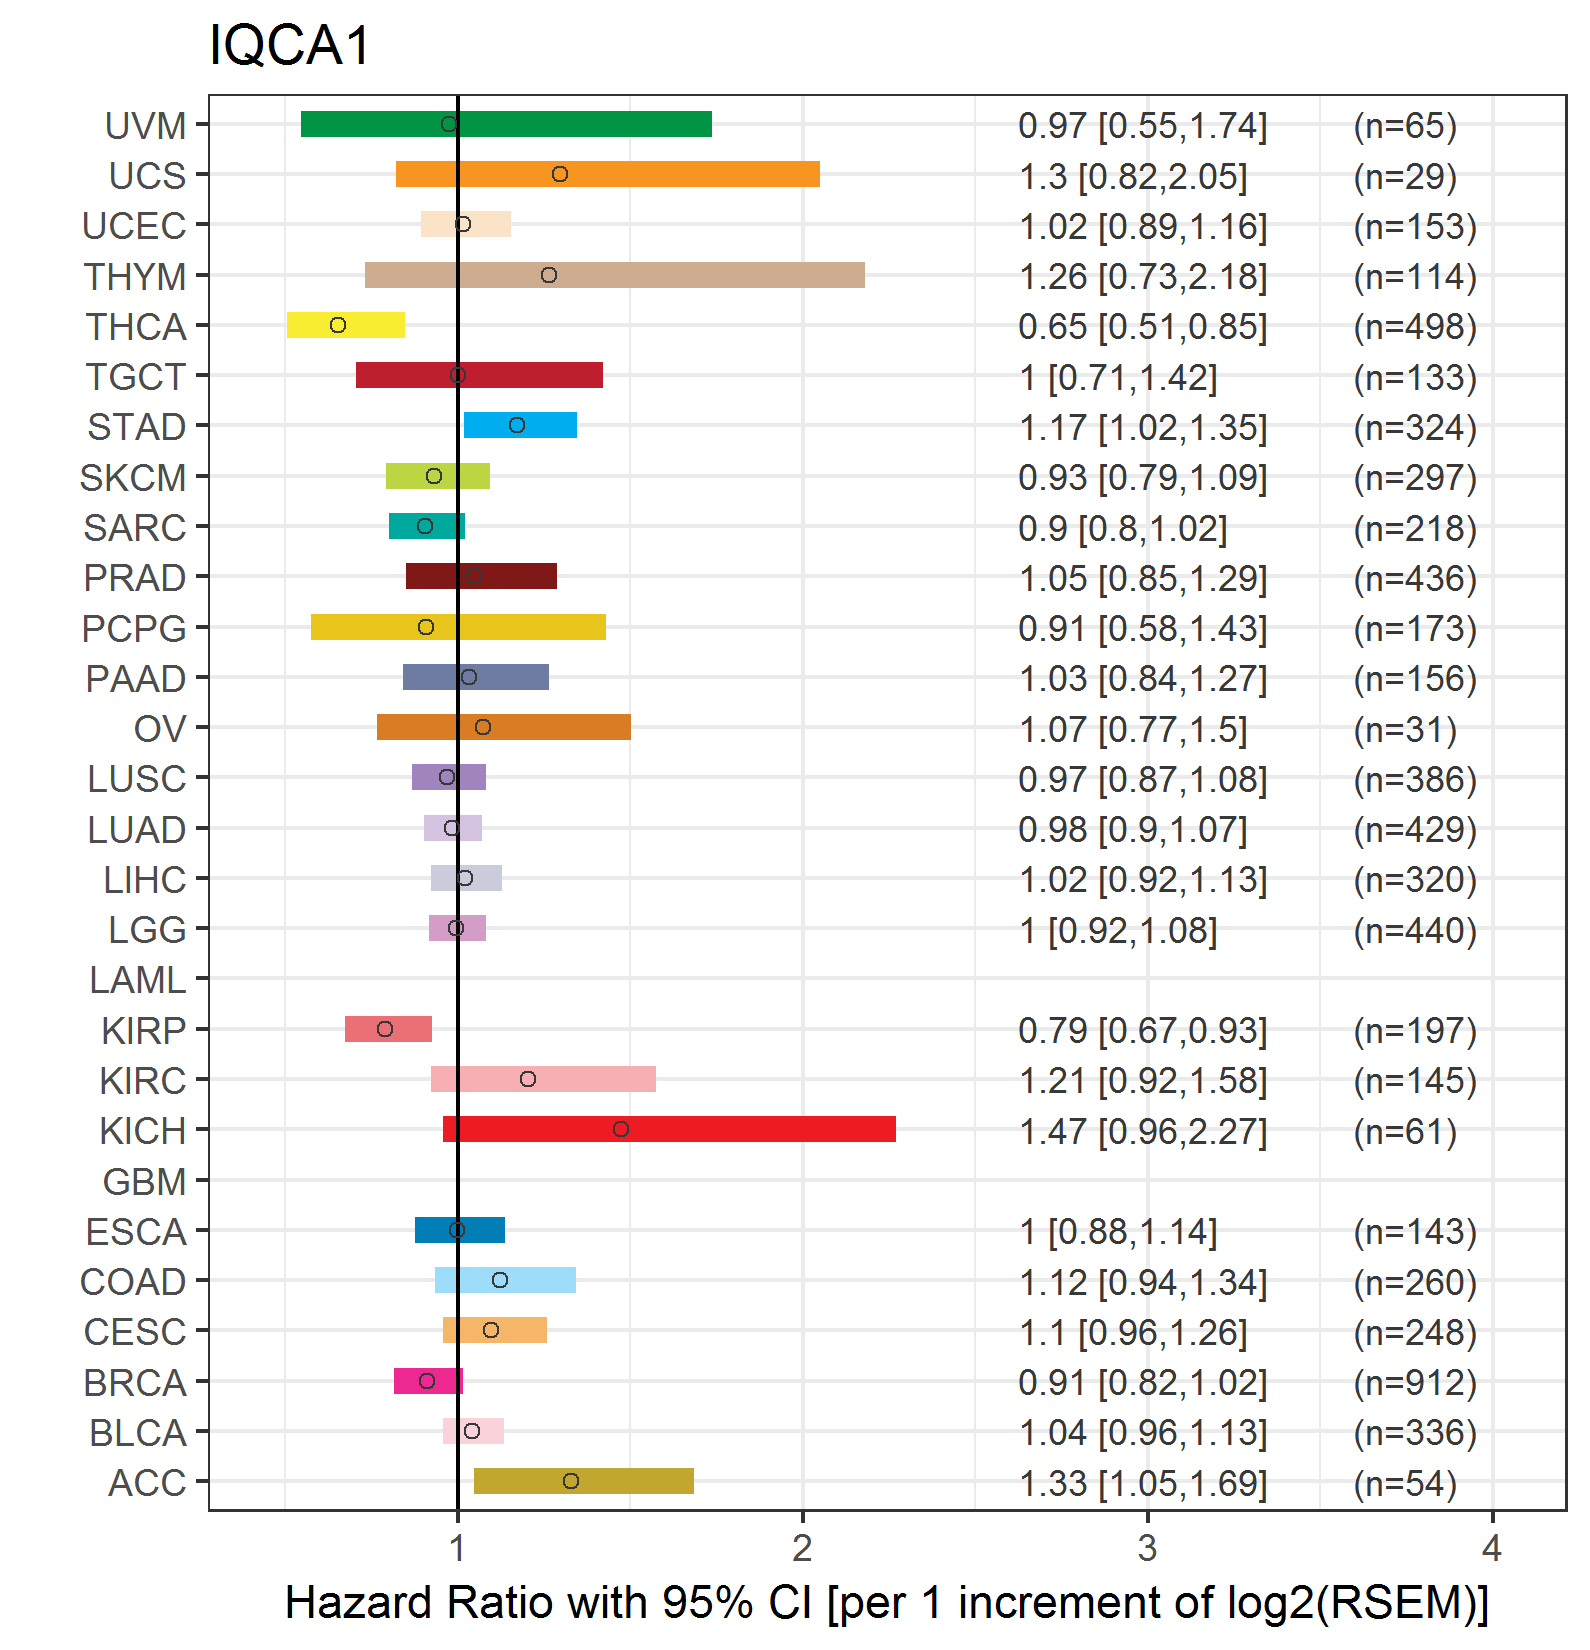
| Forest plot of Cox proportional hazard ratio (HR) and 95% CI of relapse free survival (RFS) using 28 cancer types (TCGA IlluminaHiSeq_RNASeqV2, pan-cancer normalized log2(norm_counts+1) data, version 2016-08-16) (TCGA clinicalMatrix, phenotype data, version 2016-04-27) * Click on the image enlarge it in a new window. |
 |
| Top |
| TissGeneClin for IQCA1 |
| TissGeneDrug for IQCA1 |
| Drug information targeting TissGene (DrugBank Version 5.0.6, 2017-04-01) |
| DrugBank ID | Drug name | Drug activity | Drug type | Drug status |
| Top |
| TissGeneDisease for IQCA1 |
| Disease information associated with TissGene (DisGeNet, 2016-06-01) |
| Disease ID | Disease name | # pubmeds | Source |
|
Copyright 2016-Present - The University of Texas Health Science Center at Houston (UTHealth) Web File Viewing | How to Report, Fraud, Waste and Abuse | State of Texas | Statewide Search | Texas Homeland Security | Site Policies |