 |
| |
| |
| |
| |
| |
| |
|

| TissGeneSummary for SHCBP1 |
 Gene summary Gene summary |
| Basic gene information | Gene symbol | SHCBP1 |
| Gene name | SHC SH2-domain binding protein 1 | |
| Synonyms | PAL | |
| Cytomap | UCSC genome browser: 16q11.2 | |
| Type of gene | protein-coding | |
| RefGenes | NM_024745.4, | |
| Description | SHC SH2 domain-binding protein 1 | |
| Modification date | 20141207 | |
| dbXrefs | MIM : 611027 | |
| HGNC : HGNC | ||
| Ensembl : ENSG00000171241 | ||
| HPRD : 11557 | ||
| Vega : OTTHUMG00000132540 | ||
| Protein | UniProt: go to UniProt's Cross Reference DB Table | |
| Expression | CleanEX: HS_SHCBP1 | |
| BioGPS: 79801 | ||
| Pathway | NCI Pathway Interaction Database: SHCBP1 | |
| KEGG: SHCBP1 | ||
| REACTOME: SHCBP1 | ||
| Pathway Commons: SHCBP1 | ||
| Context | iHOP: SHCBP1 | |
| ligand binding site mutation search in PubMed: SHCBP1 | ||
| UCL Cancer Institute: SHCBP1 | ||
| Assigned class in TissGDB* | C | |
| Included tissue-specific gene expression resources | TiGER,GTEx | |
| Specific-tissues in normal samples (assigned by TissGDB using HPA, TiGER, and GTEx) | Soft tissueTestis | |
| Cancer types related to the specific-tissues in cancer samples (assigned by TissGDB using TCGA) | SARCTGCT | |
| Reference showing the relevant tissue of SHCBP1 | ||
| Description by TissGene annotations | ||
| * Class A consists of genes with literature evidence and is part of the cTissGenes. Class B consists of only cTissGenes without additional evidence. The remaining genes belong to Class C. |
| Gene ontology having evidence of Inferred from Direct Assay (IDA) from Entrez |
| GO ID | GO term | PubMed ID |
| Top |
| TissGeneExp for SHCBP1 |
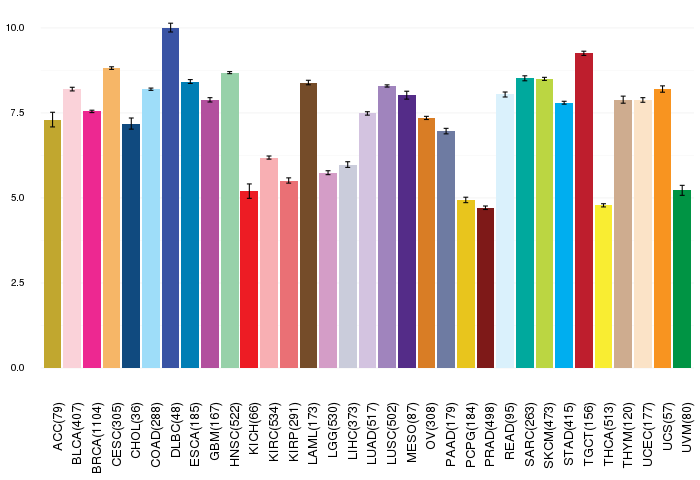
| Gene expressions across 28 cancer types (X-axis: cancer type and Y-axis: log2(norm_counts+1)) (TCGA IlluminaHiSeq_RNASeqV2, pan-cancer normalized log2(norm_counts+1) data, version 2016-08-16) |
 |
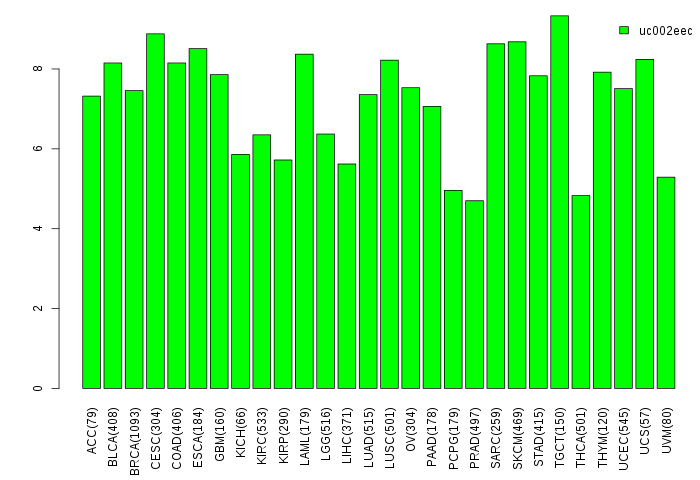
| Gene isoform expressions across 28 cancer types (X-axis: cancer type and Y-axis: log2(norm_counts+1)) (TCGA pan-cancer tcga_rsem_isoform_tpm, version 2016-09-01) |
 |
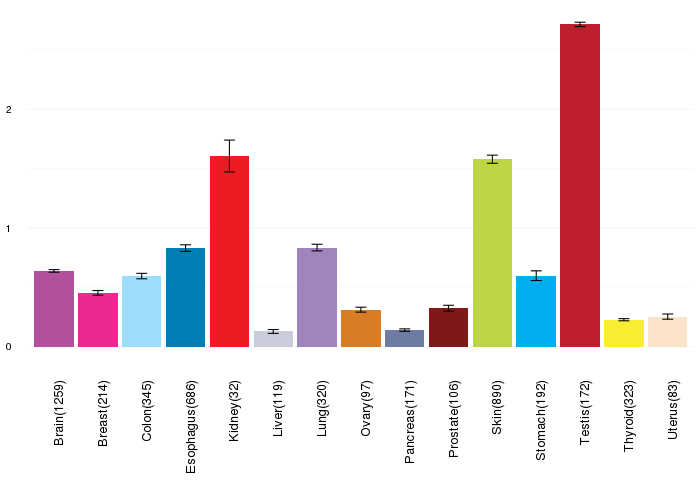
| Gene expressions across normal tissues of GTEx data (GTEx GTEx_Analysis_v6_RNA-seq_RNA-SeQCv1.1.8_gene_rpkm.gct) - Here, we shows the matched tissue types only among our 28 cancer types. |
 |
| Different expressions across 14 cancer types with more than 10 samples between matched tumors and normals (X-axis: cancer type and Y-axis: log2(norm_counts+1)) (TCGA IlluminaHiSeq_RNASeqV2, pan-cancer normalized log2(norm_counts+1) data, version 2016-08-16) |
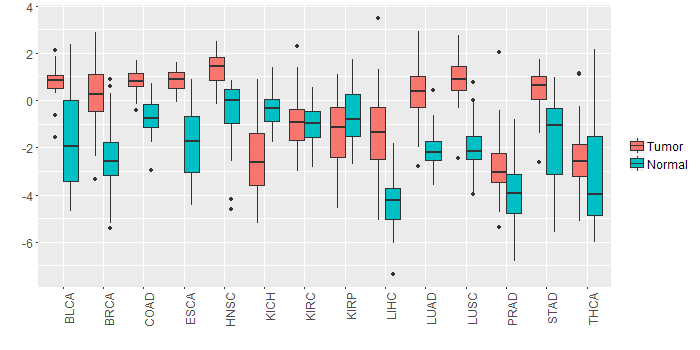 |
| - Significantly differentially expressed cancer types and information. (|Fold change|>1 and FDR<0.05) |
| Cancer type | Mean(exp) in tumor | Mean(exp) in matched normal | Log2FC | P-val. | FDR |
| PRAD | -2.824821479 | -3.981213787 | 1.156392308 | 1.38E-06 | 9.52E-06 |
| LUAD | 0.284047221 | -2.116930365 | 2.400977586 | 1.88E-23 | 6.11E-22 |
| LUSC | 0.912539682 | -1.942042671 | 2.854582353 | 1.33E-29 | 5.45E-28 |
| COAD | 0.815405444 | -0.74159071 | 1.556996154 | 3.68E-10 | 4.50E-09 |
| LIHC | -1.43145671 | -4.38287471 | 2.951418 | 9.12E-17 | 4.05E-15 |
| KICH | -2.33270071 | -0.44163271 | -1.891068 | 1.00E-05 | 3.17E-05 |
| STAD | 0.386712415 | -1.64521571 | 2.031928125 | 1.06E-06 | 1.70E-05 |
| HNSC | 1.331663941 | -0.369568617 | 1.701232558 | 7.09E-11 | 1.46E-09 |
| BRCA | 0.275584728 | -2.423331938 | 2.698916667 | 2.55E-44 | 1.06E-42 |
| ESCA | 0.873550199 | -1.861458892 | 2.735009091 | 0.000268 | 0.006320842 |
| BLCA | 0.804169816 | -1.693398605 | 2.497568421 | 9.04E-05 | 0.001015402 |
| Top |
| TissGene-miRNA for SHCBP1 |
| Significantly anti-correlated miRNAs of TissGene across 28 cancer types (Gene-miRNA relations from TargetScanHuman Relsease 7.1, Conserved_Site_Context_Scores.txt.zip, 06.01.2016) (TCGA IlluminaHiSeq_miRNASeq, log2(RPM+1) data, version 2016-11-21) (TCGA IlluminaHiSeq_RNASeqV2, log2(normalized_count+1) data, version 2016-08-16) (Spearman’s Rank Correlation (p-value<0.05 and coefficient<-0.25)) |
| Cancer type | miRNA id | miRNA accession | P-val. | Coeff. | # samples |
| Top |
| TissGeneMut for SHCBP1 |
| TissGeneSNV for SHCBP1 |
| nsSNV counts per each loci. Different colors of circles represent different cancer types. Circle size denotes number of samples. (TCGA somatic mutation (SNPs and small INDELs) data, version 2016-04-25) * Click on the image to enlarge it in a new window. |
 |
| Somatic nucleotide variants of TissGene across 28 cancer types (X-axis: cancer type and Y-axis: % of mutated samples) The numbers in parentheses are numbers of samples with mutation (nsSNVs). (TCGA somatic mutation (SNPs and small INDELs) data, version 2016-04-25) |
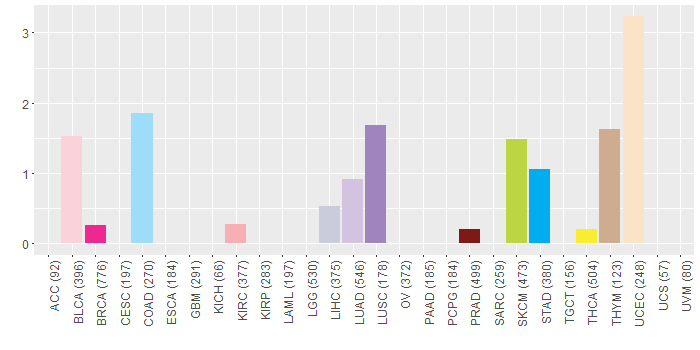 |
| - nsSNVs sorted by frequency. |
| AAchange | Cancer type | # samples |
| p.E107K | BLCA | 1 |
| p.T573R | LUAD | 1 |
| p.N539H | BRCA | 1 |
| p.A559G | LIHC | 1 |
| p.T473P | THCA | 1 |
| p.G435A | LUAD | 1 |
| p.S152F | LUSC | 1 |
| p.G435V | BLCA | 1 |
| p.T466R | SKCM | 1 |
| p.W179* | STAD | 1 |
| p.M21T | COAD | 1 |
| p.R238P | LUSC | 1 |
| p.E362* | UCEC | 1 |
| p.K528R | BLCA | 1 |
| p.H248Q | SKCM | 1 |
| p.R227Q | BLCA | 1 |
| p.G668D | THYM | 1 |
| p.W179X | STAD | 1 |
| p.D504E | UCEC | 1 |
| p.D233Y | UCEC | 1 |
| p.E609K | BLCA | 1 |
| p.D518V | COAD | 1 |
| p.A568V | UCEC | 1 |
| p.C599* | UCEC | 1 |
| p.R238* | SKCM | 1 |
| p.G428D | STAD | 1 |
| p.T602I | LIHC | 1 |
| p.A15G | LUSC | 1 |
| p.A192S | LUAD | 1 |
| p.N534I | UCEC | 1 |
| p.T349M | READ | 1 |
| p.R229G | BLCA | 1 |
| p.R325H | COAD | 1 |
| p.R325H | STAD | 1 |
| p.R227Q | UCEC | 1 |
| p.D421N | KIRC | 1 |
| p.R325C | UCEC | 1 |
| p.R472W | THYM | 1 |
| p.C599Y | STAD | 1 |
| p.K437T | UCEC | 1 |
| p.S266N | COAD | 1 |
| p.C150F | HNSC | 1 |
| p.E236D | HNSC | 1 |
| p.G656W | SKCM | 1 |
| p.L262I | SKCM | 1 |
| p.N318S | SKCM | 1 |
| p.G285W | PRAD | 1 |
| p.R238X | SKCM | 1 |
| p.A398T | COAD | 1 |
| p.C426S | LUAD | 1 |
| p.D237N | HNSC | 1 |
| p.T501I | SKCM | 1 |
| p.D410E | BRCA | 1 |
| p.H231Y | UCEC | 1 |
| p.R452L | LUAD | 1 |
| Top |
| TissGeneCNV for SHCBP1 |
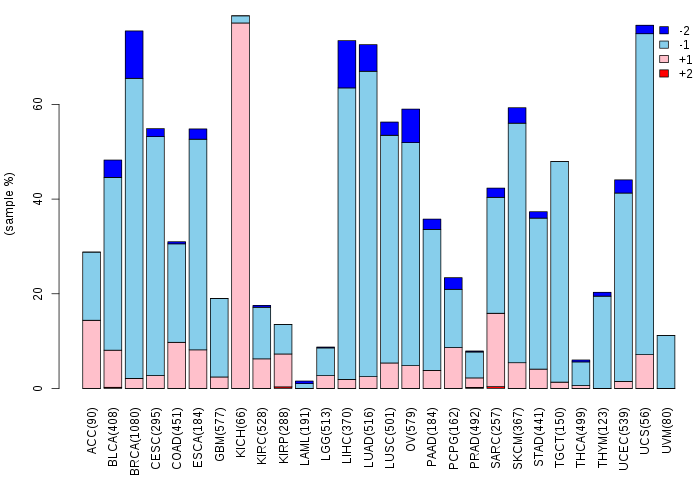
| Copy number variations of TissGene across 28 cancer types (X-axis: cancer type and Y-axis: % of CNV samples) (TCGA Gistic2_CopyNumber_Gistic2_all_data_by_genes, Gistic2 copy number data, version 2016-08-16) |
 |
| Top |
| TissGeneFusions for SHCBP1 |
| Fusion genes including TissGene (ChimerDB 3.0, 2016-12-01 and TCGA fusion Portal 2015-12-01) |
| Database | Src | Cancer type | Sample | Fusion gene | ORF | 5'-gene BP | 3'-gene BP |
| Chimerdb3.0 | ChiTaRs | NA | BC020889 | SHCBP1-IGJ | chr16:46655288 | chr4:71521262 | |
| TCGAfusionPortal | PRADA | BRCA | TCGA-A8-A09A-01A | NRIP1-SHCBP1 | 5UTR-CDS | Chr21:16386665 | Chr16:46642301 |
| Top |
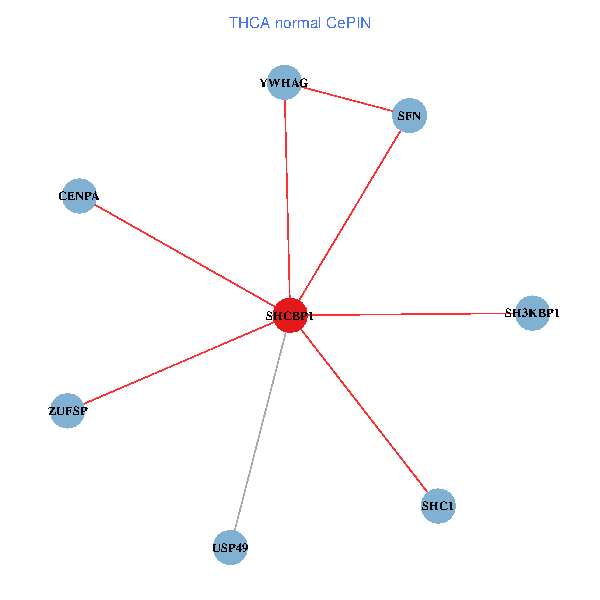
| TissGeneNet for SHCBP1 |
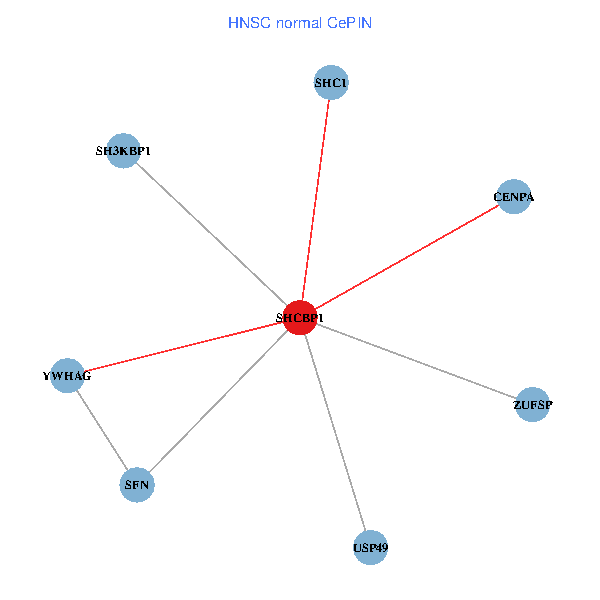
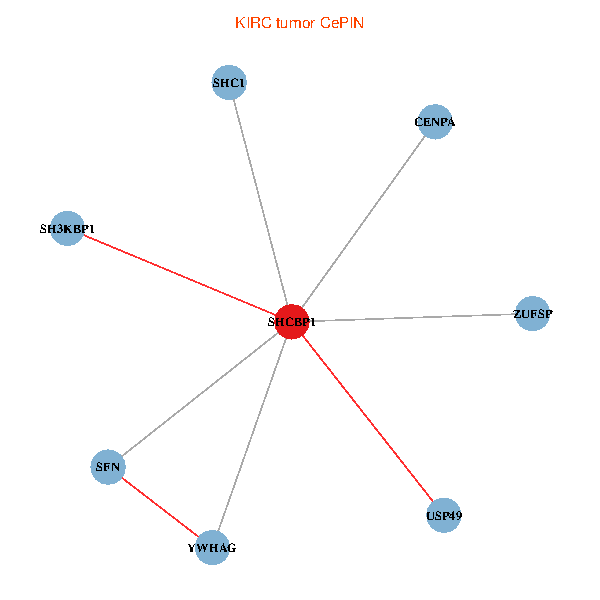
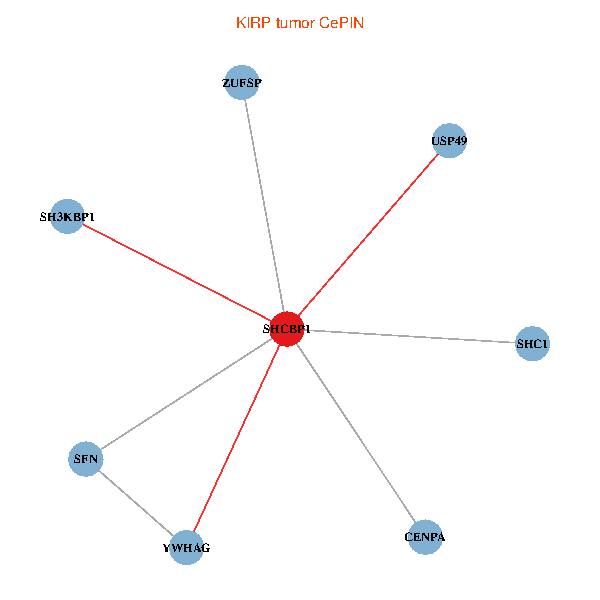
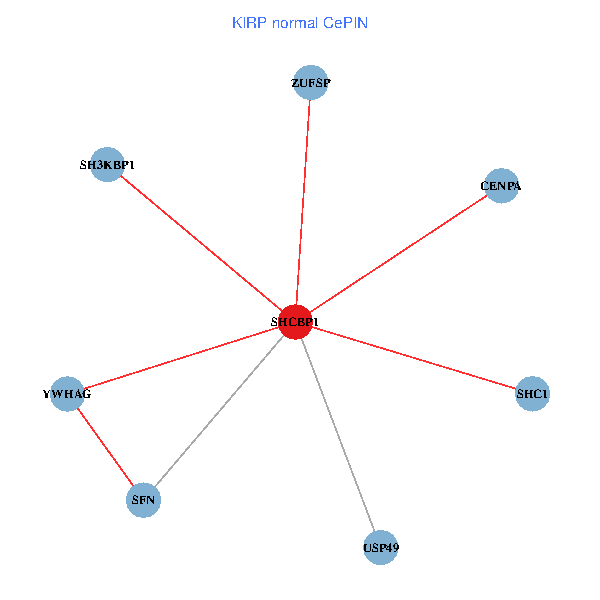
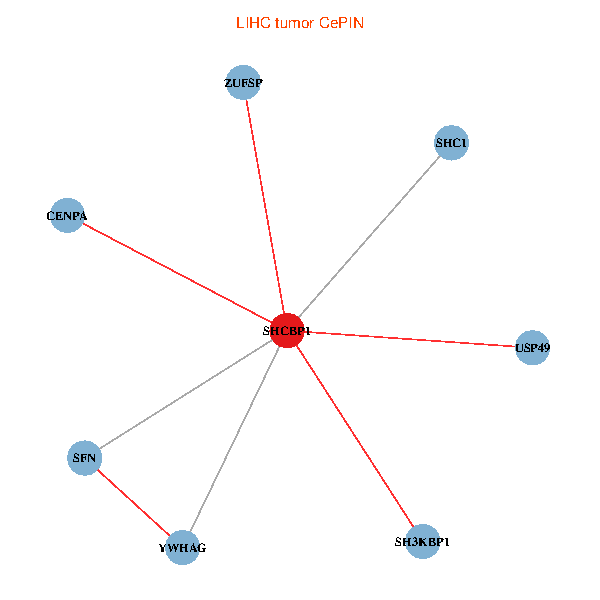
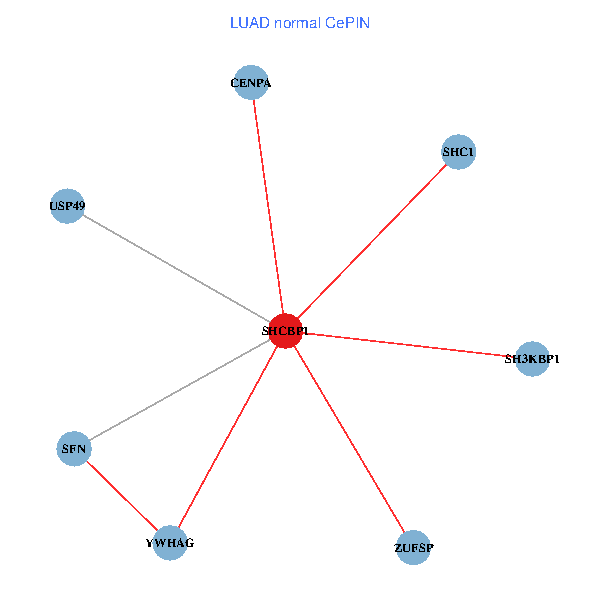
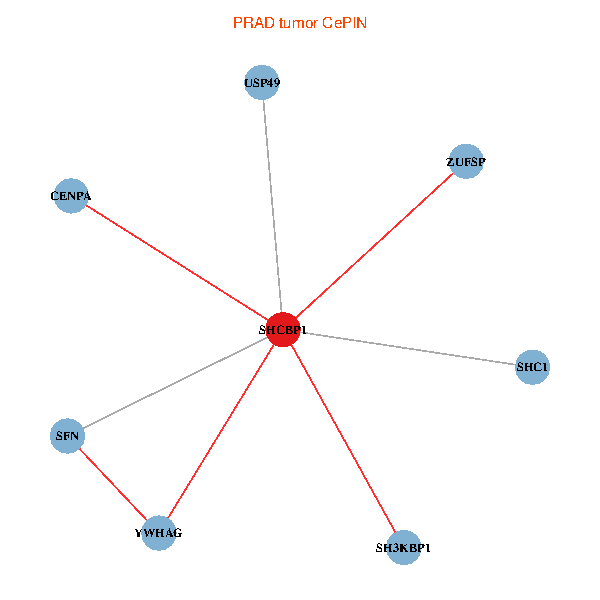
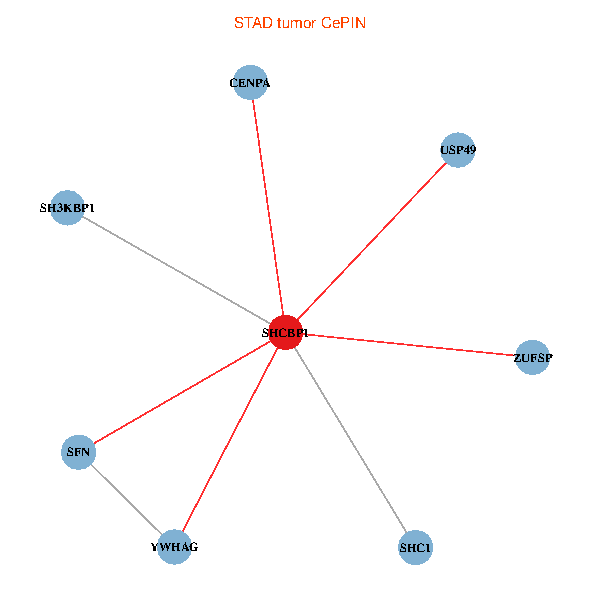
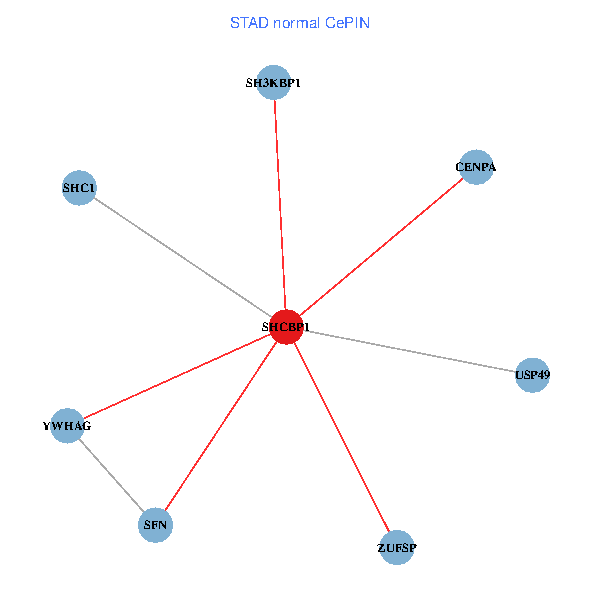
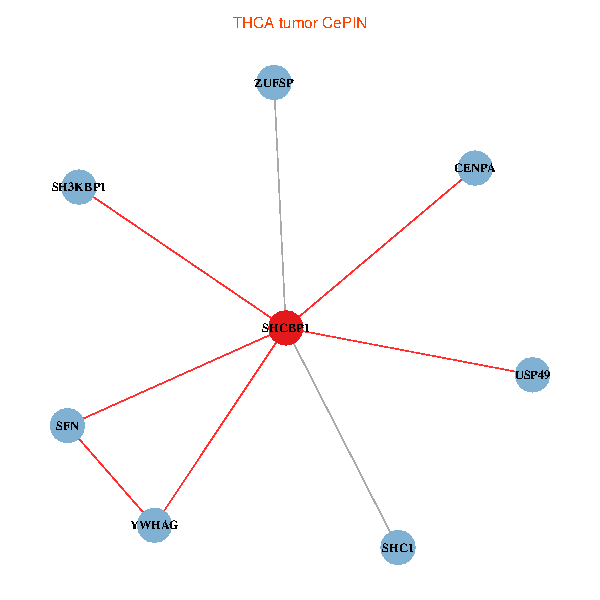
| Co-expressed gene networks based on protein-protein interaction data (CePIN) (TCGA IlluminaHiSeq_RNASeqV2, pan-cancer normalized log2(norm_counts+1) data, version 2016-08-16) (PINA2 ppi data) |
| BRCA (tumor) | BRCA (normal) |
| SHCBP1, SH3KBP1, YWHAG, SHC1, CENPA, SFN, USP49, ZUFSP (tumor) | SHCBP1, SH3KBP1, YWHAG, SHC1, CENPA, SFN, USP49, ZUFSP (normal) |
 |  |
| COAD (tumor) | COAD (normal) |
| SHCBP1, SH3KBP1, YWHAG, SHC1, CENPA, SFN, USP49, ZUFSP (tumor) | SHCBP1, SH3KBP1, YWHAG, SHC1, CENPA, SFN, USP49, ZUFSP (normal) |
 |  |
| HNSC (tumor) | HNSC (normal) |
| SHCBP1, SH3KBP1, YWHAG, SHC1, CENPA, SFN, USP49, ZUFSP (tumor) | SHCBP1, SH3KBP1, YWHAG, SHC1, CENPA, SFN, USP49, ZUFSP (normal) |
 |  |
| KICH (tumor) | KICH (normal) |
| SHCBP1, SH3KBP1, YWHAG, SHC1, CENPA, SFN, USP49, ZUFSP (tumor) | SHCBP1, SH3KBP1, YWHAG, SHC1, CENPA, SFN, USP49, ZUFSP (normal) |
 |  |
| KIRC (tumor) | KIRC (normal) |
| SHCBP1, SH3KBP1, YWHAG, SHC1, CENPA, SFN, USP49, ZUFSP (tumor) | SHCBP1, SH3KBP1, YWHAG, SHC1, CENPA, SFN, USP49, ZUFSP (normal) |
 |  |
| KIRP (tumor) | KIRP (normal) |
| SHCBP1, SH3KBP1, YWHAG, SHC1, CENPA, SFN, USP49, ZUFSP (tumor) | SHCBP1, SH3KBP1, YWHAG, SHC1, CENPA, SFN, USP49, ZUFSP (normal) |
 |  |
| LIHC (tumor) | LIHC (normal) |
| SHCBP1, SH3KBP1, YWHAG, SHC1, CENPA, SFN, USP49, ZUFSP (tumor) | SHCBP1, SH3KBP1, YWHAG, SHC1, CENPA, SFN, USP49, ZUFSP (normal) |
 |  |
| LUAD (tumor) | LUAD (normal) |
| SHCBP1, SH3KBP1, YWHAG, SHC1, CENPA, SFN, USP49, ZUFSP (tumor) | SHCBP1, SH3KBP1, YWHAG, SHC1, CENPA, SFN, USP49, ZUFSP (normal) |
 |  |
| LUSC (tumor) | LUSC (normal) |
| SHCBP1, SH3KBP1, YWHAG, SHC1, CENPA, SFN, USP49, ZUFSP (tumor) | SHCBP1, SH3KBP1, YWHAG, SHC1, CENPA, SFN, USP49, ZUFSP (normal) |
 |  |
| PRAD (tumor) | PRAD (normal) |
| SHCBP1, SH3KBP1, YWHAG, SHC1, CENPA, SFN, USP49, ZUFSP (tumor) | SHCBP1, SH3KBP1, YWHAG, SHC1, CENPA, SFN, USP49, ZUFSP (normal) |
 |  |
| STAD (tumor) | STAD (normal) |
| SHCBP1, SH3KBP1, YWHAG, SHC1, CENPA, SFN, USP49, ZUFSP (tumor) | SHCBP1, SH3KBP1, YWHAG, SHC1, CENPA, SFN, USP49, ZUFSP (normal) |
 |  |
| THCA (tumor) | THCA (normal) |
| SHCBP1, SH3KBP1, YWHAG, SHC1, CENPA, SFN, USP49, ZUFSP (tumor) | SHCBP1, SH3KBP1, YWHAG, SHC1, CENPA, SFN, USP49, ZUFSP (normal) |
 |  |
| Top |
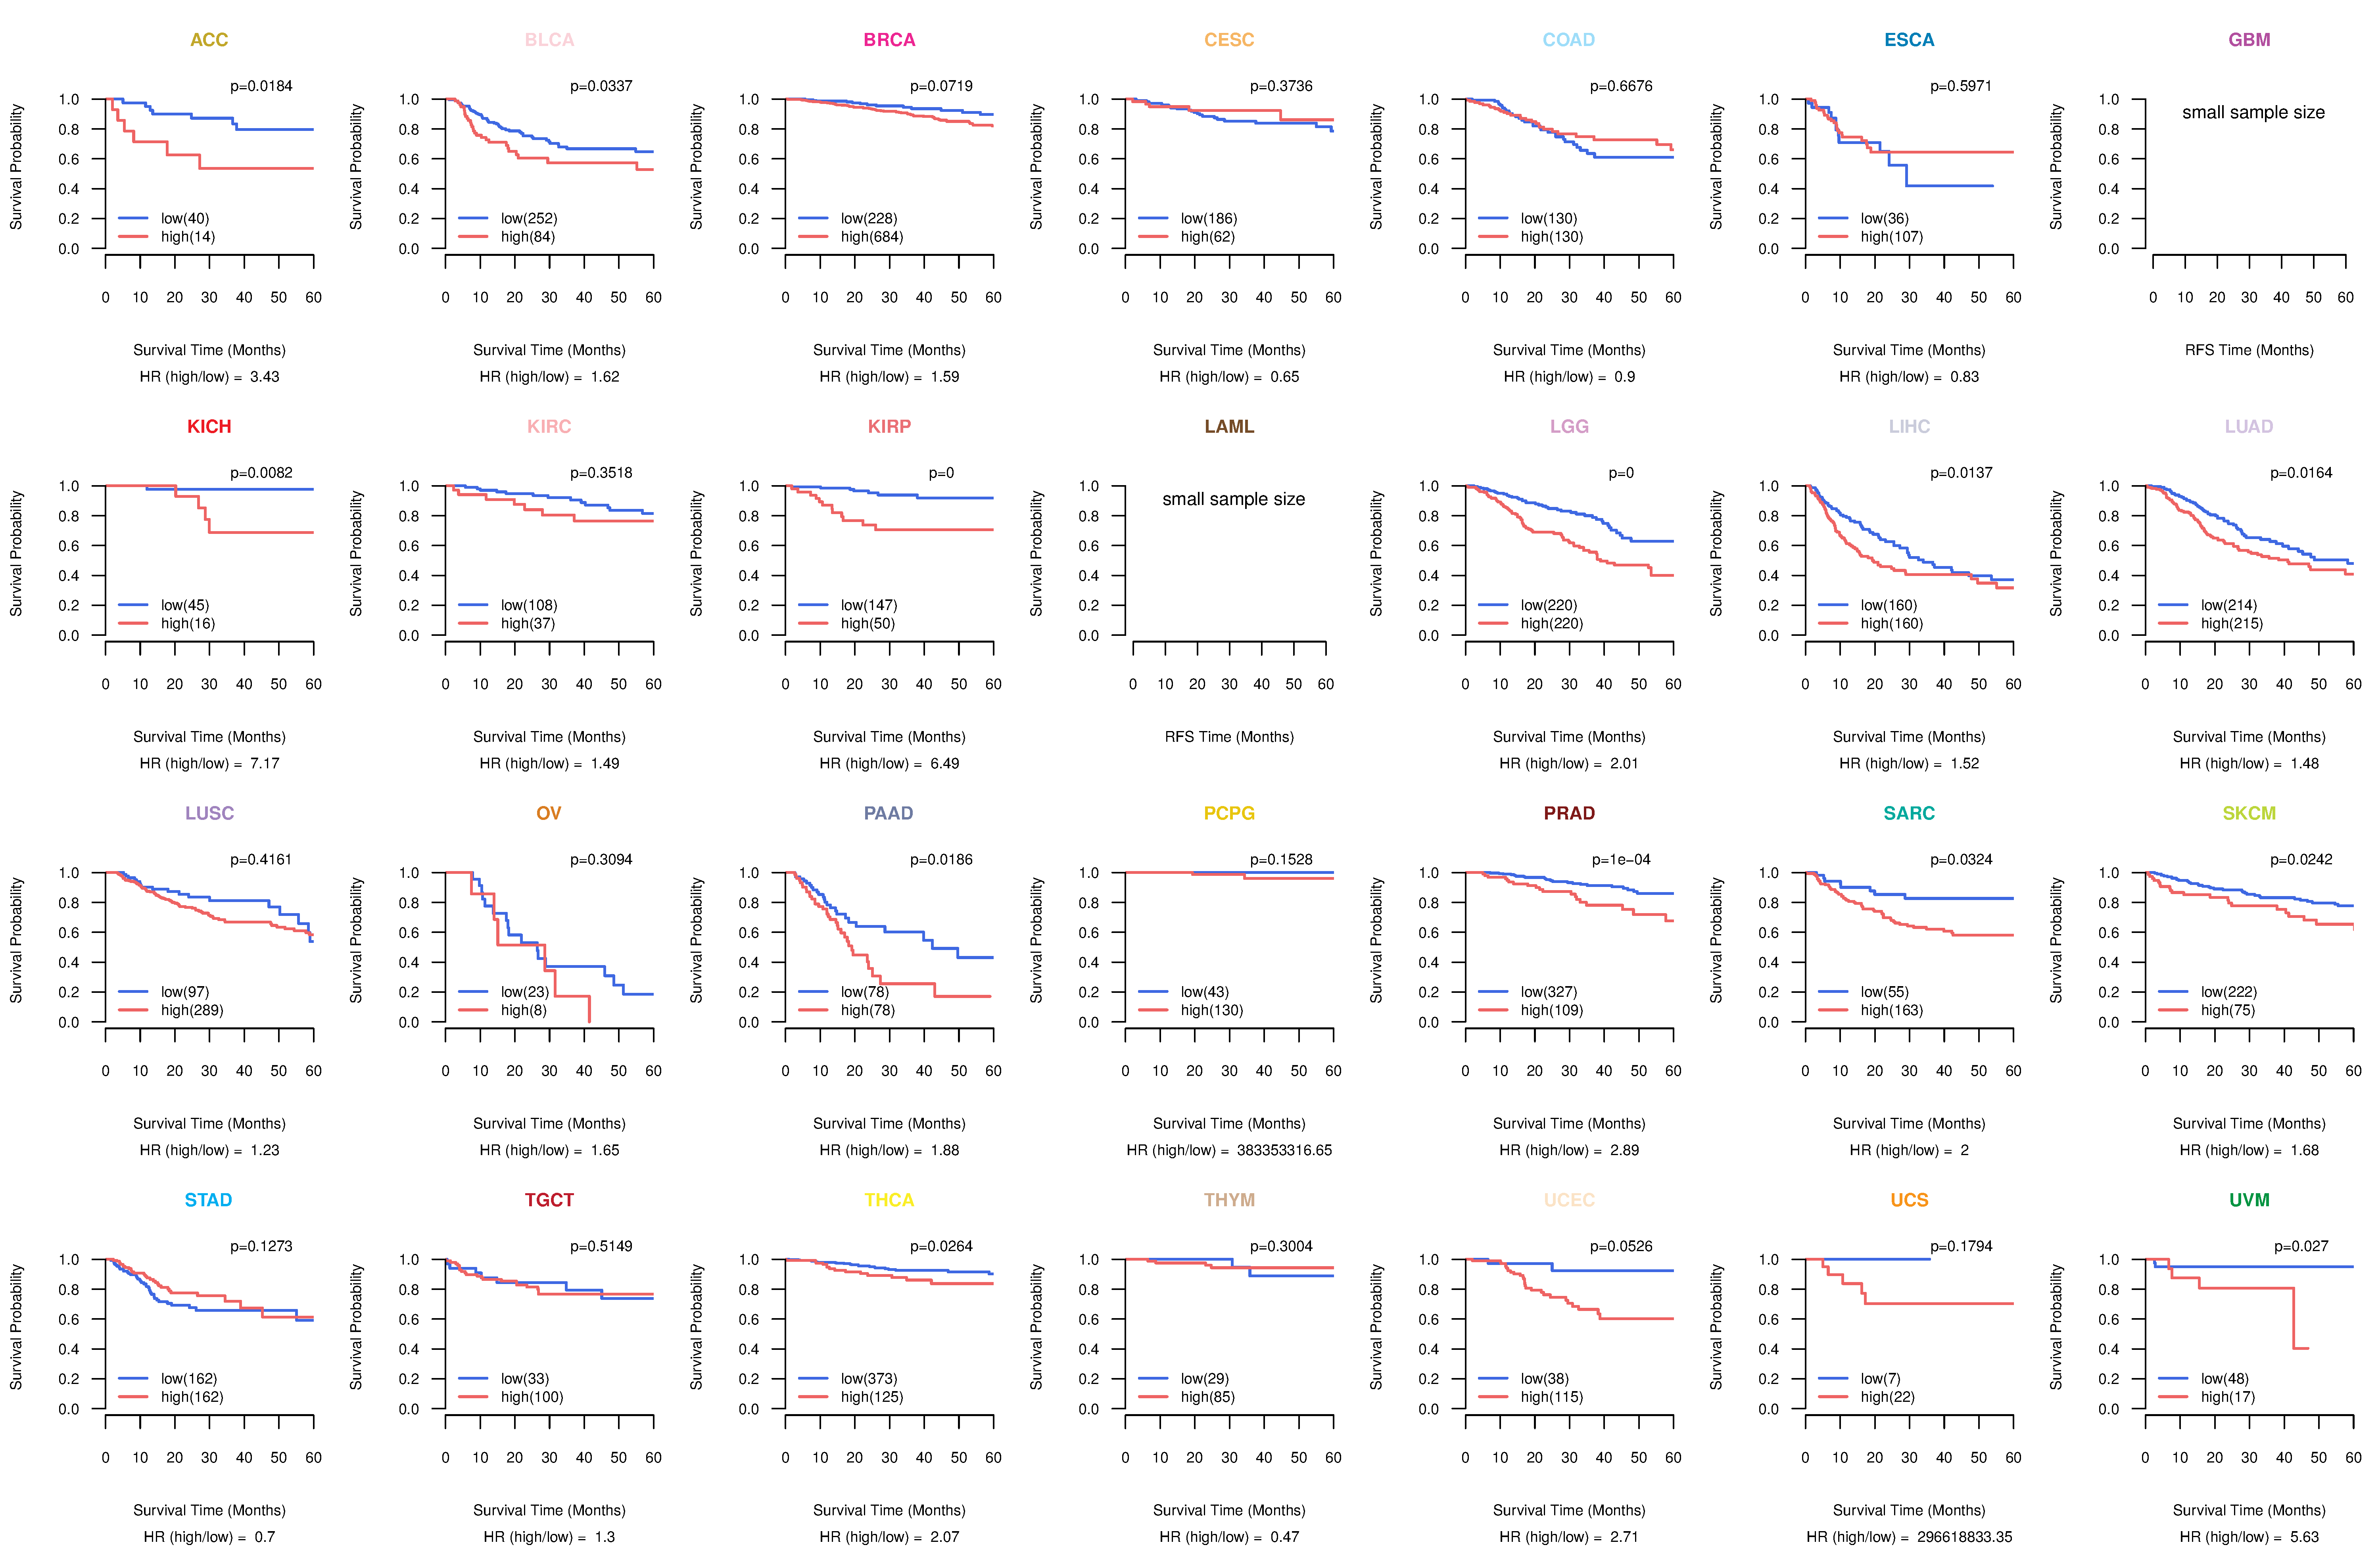
| TissGeneProg for SHCBP1 |
| Kaplan-Meier plots with logrank tests of overall survival (OS) using 28 cancer types (TCGA IlluminaHiSeq_RNASeqV2, pan-cancer normalized log2(norm_counts+1) data, version 2016-08-16) (TCGA clinicalMatrix, phenotype data, version 2016-04-27) * Click on the image to enlarge it in a new window. |
 |
| Kaplan-Meier plots with logrank test of relapse free survival (RFS) using 28 cancer types (TCGA IlluminaHiSeq_RNASeqV2, pan-cancer normalized log2(norm_counts+1) data, version 2016-08-16) (TCGA clinicalMatrix, phenotype data, version 2016-04-27) * Click on the image enlarge it in a new window. |
 |
| Forest plot of Cox proportional hazard ratio (HR) and 95% CI of overall survival (OS) using 28 cancer types (TCGA IlluminaHiSeq_RNASeqV2, pan-cancer normalized log2(norm_counts+1) data, version 2016-08-16) (TCGA clinicalMatrix, phenotype data, version 2016-04-27) * Click on the image enlarge it in a new window. |
 |
| Forest plot of Cox proportional hazard ratio (HR) and 95% CI of relapse free survival (RFS) using 28 cancer types (TCGA IlluminaHiSeq_RNASeqV2, pan-cancer normalized log2(norm_counts+1) data, version 2016-08-16) (TCGA clinicalMatrix, phenotype data, version 2016-04-27) * Click on the image enlarge it in a new window. |
 |
| Top |
| TissGeneClin for SHCBP1 |
| TissGeneDrug for SHCBP1 |
| Drug information targeting TissGene (DrugBank Version 5.0.6, 2017-04-01) |
| DrugBank ID | Drug name | Drug activity | Drug type | Drug status |
| Top |
| TissGeneDisease for SHCBP1 |
| Disease information associated with TissGene (DisGeNet, 2016-06-01) |
| Disease ID | Disease name | # pubmeds | Source |
| umls:C0014740 | Erythema Chronicum Migrans | 1 | BeFree |
| umls:C0017677 | Glossitis, Benign Migratory | 1 | BeFree |
| umls:C0018916 | Hemangioma | 1 | BeFree |
| umls:C0024221 | Lymphangioma | 1 | BeFree |
| umls:C0025202 | melanoma | 1 | BeFree |
| umls:C0038013 | Ankylosing spondylitis | 1 | BeFree |
| umls:C0178874 | Tumor Progression | 1 | BeFree |
| umls:C0282607 | Vascular Neoplasms | 1 | BeFree |
| umls:C0596263 | Carcinogenesis | 1 | BeFree |
| umls:C0751435 | Hyperphenylalaninaemia | 1 | BeFree |
| umls:C1134719 | Invasive Ductal Breast Carcinoma | 1 | BeFree |
| umls:C1261473 | Sarcoma | 1 | BeFree |
| umls:C1384514 | Conn Syndrome | 1 | BeFree |
|
Copyright 2016-Present - The University of Texas Health Science Center at Houston (UTHealth) Web File Viewing | How to Report, Fraud, Waste and Abuse | State of Texas | Statewide Search | Texas Homeland Security | Site Policies |